Excavation with old facades preservation Critical analysis of the Jasmin Noir building Freke De Roeck Thesis to obtain the Master of Science Degree in Civil Engineering Technology Supervisor: Prof. Alexandre da Luz Pinto Examination Committee: Chairperson: Profª Maria Rafaela Pinheiro Cardoso Supervisor: Prof. Alexandre da Luz Pinto Member of Committee: Prof. Peter John Bourne-Webb June 2018
Transcript
Excavation with old facades preservation
Critical analysis of the Jasmin Noir building
Freke De Roeck
Thesis to obtain the Master of Science Degree in
Civil Engineering Technology
Supervisor: Prof. Alexandre da Luz Pinto
Examination Committee:
Chairperson: Profª Maria Rafaela Pinheiro Cardoso
Supervisor: Prof. Alexandre da Luz Pinto
Member of Committee: Prof. Peter John Bourne-Webb
June 2018
Declaration
I declare that this document is an original work of my own authorship and that it fulfills all the
requirements of the Code of Conduct and Good Practices of the Universidade de Lisboa.
Acknowledgement
First, I would like to thank my supervisor Prof. Alexandre Pinto for his continuous support and
enthusiasm in all stages of this research. His guidance, observation and availability to discuss all details
of this work are highly appreciated and, undoubtedly, made this milestone in my academic journey much
easier and enjoyable! In addition, I would like to thank the mobility coordinators of civil engineering at
Técnico, Prof. Ana Paula Pinto and Ms. Cristina Ventura, as well as the Mobility Coordinator in Belgium,
Prof. Anthony Tetaert, for their assistance during this Erasmus experience that greatly contributed for
the present research.
The permission conceded by Attitude for the access to the site and particularly the authorisation for
performing the survey conducted at the ‘Jasmin Noir’ building site is kindly acknowledged. This work
was only possible with the collaboration of Mrs. Margarida Cardoso, the sweetest site manager who
always welcomed me to the site with a big smile, provided me of all the possible information needed
and answered all my questions. Additionally, I want to thank Mrs. Fartaria, Geotechnical Engineer at
JETsj Geotecnia, for helping me out with modelling in PLAXIS 2D.
Finally, I want to thank my Swedish Erasmus friend Linnea for being the motivation to wake up and
join her to the library of the civil engineering building at Técnico, without which this endeavour would
never be accomplished.
Thanks for all the encouragement.
Abstract
The increasing occupation of the urban underground space has consequences for existing buildings,
which often are not properly assessed when projects involving excavations and peripheral walls are
carried out. Thus, it is necessary to make studies and analysis addressing this issue, in order to provide
a scientific basis for the essentially empirical construction methods, which depend heavily on the
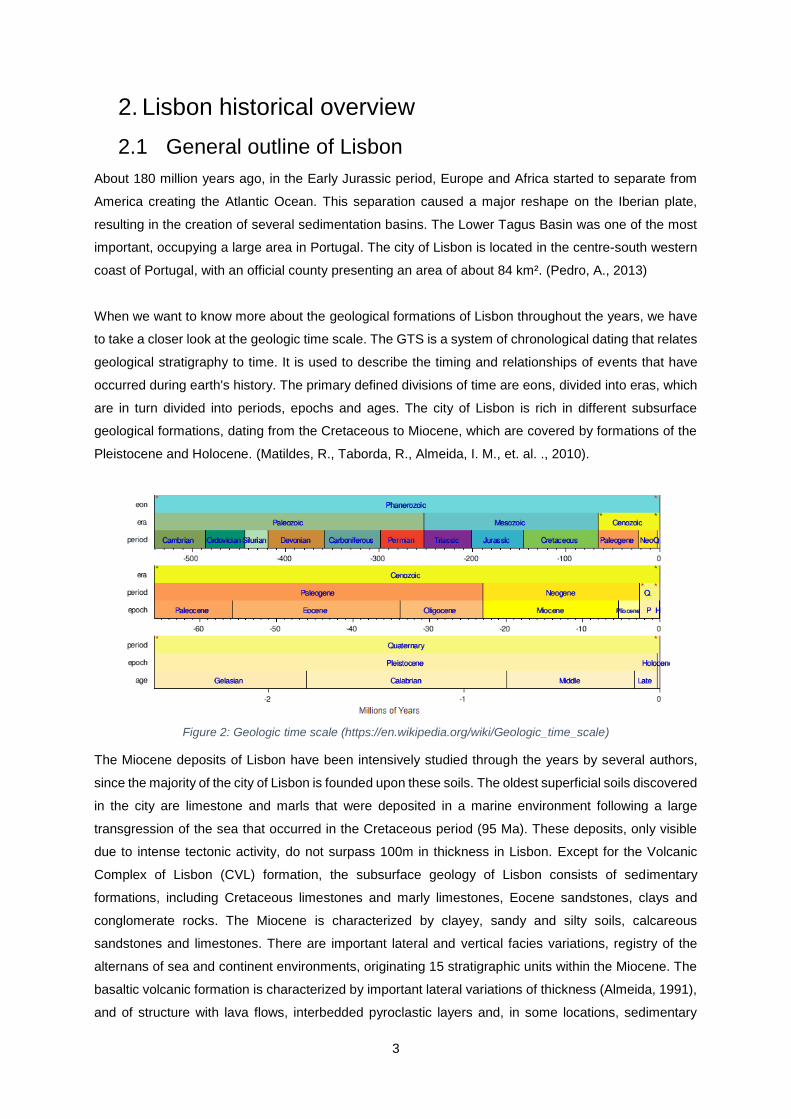
geological and geotechnical conditions. Chapter two of this thesis gives a general historical overview of
Lisbon and its rebuilding actions after the Great Lisbon earthquake. In chapter three a few main earth
retaining systems are outlined, such as temporary and permanent King Post walls and the use of ground
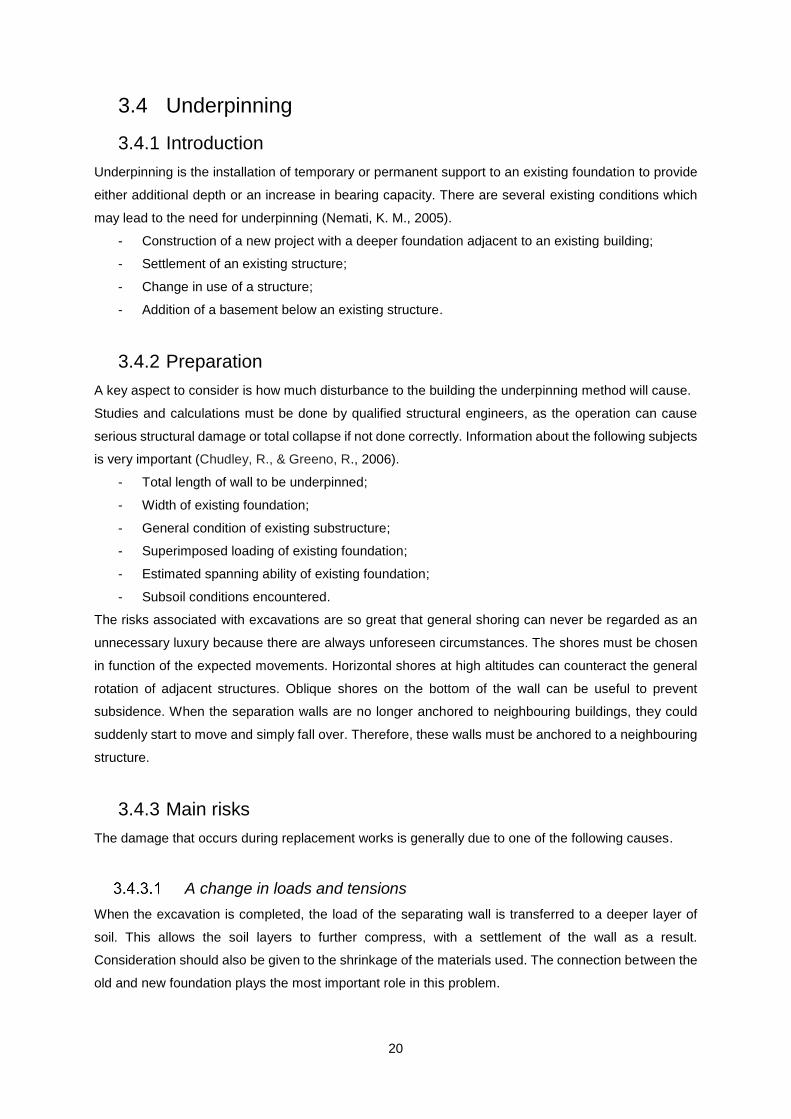
anchors. Also a brief description of micropiling and jet grouting underpinning techniques is presented.
This thesis is centred on a construction work called the ‘Jasmin Noir’ building, located at the Príncipe
Real square in Lisbon. An underground car parking was performed using Munich type walls. More
detailed information about this case study can be found in chapter four of this work. An analysis of the
displacements was made through the finite element program PLAXIS 2D in chapter five.
Finally, two alternative solutions have been studied in chapter six to examine if the solution performed
was possible to become optimized. In order to compare their viability a technical and economic study
was made.
KEYWORDS: Great Lisbon earthquake; Earth retaining systems; Underpinning; Munich type
walls; PLAXIS 2D; Alternative solutions.
Resumo
A crescente ocupação do espaço subterrâneo em zonas urbanas tem tido consequências no edificado
existente, em particular quando as obras subterrâneas, como as escavações para a construção de
pisos enterrados, são executadas junto ao mesmo edificado. Este cenário, determina a importância dos
trabalhos de escavação serem desenvolvidos através de projetos, baseados numa correta avaliação
de todos os condicionamentos, em particular os de natureza geológica e geotécnica. Capítulo um da
presente Tese é abordada a reconstrução da cidade de Lisboa após o terramoto de 1755. Capítulo tres
são descritas algumas das principais soluções de contenção periférica, tais com as soluções de
contenção provisória tipo Berlim e definitiva tipo Munique, assim como a utilização de ancoragens
seladas no terreno. É igualmente efetuada referência às técnicas de recalçamento com recurso a
microestacas e a colunas de jet grouting.
A Tese é baseada no caso de obra de demolição, com contenção de fachadas, escavação e contenção
periférica do edifício “Jasmin Noir”, localizado na Praça do Príncipe Real, em Lisboa, descrito nos quarto
e quinto capítulos do trabalho. Os trabalhos de escavação, para a construção dos pisos enterrados
para fins de estacionamento automóvel, foram realizados ao abrigo de uma contenção periférica tipo
Munique. A estimativa das deformações da parede de contenção foram obtidas através de uma
modelação numérica através do software PLAXIS 2D, apresentada no quinto capítulo. No sexto capítulo
são descritas duas possíveis soluções construtivas alternativas, incluindo as consequências das
mesmas na modelação através do software PLAXIS 2D. Por último, no sétimo capítulo é efetuada uma
análise comparativa, técnica e económica, das soluções estudadas.
PALAVRAS CHAVE: Terramoto de 1755; Soluções de contenção periférica; Técnicas de
recalçamento; Contenção definitiva tipo Munique; PLAXIS 2D; Análise comparative.
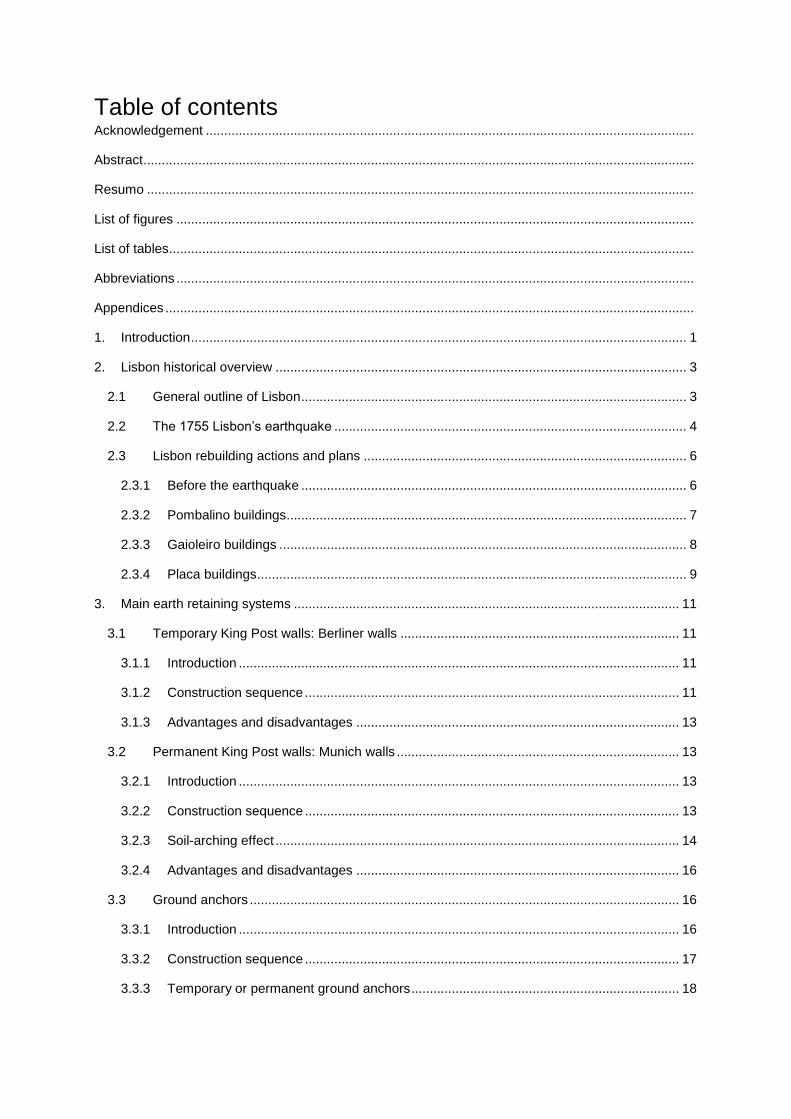
Table of contents Acknowledgement .....................................................................................................................................
List of figures .............................................................................................................................................
List of tables...............................................................................................................................................
Three typologies of masonry buildings are usually recognized in the Lisbon County: Pombalino buildings
built after the 1755 earthquake, Gaioleiro buildings built between 1870 and 1930 and Placa buildings, a
short-term structural solution which precedes the reinforced concrete buildings. The date of construction
might be an indicator of their seismic resistance. For instance, the first anti-seismic construction in
Portugal appeared with the Pombalino buildings built after the 1755 earthquake and systematically
imposed during the whole reconstruction program. During the nineteenth century, these construction
methods were gradually abandoned resulting on the design of buildings with inferior constructive quality,
known as Gaioleiro buildings. The introduction of reinforced concrete solutions (ring beams and
columns) between the 1930-1950 decades represented, in most cases, an improvement to the
resistance of the buildings. (Simões, A., Lopes, M., Bento, R., & Gago, A., 2012)
2.3.1 Before the earthquake
The buildings that remain after the 1755 Earthquake belong to a very heterogeneous group. Actually, it
is not possible to define a specific typology of buildings, as they emerged from several centuries of
history without a proper urban planning. The fast-growing population in that time brought with it the need
of building more and more houses, as well as the necessity to create all the infrastructures required in
a city. Thus, and as the city rapidly increased, a typical Muslim city (heritage left by the occupation of
Muslim forces during the Middle Ages and Renaissance) was being raised in a chaotic and poorly
organized environment. (Mascarenhas, 2005; Oliveira, V., & Pinho, P., 2010) The buildings were
constructed in the insecurity of alluvial soils additionally to a complete disregard or any attention for
circulation, sanitation and safety against natural phenomena (like earthquakes) or others. The
constructed buildings, until 1755, had many flaws, mostly of them structural, that represented an
imminent risk for the population in case of catastrophe. First of all, the balconies protruding the facade
with poorly connections to the structure as well as the chimneys in the roof tops, signify a great risk in
case they will detach from the main structure and fall apart in the streets striking any person escaping.
Other example was the construction of buildings on top of arcades. This solution was intended to give
a wider and spacious area for the improvement of all commercial trades. However, if it was a good
solution for the trade, it was not the best solution for this kind of buildings, considering that an open
space at the ground floor would collapse more easily than a standard floor with walls. Additionally, the
use of unprotected timber represented a key-factor to an easy fire propagation throughout the city, a
catastrophe that should be prevented at any cost. Furthermore, the flooded soils where the city was
being constructed, represented a major threat to all citizens. The flat and low altitude of Lisbon’s
downtown terrains (taking the level of sea waters as a reference) facilitate the sea entrance in the city
and possibly, its destruction in case of a tsunami occurrence. To sum up, several weaknesses could be
pointed out to the Lisbon layout and their constructions before the year of 1755. (Nunes, R. D. D. S. F.,
2017)
7
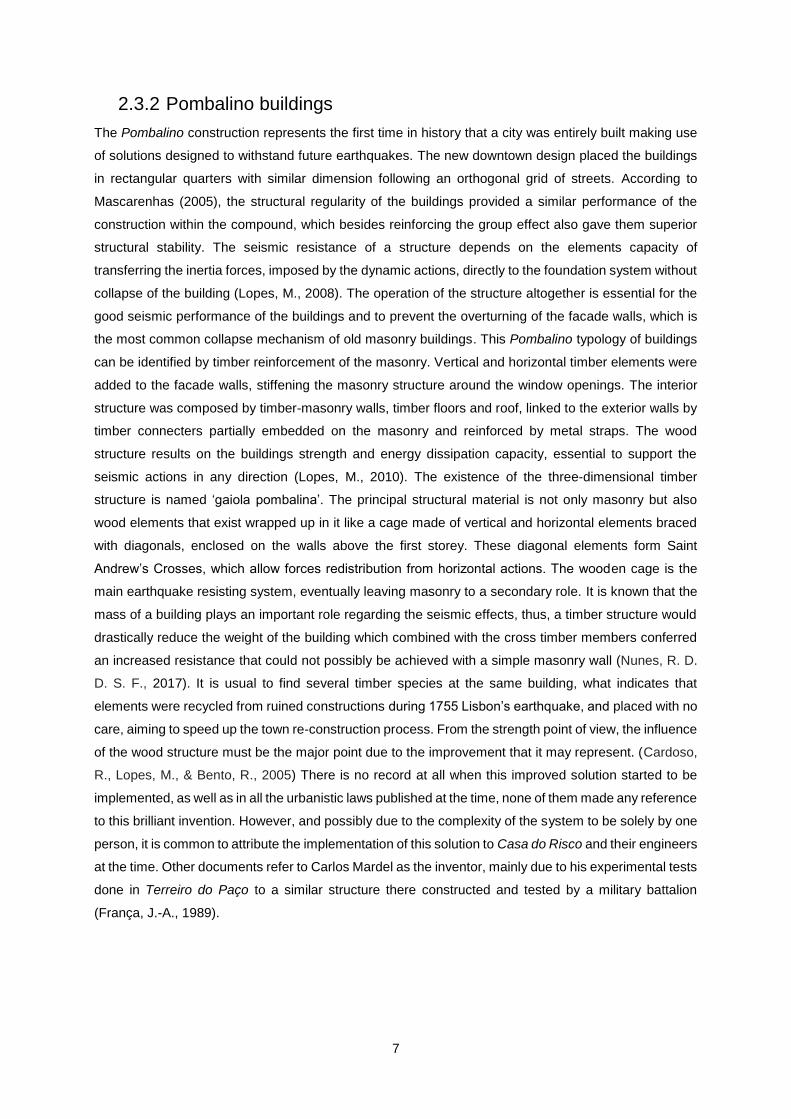
2.3.2 Pombalino buildings
The Pombalino construction represents the first time in history that a city was entirely built making use
of solutions designed to withstand future earthquakes. The new downtown design placed the buildings
in rectangular quarters with similar dimension following an orthogonal grid of streets. According to
Mascarenhas (2005), the structural regularity of the buildings provided a similar performance of the
construction within the compound, which besides reinforcing the group effect also gave them superior
structural stability. The seismic resistance of a structure depends on the elements capacity of
transferring the inertia forces, imposed by the dynamic actions, directly to the foundation system without
collapse of the building (Lopes, M., 2008). The operation of the structure altogether is essential for the
good seismic performance of the buildings and to prevent the overturning of the facade walls, which is
the most common collapse mechanism of old masonry buildings. This Pombalino typology of buildings
can be identified by timber reinforcement of the masonry. Vertical and horizontal timber elements were
added to the facade walls, stiffening the masonry structure around the window openings. The interior
structure was composed by timber-masonry walls, timber floors and roof, linked to the exterior walls by
timber connecters partially embedded on the masonry and reinforced by metal straps. The wood
structure results on the buildings strength and energy dissipation capacity, essential to support the
seismic actions in any direction (Lopes, M., 2010). The existence of the three-dimensional timber
structure is named ‘gaiola pombalina’. The principal structural material is not only masonry but also
wood elements that exist wrapped up in it like a cage made of vertical and horizontal elements braced
with diagonals, enclosed on the walls above the first storey. These diagonal elements form Saint
Andrew’s Crosses, which allow forces redistribution from horizontal actions. The wooden cage is the
main earthquake resisting system, eventually leaving masonry to a secondary role. It is known that the
mass of a building plays an important role regarding the seismic effects, thus, a timber structure would
drastically reduce the weight of the building which combined with the cross timber members conferred
an increased resistance that could not possibly be achieved with a simple masonry wall (Nunes, R. D.
D. S. F., 2017). It is usual to find several timber species at the same building, what indicates that
elements were recycled from ruined constructions during 1755 Lisbon’s earthquake, and placed with no
care, aiming to speed up the town re-construction process. From the strength point of view, the influence
of the wood structure must be the major point due to the improvement that it may represent. (Cardoso,
R., Lopes, M., & Bento, R., 2005) There is no record at all when this improved solution started to be
implemented, as well as in all the urbanistic laws published at the time, none of them made any reference
to this brilliant invention. However, and possibly due to the complexity of the system to be solely by one
person, it is common to attribute the implementation of this solution to Casa do Risco and their engineers
at the time. Other documents refer to Carlos Mardel as the inventor, mainly due to his experimental tests
done in Terreiro do Paço to a similar structure there constructed and tested by a military battalion
(França, J.-A., 1989).
8
Figure 5: Pombalino structure (Cardoso, R., Lopes, M., & Bento, R., 2005)
2.3.3 Gaioleiro buildings
During the first half of the nineteenth century there were few changes on the urban landscape as the
city continued to grow accordingly with the Pombalino reconstruction plan. In 1864, a commission was
nominated by the Ministry of Public Works to deal with a program of urban improvements and expansion
of the city to the north upland. In 1888, the engineer Ressano Garcia developed a new plan regarding
the connection between Liberdade Avenue and Campo Grande. The Gaioleiro buildings were
aggregated in quarters with interior yards and surrounded by a grid of secondary streets, wider than the
streets of the Pombalino downtown. There were no standards for buildings height or depth, neither for
the architectural design of the facade walls. The construction was carried out by private entities, and
therefore the quality of the buildings is very variable. This typology of buildings is related with the
buildings built to be sold or to be rented by flats aiming to sustain the development of the city and the
housing needs of an increasing population (Frazão, T., 2013)
Figure 6: Gaiola pombalina wall (Cardoso, R., Lopes, M., & Bento, R., 2005)
9
Figure 7: Gaioleiro structure Cardoso, R., Lopes, M., & Bento, R., 2005)
During the nineteenth century, the cage structure characteristic of the Pombalino buildings was
progressively simplified. The diagonal elements started to be removed, conditioning the bracing of the
timber structure and the rubble infill was then replaced by brick masonry, solid on the lower floors and
hollow on the upper, or by ‘tabique’ walls, originally used on Pombalino buildings as partition walls. A
tabique building component as a wall is formed of a timber structure made up of vertical boards or studs
connected by laths trough metal nails. This structure in then coated with an earth based material
(Cardoso, R., Pinto, J., Paiva, A., & Lanzinha, J. C., 2015).
2.3.4 Placa buildings
In 1938, a new urbanization plan was commissioned by engineer Duarte Pacheco. The first buildings
were built with exterior masonry walls and timber floors strengthened by peripheral concrete beams.
The buildings from these new neighbourhoods have a characteristic shape in plan known as ‘Rabo de
Bacalhau’ originated by the expansion of the lateral light-shafts characteristic of the Gaioleiro buildings
into the back yard of the quarter. The concrete slabs were extended to the whole floor, supporting the
name ‘Placa’ (meaning concrete slab) given to this typology of buildings (Simões, A., Lopes, M., Bento,
R., & Gago, A., 2012).
10
11
3. Main earth retaining systems
3.1 Temporary King Post walls: Berliner walls
3.1.1 Introduction
Urban construction often involves the execution of underground floors. Due to often existing surrounding
construction, vertical excavations have to be executed, supported by a retaining wall. In such context,
Berlin-type walls are one of the most suitable techniques to the execution of retaining walls. This
technique takes advantage of the construction phasing in order to minimize walls and back soil
displacements. (Rodrigues, J. N. S. S., 2011) The Berliner wall is a temporary earth retention system
with two basic components. One component, carrying the full earth pressure load and moment
resistance, is the vertical so-called soldier pile. These are most of the time steel beams, I or H section
profiles. The piles support the lagging wall or horizontal sheeting that spans the distance between the
vertical elements. Lagging can be made of wood, steel sections or (reinforced) precast concrete.
3.1.2 Construction sequence
Figure 8: Berliner walls construction sequence (http://www.ffgb.be/Business-Units/Retaining-Walls---Utilities/Berlijnse-wand-en-paroi-parisienne.aspx?lang=en-US)
First of all the steel sections are positioned verticality and can be driven, vibrated or drilled into the
ground. Steel sections are in most cases H type, so the flanges of the profiles have to be placed parallel
to the longitudinal axis of the planned excavation (Brito, 2001). Alternatively, a continuous flight auger,
large diameter or minipiling rig is used to create a bore hole which is filled with concrete to form a base
for a H pile. The profiles must be placed at least one meter below the maximum excavation level to
transfer the soil pressure from the lagging to the piles. The beams should be placed at regular spacing,
the distance depends on the strength of the used laggings. When these soldiers are in place, excavation
proceeds in stages while installing the lagging. The excavation can be one to a few meters deep,
12
depending on the stand-up time of the soil. This process is repeated level after level until the desired
depth is achieved (Rodrigues, J. N. S. S., 2011). In general, the width of the panels is a little bit shorter
than the distance between two consecutive steel sections, so they can slide between the steel piles and
be clamped between the flanges and the ground with the aid of wedges.
Figure 9: Wedges (Wylaers M., 2016, Bouwtechniek 1 – Berlin walls)
Another method is the use of a hook, attached to the outer flange of the piles. The hook is placed
between the horizontal sheeting and a U-shaped iron is then placed over the hook to cover at least 3/4
of the width of the planks. The system then gets clamped by a steel wedge which fits through the opening
of the hook. The joint between 2 series can be executed as shown in Figure 11.
Figure 10: U-shaped iron and hook (Wylaers M., 2016, Bouwtechniek 1 – Berlin walls)
Figure 11: Joint between lagging (Wylaers M., 2016, Bouwtechniek 1 – Berlin walls)
Optionally, the Berliner wall can be stamped or anchored with ground anchors, immediately installed on
the soldiers previously built.
13
3.1.3 Advantages and disadvantages
The main advantage of Berliner walls is their versatility. Adjustments can be made in the field easily to
accommodate changes. The other major advantages of soldier pile walls are:
✓ Soldier piles are fast to construct;
✓ Berliner-type walls are cheaper when compared to other systems;
✓ Lagging construction can be very quick;
✓ The materials are reusable;
✓ Suitable for use near cables and pipes;
✓ Construction of soldier pile and lagging walls does not require very advanced construction
techniques.
The major disadvantages of Berliner walls are:
- They are primarily limited to temporary construction;
- Cannot be used in high water table conditions without extensive dewatering;
- Poor backfilling and associated ground losses can result in significant surface settlements;
- They are not as stiff as other retaining systems;
- Because only the flange of a soldier pile is embedded beneath subgrade, it is very difficult to
control basal soil movements.
3.2 Permanent King Post walls: Munich walls
3.2.1 Introduction
When King Post walls are structures which consist of metal profiles with between them, profiles of wood
or precast concrete panels (Patrício, A., & Teixeira, R., 2006), these types of retaining walls are
temporary and they are called Berliner walls. Although, when the execution of the walls is a permanent
solution that uses reinforced concrete poured in site, supported by micropiles staled at the ground
vertically, this technique is called Munich walls. These walls can be used as the final wall of an
underground floor. The name of these techniques has already led to some controversy, because they
are similar but definitely not the same. Depending on the height of the containment structure, the function
to which it is intended or the type of soil to retain, it may be necessary to perform one or more levels of
ground anchors (Martinho, F. C., 2013). The use of Munich-type walls is a solution widely used
nowadays in buildings where is expected to maintain its facade, since it presents several advantages
over other solutions (Cravinho, A., Brito, J., Branco, F., Vaz Paulo, P., & Correia, J. , n.d.).
3.2.2 Construction sequence
For the execution of Munich-type walls, first a general excavation has to be executed, just up to the
bottom of the crown beam. This should be as low as possible, dependent on the conditions of the project.
Then, the micropiles can be installed vertically and the crown beam can be made. The crown beam
14
makes sure that the remaining loads of the building can be transferred to the micropiles. Therefore, the
crown beam connects the micropiles to the remaining structure of the building.
Figure 12: Micropiles and crown beam (Pinto A., 2010, Retaining walls and structures. Discipline of Excavations and Underground Works. Instituto Superior Técnico)
Just like the execution of the Berliner wall, the execution of the Munich-type wall is done in vertical
stages. But here the use of horizontal staging is also important, because of the ‘Soil-arching effect’
discussed in 3.2.3. Horizontal stages usually have a width of 1m to 1,5m. In this alternate panel method,
primary panels shall be cast first, leaving suitable gaps in between. These gaps are excavations made
in a slope for an optimal soil-arching effect. Secondary panels shall then be cast, resulting in a
continuous Munich wall. Each stage consists of the placement of the reinforcement and formwork,
followed by pouring the concrete. The crown beam has the objective of joining all the profiles so they
can work together.
Figure 13: Munich walls construction sequence (Pinto A., 2010, Retaining walls and structures. Discipline of Excavations and Underground Works. Instituto Superior Técnico)
Afterwards, anchorages and shores are placed if required. Finally, the foundation of the Munich walls is
executed and the new structure is responsible for the stability of the facade walls.
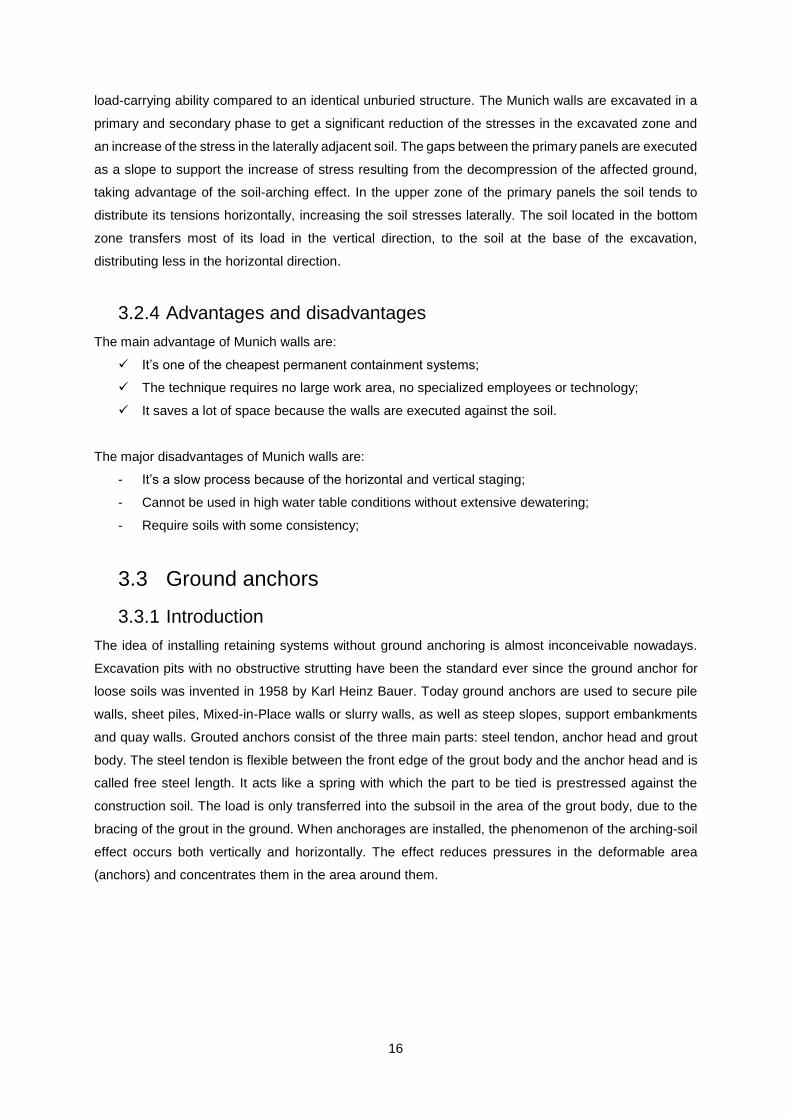
3.2.3 Soil-arching effect
It has been well recognized for a long time that one of major mechanisms for stabilizing soil is the soil-
arching effect, which is a phenomenon of transfer of stresses from a yielding mass of soil onto the
adjoining stationary part of soil. This effect occurs when there is a difference in the stiffness between
the installed structure and the surrounding soil. From studies of Vanel and Howell (1999) it is stated that
changes of soil strength as well as elasticity modules have an effect in the formation mechanism of the
arch. A simple example of arching is what occurs in a large box of soil with a panel at the base. When
15
this panel is lowered, the soil immediately above it will tend to move down with it. If the yielding part
moves downward, the shear resistance will act upward and reduce the stress at the base of the yielding
mass. On the contrary, if the yielding part moves upward, the shear resistance will act downward to
impede its movement and cause increase of stress at the support of the yielding part. However, if the
shear strength of the soil is sufficiently large, what will happen instead is that the weight of the column
of soil immediately above the moving panel will be partially transferred to the surrounding soil. Naturally,
the vertical stresses in the soil around the moving panel will increase, while those immediately above it
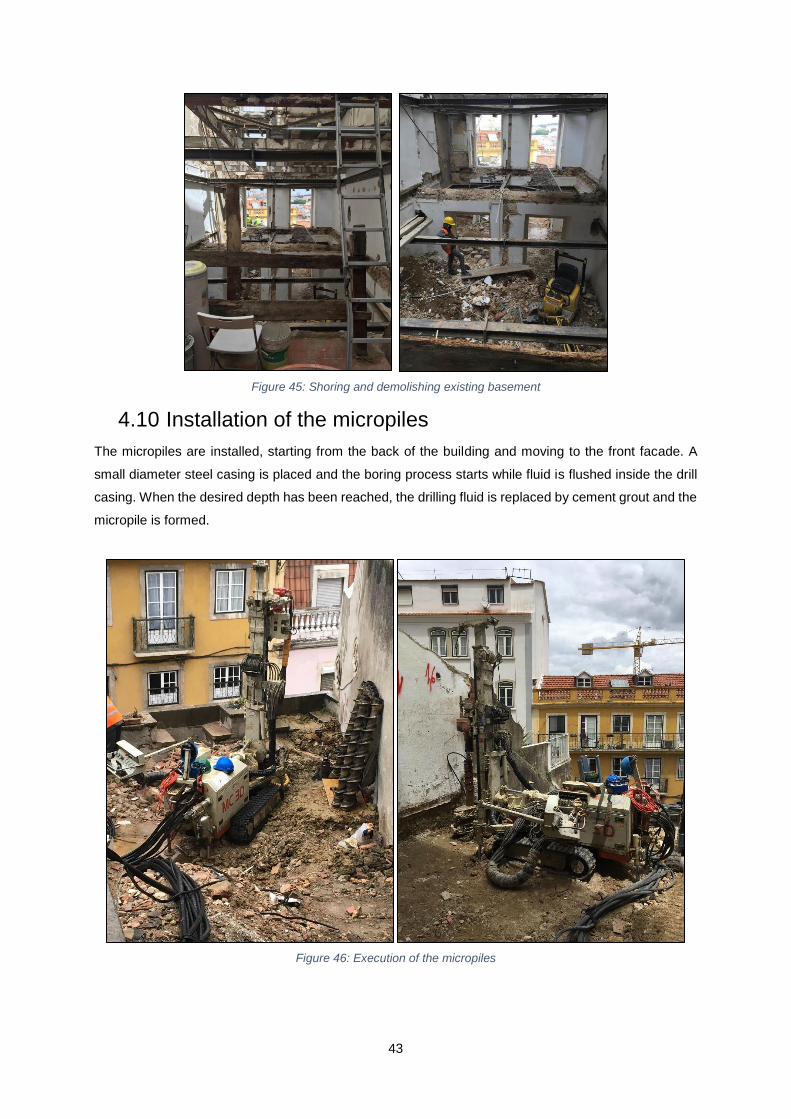
- FCM - Subcontractor that will carry out the work Engª Margarida Cardoso - Project Manager Engª Liliana Mendes - Responsible for hygiene and safety in the construction site Mr. Agostinho Martins - Foreman
Figure 26: Construction site information
28
4.3 Location
The ‘Jasmin Noir’ building is located at the attractive neighbourhood of Príncipe Real, which extends
north of Bairro Alto. It remains essentially a residential district, but it's now slowly becoming a serious
shopping area. The building is situated in front of a tranquil park, the Jardim do Príncipe Real. From
here you can see people grabbing a coffee from one of the Jardim’s two kiosks, or sitting down to lunch
at the outdoor café under two massive mangrove-type trees. Although it’s almost invisible from the
surrounding streets, you can find the enchanting botanical garden covering ten acres of subtropical
vegetation, just 100m from the site. The ‘Miradouro de São Pedro de Alcântara’ is only a five minutes’
walk, but from the balcony of the ‘Jasmin Noir’ building you can have your own viewpoint.
Figure 27: Jasmin Noir location (a) (Google maps)
Figure 28: Jasmin Noir location (b) (Google maps)
29
4.4 Urban planning
Characteristics of the urban operation:
- Total construction area: 746.85 m²
- Building volumetry: 2003,7 m³
- Implantation area: 192,54m²
- Elevation of the facade of the building: 12m
- Number of floors above threshold: 6
- Number of floors below threshold: 3
4.5 The building’s typology
The building is built after the 1755 Lisbon Earthquake, and has characteristics of both Pombalino as
Gaioleiro typologies. Gaioleiro buildings were aggregated in quarters with interior yards and are
characterised by a certain architectural freedom. This freedom can be seen in the varied window and
ashlar designs, in the decoration of facades and in the introduction of new elements such as terraces
and metal staircases at the rear of the buildings. We can see some of these elements in the Jasmin Noir
building which indicates the building was built between 1870 and 1930. As picture 31 shows, the back
facade of the building has a metallic structure of balconies, but we can’t find the common characteristic
of light shafts in the building. This could be explained by the small width of the building.
Figure 29: Metallic structure of balconies
The foundations of Gaioleiro buildings can be divided into two types: foundation footings and vaults or
arches, while Pombalino foundations are generally composed of timber piles. (Mascarenhas, J., 2005).
The Jasmin Noir building has the foundation footings in masonry, as shown in the inspection shafts in
part 4.6.3. This indicates again that the building is built following the Gaioleiro typology.
All exterior walls and some of the interior walls in Gaioleiro buildings are made of stone or brick masonry.
Usually the exterior walls are made of rubble stone masonry and the interior ones are made of brick
30
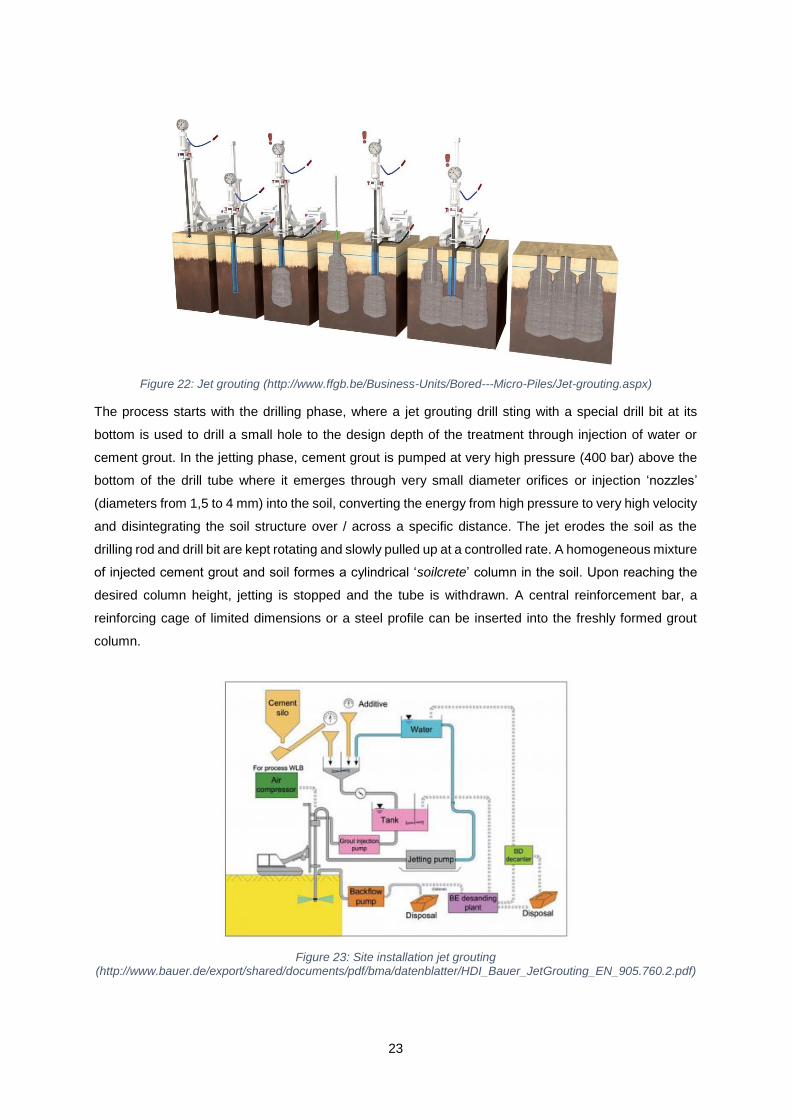
(Appleton, J. G., 2005). But in the Jasmin Noir building the interior walls are made of masonry reinforced
with an internal wooden cage. This indicates the building is a response of urban reconstruction following
the 1755 quake, based on a three-dimensional grid typically of Pombalino buildings. Horizontally, the
structure of both Pombalino as Gaioleiro buildings consists of timber flooring where the beamwork runs
perpendicular to the facades. The ceilings were finished by wooden boards covered with wooden strips
at the floor beams, or with laths covered with plaster and interesting stucco details (Simões, A., Lopes,
M., Bento, R., & Gago, A., 2012).
Figure 30: Internal wooden cage
These elements show that the Jasmin Noir building is an example of the Gaioleiro typology buildings.
However, there was no construction obligation. It was noticeable that structures with the typical
Pombalino timber reinforcements did not had significant damages after an earthquake and studies
proved that this technique was one of the best structural anti-seismic solutions in that time. Landlords
were free to apply the technique of ‘gaiola pombalina’ to their buildings.
4.6 Seismic, geological-geotechnical and hydrogeological
information
4.6.1 Seismic information
The distribution of seismic events allows the realization of zoning in the form of issosists, these are
curves that delimit around an epicentre, areas where there were identical seismic intensities during the
same earthquake. According to the chart of issossists of maximum intensity, of the Institute of
Meteorology, the building is located in an area of intensity 9.
31
Figure 31: Chart of issosists of maximum intensity (TECNASOL FGE.,2017)
The seismicity occurring in Portugal is not uniform, generally increasing from north to south. The
Eurocode 8 divided the continental territory into five types of foundation land, designated A, B, C, D and
E. For the zoning of the territory, differentiation is foreseen depending on the nature and seismic intensity
of each region. Thus, two types of seismic action were considered, due to the fact that there are two
types of earthquake which affect Portugal:
- a scenario designated as "remote" referring generally to earthquakes with an epicentre in the
Atlantic region and corresponding to Type 1 Seismic Action;
- a so-called "near" scenario, generally referring to earthquakes with an epicentre in the
Continental Territory or in the Azores Archipelago, corresponding to Type 2 Seismic Action.
Seismic zoning for Continental Portugal is established by municipalities, as shown in Figure 32.
32
Figure 32: Seismic zoning of Portugal (TECNASOL FGE.,2017)
According to European NP EN 1998-1: 2010 (Eurocode 8), the following maximum reference seismic
accelerations, agR, are considered, depending on the type of seismic action and the seismic zone of
the site under study:
- Seismic action type 1 - Seismic zone 1.3: agR = 1.5 𝑚𝑠²⁄
- Seismic action type 2 - Seismic zone 2.3: agR = 1.7 𝑚𝑠²⁄
4.6.2 Geological information
The study site is located in Praça do Príncipe Real, n ° 33, extending to n ° 15 of Calçada da Patriarcal,
in the parish of Santo António, an area where, according to the geological chart of the municipality of
Lisbon there are lithologies belonging to Areola da Estefânia (M1II) characterized by clays with silt and
silts with clay, with brown and gray tones, sometimes with carbonate intercalations. Covering part of the
study area, there are brown clays with fragments of varied nature, dispersed.
33
Figure 33: Geological chart of the municipality of Lisbon (in 1:10 000 scale) (TECNASOL FGE.,2017)
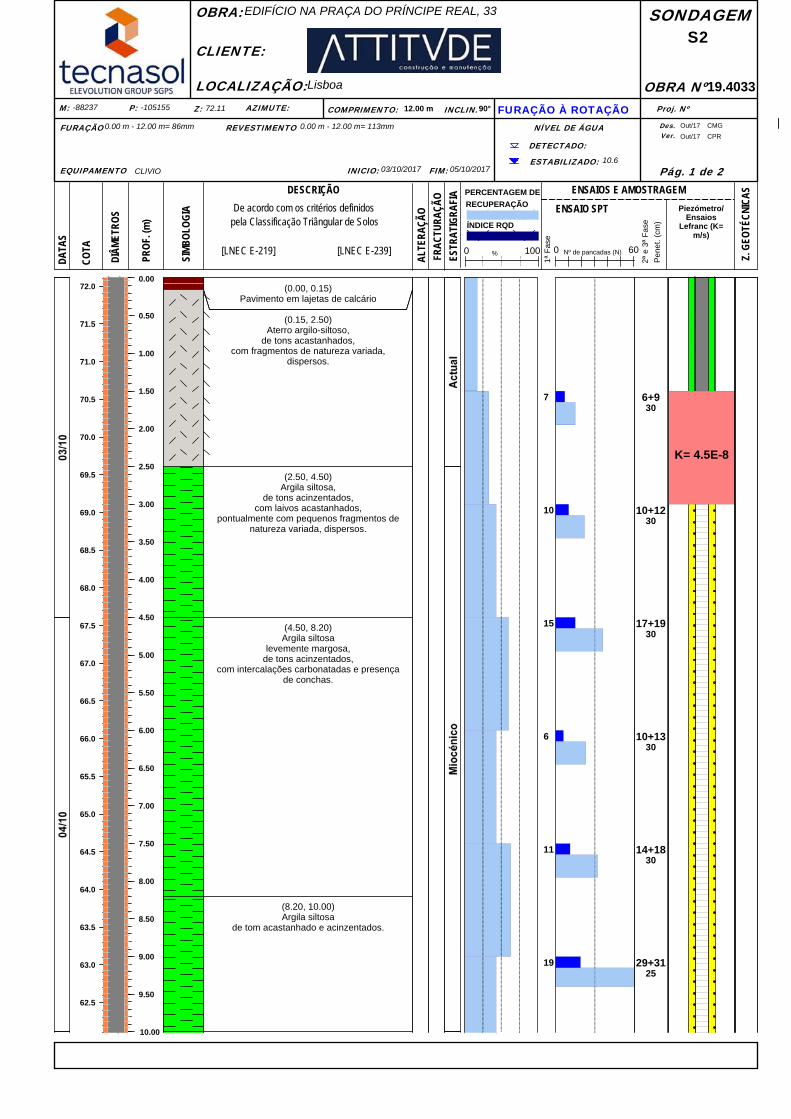
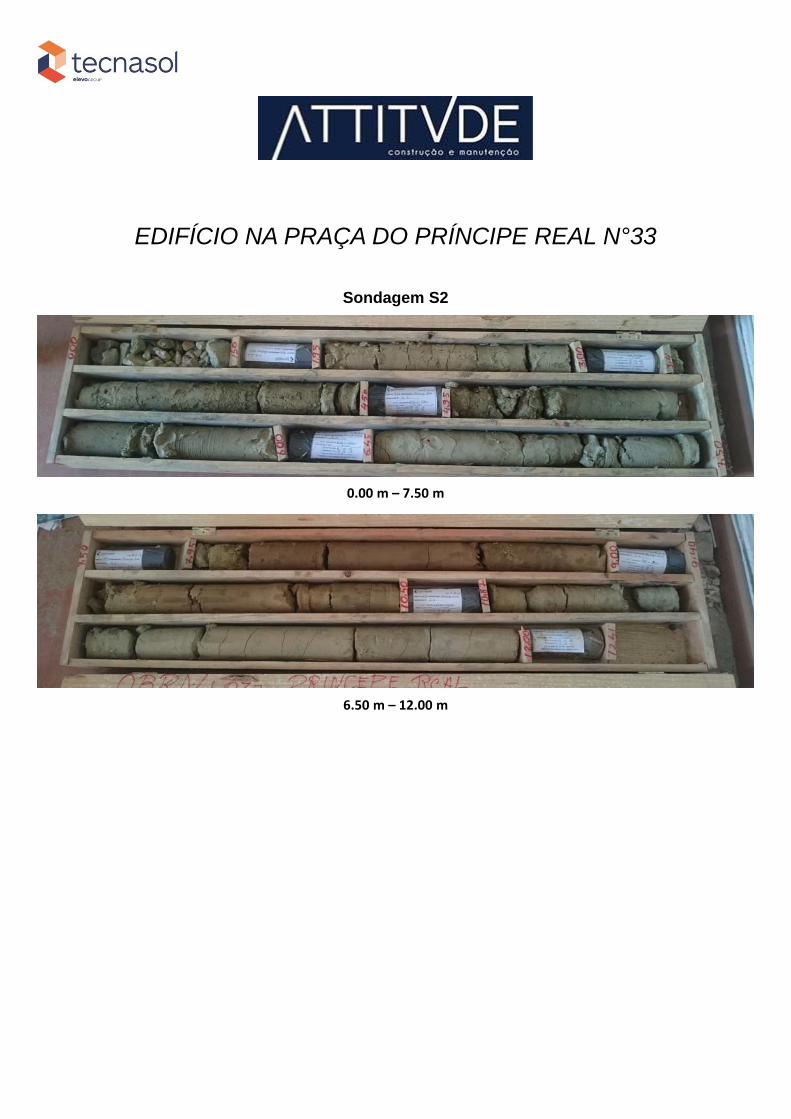
4.6.3 Geotechnical information
ATTITUDE, S.A. requested Tecnasol FGE to do geotechnical tests of the building’s area to recognize
its characteristics. They did this using two drill holes that allowed to identify the soils that occurred,
followed by dynamic SPT penetration tests (Standard Penetration Test). For the identification of the
base and geometry of the lateral wall foundations in the backyard of the building, two inspection wells
P1 and P2 were made.
Figure 34: Geological-geotechnical and hydrogeological tests location (TECNASOL FGE., 2017)
34
Test boring
As mentioned, the test boring consisted of two polling stations, S1 and S2, with depths of 15.0 m (S1)
and 12.0 m (S2), in a total of 27.0 m of drilling. The drillings were carried out using a rotary probe driven
by a hydraulic motor with continuous drilling. The drilling diameters used were 86mm, with the respective
coating tubes 113mm and 98mm and the circulating fluid used was water. The following lithostratigraphic
units were identified as indicated in Table 1. The individual survey charts are shown in the appendix
number 1.
Table 1: Identified lithostratigrapigh units
Age Formation Lithology
Recent
Floors Ceramic or limestone
Landfill Clay with silts, brown in color
with fragments of varied nature, dispersed.
Miocene Areolas da Estefânia (M1II)
Clay with silts, with brown and gray colors, sometimes with
small carbonate intercalations dispersed
Silt with clays, with brown and gray colors
Figure 35: Test boring
Table 2 shows the geotechnical parameters found from the test boring. The soil is defined in
geotechnical zones ZG1 to ZG4, visualised in appendix 2.
35
Table 2: Geotechnical parameters
Zone Description Specific weight
ᵧ (kN/m³)
Angle of internal
friction Ø (°)
Cohesion C (kPa)
Stiffness E (MPa)
ZG4 Landfills 10-14 15-20 0 2,5*
3,5**
ZG3 Clays with silt 19-21 30-33 22-50 16,5-18,7*
23-26**
ZG2 Clays with silt, sometimes with
marls 20-21 34-36 50-110
24-34*
33-48**
ZG1 Clays with silt and
silt with clay 21-22 35-40 100-150
45*
60**
* Assymetric loading
** Flat deformation
Standard Penetration Test (SPT)
The Standard Penetration test is a common in situ testing method used to determine the geotechnical
engineering properties of subsurface soils. SPT involves driving a standard thick-walled sample tube
into the ground at the bottom of a borehole by blows from a slide hammer with a mass of 63.5 kg falling
through a distance of 760 mm. The sample tube is driven 15 mm into the ground and then the number
of blows needed for the tube to penetrate each 150mm up to a depth of 450mm is recorded. The sum
of the number of blows required for the second and third 150mm of penetration is reported as SPT
blow-count value, commonly termed "standard penetration resistance" or the "N-value".
Figure 36: Standard Penetration Test
36
The N-value provides an indication of the relative density of the subsurface soil, and it is used in
empirical geotechnical correlation to estimate the approximate shear strength properties of the soils.
The NSPT values obtained are shown in Table three, which proves that the resistance increases with
depth.
Table 3: NSPT values obtained
Depth (mm) NSPT for S1 NSPT for S2
150 7 15
300 5 22
450 7 36
600 25 23
750 46 32
900 60 60
1050 60 60
1200 60 60
1350 60 -
1500 60 -
5≤NSPT≤15 22≤NSPT≤46 NSPT≥60
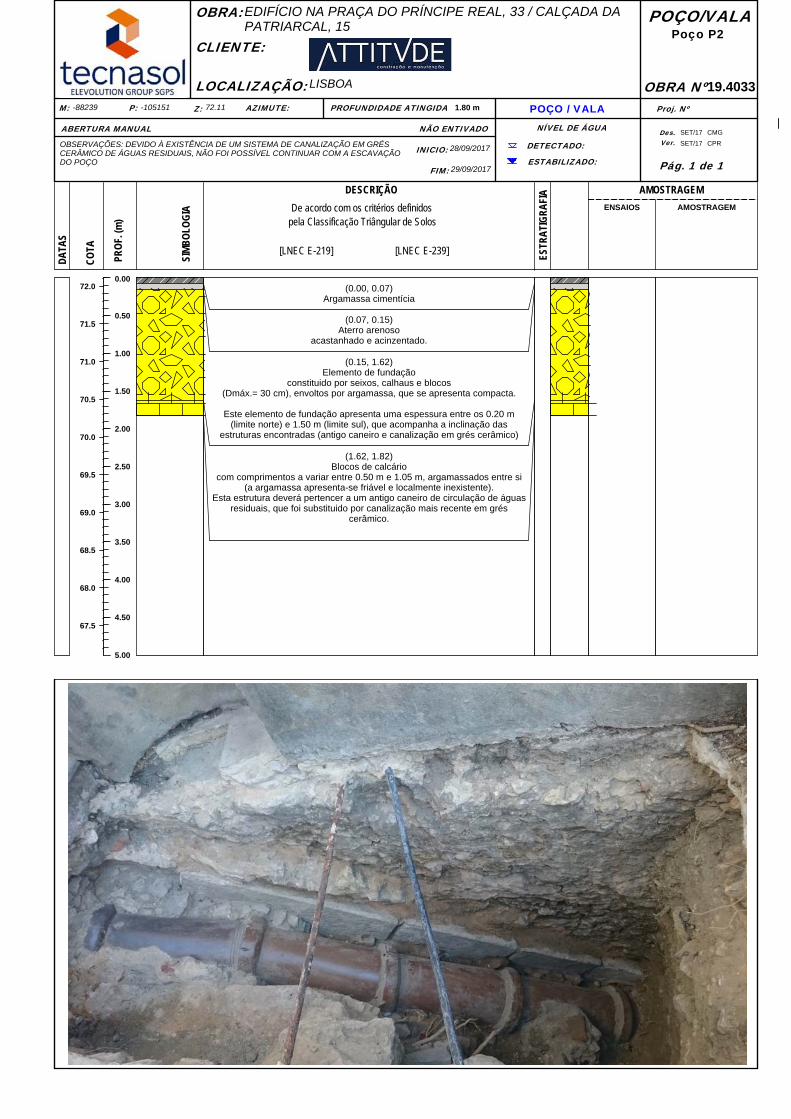
Inspection shafts
Two inspection shafts (P1 and P2) were carried out, with the objective of assessing the geometry of the
foundations of the side walls at the end of the building, Calçada da Patriarcal, n ° 33. Its location is
represented in picture 36. In inspection shaft P1, the foundation element of the wall consists of blocks
(Dmax = 40/50cm) surrounded by compact cement mortar. At a depth of 0,80m there is a foundation
beam. The excavation of the well was interrupted at 2,15m depth, without having reached the foundation
of the wall, due to safety reasons. The inspection shaft P2 also presents blocks (Dmax= 30cm)
surrounded by compact cement mortar. This foundation element rests on blocks of limestone with
lengths varying between 0,50m and 1,05m. Due to the existence of these structures and also for safety
reasons, it was not possible to continue the excavation beyond 1,82m depth. More details about the
inspection shafts can be found in appendix 3.
37
Figure 37: Inspection shafts (TECNASOL FGE.,2017)
4.6.4 Hydrogeological information
After the geotechnical tests, two piezometers were installed in the holes of the drillings and two Lefranc
type permeability test and Slug type tests were done to see the hydrogeological characterization of the
area.
Piezometers
A piezometer is a small diameter plastic pipe with a porous section at the bottom designed to measure
static pressures. The pipe is installed inside a borehole and the porous section is positioned at the depth
where the pore water pressure is to be measured. The annulus between the porous filter and the
borehole is filled with sand, the top and bottom surfaces of the sand are sealed with bentonite and the
rest of the borehole is filled with a cement/bentonite grout. The pressure of the ground water pushes
water into and up the standpipe until the level of water inside the standpipe is equivalent to the pore
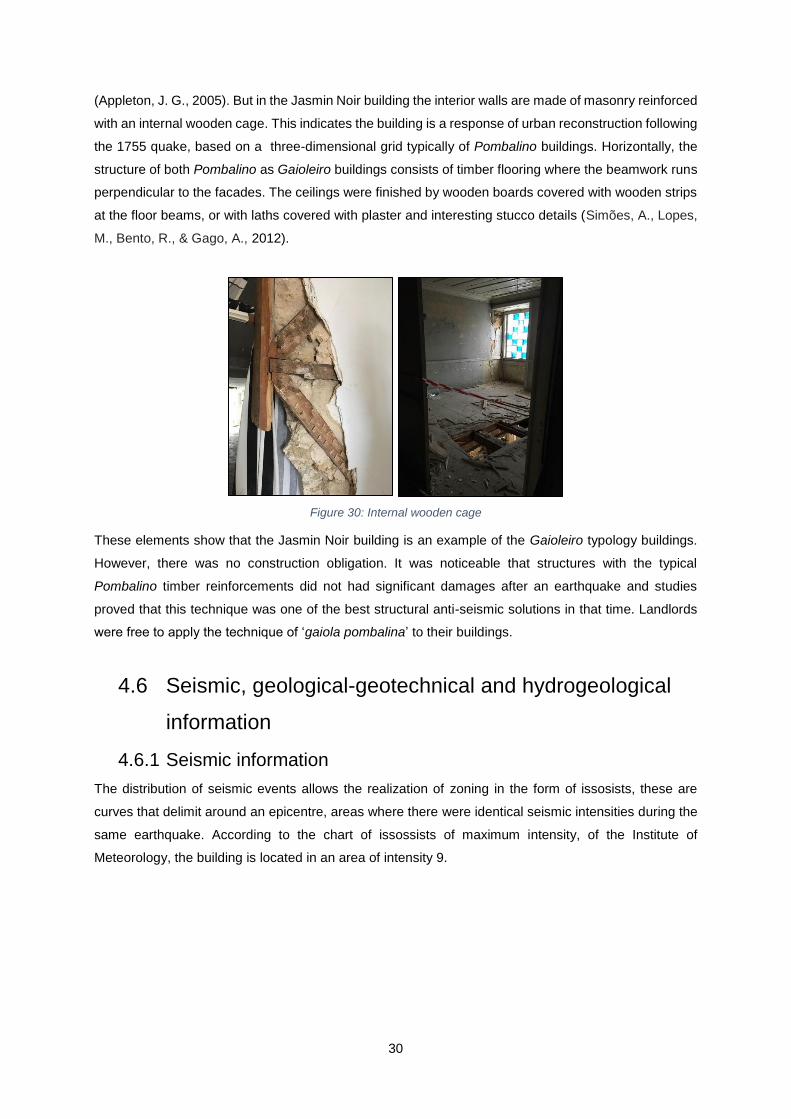
water pressure in the ground at the elevation of the porous filter. Water level meters are set to measure
water levels in piezometers, monitoring wells, and bore holes. These meters then emit an audio or visual
Need of specialized employees or technology Safety Space saving Time
68
69
7. Conclusion
7.1 General remarks
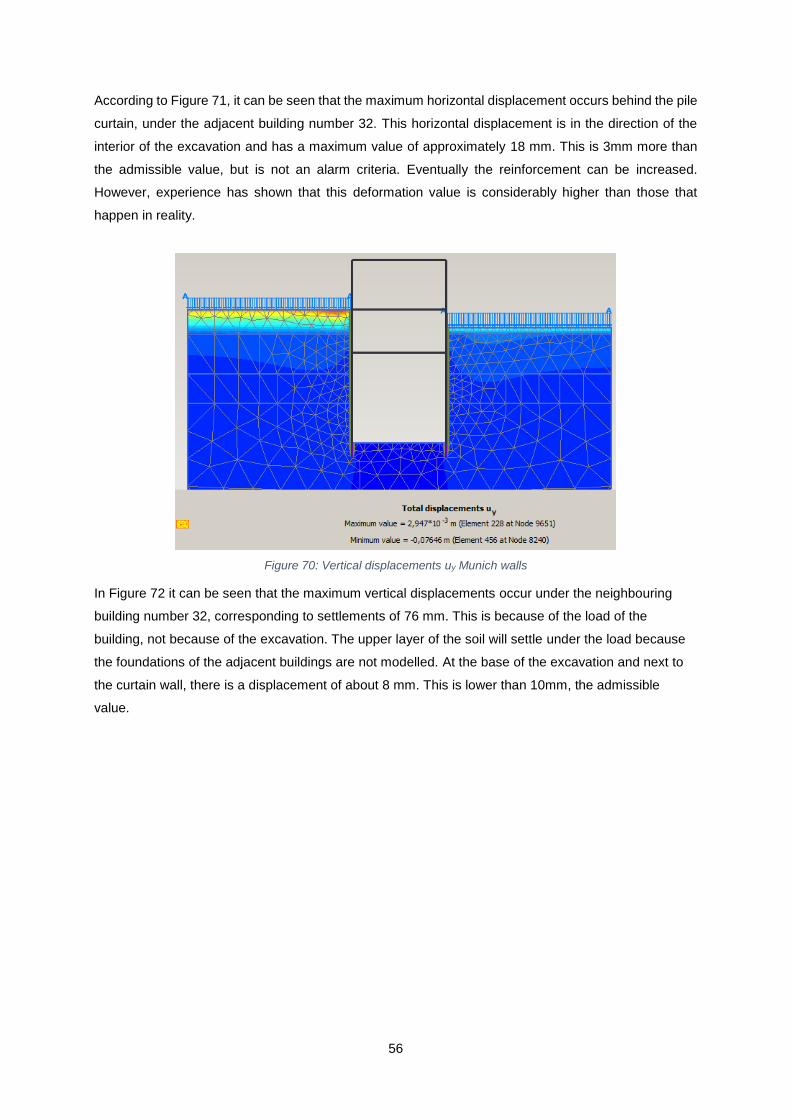
To accomplish the objectives, a general historical overview of Lisbon and its rebuilding actions after the
Great Lisbon earthquake are described. Through its history, Portugal mainland has experienced the
effects of various moderate to strong earthquakes, thus presenting a moderate seismic risk. The
geotechnical soil characterization is of the utmost importance for seismic risk assessment, being used,
in particular, for site effect assessment. In old cities there is an increasing market of buildings
rehabilitation and it is usually necessary to keep the main facades, which implies more difficulties to the
earth retaining structures. Allied to this, facade retention solutions must be associated with excavations
for basements execution. When King Post walls are structures which consist of metal profiles with
between them, profiles of wood or precast concrete, these types of retaining walls are temporary and
they are called Berliner walls. Although, when the execution of the walls is a permanent solution that
uses reinforced concrete poured in site, supported by micropiles staled at the ground vertically, this
technique is called Munich walls. This is a common used technique in Portugal with many advantages
and based on the geological, geotechnical and topographic site characteristics one of the easiest
techniques to excavate the Jasmin Noir site. Because of the small width of the construction site, the
main advantage is the possibility to execute these walls in a small work area and against the soil to save
space. An advanced constitutive model for the simulation of the non-linear, time-dependent and
anisotropic behaviour of the soils of the site is made in PLAXIS 2D. This finite element program,
developed for the analysis of deformation, stability and groundwater flow in geotechnical engineering
gives a clear view of the expected displacements. However, experience has shown that these values
are considerably higher than those that happen in reality. The results obtained show that the chosen
Munich walls technique gives a safe solution for the execution of the basement floors at the Jasmin Noir
site. Other solutions are investigated to optimize the work, such as underpinning in a contained slot and
mini CFA piles. Both have at least one dominant disadvantage that justifies the choice of the Munich
walls. Underpinning in a contained slot was suggested by Belgian companies, but because of safety
reasons this method hasn’t been applied for years in Portugal. The use of mini CFA piles is a faster
solution but will dissolve in a higher cost. The frequency of use of any engineering technique depends
mainly on the technical feasibility and economics of the system. In geotechnical engineering, the more
problems a construction technique can solve, and the more soil types in which it is effective, the more
applications will be available for the system's use.
7.1 Future developments
The process of the excavation using the top/down-method and the execution of the Munich walls couldn’t
be observed because of the short term of the Erasmus exchange. Further follow-up of the ‘Jasmin Noir’
site is advised and monitoring results can be found. A retro-analysis of the final solution could be
executed, as an attempt to narrow both the displacement values provided by the instrumentation and
the modelling values.
70
71
8. References
Appleton, J. G. (2005). Rehabilitation of ‘Gaioleiro’ Buildings. In Orion Edition. 1st Edition (in Portuguese). Baptista, L., & Rodrigues, T. (1996). Population and Urban Density: Lisbon in the 19th and 20th centuries. In Urban Dominance and Labour Market Differentiation of a European Capital City (pp. 49-74). Springer, Dordrecht. Bjerrum, L., C.J. Frimann Clausen, and J.M. Duncan. (1972). Earth Pressures on Flexible Structures -- A State-of-the-Art Report. (pp. 169-196) (No. R&d Rept) Brito, (2001). Munich-type walls Retaining and Foundations Technology. Master in Construction, Instituto Superior Técnico, Lisbon. (in Portuguese). Bullivant, R. A., & Bradbury, H. W. (1996). Underpinning: A practical guide. Blackwell Science. Cardoso, R., Lopes, M., & Bento, R. (2005). Seismic evaluation of old masonry buildings. Part I: Method description and application to a case-study. Engineering structures, 27(14), 2024-2035. Cardoso, R., Pinto, J., Paiva, A., & Lanzinha, J. C. (2015). Tabique walls typologies and building details in the Alto Douro Wine Region. Journal WSEAS Transactions on Environment and Development, 11(11), 95-107. Chudley, R., & Greeno, R. (2006). Building construction handbook. Routledge. Cravinho, A., Brito, J., Branco, F., Vaz Paulo, P., & Correia, J. (n.d.). Berlin Walls and Munich Walls - discipline slides for building construction tencologies. “Muros de Berlim e Muros de Munique - slides da disciplina de tencologias de construção de edificios” (in Portuguese). Falcão, J. et al. (2000). Case histories and work performance of vertical jet grouting solutions. In ISRM International Symposium. International Society for Rock Mechanics. França, J.-A. (1989). The Reconstruction of Lisbon and the Pombaline Architecture. Lisbon: Institute of Portuguese culture. “A Reconstrução de Lisboa e a Arquitectura Pombalina. Lisboa: Instituto de cultura portuguesa” (in Portuguese). Franco, G., & Shen-Tu, B. (2009). From 1755 to Today—Reassessing Lisbon’s Earthquake Risk. In AIR Currents, 07/2009. AIR Worldwide Corporation. Greenwood, D. (1987). Underpinning by grouting. Ground Engineering, April 1987 Kordahi, R. Z. (2004). Underpinning strategies for buildings with deep foundations. (Doctoral dissertation, Massachusetts Institute of Technology). Lopes, M. (2008). Earthquakes and Buildings. Orion Edition. Lopes, M. (2010). ‘Pombalino’ Construction: Historic Heritage and Seismic-Resistant Structure. Eighth Seismology and Earthquake Engineering Congress – Sísmica 2010. Congress Proceedings (in Portuguese) Martinho, F. C. (2013). Excavation and Retaining Wall Solutions in the Alves Redol Car Park. Mascarenhas, J. (2005). Construction Systems V–The Rentable Building from ‘Pombalino’ Downtown of Lisbon. Livros Horizonte. Matildes, R., Taborda, R., Almeida, I. M., Pinto, C., & Jeremias, F. (2010). 3D geological model of Lisbon. In Proceedings of the 11th Congress of the International Association for Engineering Geology and the Environment on:“Geologically active,” Auckland, New Zealand. CRC Press/Balkema, Leiden, The Netherlands (pp. 2201-2208).
72
Meyerhof, G. G. (1956). Penetration tests and bearing capacity of cohesionless soils. Journal of the Soil Mechanics and Foundations Division, 82(1), 1-19. Nemati, K. M. (2005). Temporary Structures - Shoring, scaffolding, and underpinning. Tokyo institute of technology – Department of civil engineering. Nunes, R. D. D. S. F. (2017). Constructive Characterization of Pombaline Buildings and Simplified Pushover Analysis of Frontal Walls. (Doctoral dissertation) Oliveira, V., & Pinho, P. (2010). Lisbon. Cities, 27(5), 405-419. Owen D.R.J. & Hinton E. (1980), Finite Elements in Plasticity. (Vol. 271). Swansea: Pineridge press. Paik, K. H., & Salgado, R. (2003). Estimation of active earth pressure against rigid retaining walls considering arching effects. Geotechnique, 53(7), 643-654. Pais, J., Moniz, C., Cabral, J., Cardoso, J., Legoinha, P., Machado, S., Morais, M., Lourenço, C., Ribeiro, M., Henriques, P. & Falé, P. (2006). Depart. Geologia, INETI, 21p. (in Portuguese). Patrício, A., & Teixeira, R. (2006). Dimensioning and Execution of Berlin-type Curtains . “Dimensionamento e Execução de Cortinas do Tipo Berlim” (in Portuguese). Pedro, A. (2013). Geotechnical investigation of Ivens shaft in Lisbon. Doctoral dissertation, Imperial College London. Pietruszczak, S. (2010). Fundamentals of Plasticity in Geomechanics. Crc Press. Pinto, A., Ferreira, S., & Barros, V. (2001). Underpinning solutions of historical constructions. III Seminário Internacional “Possibilidades das técnicas numéricas e experimentais”, November, Universidade do Minho–Guimarães, Consolidation and Strengthening Techniques, 1003-1012. Pinto, A., (2010). Retaining walls and structures. Discipline of Excavations and Underground Works. Higher Technical Institute. “Muros e estruturas de contenção. Disciplina de Escavações e Obras Subterrâneas. Instituto Superior Técnico” (in Portuguese). PLAXIS 2D - Tutorial Manual. (2012). Rodrigues, J. N. S. S. (2011) Behavior Analysis of a Berlin-type Retaining Wall. (Doctoral dissertation) Rodriguez J. (2018, May, 04). Underpinning to Repair Faulty Foundations. Retrieved from https://www.thebalance.com/what-is-underpinning-how-to-repair-foundations-845100. Schanz, T., Vermeer, P. A., & Bonnier, P. G. (1999). The hardening soil model: formulation and verification. Beyond 2000 in computational geotechnics, 281-296. Simões, A., Lopes, M., Bento, R., & Gago, A. (2012). Characterization of Lisbon old buildings. In 15 World Conference Earthquake Engineering. TECNASOL, FGE. (2017), Geological-geotechnical and hydrogeological study - Building in the Plaza do Principe Real n ° 33 / Calçada da Patriarcal n ° 15. “Estudo Geológico-Geotécnico e hidrogeológico - Edifício na Praça do Principe Real n°33 / Calçada da Patriarcal n°15”. (in Portuguese). Teves-Costa, P., Almeida, I. M., & Silva, P. L. (2002). Microzonation of Lisbon: 1-D theoretical approach. In Earthquake Microzoning (pp. 2579-2596). Birkhäuser, Basel. Teves-Costa, P., & Almeida, I. M. (2004). Geotechnical characterization in Lisbon and surrounding counties for earthquake engineering proposes.
73
Wylaers, M. (2016, September, 26). Bouwtechniek 1 – Berlin walls. “Berlinerwanden”. Belgium, Gent. (in Dutch). Wylaers, M. (2016, September, 26). Bouwtechniek 1 – Underpinning. “Ondervangingsconstructies”. Belgium, Gent. (in Dutch). Wylaers, M. (2016, September, 26). Bouwtechniek 1 – Ground anchors. “Grondankers”. Belgium, Gent. (in Dutch).
9. Appendices
Appendix 1: Survey charts test boring S1 and S2
Appendix 2: Geotechnical zones Z1-Z4 and ground water level
Appendix 3: Inspection shafts extra information
Appendix 4: AutoCAD plans ‘Jasmin Noir’ building
0.00
0.50
1.00
1.50
2.00
2.50
3.00
3.50
4.00
4.50
5.00
5.50
6.00
6.50
7.00
7.50
8.00
8.50
9.00
9.50
10.00
78.0
77.5
77.0
76.5
76.0
75.5
75.0
74.5
74.0
73.5
73.0
72.5
72.0
71.5
71.0
70.5
70.0
69.5
69.0
68.5
INICIO: FIM:
DIÂ
MET
RO
S
Z. G
EOTÉ
CN
ICA
S
pela Classificação Triângular de Solos
[LNEC E-239][LNEC E-219]
De acordo com os critérios definidos
Nº de pancadas (N)
ESTR
ATI
GR
AFI
A
ENSAIO SPT
1ª F
ase
600
2ª e
3ª
Fas
e
Pe
ne
t. (
cm)
ENSAIOS E AMOSTRAGEMDESCRIÇÃOSI
MB
OLO
GIA
CO
TA
PRO
F. (m
)
DA
TAS
PERCENTAGEM DE
ÍNDICE RQD
RECUPERAÇÃO
ALT
ERA
ÇÃ
O
FRA
CTU
RA
ÇÃ
O
0 100%
OBRA:
CLIENTE:
SONDAGEM
OBRA NºLOCALIZAÇÃO:COMPRIMENTO:Z:M: P: AZIMUTE: Proj. NºFURAÇÃO À ROTAÇÃO
NÍVEL DE ÁGUA Des.Ver.
ESTABILIZADO:
DETECTADO:
EQUIPAMENTO
REVESTIMENTOFURAÇÃO
INCLIN.
Pág. 1 de 2
K= 2.0E-6
EDIFÍCIO NA PRAÇA DO PRÍNCIPE REAL, 33
2
3
6
8
17
25
(0.00, 0.15)Pavimento cerâmico + betonilha
(0.15, 4.50)Aterro argilo-siltoso
de cor castanho,com fragmentos de natureza variada,
dispersos.
(4.50, 5.50)Argila siltosa
de cor castanho, com pequenos fragmentosde natureza calcária. (Aterro?)
(5.50, 10.00)Argila siltosa,
de tons acinzentados e acastanhados,por vezes com fragmentos de fósseis,
intercalações carbonatadase passagens compactas a partir dos 7.50 m.
4+3
2+3
4+3
10+15
22+24
27+33
30
30
30
30
30
24
OBSERVAÇÕES:
CLIVIO 26/09/2017 28/09/2017
Piezómetro/Ensaios
Lefranc (K=m/s)
19.4033
-88255 -105168 78.4 15.00 m
Set/17
Set/17
CMG
CPR
12.46
0.00 m - 15.00 m= 86mm 0.00 m - 9.00 m= 98mm
90°
S1
Lisboa
10.50
11.00
11.50
12.00
12.50
13.00
13.50
14.00
14.50
15.00
15.50
16.00
16.50
68.0
67.5
67.0
66.5
66.0
65.5
65.0
64.5
64.0
63.5
63.0
62.5
62.0
INCLIN.
FURAÇÃO REVESTIMENTO
EQUIPAMENTO
DETECTADO:
ESTABILIZADO:
Ver.Des.NÍVEL DE ÁGUA
FURAÇÃO À ROTAÇÃO Proj. NºAZIMUTE:P:M: Z: COMPRIMENTO:
LOCALIZAÇÃO: OBRA Nº
SONDAGEMOBRA:
Pág. 2 de 2
% 1000
FRA
CTU
RA
ÇÃ
O
ALT
ERA
ÇÃ
O
RECUPERAÇÃO
ÍNDICE RQD
PERCENTAGEM DE
DA
TAS
PRO
F. (m
)
CO
TA
SIM
BO
LOG
IADESCRIÇÃO ENSAIOS E AMOSTRAGEM
Pe
ne
t. (
cm)
2ª e
3ª
Fas
e
0 60
1ª F
ase
ENSAIO SPT
ESTR
ATI
GR
AFI
A
Nº de pancadas (N)
De acordo com os critérios definidos
[LNEC E-219] [LNEC E-239]
pela Classificação Triângular de Solos
Z. G
EOTÉ
CN
ICA
S
DIÂ
MET
RO
S
FIM:INICIO:
CLIENTE:
21
60
60
60
(10.00, 14.00)Argila siltosa,
de tons acinzentados e acastanhados,por vezes com fragmentos de fósseis,
intercalações carbonatadase com passagens compactas (argilito).
(14.00, 15.00)Silte argiloso
micáceo, de cor castanho.
29+31
9
5
14
25
OBSERVAÇÕES:
90°
0.00 m - 9.00 m= 98mm0.00 m - 15.00 m= 86mm
12.46
CPR
CMG
Set/17
Set/17
15.00 m78.4-105168-88255
19.4033
Piezómetro/Ensaios
Lefranc (K=m/s)
28/09/201726/09/2017CLIVIO
S1
Lisboa
EDIFÍCIO NA PRAÇA DO PRÍNCIPE REAL, 33
Sondagem S1
EDIFÍCIO NA PRAÇA DO PRÍNCIPE REAL N°33
0.00 m – 6.50 m
6.50 m – 10.75 m
10.75 m – 15.00 m
0.00
0.50
1.00
1.50
2.00
2.50
3.00
3.50
4.00
4.50
5.00
5.50
6.00
6.50
7.00
7.50
8.00
8.50
9.00
9.50
10.00
72.0
71.5
71.0
70.5
70.0
69.5
69.0
68.5
68.0
67.5
67.0
66.5
66.0
65.5
65.0
64.5
64.0
63.5
63.0
62.5
INICIO: FIM:
DIÂ
MET
RO
S
Z. G
EOTÉ
CN
ICA
S
pela Classificação Triângular de Solos
[LNEC E-239][LNEC E-219]
De acordo com os critérios definidos
Nº de pancadas (N)
ESTR
ATI
GR
AFI
A
ENSAIO SPT
1ª F
ase
600
2ª e
3ª
Fas
e
Pe
ne
t. (
cm)
ENSAIOS E AMOSTRAGEMDESCRIÇÃOSI
MB
OLO
GIA
CO
TA
PRO
F. (m
)
DA
TAS
PERCENTAGEM DE
ÍNDICE RQD
RECUPERAÇÃO
ALT
ERA
ÇÃ
O
FRA
CTU
RA
ÇÃ
O
0 100%
OBRA:
CLIENTE:
SONDAGEM
OBRA NºLOCALIZAÇÃO:COMPRIMENTO:Z:M: P: AZIMUTE: Proj. NºFURAÇÃO À ROTAÇÃO
NÍVEL DE ÁGUA Des.Ver.
ESTABILIZADO:
DETECTADO:
EQUIPAMENTO
REVESTIMENTOFURAÇÃO
INCLIN.
Pág. 1 de 2
K= 4.5E-8
EDIFÍCIO NA PRAÇA DO PRÍNCIPE REAL, 33
7
10
15
6
11
19
(0.00, 0.15)Pavimento em lajetas de calcário
(0.15, 2.50)Aterro argilo-siltoso,
de tons acastanhados,com fragmentos de natureza variada,
dispersos.
(2.50, 4.50)Argila siltosa,
de tons acinzentados,com laivos acastanhados,
pontualmente com pequenos fragmentos denatureza variada, dispersos.
(4.50, 8.20)Argila siltosa
levemente margosa,de tons acinzentados,
com intercalações carbonatadas e presençade conchas.
(8.20, 10.00)Argila siltosa
de tom acastanhado e acinzentados.
6+9
10+12
17+19
10+13
14+18
29+31
30
30
30
30
30
25
CLIVIO 03/10/2017 05/10/2017
Piezómetro/Ensaios
Lefranc (K=m/s)
19.4033
-88237 -105155 72.11 12.00 m
Out/17
Out/17
CMG
CPR
10.6
0.00 m - 12.00 m= 86mm 0.00 m - 12.00 m= 113mm
90°
S2
Lisboa
10.50
11.00
11.50
12.00
12.50
13.00
13.50
14.00
14.50
15.00
62.0
61.5
61.0
60.5
60.0
59.5
59.0
58.5
58.0
57.5
INCLIN.
FURAÇÃO REVESTIMENTO
EQUIPAMENTO
DETECTADO:
ESTABILIZADO:
Ver.Des.NÍVEL DE ÁGUA
FURAÇÃO À ROTAÇÃO Proj. NºAZIMUTE:P:M: Z: COMPRIMENTO:
LOCALIZAÇÃO: OBRA Nº
SONDAGEMOBRA:
Pág. 2 de 2
% 1000
FRA
CTU
RA
ÇÃ
O
ALT
ERA
ÇÃ
O
RECUPERAÇÃO
ÍNDICE RQD
PERCENTAGEM DE
DA
TAS
PRO
F. (m
)
CO
TA
SIM
BO
LOG
IADESCRIÇÃO ENSAIOS E AMOSTRAGEM
Pe
ne
t. (
cm)
2ª e
3ª
Fas
e
0 60
1ª F
ase
ENSAIO SPT
ESTR
ATI
GR
AFI
A
Nº de pancadas (N)
De acordo com os critérios definidos
[LNEC E-219] [LNEC E-239]
pela Classificação Triângular de Solos
Z. G
EOTÉ
CN
ICA
S
DIÂ
MET
RO
S
FIM:INICIO:
CLIENTE:
23
26
(10.00, 10.50)Argila siltosa
de tom acastanhado e acinzentados.
(10.50, 12.00)Silte argiloso,
de tons acinzentados e acastanhados.No SPT dos 12.0m apresenta maior
componente argilosa.
27+33
31+29
22
26
90°
0.00 m - 12.00 m= 113mm0.00 m - 12.00 m= 86mm
10.6
CPR
CMG
Out/17
Out/17
12.00 m72.11-105155-88237
19.4033
Piezómetro/Ensaios
Lefranc (K=m/s)
05/10/201703/10/2017CLIVIO
S2
Lisboa
EDIFÍCIO NA PRAÇA DO PRÍNCIPE REAL, 33
Sondagem S2
EDIFÍCIO NA PRAÇA DO PRÍNCIPE REAL N°33
0.00 m – 7.50 m
6.50 m – 12.00 m
76.92
76.57
76.08
76.54
77.44
64.38
76.04
76.09
75.77
75.83
74.83
74.88
73.49
73.56
73.05
73.08
73.01
73.08
72.96
73.06
73.40
73.45
73.19
73.24
73.05
73.11
72.90
72.82
72.90
71.69
71.78
71.36
71.49
69.34
69.45
68.02
68.12
66.42
66.51
65.13
65.24
64.97
64.74
64.81
64.61
64.69
64.47
64.60
64.62
64.67
64.70
64.64
64.76
64.81
64.78
65.04
65.69
65.58
65.48
66.61
67.78
67.64
67.17
68.17
69.06
69.58
69.92
70.22
70.46
70.48
70.50
71.08
71.21
70.86
72.23
72.47
73.39
73.48
73.48
73.96
73.99
74.5974.62
74.62
76.22
76.27
76.3776.46
76.44
76.33
76.40
76.31
76.24
76.54
75.67
74.51
73.98
75.56
76.04
76.04
76.10
73.47
73.38
73.20
73.38
73.14
73.22
73.11
72.49
72.25
69.96
70.87
71.45
71.62
72.15
72.54
72.81
72.99
73.04
72.91
72.81
72.74
72.68
72.67
71.79
73.20
64.78
64.78
65.83
65.82
64.14
63.57
64.15
64.26
64.25
64.36
64.46
64.5464.64
64.79
64.78
64.47
64.40
64.30
64.36
64.62
64.90
64.94
65.09
65.05
65.21
65.31
65.28
65.66
65.87
65.87
66.00
66.00
66.84
66.96
67.14
67.32
67.36
67.74
68.31
69.61
69.50
69.59
69.55
69.04
68.89
64.55
64.38
64.41
64.36
64.76
64.93
65.09
65.27
65.45
65.64
64.37
64.30
64.33
64.21
64.26
64.13
64.17
63.79
63.86
63.49
63.59
62.60
62.67
62.18
62.18
61.92
61.69
61.99
61.73
61.83
61.57
61.75
61.61
61.43
61.47
61.28
61.33
61.30
61.41
61.69
62.44
62.1762.17
63.85
63.99
64.00
63.82
63.75
63.64
63.4763.58
63.41
63.60
63.55
63.73
63.56
63.66
63.38
62.82
62.95
63.0063.13
63.33
63.54
62.48
62.25
62.61
62.32
62.66
63.72
64.21
63.68
63.78
62.49
62.41
62.28
62.38
62.29
62.03
62.14
61.92
62.08
62.05
61.71
62.24
62.23
61.57
61.42
61.34
61.43
61.49
61.55
61.48
61.47
61.60
62.36
61.33
61.76
61.75
61.24
61.06
61.16
61.48
61.58
61.67
61.75
61.56
61.64
61.61
61.52
61.96
63.53
62.14
62.40
62.42
62.95
64.33
64.04
64.18
63.92
63.08
76.4676.56
76.51
76.54
76.55
76.63
76.56
76.65
76.57
76.92
76.87
76.99
76.99
76.96
77.13
77.07
77.17
77.10
77.16
77.18
77.24
77.25
77.40
77.41
77.66
77.72
77.70
77.81
77.83
77.77
77.64
62.09
77.69
77.51
77.58
77.41
77.46
77.31
77.36
77.56
77.53
77.53
77.58
77.70
77.69
77.81
77.57
77.57
77.55
77.53
77.57
77.26
77.30
77.05
77.22
77.22
77.23
77.23
77.41
77.18
77.42
76.89
76.92
76.46
76.52
76.78
77.22
77.45
77.49
77.53
77.49
77.47
77.49
77.43
77.51
77.45
77.51
77.24
77.31
77.39
77.31
77.08
77.15
77.15
77.16
77.06
77.19
77.11
77.16
77.09
77.20
77.25
77.28
77.24
77.32
77.24
77.35
77.2577.36
77.20
77.33
76.81
76.85
76.77
76.89
76.82
76.87
76.84
76.93
76.85
76.90
PARQUE
C
a
l
ç
a
d
a
d
a
P
a
t
r
i
a
r
c
a
l
C
a
l
ç
a
d
a
d
a
P
a
t
r
i
a
r
c
a
l
P
r
a
ç
a
d
o
P
r
i
n
c
i
p
e
R
e
a
l
E
D
I
F
Í
C
I
O
8
1
.
3
3
7
8
.
3
6
7
5
.
3
8
7
3
.
2
1
7
2
.
5
0
7
2
.
4
8
7
2
.
1
1
7
1
.
3
7
7
3
.
0
3
7
5
.
7
9
P=
M=
-88300.000
-105120.000 P=
M=
-88250.000
-105120.000 P=
M=
-88200.000
-105120.000
P=
M=
-88300.000
-105170.000 P=
M=
-88250.000
-105170.000 P=
M=
-88200.000
-105170.000
N
EW
S
S1
(~78.4)
S2
(72.11)
P1
P2
(72.11)
(72.11)
A
A
'
S1
(~78.4)
15.00m
0
%
5
0
%
1
0
0
%
2
7
3
5
6
7
8
25
17
46
25
60(24cm)
21
60(25cm)
60(9cm)
60(5cm)
60(14cm)
K=2.0 E-6 m/s
N.P.
PERFIL INTERPRETATIVO A-A'
PERFIL GEOLÓGICO
Escala 1/200
70.00 70.00
65.00 65.00
60.00 60.00
S2
(72.11)
12.00m
0
%
5
0
%
1
0
0
%
7
15
10
22
15
36
6
23
11
32
19
60(25cm)
23
60(22cm)
26
60(26cm)
K=4.5 E-8 m/s
N.P.
75.00 75.00
(66.41)
?
?
?
?
?
?
?
?
?
?
?
?
?
Cave existente
S1
(~78.4)
15.00m
0
%
5
0
%
1
0
0
%
2
7
3
5
6
7
8
25
17
46
25
60(24cm)
21
60(25cm)
60(9cm)
60(5cm)
60(14cm)
K=2.0 E-6 m/s
N.P.
PERFIL INTERPRETATIVO A-A'
PERFIL HIDROGEOLÓGICO
Escala 1/200
70.00 70.00
65.00 65.00
60.00 60.00
S2
(72.11)
12.00m
0
%
5
0
%
1
0
0
%
7
15
10
22
15
36
6
23
11
32
19
60(25cm)
23
60(22cm)
26
60(26cm)
K=4.5 E-8 m/s
N.P.
75.00 75.00
(66.41)
?
?
Cave existente
P1
(72.11)
2.15m
P2
(72.11)
1.80m
REPRESENTAÇÃO DOS POÇOS
DE RECONHECIMENTO
Escala 1/200
70.00 70.00
72.00 72.00
A1
(5
94
mm
x 8
41
mm
)
Paulo Rodrigues
Rui Silva
Carlos Gonçalves
1:200
P17/0416-4033/001/0/11703170416001.dwg
out.2017
EDIFÍCIO NA PRAÇA DO PRÍNCIPE REAL, 33 / CALÇADA DA PATRIARCAL, 15
LISBOA
PLANTA DE LOCALIZAÇÃO DOS TRABALHOS DE PROSPECÇÃO, PERFIS
INTREPRETATIVOS E REPRESENTAÇÃO DOS POÇOS DE RECONHECIMENTO
Escala: Desenho NºData:
Proj./Rev.
Des.
Ver.
Val.
Nome do ficheiro:
Este desenho é propriedade de Tecnasol FGE - Fundações e Geotecnia, S.A. e não pode ser reproduzido, divulgado ou copiado, no todo ou em parte, sem autorização expressa
Reservados todos os direitos pela legislação em vigor. DECRETO-LEI 63/85 de 14 de Março
Edifício Prime - Av. Quinta Grande, 53 e 53A - 4º B
60 Pancadas para a penetração de 28 cm - 2ª e 3ª Fases
19 Pancadas para a penetração de 15 cm - 1ª Fase
11 Pancadas para a penetração de 30 cm - 2ª e 3ª Fases
60 (12cm)
NEGA - 60 Pancadas atingidas na 1ª Fase
3 Pancadas para a penetração de 15 cm - 1ª Fase
DOS ENSAIOS SPT
LOCALIZAÇÃO E RESULTADOS
3
24
24
19
60 (28cm)
27
60 (18cm)
11
5
9
00.00m
% Recuperação
Limite Litológico
Profundidade
atingida
1
0
0
%
5
0
%
0
%
Cota de boca do furo
S1
(0.00)
SONDAGENS EXECUTADAS
LITOLOGIA
LEGENDA:
Perfis Interpretativos
PLANTA
A
QUADRO SÍNTESE
Zona Geotécnica Descrição NSPTPeso específico
g (kN/m³)
Ângulo deatrito interno
Ø' (°)
CoesãoC' (KPa)
Módulo dedeformabilidade
E' (MPa)
ZG4 Pavimento e aterros5, 7 e 15
10 - 14 15 - 20 0
2.5*
3.5**
ZG3 Argilas siltosas22, 23 e 25
19 - 21 30 - 33 22 - 50
16.5 - 18.7*
23 - 26**
ZG2 Argilas siltosas, por vezes
ligeiramente margosas
32, 36 e 4620 - 21 34 - 36 50 - 110
24 - 34*
33 - 48**
ZG1 Argilas siltosas e siltes argilosos
> 60 21 - 22 35 - 40 100 - 150
45*
60**
Sistema de coordenadas: Datum 73
Ponto de Origem: Ponto Central da Melriça
QUADRO DE COORDENADAS ECOTAS DOS POÇOS
POÇOS COORDENADAS COTAM P Z (m)
P1-88234 -105152 72.11
P2 -88239 -105151 72.11
PLANTA DE LOCALIZAÇÃO DOS TRABALHOS DE PROSPECÇÃO
Escala 1/200
Poços executados pela empresa "Tecnasol FGE - Fundações e Geotecnia, S.A.", em setembro de 2017
Sondagens com Piezómetros executadas pela empresa "Tecnasol FGE - Fundações e Geotecnia, S.A.",
entre setembro e outubro de 2017
S...
(00.00)
P...
(00.00)
Lajetas de calcário
AterroPavimento
Argila siltosa/Silte argiloso
Argamassa cimenticia
Elementos de fundação
constituidos por calhaus e
blocos envoltos por argamassa
Blocos de calcário
Actual
Miocénico
Actual
(66.41)
Cota da base da
escavação admitida
Nível Piezométrico
Câmara
Piezométrica
N.P.
Ensaios Lefranc
K=8 E-6 m/s
QUADRO HIDROGEOLÓGICO SÍNTESE
Unidade
Hidrogeológica
Permeabilidade
Descrição
Permeabilidade
K(m/s)
UH2 Baixa
Aterro e argila siltosa
10 E-6
UH1 Muito baixa
Aterro, argila siltosa e silte
argiloso
10 E-8 - 10 E-9
ESTUDO GEOLÓGICO-GEOTÉCNICO E HIDROGEOLÓGICO
?
Limite Hidrogeológico Provável
Superficie piezometrica
(11/10/17)
* - Carregamento axissimétrico** - Deformação plana
Paulo Rodrigues
0.00
0.50
1.00
1.50
2.00
2.50
3.00
3.50
4.00
4.50
5.00
72.0
71.5
71.0
70.5
70.0
69.5
69.0
68.5
68.0
67.5
INICIO:
FIM:
pela Classificação Triângular de Solos
[LNEC E-239][LNEC E-219]
De acordo com os critérios definidos
ESTR
ATI
GR
AFI
A AMOSTRAGEMDESCRIÇÃOSI
MB
OLO
GIA
CO
TA
PRO
F. (m
)
DA
TAS
OBRA:
CLIENTE:
OBRA NºLOCALIZAÇÃO:PROFUNDIDADE ATINGIDAZ:M: P: AZIMUTE: Proj. NºPOÇO / VALA
NÍVEL DE ÁGUA Des.Ver.
ESTABILIZADO:
DETECTADO:
Pág. 1 de 1
POÇO/VALA
AMOSTRAGEM
Poço P1
(0.00, 0.10)Lajetas em calcário
(0.10, 0.20)Argamassa cimenticia de regularização,
friável.
(0.20, 2.15)Elemento de fundação
constituido por calhaus e blocos(Dmáx.= 40/50 cm), envoltos por argamassa cimentícia.
A argamassa apresenta-se compacta.
Aos 0.80 m de profundidade há um ligeiro ressalto,afastado cerca de 10/15 cm em relação à prumada da parede de fundação
(sapata/viga de fundação ?).
25/09/2017
28/09/2017
ENSAIOS
19.4033
-88234 -105152 72.11 2.15 m
SET/17
SET/17
CMG
CPR
EDIFÍCIO NA PRAÇA DO PRÍNCIPE REAL, 33 / CALÇADA DAPATRIARCAL, 15
LISBOA
ABERTURA MANUAL
OBSERVAÇÕES: POR QUESTÕES DE SEGURANÇA NÃO FOI POSSÍVEL CONTINUAR AESCAVAÇÃO DO POÇO.
NÃO ENTIVADO
0.00
0.50
1.00
1.50
2.00
2.50
3.00
3.50
4.00
4.50
5.00
72.0
71.5
71.0
70.5
70.0
69.5
69.0
68.5
68.0
67.5
INICIO:
FIM:
pela Classificação Triângular de Solos
[LNEC E-239][LNEC E-219]
De acordo com os critérios definidos
ESTR
ATI
GR
AFI
A AMOSTRAGEMDESCRIÇÃOSI
MB
OLO
GIA
CO
TA
PRO
F. (m
)
DA
TAS
OBRA:
CLIENTE:
OBRA NºLOCALIZAÇÃO:PROFUNDIDADE ATINGIDAZ:M: P: AZIMUTE: Proj. NºPOÇO / VALA
NÍVEL DE ÁGUA Des.Ver.
ESTABILIZADO:
DETECTADO:
Pág. 1 de 1
POÇO/VALA
AMOSTRAGEM
Poço P2
(0.00, 0.07)Argamassa cimentícia
(0.07, 0.15)Aterro arenoso
acastanhado e acinzentado.
(0.15, 1.62)Elemento de fundação
constituido por seixos, calhaus e blocos(Dmáx.= 30 cm), envoltos por argamassa, que se apresenta compacta.
Este elemento de fundação apresenta uma espessura entre os 0.20 m(limite norte) e 1.50 m (limite sul), que acompanha a inclinação das
estruturas encontradas (antigo caneiro e canalização em grés cerâmico)
(1.62, 1.82)Blocos de calcário
com comprimentos a variar entre 0.50 m e 1.05 m, argamassados entre si(a argamassa apresenta-se friável e localmente inexistente).
Esta estrutura deverá pertencer a um antigo caneiro de circulação de águasresiduais, que foi substituido por canalização mais recente em grés
cerâmico.
28/09/2017
29/09/2017
ENSAIOS
19.4033
-88239 -105151 72.11 1.80 m
SET/17
SET/17
CMG
CPR
EDIFÍCIO NA PRAÇA DO PRÍNCIPE REAL, 33 / CALÇADA DAPATRIARCAL, 15
LISBOA
ABERTURA MANUAL
OBSERVAÇÕES: DEVIDO À EXISTÊNCIA DE UM SISTEMA DE CANALIZAÇÃO EM GRÉSCERÂMICO DE ÁGUAS RESIDUAIS, NÃO FOI POSSÍVEL CONTINUAR COM A ESCAVAÇÃODO POÇO
NÃO ENTIVADO
AL...
I...
M...
PZ...
EDIFÍCIO EXISTENTE(Rua da Escola Politécnica nº34)
COM 5 PISOS ELEVADOS E 1 CAVE
EDIFÍCIO EXISTENTE(Rua da Escola Politécnica nº32)
COM 1 CAVE, 4 PISOS ELEVADOS E COBERTURA
11
22
33
44
55
66
ACDE
F G HJ
I
B
05
Este
des
enho
é p
ropr
ieda
de d
a Je
tSJ,
não
pode
ndo
ser r
epro
duzi
do, d
ivul
gado
ou
copi
ado,
tota
l ou
parc
ialm
ente
, sem
exp
ress
a au
toriz
ação
do
seu
auto
r (DL
63
/ 85
de 1
4 de
Mar
ço)
DATA
0REVISÃO
DESENHO
CLIENTE
PROJECTO
PRO/2016/053
VERIFICOUAlexandre Pinto
PROJETOUA. Pereira/J. Mirante
DESENHOUJorge Gomes
final plans.dwg
PROJETO
N.º Arquivo JetSJ:
2018/03/26
Este desenho é propriedade da JETsj, não podendo ser reproduzido, divulgado ou copiado, total ou parcialmente, semexpressa autorização do seu autor (DL 63 / 85 de 14 de Março)
Alt. Data Designação Des. Verf.- - - - -
Proj.-
ESCAVAÇÃO E CONTENÇÃOPERIFÉRICA
ESPECIALIDADE
PROJETO DE EXECUÇÃOFASE
DESIGNAÇÃOCORTES TIPO (2/3)
ESCALAS 1:100(A1)
EDIFÍCIO DE HABITAÇÃOPRAÇA DO PRÍNCIPE REAL, Nº33. LISBOA
FCM
AutoCAD SHX Text
Contenção tipo "Berlim Definitivo"
AutoCAD SHX Text
PAINÉIS PRIMÁRIOS
AutoCAD SHX Text
LEGENDA:
AutoCAD SHX Text
?
AutoCAD SHX Text
RECENTES (ATERROS)
AutoCAD SHX Text
ARGILAS SILTOSAS (N <25)SPT<25)
AutoCAD SHX Text
LIMITE GEOTÉCNICO PROVÁVEL
AutoCAD SHX Text
ZONAS GEOTÉCNICAS
AutoCAD SHX Text
ZG4
AutoCAD SHX Text
ZG3
AutoCAD SHX Text
Instrumentação
AutoCAD SHX Text
ALVOS TOPOGRÁFICOS
AutoCAD SHX Text
MICROESTACAS N80 (API5A) 127.0X9MM (FURAÇÃO 8") COM UNIÕES EXTERIORES
AutoCAD SHX Text
INCLINÓMETROS (INCLUINDO REALIZAÇÃO DE SONDAGEM COM AMOSTRAGEM CONTÍNUA E ENSAIOS SPT, NO INTERIOR DOS FUROS PARA INSTALAÇÃO DAS CALHAS)
AutoCAD SHX Text
MARCA DE NIVELAMENTO DE SUPERFÍCIE (A COLOCAR NO PASSEIO)
AutoCAD SHX Text
PIEZÓMETROS
AutoCAD SHX Text
MICROESTACAS N80 (API5A) 177.8X9MM (FURAÇÃO 10") COM UNIÕES EXTERIORES
AutoCAD SHX Text
BARRAS GEWI
AutoCAD SHX Text
VIGA DE RECALÇAMENTO
AutoCAD SHX Text
VIGA DE COROAMENTO
AutoCAD SHX Text
ZG2
AutoCAD SHX Text
ARGILAS SILTOSAS, POR VEZES LIGEIRAMENTE MARGOSAS (32<N <46)(32<N <46)SPT<46)
AutoCAD SHX Text
ZG1
AutoCAD SHX Text
ARGILAS SILTOSAS E SILTES ARGILOSOS (N >60)(N >60)SPT>60)
AutoCAD SHX Text
PAINÉIS SECUNDÁRIOS
AutoCAD SHX Text
E
AutoCAD SHX Text
ESCORAS METÁLICAS
AutoCAD SHX Text
ARRANQUES DOS PILARES (VER PROJETO DE ESTRUTURAS)
AutoCAD SHX Text
MICROESTACAS N80 (API5A) 88.9X9MM (FURAÇÃO 8") COM UNIÕES EXTERIORES, COMPRIMENTO DE SELAGEM=4.0M
AutoCAD SHX Text
CORTE TIPO 2-2
AutoCAD SHX Text
(ALÇADOS DE/FG)
AutoCAD SHX Text
ESCALA 1:100
AutoCAD SHX Text
FACHADA EXISTENTE A PRESERVAR
AutoCAD SHX Text
MICROESTACAS N80 (API5A) 127.0X9mm (FURAÇÃO 8") COM UNIÕES EXTERIORES
AutoCAD SHX Text
VIGAS DE RECALÇAMENTO
AutoCAD SHX Text
ZG4
AutoCAD SHX Text
ZG3
AutoCAD SHX Text
ZG2
AutoCAD SHX Text
ZG1
AutoCAD SHX Text
75.55
AutoCAD SHX Text
Piso -1
AutoCAD SHX Text
70.46
AutoCAD SHX Text
Piso -2
AutoCAD SHX Text
68.06
AutoCAD SHX Text
Piso -3
AutoCAD SHX Text
MICROESTACAS N80 (API5A) 127.0X9mm (FURAÇÃO 8") COM UNIÕES EXTERIORES
AutoCAD SHX Text
PAREDE MEEIRA A PRESERVAR
AutoCAD SHX Text
72.81
AutoCAD SHX Text
Piso intermédio
AutoCAD SHX Text
?
AutoCAD SHX Text
?
AutoCAD SHX Text
?
AutoCAD SHX Text
?
AutoCAD SHX Text
?
AutoCAD SHX Text
?
AutoCAD SHX Text
?
AutoCAD SHX Text
?
AutoCAD SHX Text
HEB 140 (CONTENÇÃO DE FACHADA)
AutoCAD SHX Text
78.41
AutoCAD SHX Text
Piso 0
AutoCAD SHX Text
HEB 140 (CONTENÇÃO DE FACHADA)
AutoCAD SHX Text
HEB 140 (CONTENÇÃO DE FACHADA)
AutoCAD SHX Text
HEB 140 (CONTENÇÃO DE FACHADA)
AutoCAD SHX Text
89.82
AutoCAD SHX Text
Piso 4
AutoCAD SHX Text
81.53
AutoCAD SHX Text
84.35
AutoCAD SHX Text
86.93
AutoCAD SHX Text
Piso 1
AutoCAD SHX Text
Piso 2
AutoCAD SHX Text
Piso 3
AutoCAD SHX Text
Troços de laje a executar com a escavação
AutoCAD SHX Text
PLANTA DE LOCALIZAÇÃO:
AutoCAD SHX Text
PRAÇA DO PRINCIPE REAL
AutoCAD SHX Text
EDIFÍCIO VIZINHO COM 5 PISOS ELEVADOS E 1 CAVE
AutoCAD SHX Text
EDIFÍCIO VIZINHO (RUA DA ESCOLA POLITÉCNICA 34) COM 5 PISOS ELEVADOS E SEM CAVES
AutoCAD SHX Text
EDIFÍCIO VIZINHO COM TERRAÇO E 2 CAVES
AutoCAD SHX Text
EDIFÍCIO VIZINHO COM TERRAÇO (NO PISO -1) E 3 CAVES (ATÉ PISO -4)
AutoCAD SHX Text
EDIFÍCIO VIZINHO (RUA DA ESCOLA POLITÉCNICA 32) COM 4 PISOS ELEVADOS E COBERTURA E COM 1 CAVE (A CONFIRMAR)
AutoCAD SHX Text
EDIFÍCIO VIZINHO COM TERRAÇO, 1 PISO ELEVADO E 1 CAVE