45
© 2013 Iridium Technology LLC Business Intelligence for Law Firms. Period Excel 2013 for Business Intelligence (Part 1) Tom Jones – President, Iridium Technology LLC

© 2013 Iridium Technology LLC Business Intelligence for Law Firms. Period
Excel 2013 for Business Intelligence
(Part 1)
Tom Jones – President, Iridium Technology LLC
Why Two Parts?
Two factors
Huge interest from ILTA members
Huge number of cool new features
Part 1
Overview of the new features
Demos of basic analysis features
Part 2
(If scheduled due to popular demand)
Deep dive on advanced analysis features

Introduction – Iridium
Technology
“Business Intelligence for Law Firms. Period.”
Founded in 2009
9-member team 100% focused on BI for Law Firms:
BI implementations
Profitability and GL cubes
Custom BI projects
SSRS Reports and Dashboards
27 Clients in all regions
25,000 hours of experience with BI for law firms
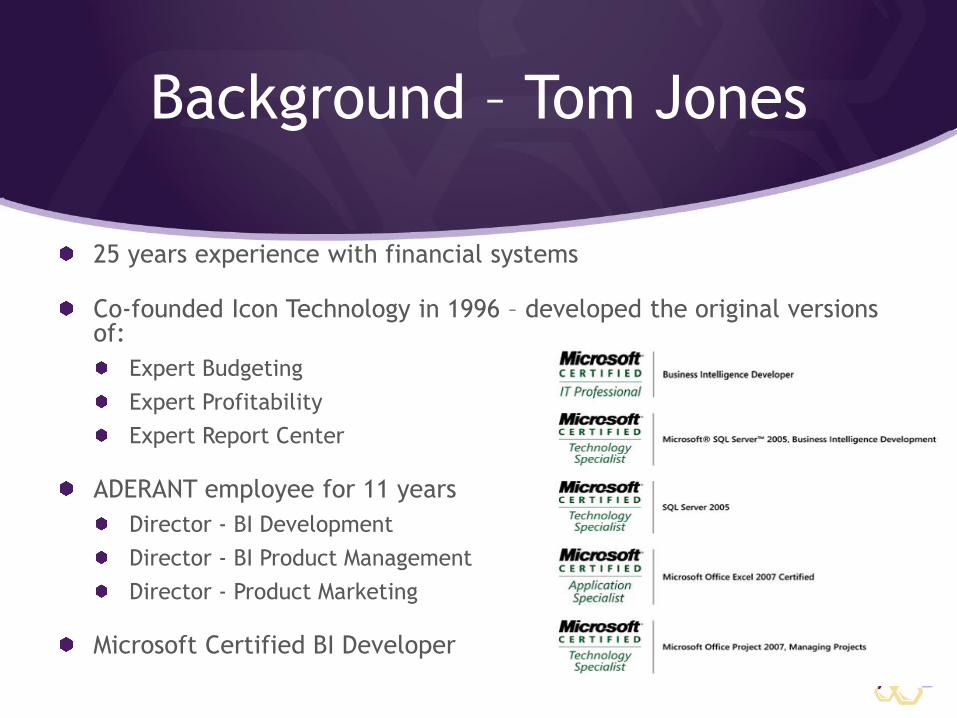
Background – Tom Jones
25 years experience with financial systems
Co-founded Icon Technology in 1996 – developed the original versions of:
Expert Budgeting
Expert Profitability
Expert Report Center
ADERANT employee for 11 years
Director - BI Development
Director - BI Product Management
Director - Product Marketing
Microsoft Certified BI Developer
References
Google “Microsoft What’s New in Excel 2013”
© 2013 Iridium Technology LLC Business Intelligence for Law Firms. Period
Cool New Features –
Round 1 (No Demo – Just Slides)

SkyDrive Integration
What the heck is SkyDrive?
7 GB of free cloud storage that's accessible from
anywhere.
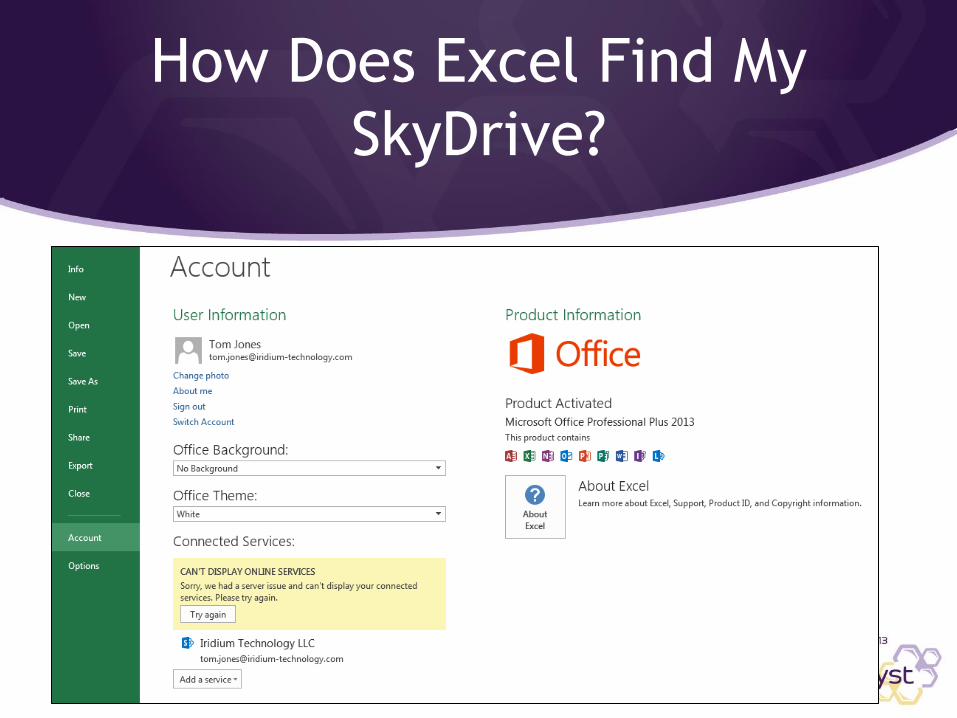
How Does Excel Find My
SkyDrive?

Managing Add-ins
This is where you
enable
PowerView,
Solver, etc.
You should disable
anything you
don’t need
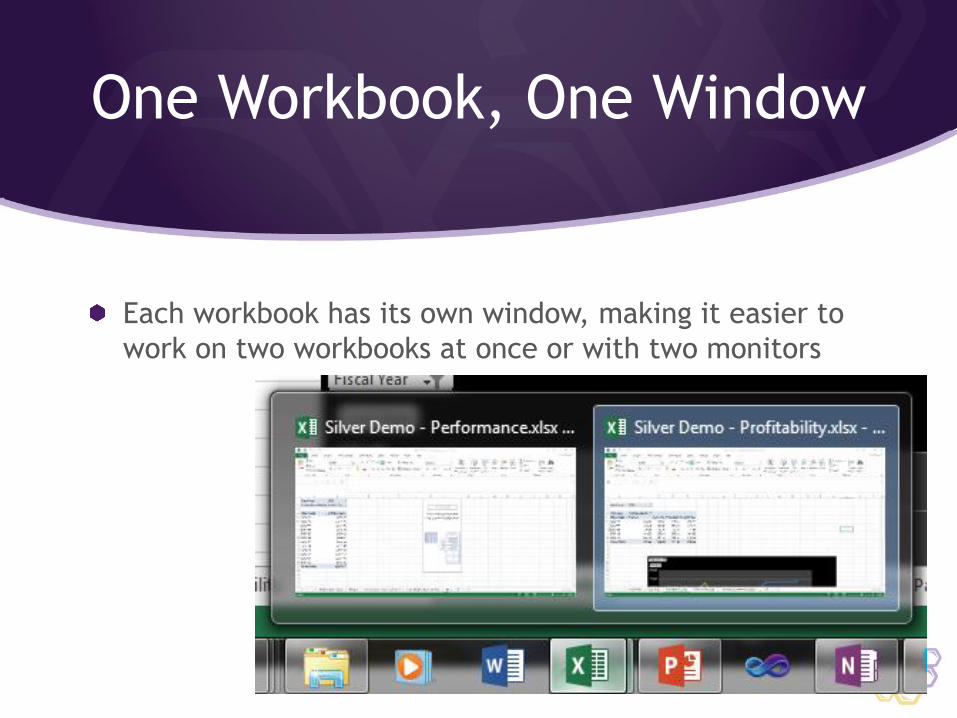
One Workbook, One Window
Each workbook has its own window, making it easier to
work on two workbooks at once or with two monitors

New Functions
About 50 new functions…
… 45 of which you will probably never use!
But these looked good to me:

Licensing / Office 365
Subscription based Microsoft Software
$6/month/user for SharePoint, Exchange, Lync, etc.
$15/month/user including Office
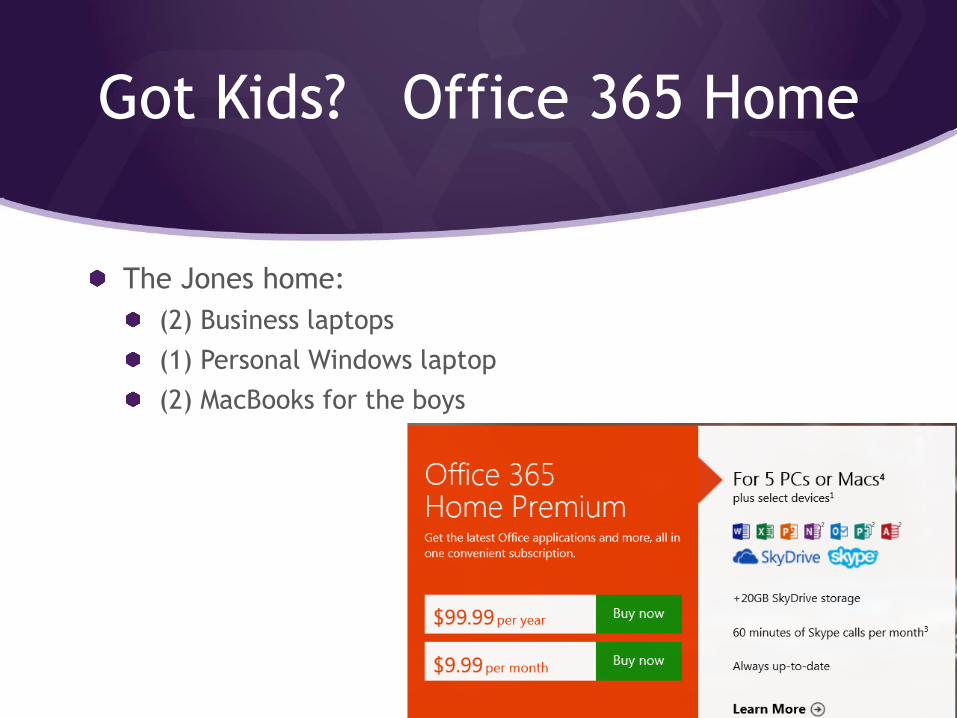
Got Kids? Office 365 Home
The Jones home:
(2) Business laptops
(1) Personal Windows laptop
(2) MacBooks for the boys
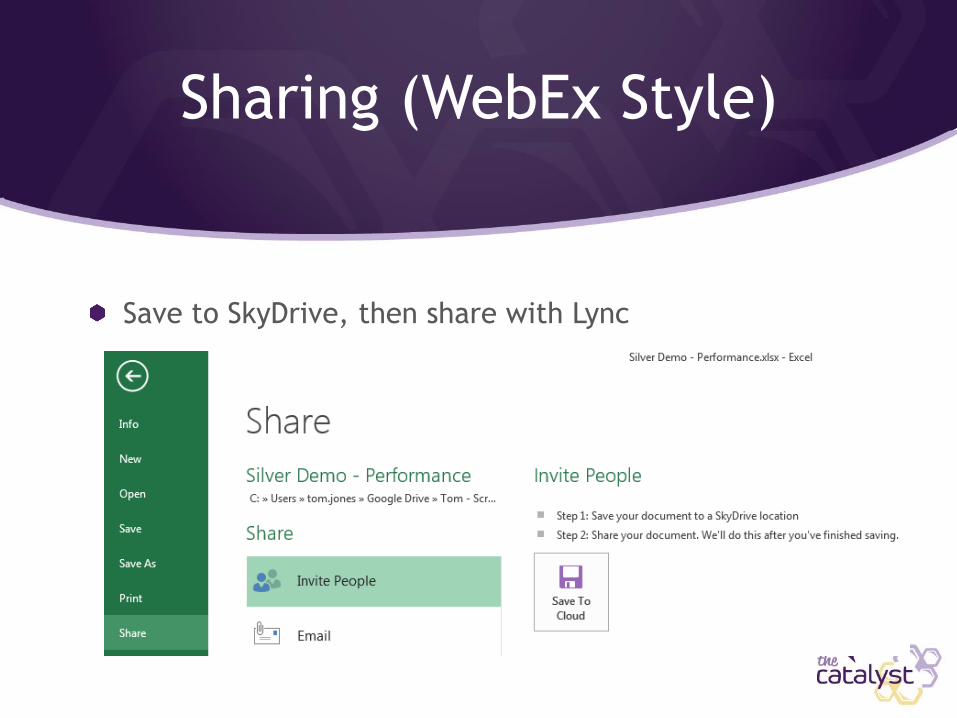
Sharing (WebEx Style)
Save to SkyDrive, then share with Lync
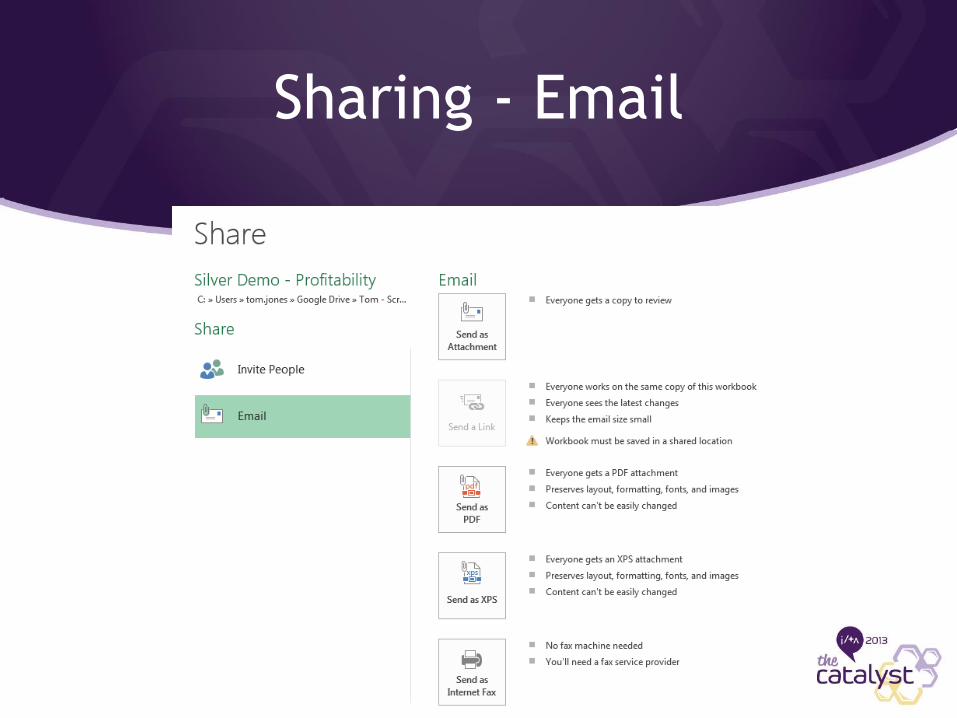
Sharing - Email
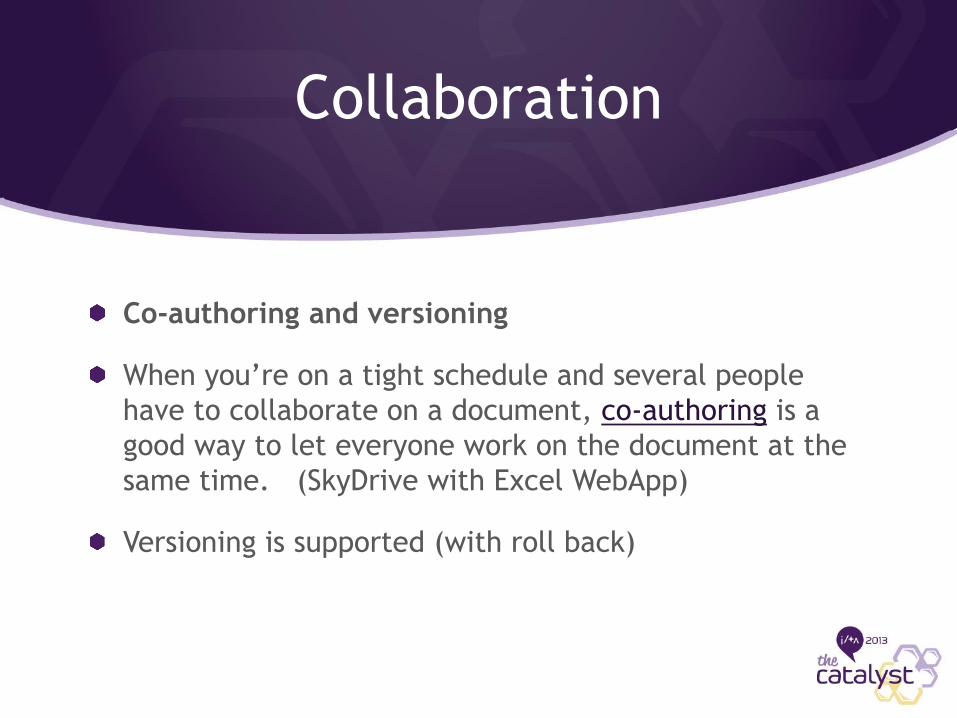
Collaboration
Co-authoring and versioning
When you’re on a tight schedule and several people
have to collaborate on a document, co-authoring is a
good way to let everyone work on the document at the
same time. (SkyDrive with Excel WebApp)
Versioning is supported (with roll back)

© 2013 Iridium Technology LLC Business Intelligence for Law Firms. Period
Microsoft’s Response to
Tom’s Pet Peeves in
Excel 2010…
Iridium Query of the Day (“QOTD”)
Program
QOTD is part of Iridium’s training curriculum
23 lessons to get our clients to “expert” level in analysis
Focused on building pivot tables connected to a cube
QOTD #14: Pet Peeves…

Pet Peeve #1: Poor Cube
Navigation in Excel
Excel 2010 SQL Server Mgmt Studio Excel 2013 (Partially Fixed)

Pet Peeve #2: ‘Not all items
showing’ error when filtering over
10,000 rows of data
Not fixed in Excel
2013
Workaround exists
(filtering)
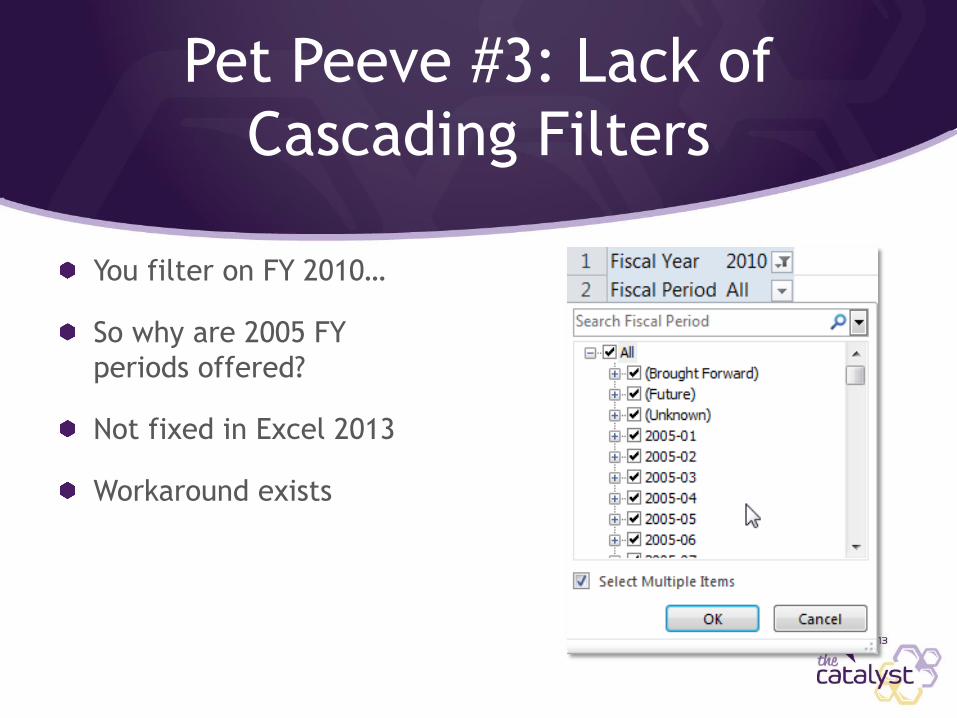
Pet Peeve #3: Lack of
Cascading Filters
You filter on FY 2010…
So why are 2005 FY
periods offered?
Not fixed in Excel 2013
Workaround exists

Pet Peeve #4: Slow Filtering Large
Dimensions
With large dimensions, “Keep
Only Selected Items” is very
slow
Fixed in Excel 2013!
This one feature is worth
upgrading for if you are a
power user

© 2013 Iridium Technology LLC Business Intelligence for Law Firms. Period
Cool New Features –
Round 2 (No Demo – Just Slides)

New Look and Feel
Microsoft “Metro” Style
Very minimalist
No shadows, round button edges,
etc.
Most people either love it or
hate it
Applied to all Office 2013
products

Fewer Dialog Boxes
Dialog boxes have been
replaced with “task
panes”
Task panes remain open
until closed or
overwritten
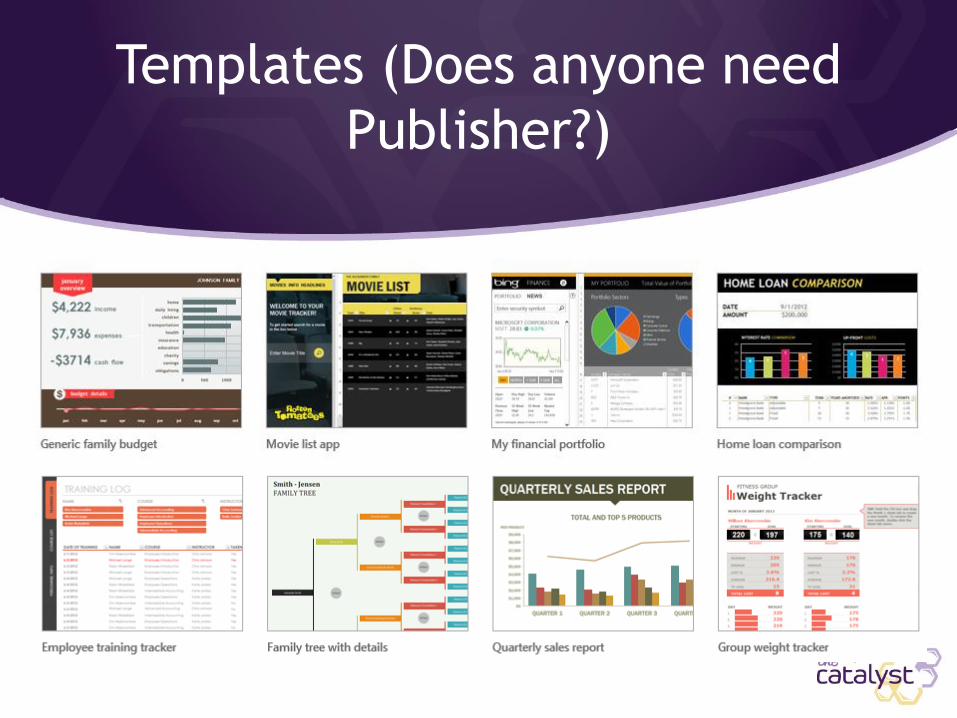
Templates (Does anyone need
Publisher?)
File / New…
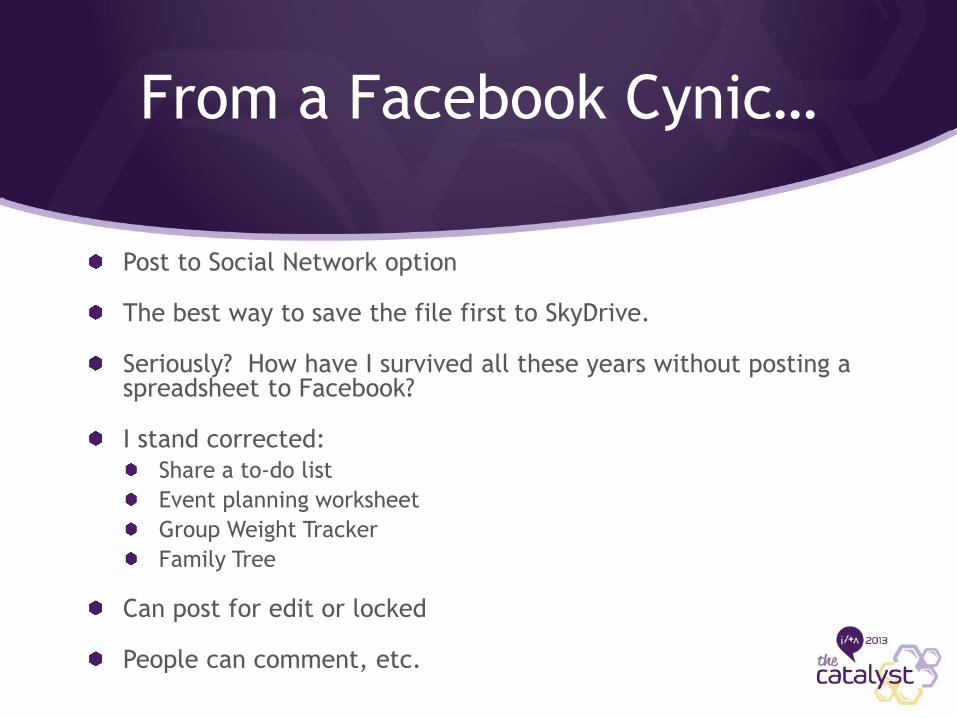
From a Facebook Cynic…
Post to Social Network option
The best way to save the file first to SkyDrive.
Seriously? How have I survived all these years without posting a spreadsheet to Facebook?
I stand corrected:
Share a to-do list
Event planning worksheet
Group Weight Tracker
Family Tree
Can post for edit or locked
People can comment, etc.
(Digression) My Favorite New
Office 2013 Features
And the winners are…
#1: In Outlook 2013, it will warn you if you try to send an email without an attachment
#2: In OneNote 2013 you can now cut and paste rows and columns in tables
#3: OneNote and SharePoint are now synched so I don’t have to log in every time
#4: Excel 2013 Flash Fill and Quick Analysis
#5: Plus that filtering bug in Excel
© 2013 Iridium Technology LLC Business Intelligence for Law Firms. Period
Cool Features – Mini
Demos
Tables (2010/2013)
My favorite feature that not enough people use
A Table is not a Pivot Table
Improved features in 2013
Features
Total Row
Formulas applied to columns
Styles
Data Validation
Conditional Formatting
Tab to insert
(Table Tools, Convert to Range to remove table)

Quick Analysis
Quick Analysis tool lets you convert your data into a chart or table in two steps or less. You can preview the data and make your choice in one click.
You can instantly create different types of charts, including line and column charts, or add miniature graphs (called sparklines).
You can also apply a table style, create PivotTables, quickly insert totals, and apply conditional formatting.
Everything performed by Quick Analysis can be done manually
(Digression) Turning Off
GETPIVOTDATA()
GETPIVOTDATA() function is
Evil
Awkward
Misleading

Slicers
Previously slicers were only
available for PivotTable data
Now slicers can also filter
data in Excel tables, query
tables, and other data tables
Slicers show the current
filter so you’ll know exactly
what data you’re looking at
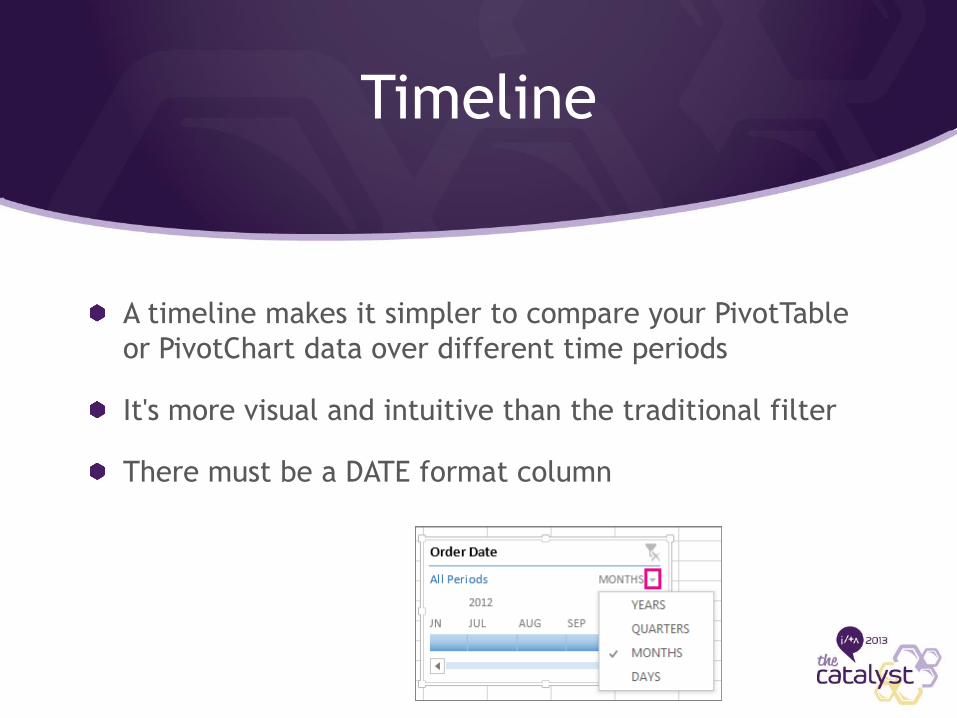
Timeline
A timeline makes it simpler to compare your PivotTable
or PivotChart data over different time periods
It's more visual and intuitive than the traditional filter
There must be a DATE format column
Charts Made Easier
Formatting, picking and previewing changes to chart
elements are quicker and easier
With Chart Recommendations, Excel will recommend
the most suitable charts with for data with previews
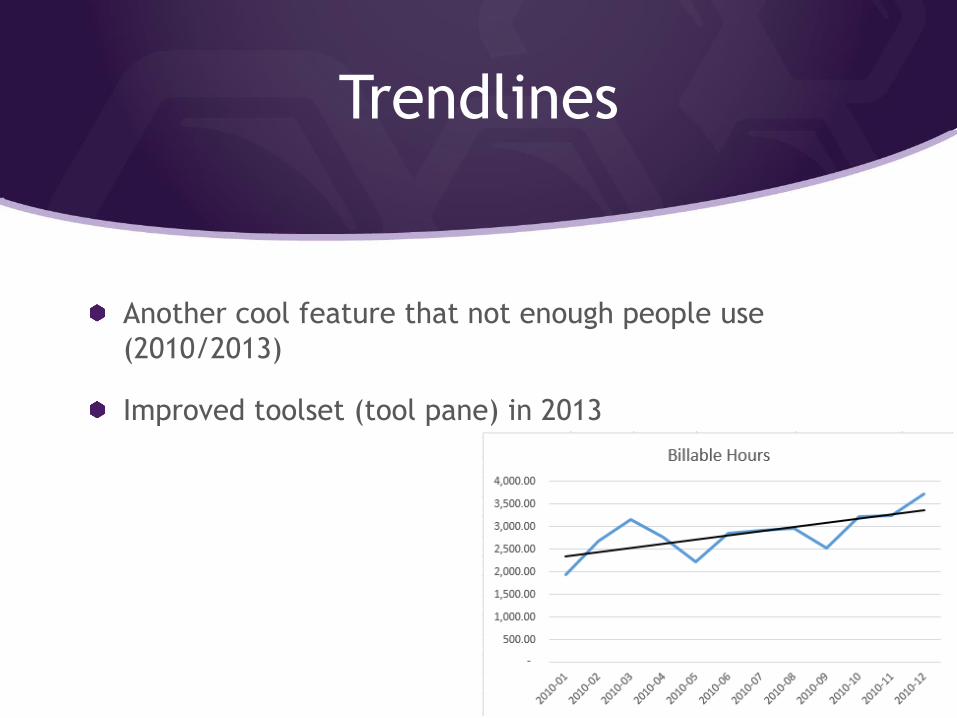
Trendlines
Another cool feature that not enough people use
(2010/2013)
Improved toolset (tool pane) in 2013
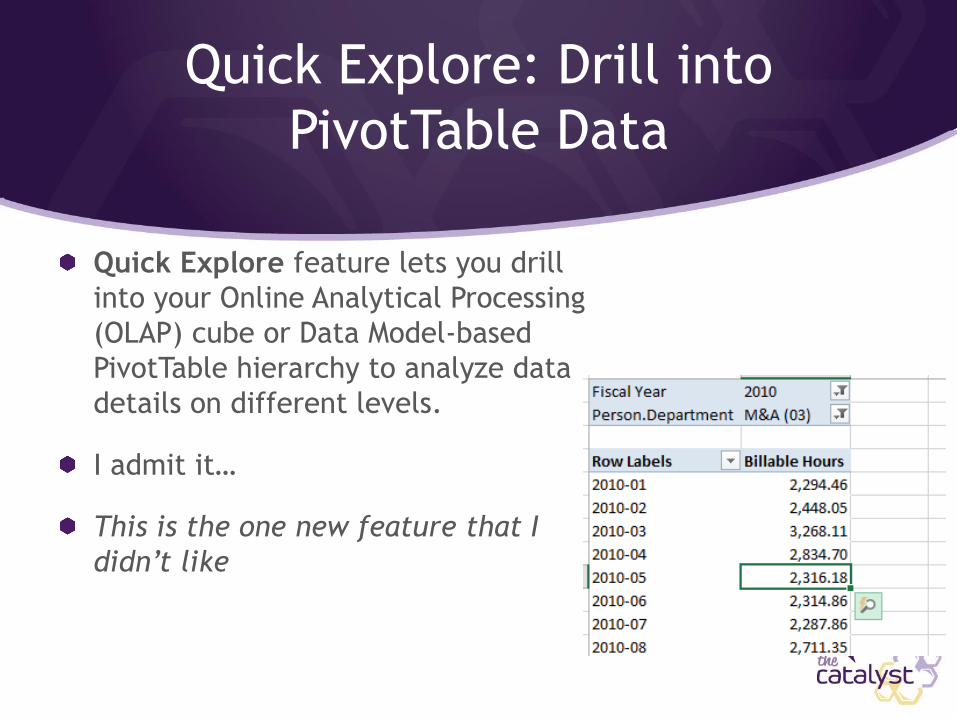
Quick Explore: Drill into
PivotTable Data
Quick Explore feature lets you drill
into your Online Analytical Processing
(OLAP) cube or Data Model-based
PivotTable hierarchy to analyze data
details on different levels.
I admit it…
This is the one new feature that I
didn’t like
Ad-hoc Querying with SSAS
Cubes
Excel is Iridium’s preferred query tool for working with
SSAS Cubes
Excel 2013 offers tighter integration with SQL Server
We strongly encourage our clients to use Excel 2013

© 2013 Iridium Technology LLC Business Intelligence for Law Firms. Period
Topics for Part 2… (and jumping in as time allows)

Multiple Tables in Data Analysis
If you have relational data, you can immediately build a PivotTable based on related tables as soon as you import the data
When you import from a relational database, you can import multiple tables simultaneously.
You can also import tables individually from the same or different data sources, add them to a Data Model in Excel, create relationships, and then use that Data Model to drive a PivotTable

Calculated Members and
Measures
You can create and manage calculated members and
measures right in Excel without having to reach for
Excel Object Model
A new drag/drop GUI greatly simplifies creation and
management of all of your calculated members and
measures

MDX Query Designer
(PowerPivot)
With PowerPivot add-in, you can build an MDX query
using the MDX Query Designer when you import from a
multidimensional database running on Analysis Services
When you edit an MDX query, the graphical MDX query
designer opens in Design mode. The query designer
toolbar provides buttons to help you design MDX queries
using the graphical interface
Power View
Simply click the Power View button on the ribbon to
discover insights about your data with highly
interactive, powerful data exploration, visualization,
and presentation features that are easy to apply
Power View lets you create and interact with charts,
slicers, and other data visualizations in a single sheet

Standalone PivotChart
A PivotChart no longer has to be associated with a
PivotTable
A standalone or de-coupled PivotChart lets you
experience new ways to navigate to data details by
using the new Drill Down, and Drill Up features

Closing
Slide deck is available
I hope you will join me for Part 2!
Questions?
www.iridium-technology.com
“Iridium Update” Newsletter
Thank you!
Call us any time – Free consultations


