Bloomberg has an excel add-in tool which allows users to download current information, historical
information and bulk data to their excel spreadsheets.
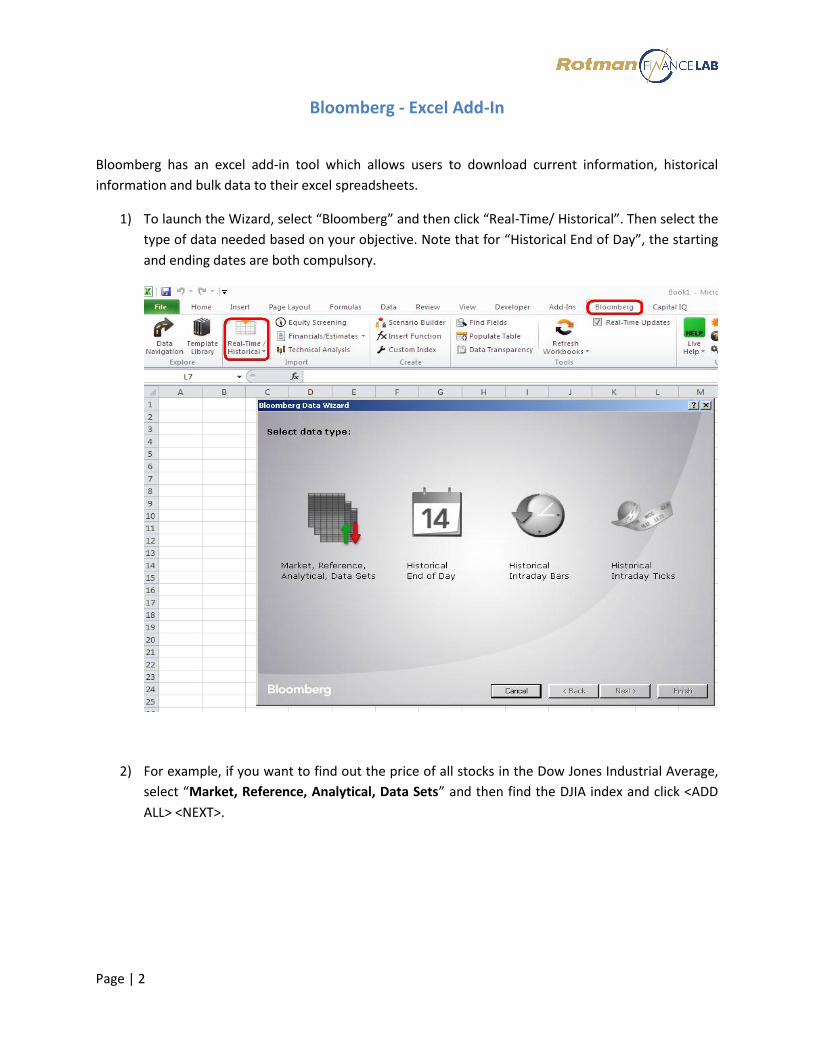
1) To launch the Wizard, select “Bloomberg” and then click “Real-Time/ Historical”. Then select the
type of data needed based on your objective. Note that for “Historical End of Day”, the starting
and ending dates are both compulsory.
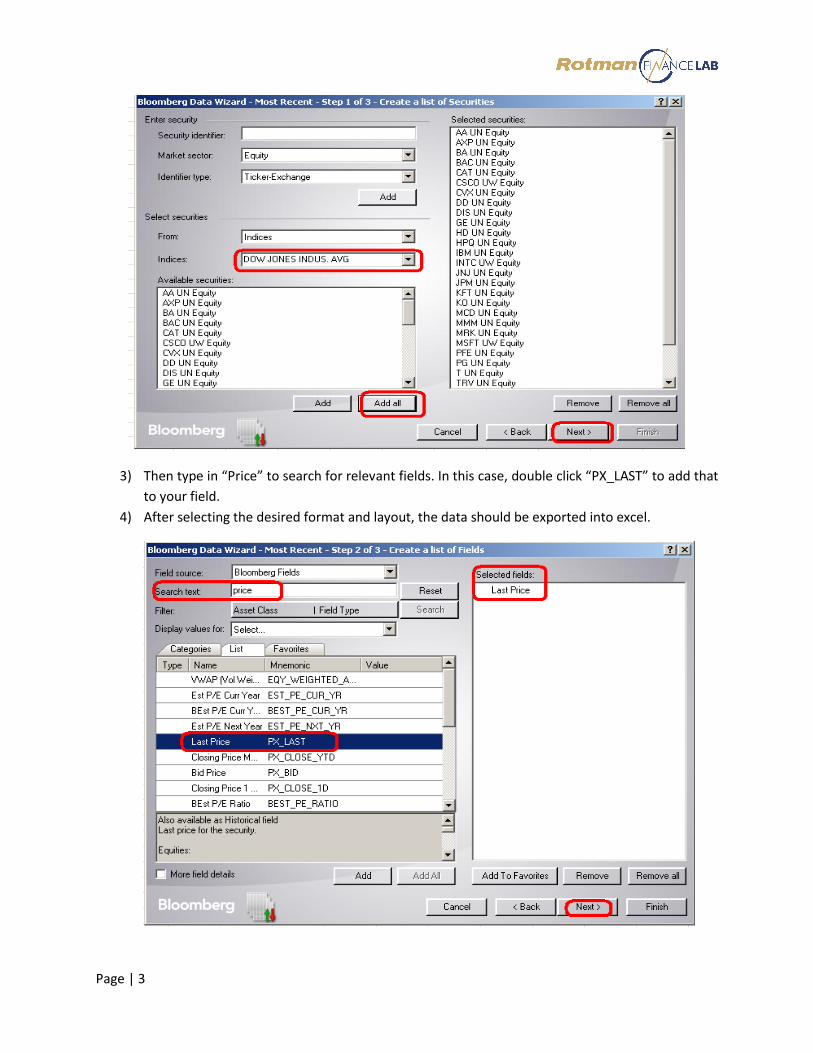
2) For example, if you want to find out the price of all stocks in the Dow Jones Industrial Average,
select “Market, Reference, Analytical, Data Sets” and then find the DJIA index and click <ADD
ALL> <NEXT>.
Page | 3
3) Then type in “Price” to search for relevant fields. In this case, double click “PX_LAST” to add that
to your field.
4) After selecting the desired format and layout, the data should be exported into excel.
Page | 4
Obtaining Real-Time Quotes
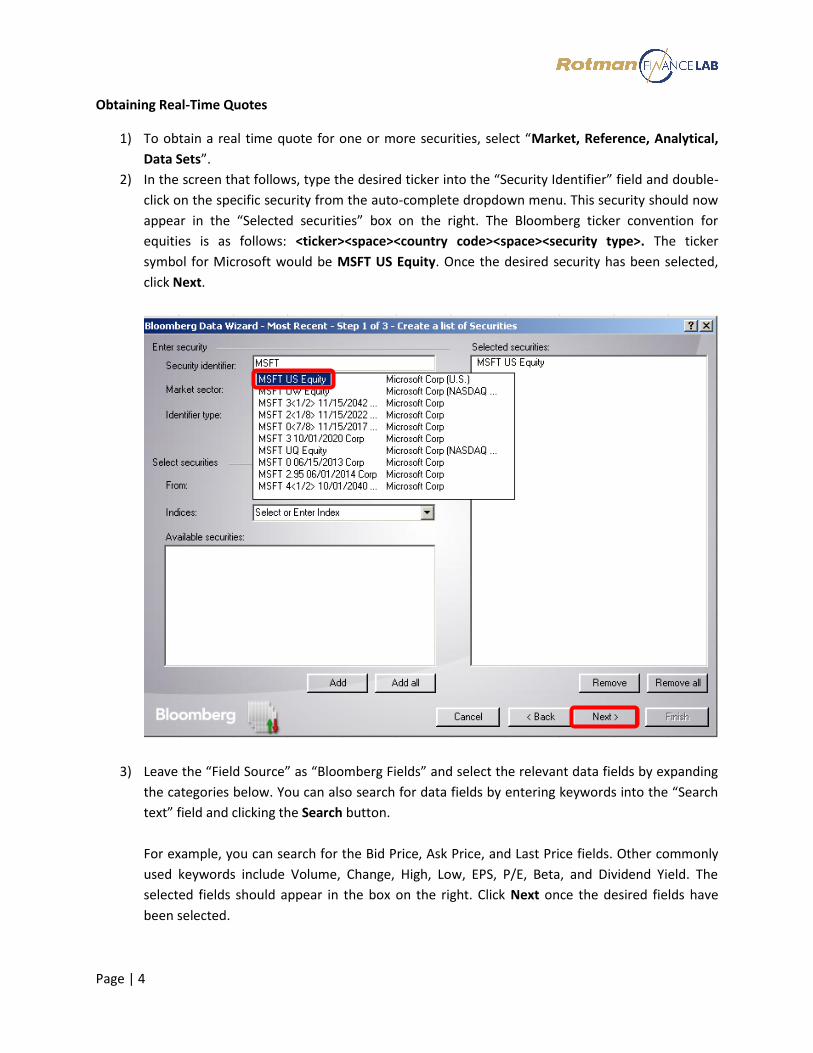
1) To obtain a real time quote for one or more securities, select “Market, Reference, Analytical,
Data Sets”.
2) In the screen that follows, type the desired ticker into the “Security Identifier” field and double-
click on the specific security from the auto-complete dropdown menu. This security should now
appear in the “Selected securities” box on the right. The Bloomberg ticker convention for
equities is as follows: <ticker><space><country code><space><security type>. The ticker
symbol for Microsoft would be MSFT US Equity. Once the desired security has been selected,
click Next.
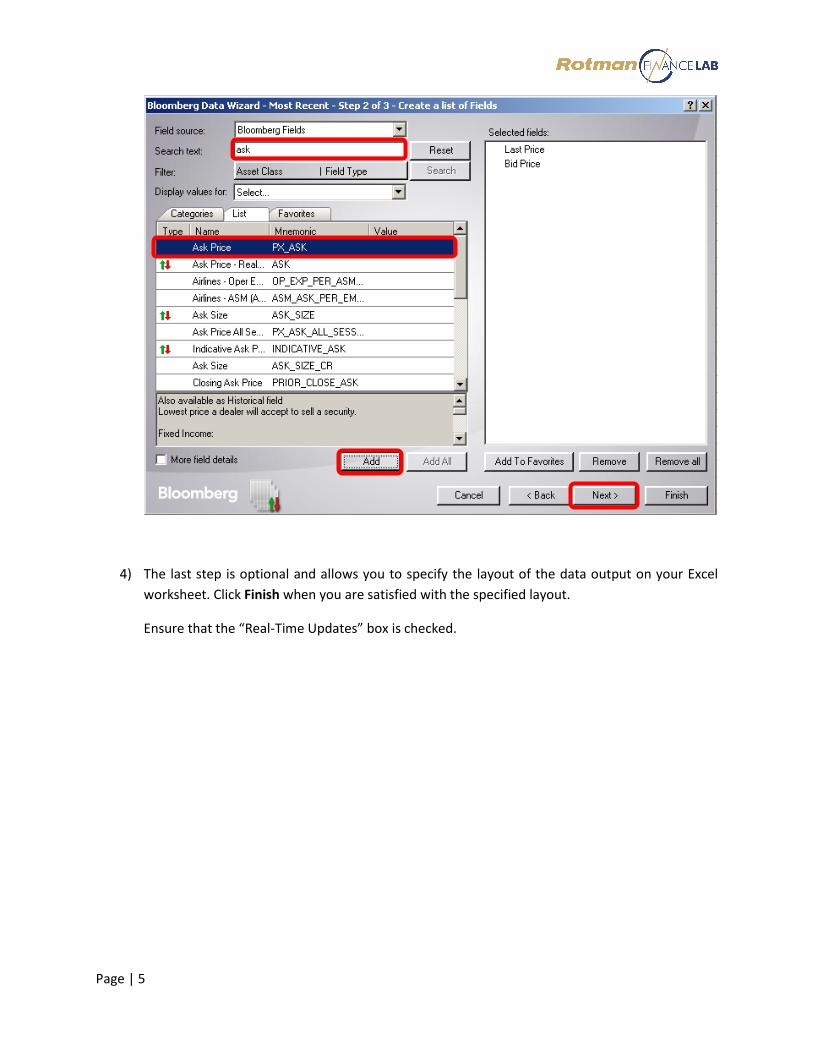
3) Leave the “Field Source” as “Bloomberg Fields” and select the relevant data fields by expanding
the categories below. You can also search for data fields by entering keywords into the “Search
text” field and clicking the Search button.
For example, you can search for the Bid Price, Ask Price, and Last Price fields. Other commonly
used keywords include Volume, Change, High, Low, EPS, P/E, Beta, and Dividend Yield. The
selected fields should appear in the box on the right. Click Next once the desired fields have
been selected.
Page | 5
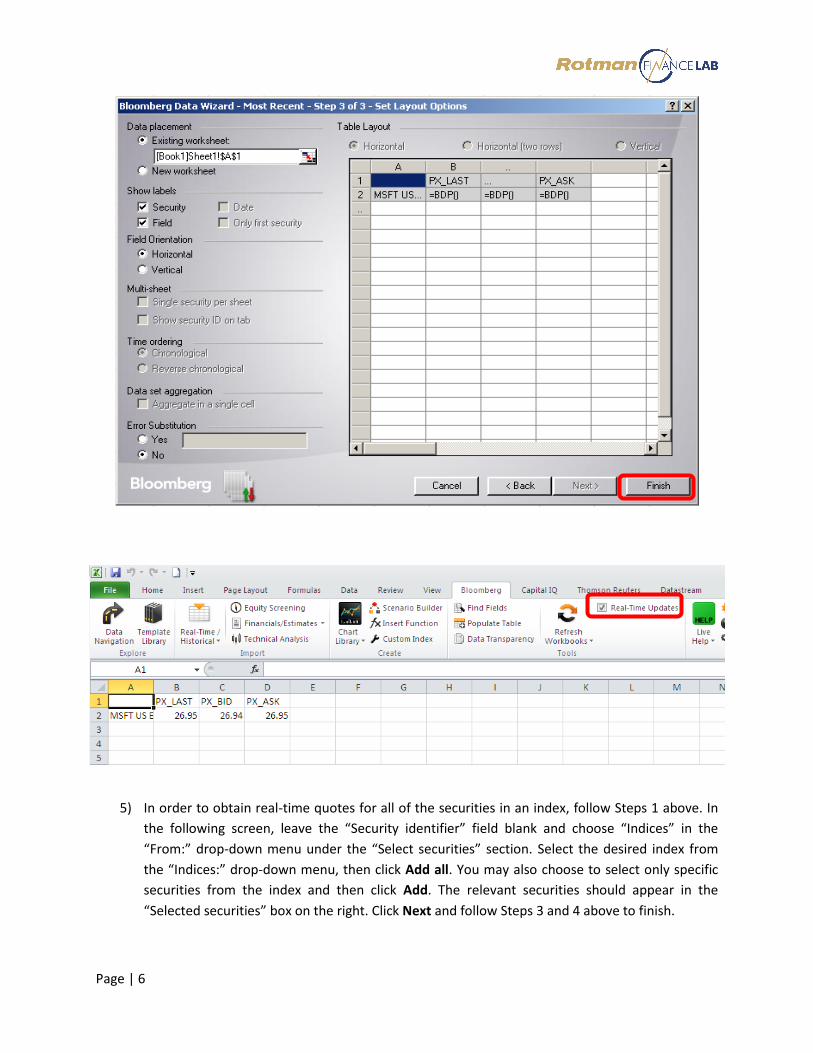
4) The last step is optional and allows you to specify the layout of the data output on your Excel
worksheet. Click Finish when you are satisfied with the specified layout.
Ensure that the “Real-Time Updates” box is checked.
Page | 6
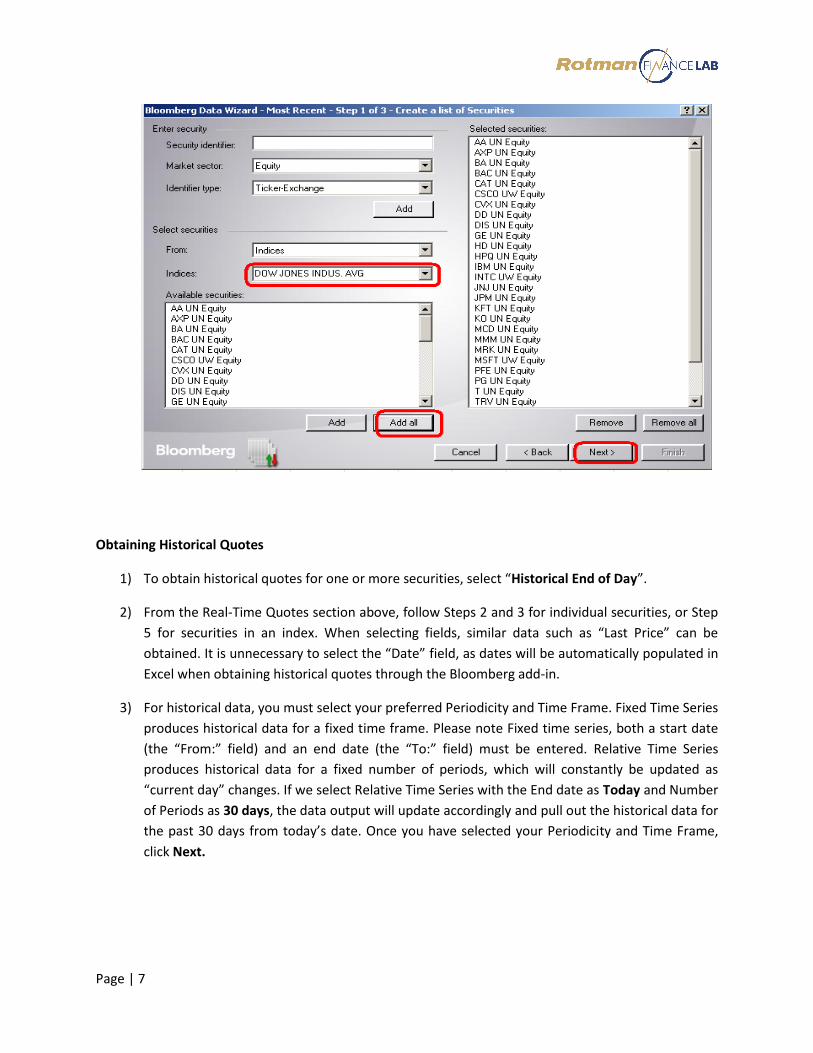
5) In order to obtain real-time quotes for all of the securities in an index, follow Steps 1 above. In
the following screen, leave the “Security identifier” field blank and choose “Indices” in the
“From:” drop-down menu under the “Select securities” section. Select the desired index from
the “Indices:” drop-down menu, then click Add all. You may also choose to select only specific
securities from the index and then click Add. The relevant securities should appear in the
“Selected securities” box on the right. Click Next and follow Steps 3 and 4 above to finish.
Page | 7
Obtaining Historical Quotes
1) To obtain historical quotes for one or more securities, select “Historical End of Day”.
2) From the Real-Time Quotes section above, follow Steps 2 and 3 for individual securities, or Step
5 for securities in an index. When selecting fields, similar data such as “Last Price” can be
obtained. It is unnecessary to select the “Date” field, as dates will be automatically populated in
Excel when obtaining historical quotes through the Bloomberg add-in.
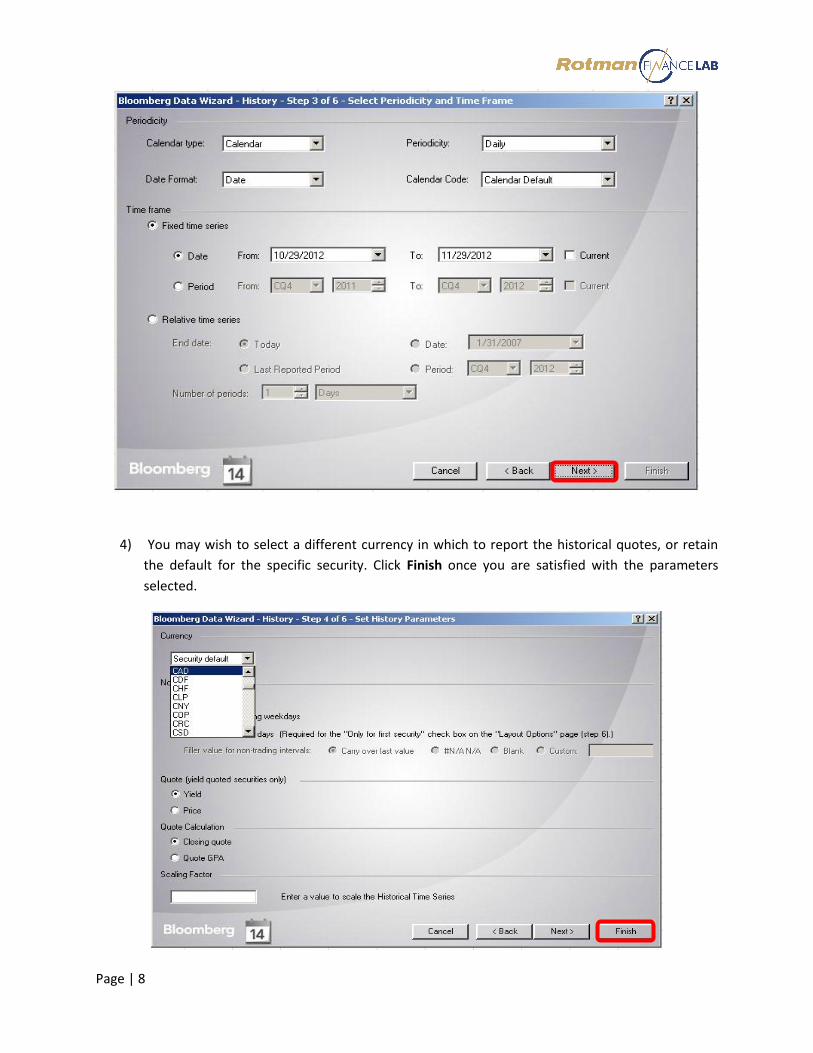
3) For historical data, you must select your preferred Periodicity and Time Frame. Fixed Time Series
produces historical data for a fixed time frame. Please note Fixed time series, both a start date
(the “From:” field) and an end date (the “To:” field) must be entered. Relative Time Series
produces historical data for a fixed number of periods, which will constantly be updated as
“current day” changes. If we select Relative Time Series with the End date as Today and Number
of Periods as 30 days, the data output will update accordingly and pull out the historical data for
the past 30 days from today’s date. Once you have selected your Periodicity and Time Frame,
click Next.
Page | 8
4) You may wish to select a different currency in which to report the historical quotes, or retain
the default for the specific security. Click Finish once you are satisfied with the parameters
selected.
Page | 9
Datastream - Excel Add-in
What does the Datastream Excel Add-in do?
The excel Add-in allows you to access the Datastream database directly from within Microsoft Excel. Using excel, you can create and embed data requests that put the data you want straight into your excel spreadsheet. Datastream gives you access to the world’s largest and most respected historical financial numerical database. Datastream provides a range of charting and reporting tools that enable you to manipulate and display, or simply download that data in the way that you want.
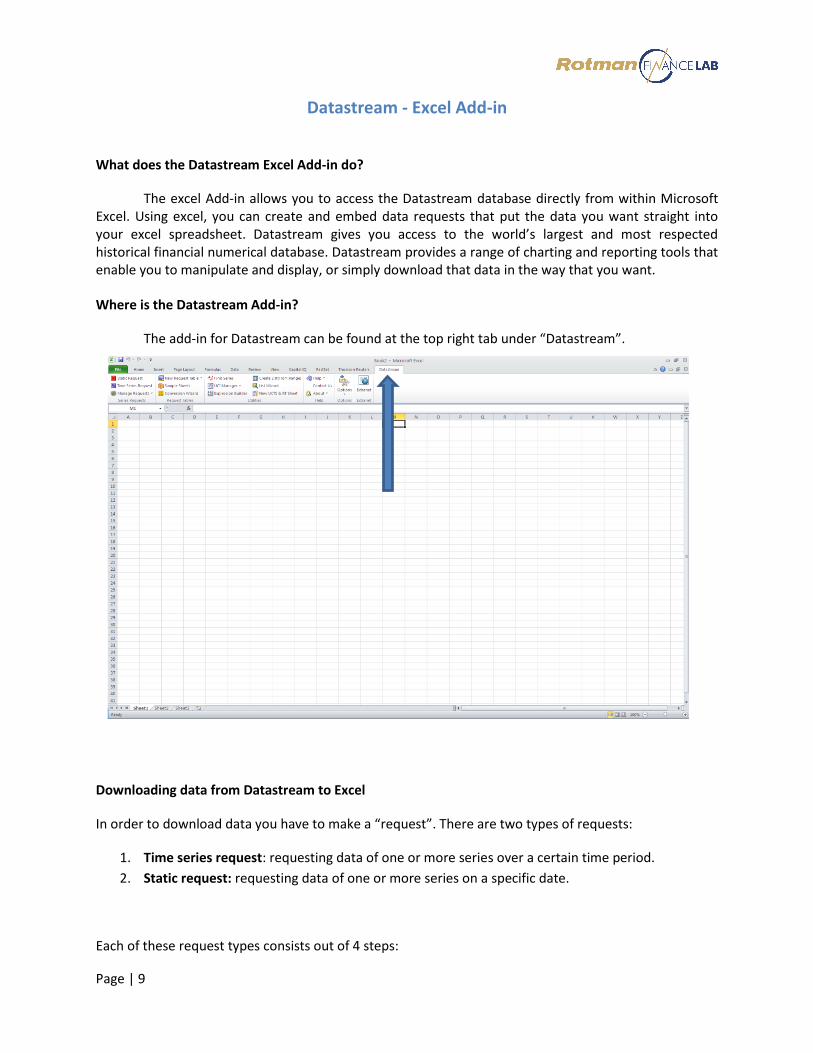
Where is the Datastream Add-in?
The add-in for Datastream can be found at the top right tab under “Datastream”.
Downloading data from Datastream to Excel
In order to download data you have to make a “request”. There are two types of requests:
1. Time series request: requesting data of one or more series over a certain time period.
2. Static request: requesting data of one or more series on a specific date.
Each of these request types consists out of 4 steps:
Page | 10
1. Enter the series for which data is needed.
2. Enter the type (datatype) of data needed.
3. Specify the date or time period over which the data is needed
4. Set options
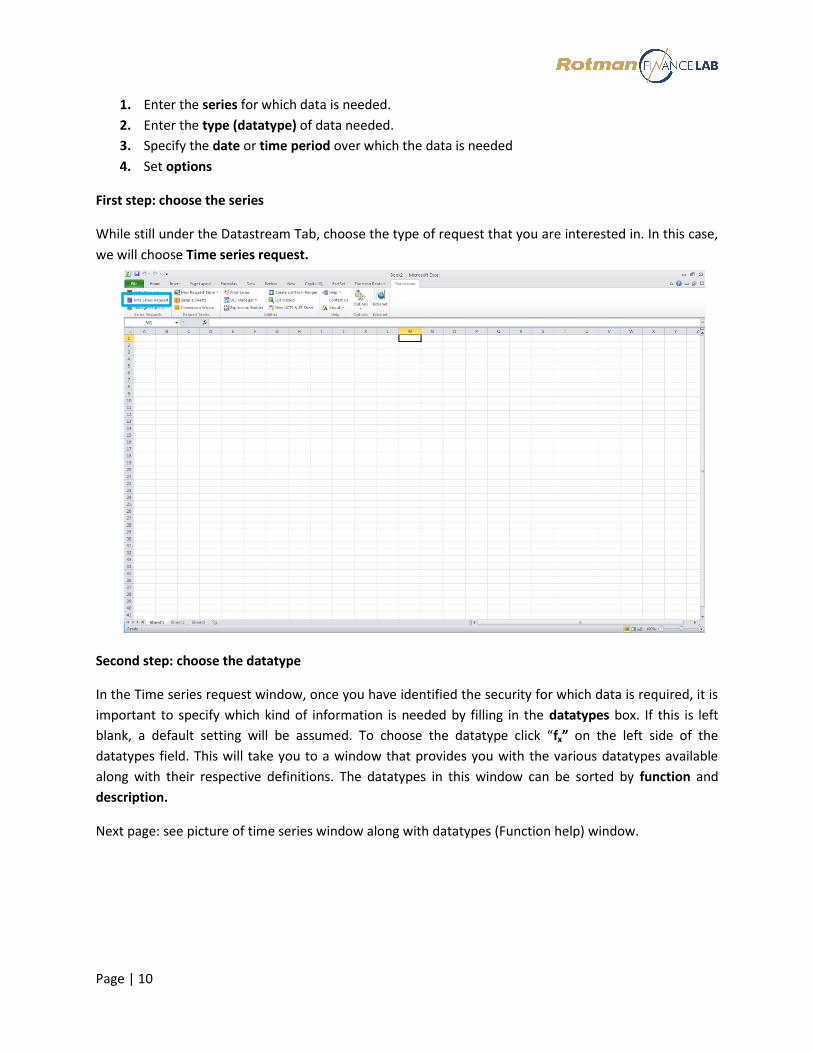
First step: choose the series
While still under the Datastream Tab, choose the type of request that you are interested in. In this case,
we will choose Time series request.
Second step: choose the datatype
In the Time series request window, once you have identified the security for which data is required, it is
important to specify which kind of information is needed by filling in the datatypes box. If this is left
blank, a default setting will be assumed. To choose the datatype click “fx” on the left side of the
datatypes field. This will take you to a window that provides you with the various datatypes available
along with their respective definitions. The datatypes in this window can be sorted by function and
description.
Next page: see picture of time series window along with datatypes (Function help) window.
Page | 11
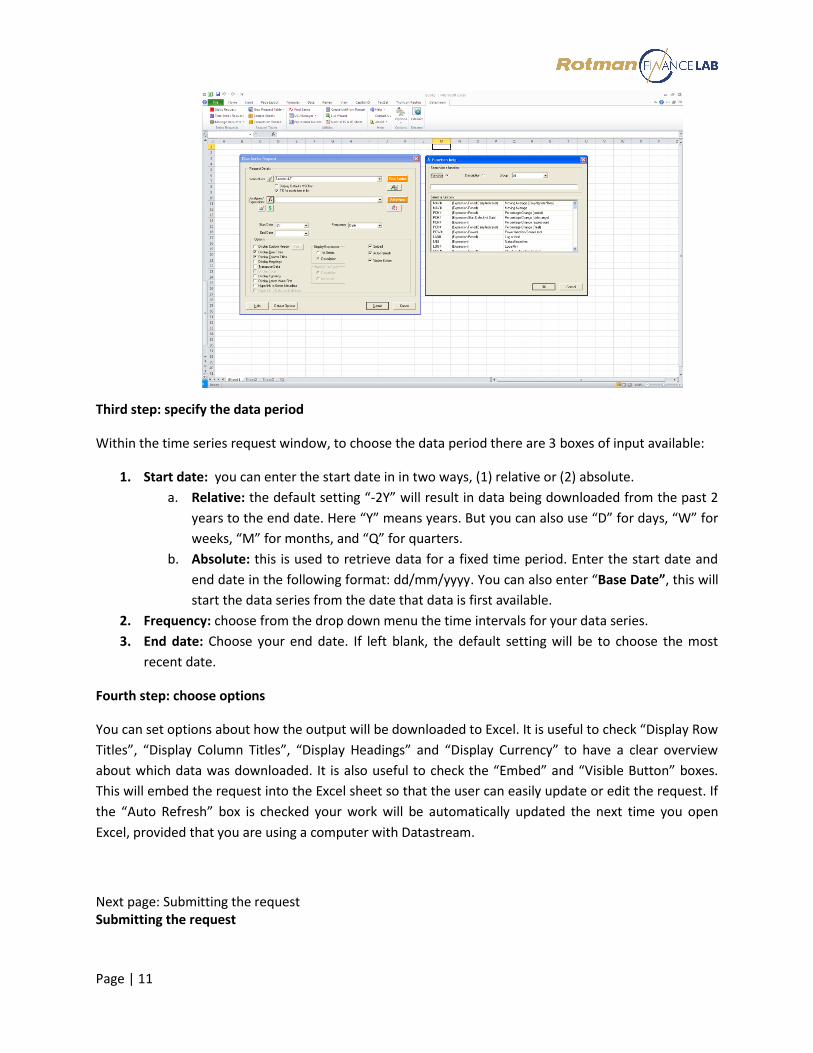
Third step: specify the data period
Within the time series request window, to choose the data period there are 3 boxes of input available:
1. Start date: you can enter the start date in in two ways, (1) relative or (2) absolute.
a. Relative: the default setting “-2Y” will result in data being downloaded from the past 2
years to the end date. Here “Y” means years. But you can also use “D” for days, “W” for
weeks, “M” for months, and “Q” for quarters.
b. Absolute: this is used to retrieve data for a fixed time period. Enter the start date and
end date in the following format: dd/mm/yyyy. You can also enter “Base Date”, this will
start the data series from the date that data is first available.
2. Frequency: choose from the drop down menu the time intervals for your data series.
3. End date: Choose your end date. If left blank, the default setting will be to choose the most
recent date.
Fourth step: choose options
You can set options about how the output will be downloaded to Excel. It is useful to check “Display Row
Titles”, “Display Column Titles”, “Display Headings” and “Display Currency” to have a clear overview
about which data was downloaded. It is also useful to check the “Embed” and “Visible Button” boxes.
This will embed the request into the Excel sheet so that the user can easily update or edit the request. If
the “Auto Refresh” box is checked your work will be automatically updated the next time you open
Excel, provided that you are using a computer with Datastream.
Next page: Submitting the request Submitting the request
Page | 12
Once the criteria above have been accomplished, it is now time to submit the request. Simply click the submit button. Datastream will download a time series for each datatypes requested. By default, all the essential information about the request is indicated in the Excel sheet. By having checked the “Embed” and “Visible” boxes, there is also a Refresh button. By clicking it, the request is updated. By right-clicking on it, you can cut, copy, or delete this request. You can also open the Editor which brings you back to the input screen.
Page | 13
FactSet - Excel Add-in
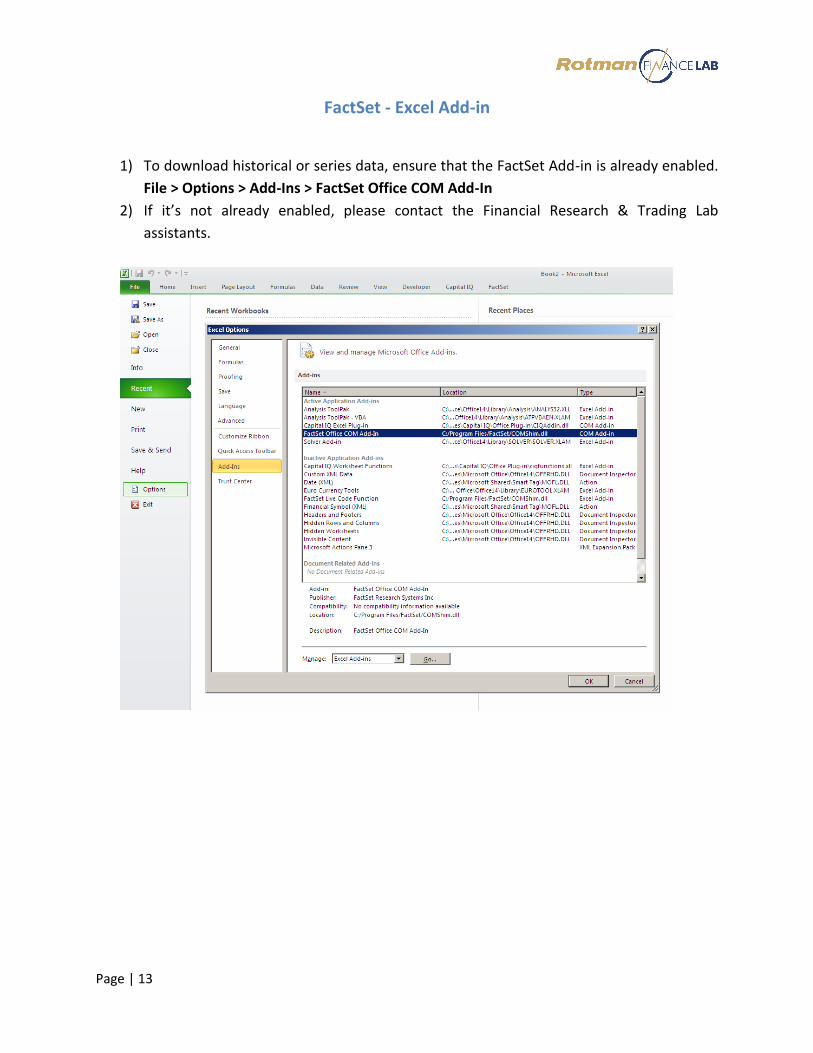
1) To download historical or series data, ensure that the FactSet Add-in is already enabled.
File > Options > Add-Ins > FactSet Office COM Add-In
2) If it’s not already enabled, please contact the Financial Research & Trading Lab
assistants.
Page | 14
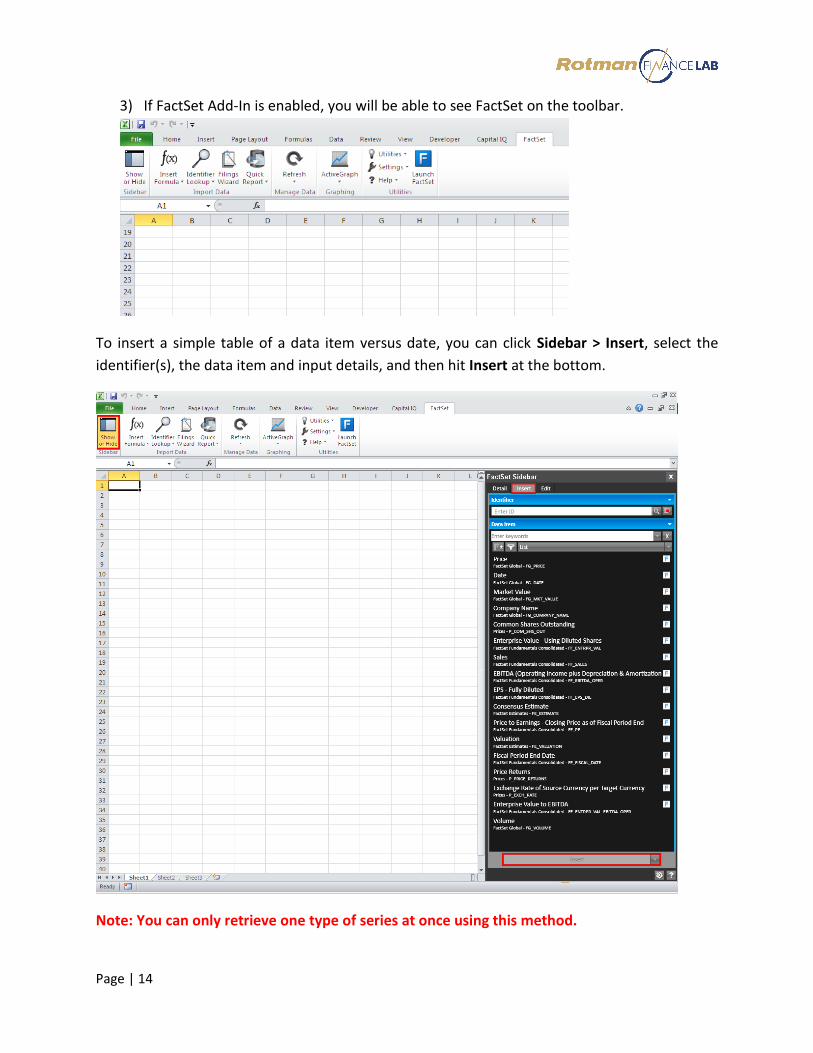
3) If FactSet Add-In is enabled, you will be able to see FactSet on the toolbar.
To insert a simple table of a data item versus date, you can click Sidebar > Insert, select the
identifier(s), the data item and input details, and then hit Insert at the bottom.
Note: You can only retrieve one type of series at once using this method.
Page | 15
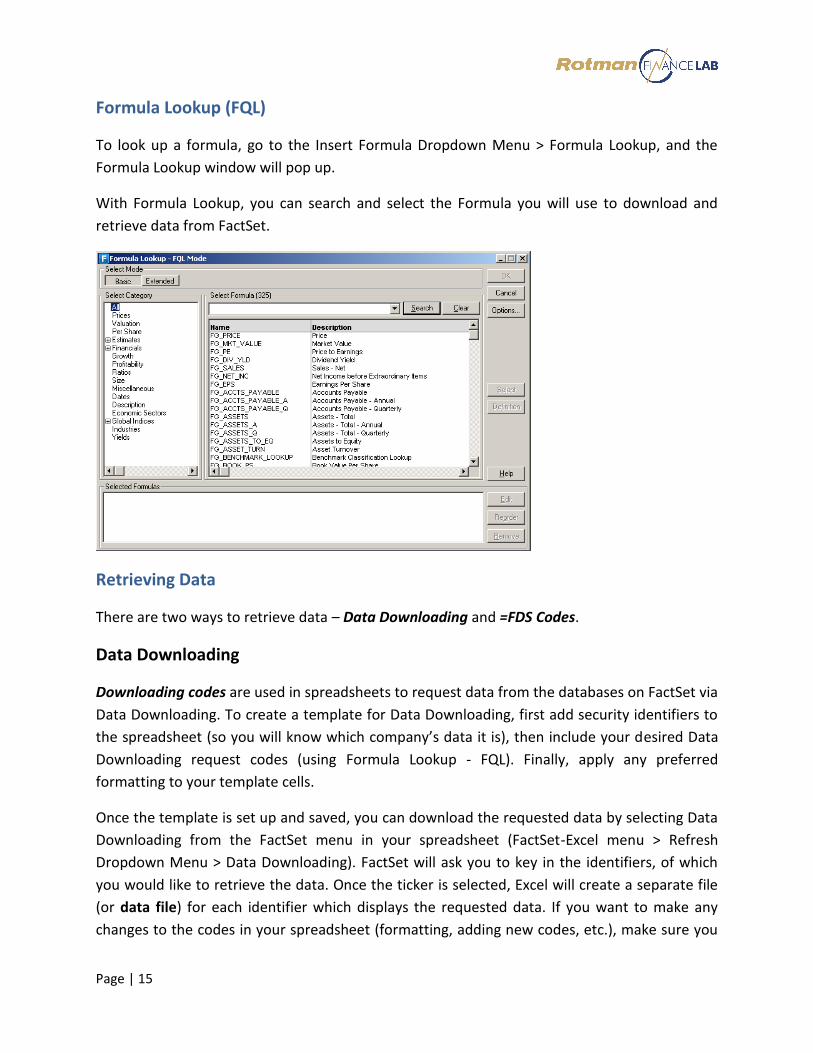
Formula Lookup (FQL)
To look up a formula, go to the Insert Formula Dropdown Menu > Formula Lookup, and the
Formula Lookup window will pop up.
With Formula Lookup, you can search and select the Formula you will use to download and
retrieve data from FactSet.
Retrieving Data
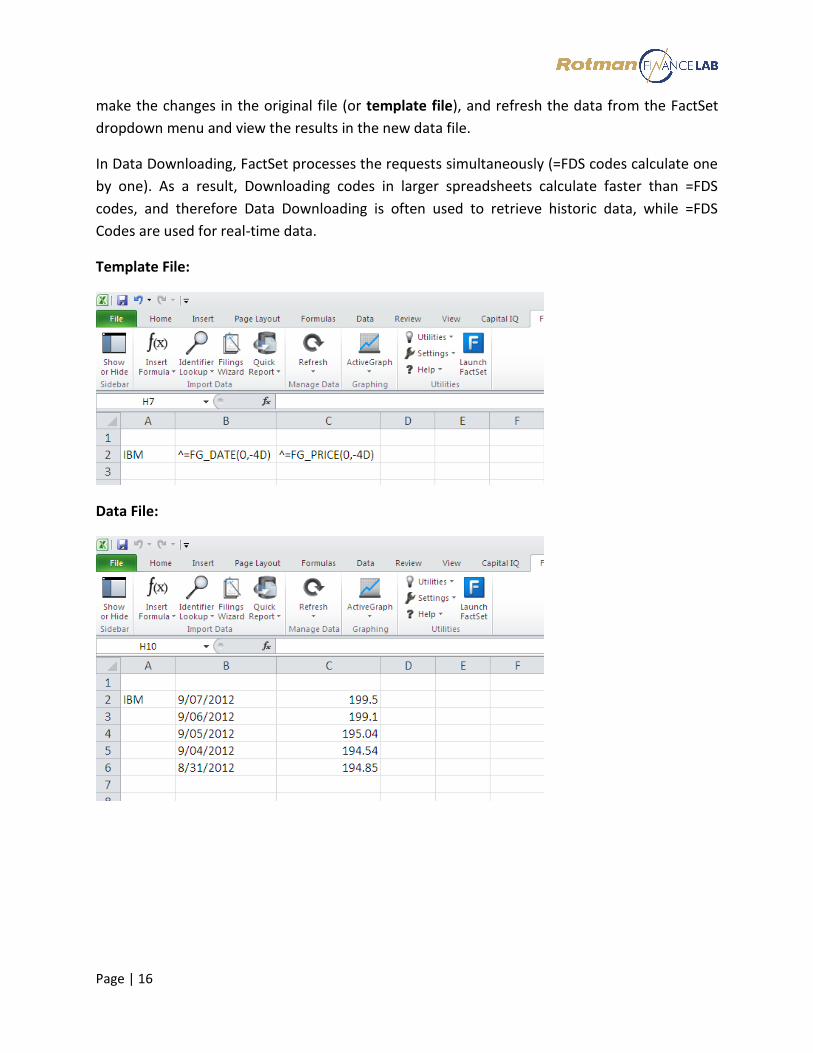
There are two ways to retrieve data – Data Downloading and =FDS Codes.
Data Downloading
Downloading codes are used in spreadsheets to request data from the databases on FactSet via
Data Downloading. To create a template for Data Downloading, first add security identifiers to
the spreadsheet (so you will know which company’s data it is), then include your desired Data
Downloading request codes (using Formula Lookup - FQL). Finally, apply any preferred
formatting to your template cells.
Once the template is set up and saved, you can download the requested data by selecting Data
Downloading from the FactSet menu in your spreadsheet (FactSet-Excel menu > Refresh
Dropdown Menu > Data Downloading). FactSet will ask you to key in the identifiers, of which
you would like to retrieve the data. Once the ticker is selected, Excel will create a separate file
(or data file) for each identifier which displays the requested data. If you want to make any
changes to the codes in your spreadsheet (formatting, adding new codes, etc.), make sure you
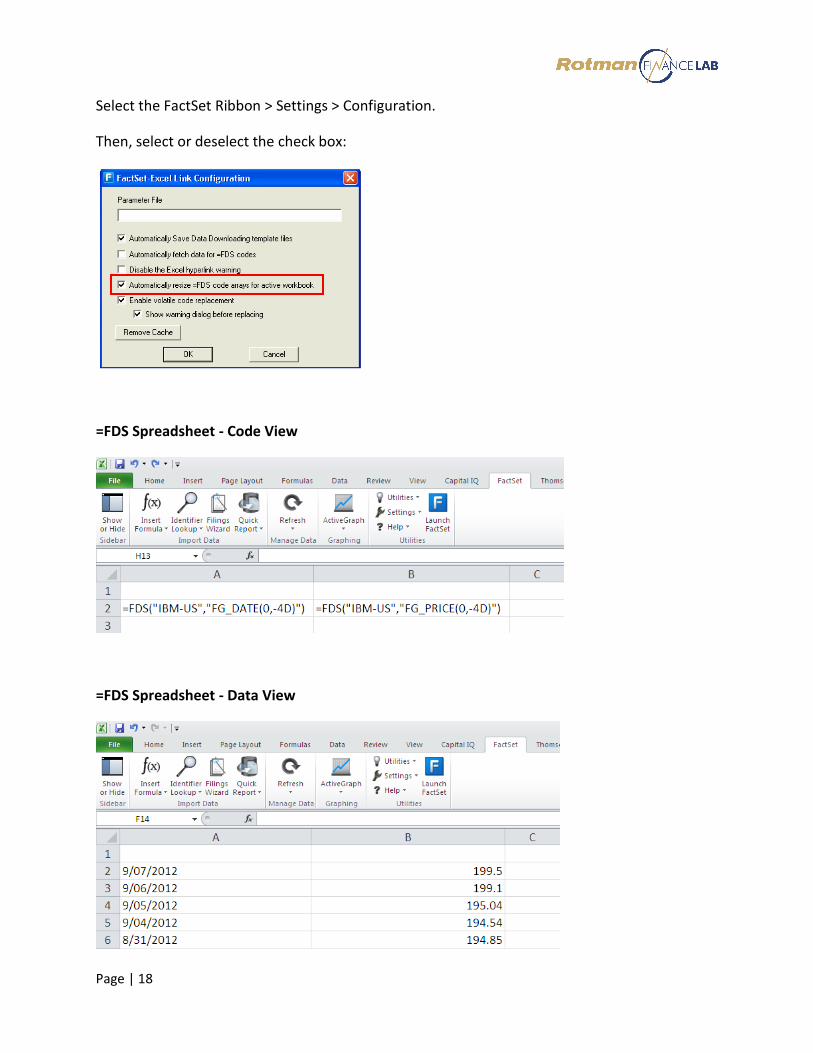
Select the FactSet Ribbon > Settings > Configuration.
Then, select or deselect the check box:
=FDS Spreadsheet - Code View
=FDS Spreadsheet - Data View
Page | 19
Thomson Reuters Eikon - Excel Add-in
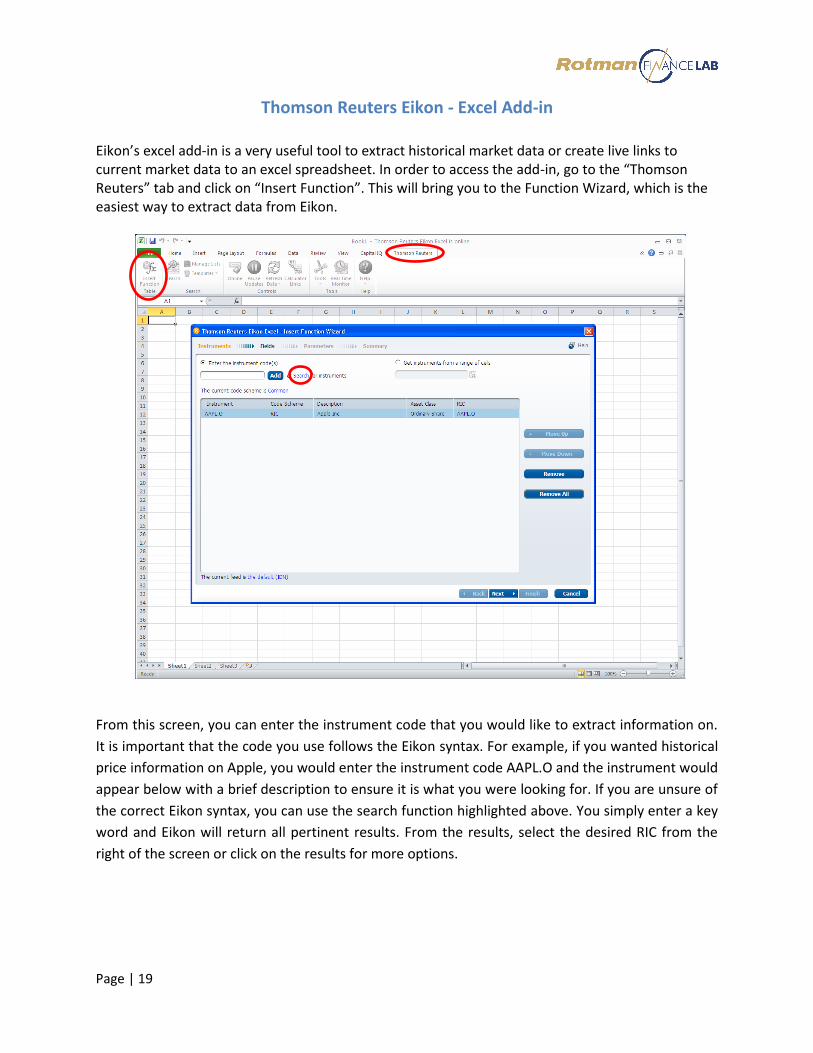
Eikon’s excel add-in is a very useful tool to extract historical market data or create live links to current market data to an excel spreadsheet. In order to access the add-in, go to the “Thomson Reuters” tab and click on “Insert Function”. This will bring you to the Function Wizard, which is the easiest way to extract data from Eikon.
From this screen, you can enter the instrument code that you would like to extract information on.
It is important that the code you use follows the Eikon syntax. For example, if you wanted historical
price information on Apple, you would enter the instrument code AAPL.O and the instrument would
appear below with a brief description to ensure it is what you were looking for. If you are unsure of
the correct Eikon syntax, you can use the search function highlighted above. You simply enter a key
word and Eikon will return all pertinent results. From the results, select the desired RIC from the
right of the screen or click on the results for more options.
Page | 20
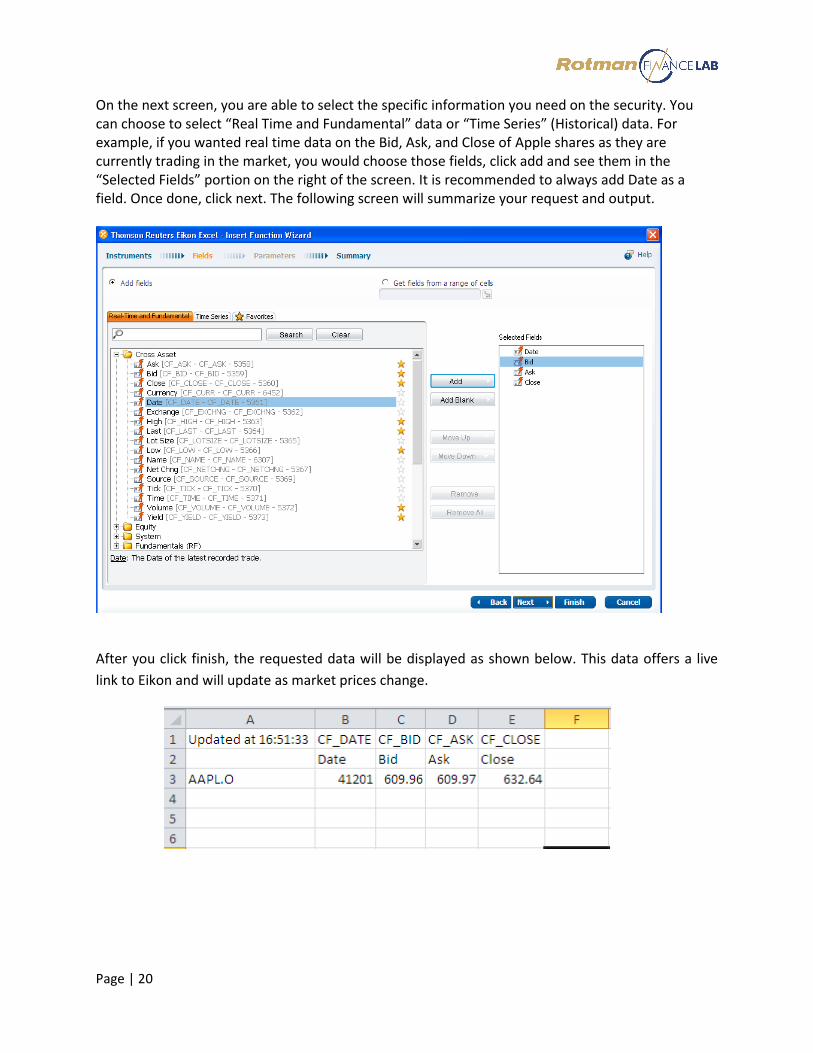
On the next screen, you are able to select the specific information you need on the security. You can choose to select “Real Time and Fundamental” data or “Time Series” (Historical) data. For example, if you wanted real time data on the Bid, Ask, and Close of Apple shares as they are currently trading in the market, you would choose those fields, click add and see them in the “Selected Fields” portion on the right of the screen. It is recommended to always add Date as a field. Once done, click next. The following screen will summarize your request and output.
After you click finish, the requested data will be displayed as shown below. This data offers a live
link to Eikon and will update as market prices change.
Page | 21
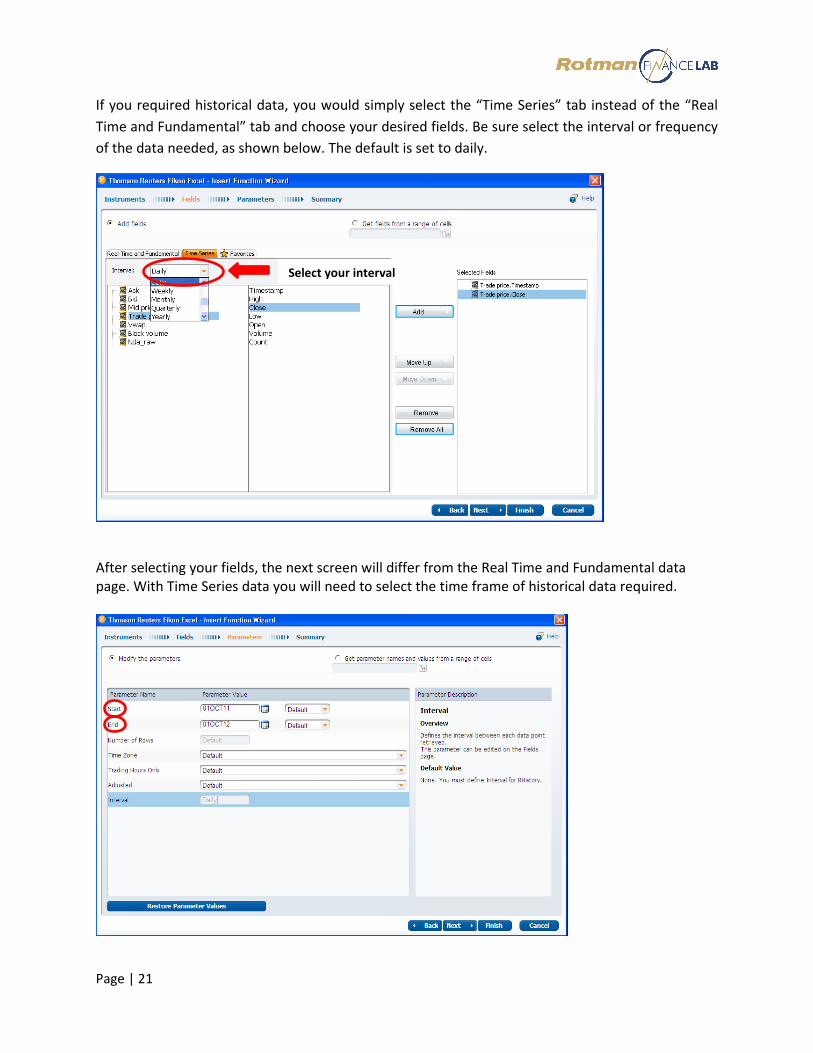
If you required historical data, you would simply select the “Time Series” tab instead of the “Real
Time and Fundamental” tab and choose your desired fields. Be sure select the interval or frequency
of the data needed, as shown below. The default is set to daily.
After selecting your fields, the next screen will differ from the Real Time and Fundamental data page. With Time Series data you will need to select the time frame of historical data required.
Select your interval
Page | 22
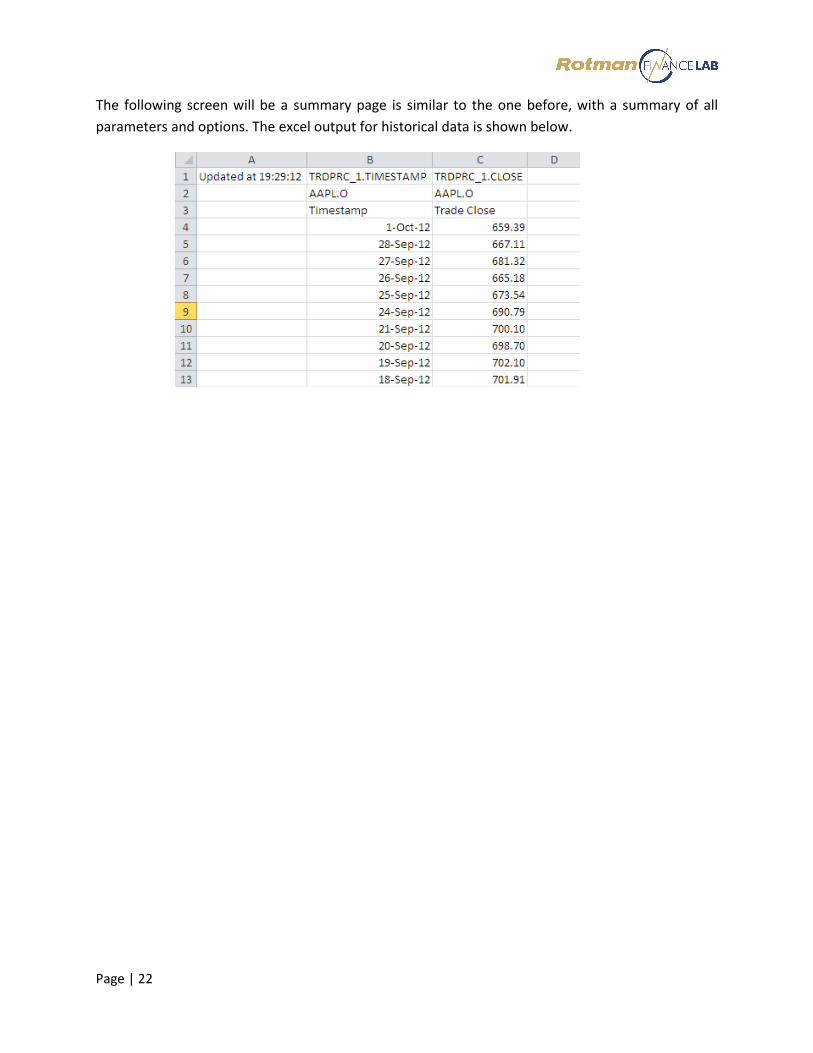
The following screen will be a summary page is similar to the one before, with a summary of all
parameters and options. The excel output for historical data is shown below.