79
EXCEPTIONAL LEADERSHIP UNMATCHED VISION DYNAMIC GROWTH The Mills Corporation Annual Report 2004

EXCEPTIONAL LEADERSHIPUNMATCHED VISIONDYNAMIC GROWTH
The Mills Corporation Annual Report 2004
THE M
ILLS CO
RP
OR
ATION
Annual R
eport 2004
1
2004 ACHIEVEMENTS
Grew funds from operations per common share from $3.63 in 2003 to $3.96 in 2004—a 9.1% increase.
Increased the cash dividend rate per common share for the seventh consecutive year, up to $2.38.
Selected by General Motors Pension Trust to acquire a 50% managingpartner interest in nine of its regional mall properties. GMPT cited The Mills’ ability to maximize the value of retail assets through its merchandising, development and management expertise as a key reason for accepting our bid.
Chosen by the city of Rome to develop the site of the former MercatiGenerali into an 830,000-square-foot urban retail, entertainment andcultural center.
Became the first developer in 14 years to successfully build and openan enclosed retail center in Canada. Vaughan Mills is the first of upto four Mills-branded centers that The Mills and its Canadian partner,Ivanhoe Cambridge, may jointly develop in Canada.
Sold interests in Ontario Mills and Del Amo Fashion Center to institutionalinvestor JP Morgan Fleming Asset Management, demonstrating thevalue of our properties and the soundness of our redevelopment strategy.
Opened Cincinnati Mills in Ohio, transforming the distressed formerForest Fair Mall into a 1.5 million-square-foot Landmark Mills retail destination with a 90% occupancy rate.
Signed our ground lease with the New Jersey Sports and ExpositionAuthority for Meadowlands Xanadu, our 4.8 million-square-foot sports,family entertainment and retail, hotel and office complex at theMeadowlands Sports Complex.
Announced the purchase, together with partner Ivanhoe Cambridge, of the 715,000-square-foot St. Enoch Centre in Glasgow, Scotland.

LAURENCE C. SIEGELChairman & CEO
THE M
ILLS CO
RP
OR
ATION
Annual R
eport 2004
3
2002 (restated) 2003 (restated) 2004
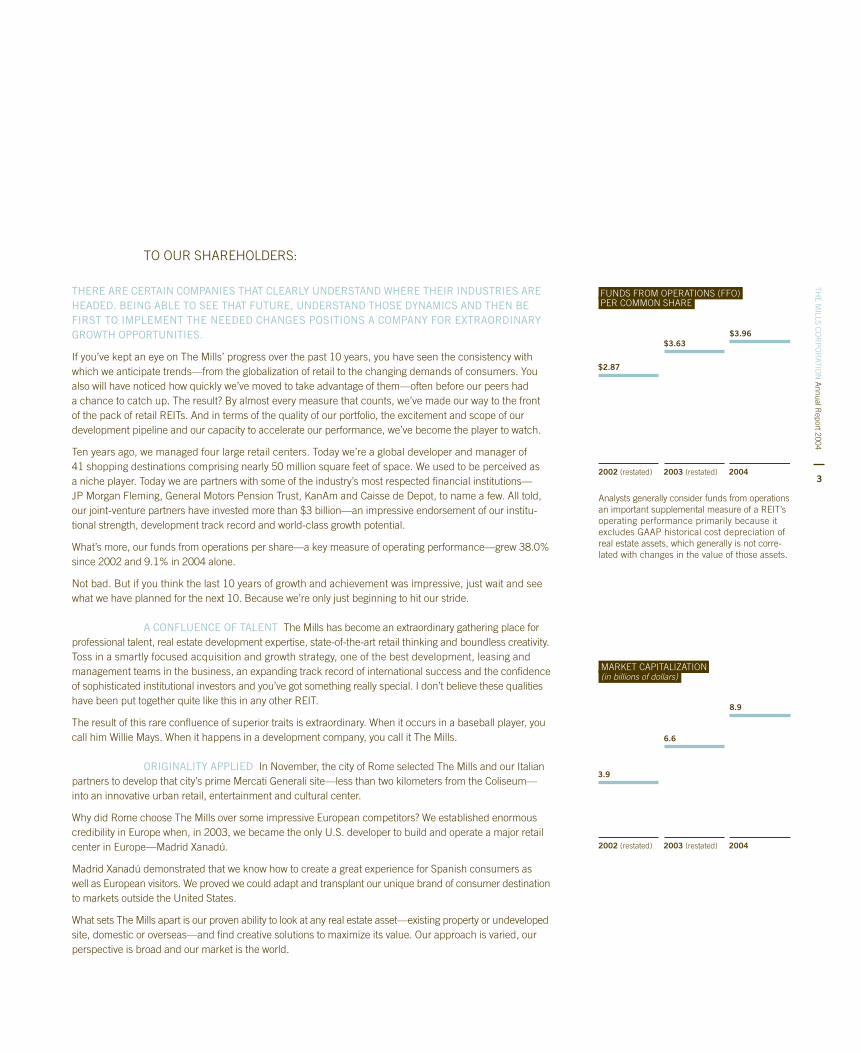
8.9
6.6
3.9
MARKET CAPITALIZATION (in billions of dollars)
THERE ARE CERTAIN COMPANIES THAT CLEARLY UNDERSTAND WHERE THEIR INDUSTRIES AREHEADED. BEING ABLE TO SEE THAT FUTURE, UNDERSTAND THOSE DYNAMICS AND THEN BEFIRST TO IMPLEMENT THE NEEDED CHANGES POSITIONS A COMPANY FOR EXTRAORDINARYGROWTH OPPORTUNITIES.
If you’ve kept an eye on The Mills’ progress over the past 10 years, you have seen the consistency withwhich we anticipate trends—from the globalization of retail to the changing demands of consumers. Youalso will have noticed how quickly we’ve moved to take advantage of them—often before our peers hada chance to catch up. The result? By almost every measure that counts, we’ve made our way to the front of the pack of retail REITs. And in terms of the quality of our portfolio, the excitement and scope of ourdevelopment pipeline and our capacity to accelerate our performance, we’ve become the player to watch.
Ten years ago, we managed four large retail centers. Today we’re a global developer and manager of 41 shopping destinations comprising nearly 50 million square feet of space. We used to be perceived as a niche player. Today we are partners with some of the industry’s most respected financial institutions—JP Morgan Fleming, General Motors Pension Trust, KanAm and Caisse de Depot, to name a few. All told,our joint-venture partners have invested more than $3 billion—an impressive endorsement of our institu-tional strength, development track record and world-class growth potential.
What’s more, our funds from operations per share—a key measure of operating performance—grew 38.0%since 2002 and 9.1% in 2004 alone.
Not bad. But if you think the last 10 years of growth and achievement was impressive, just wait and seewhat we have planned for the next 10. Because we’re only just beginning to hit our stride.
A CONFLUENCE OF TALENT The Mills has become an extraordinary gathering place forprofessional talent, real estate development expertise, state-of-the-art retail thinking and boundless creativity.Toss in a smartly focused acquisition and growth strategy, one of the best development, leasing and management teams in the business, an expanding track record of international success and the confidenceof sophisticated institutional investors and you’ve got something really special. I don’t believe these qualitieshave been put together quite like this in any other REIT.
The result of this rare confluence of superior traits is extraordinary. When it occurs in a baseball player, youcall him Willie Mays. When it happens in a development company, you call it The Mills.
ORIGINALITY APPLIED In November, the city of Rome selected The Mills and our Italianpartners to develop that city’s prime Mercati Generali site—less than two kilometers from the Coliseum—into an innovative urban retail, entertainment and cultural center.
Why did Rome choose The Mills over some impressive European competitors? We established enormouscredibility in Europe when, in 2003, we became the only U.S. developer to build and operate a major retailcenter in Europe—Madrid Xanadú.
Madrid Xanadú demonstrated that we know how to create a great experience for Spanish consumers aswell as European visitors. We proved we could adapt and transplant our unique brand of consumer destinationto markets outside the United States.
What sets The Mills apart is our proven ability to look at any real estate asset—existing property or undevelopedsite, domestic or overseas—and find creative solutions to maximize its value. Our approach is varied, ourperspective is broad and our market is the world.
TO OUR SHAREHOLDERS:
2002 (restated) 2003 (restated) 2004
FUNDS FROM OPERATIONS (FFO) PER COMMON SHARE
$3.96$3.63
$2.87
Analysts generally consider funds from operations an important supplemental measure of a REIT’s operating performance primarily because it excludes GAAP historical cost depreciation of real estate assets, which generally is not corre-lated with changes in the value of those assets.

2002 (restated) 2003 (restated) 2004
8.7
6.6
4.1
GROSS REPORTED TENANT SALES (in billions of dollars)
THE FUTURE AWAITS Our acumen and creativity are especially showcased in the mostcompetitive, challenging development environments. One example: Meadowlands Xanadu, the 4.8 million-square-foot sports, entertainment and retail, office and hotel complex in northern New Jersey on which we broke ground in March 2005. Located within eyesight of Manhattan, the project already is generatingtremendous enthusiasm from leading brands the world over. Before the first shovel hit the dirt, potentialtenants for half the leasable retail and entertainment space in this development had been identified.
The investment community also has been very enthusiastic. KanAm, our investment partner for the project, hadthe most successful capital raise in its history and has completely funded its $250 million equity commitment.
Complementing and elevating a remarkable mix of retail will be an array of interactive experiences, includinga permanent consumer electronics trade show featuring the latest technology, nightclubs and concert venues with world-renowned artists, the world’s largest cinema and a culinary arts school sponsored byViking. Additionally, the country’s first indoor ski slope will anchor an enormous sports village. Further,global content providers Elle magazine will sponsor an entire fashion center and Entertainment Weekly willsponsor a pop entertainment district. Meadowlands Xanadu will be a consumer destination that transformsthe meaning of retail and entertainment.
SMART, FOCUSED GROWTH STRATEGY Our growth opportunities may be vast, but we’re targeting them in several key areas, including ground-up development in the United States, Canadaand overseas as well as in carefully considered acquisition and redevelopment opportunities.
During the 12 months beginning in November 2003, we opened three innovative consumer destinations—St. Louis Mills, Cincinnati Mills and Vaughan Mills, just outside of Toronto, the first enclosed retail centerbuilt in Canada in 14 years. Together these new centers added 3.7 million square feet of productiveleasable space to our lineup.
As a proof point of the value of our Landmark Mills concept, institutional investor JP Morgan Fleming boughta 50% interest in Ontario Mills at a capitalization rate commensurate with that of the most dominant, productive malls in the best markets in the country.
We’ve embarked on a prudent course to supplement our development pipeline with acquisitions of high-quality regional malls whose value we can enhance through expansion, redevelopment and remerchandising.
One deal of particular note was our purchase in October of a 50% managing partner interest in nine regionalmall properties from General Motors Pension Trust. A terrific acquisition. But even more than that, thistransaction is a strong testament by a savvy institutional investor that The Mills, by looking at each assetthrough the eyes of a developer, can maximize the value of these productive retail assets.
GMPT had considered splitting up these properties and selling several of them outright. But after seeing ourcreative plans to unlock their full potential, and recognizing our proven ability to execute, GMPT decided toretain 50% interests in all nine properties and share in what it believes will be a substantial return.
Another major acquisition for us, which was completed in early 2005 in partnership with Ivanhoe Cambridge,was St. Enoch Centre in Glasgow, Scotland, the largest retail market in the United Kingdom outside centralLondon. Located in the heart of Glasgow’s thriving shopping district, this 715,000-square-foot property has20 million visitors per year. In addition, it has significant opportunities for increased productivity throughexpansion and remerchandising.
Our redevelopment acumen also is reaping dividends. JP Morgan further extended its relationship with The Mills by agreeing to purchase a 50% interest in our Del Amo Fashion Center for about $244.5 million,implying a $40 million increase in total property valuation in the 18 months The Mills owned the asset. In addition, the deal entitles us to a higher percentage of revenues when certain returns are achieved.

THE M
ILLS CO
RP
OR
ATION
Annual R
eport 2004
52002 (restated) 2003 (restated) 2004
REPORTED GROSS IN-LINE SALES(in dollars)
368337326
Note: Includes stabilized properties with at least 24 calendar months of operations.
2002 2003 2004
32.6830.5629.65
AVERAGE IN-LINE RENTAL RATES PER SQUARE FOOT (in dollars)
JP Morgan enthusiastically endorses our plan to revitalize the 2.1 million-square-foot center through aninnovative expansion, redevelopment and re-tenanting effort, and wants to share in the expected higheryields the property will generate.
In all, we and our partners expect to invest $3 billion on projects under construction or in development.We have taken a number of prudent steps to fuel this growth responsibly while maintaining a conservativedebt ratio. In 2004, we obtained a $1 billion credit line and $200 million term loan from a consortium of leading commercial lenders, sold joint-venture interests in three properties at substantial premiums and raised $316 million in a preferred-stock issuance.
We have opportunities in front of us that offer tremendous potential, but that also demand great effort andexacting execution. That has been our trademark. We said we would expand internationally; we were the first U.S. developer to build a major shopping center in Europe and we followed up with the acquisition of St. Enoch Centre. We said we would enter Canada; our first project there, Vaughan Mills, is a great success.We said we would build in the Meadowlands and we have broken ground. We have significantly expanded, as we said we would, our portfolio of productive regional malls. The list goes on and on.
Turning these many opportunities into actual gains requires having the best people in the business. We madesome key additions in 2004 to our already stellar management team. In February we appointed formerGoldman, Sachs managing director Mark Ettenger as our president. Mark’s strong management and opera-tional skills, combined with keen knowledge of finance and real estate, have provided us with remarkableleadership. We also brought on Ron Weidner, whose extensive experience in building international realestate operations is perfectly matched with our objectives.
In addition, we strengthened our Board with the election of three new independent members—Sir FrankLampl, Ms. Colombe M. Nicholas and Mr. S. Joseph Bruno. Sir Frank, former chairman and CEO of BovisGroup, lends his immeasurable international construction expertise. Colombe, former president and CEO of Anne Klein Group, brings her keen consumer insight and unmatched expertise in retail and fashion. Joe,whose extensive experience in the financial community here and abroad, including senior-level positions at Coopers & Lybrand, Jurgovan & Blair, Inc. and KPMG Peat Marwick, provides us with valuable perspectiveas we expand our global platform. I am indebted to all the members of our Board for their strong guidance.
In March 2005, we restated our earnings for 2002, 2003 and the first three quarters of 2004. We met ourearnings guidance for 2004 and entered 2005 as a company financially strong and committed to achievingour ambitious growth objectives.
This past year we celebrated our 10th anniversary as a public company. We’ve had an impressive run aswe’ve grown to become one of the dominant REITs in the retail sector. Quarter after quarter, year after year,we’ve delivered impressive returns for our investors, due in large part to our top-notch leadership team, the hard work and focus of our employees, our aggressive but disciplined growth strategy, and our specialability to generate excitement—and maximize value—with creative, cutting-edge retail thinking.
It’s been a great 10 years, but I’m happy to report, with all confidence and enthusiasm, that our best years are still ahead.
Laurence C. SiegelChairman & Chief Executive Officer

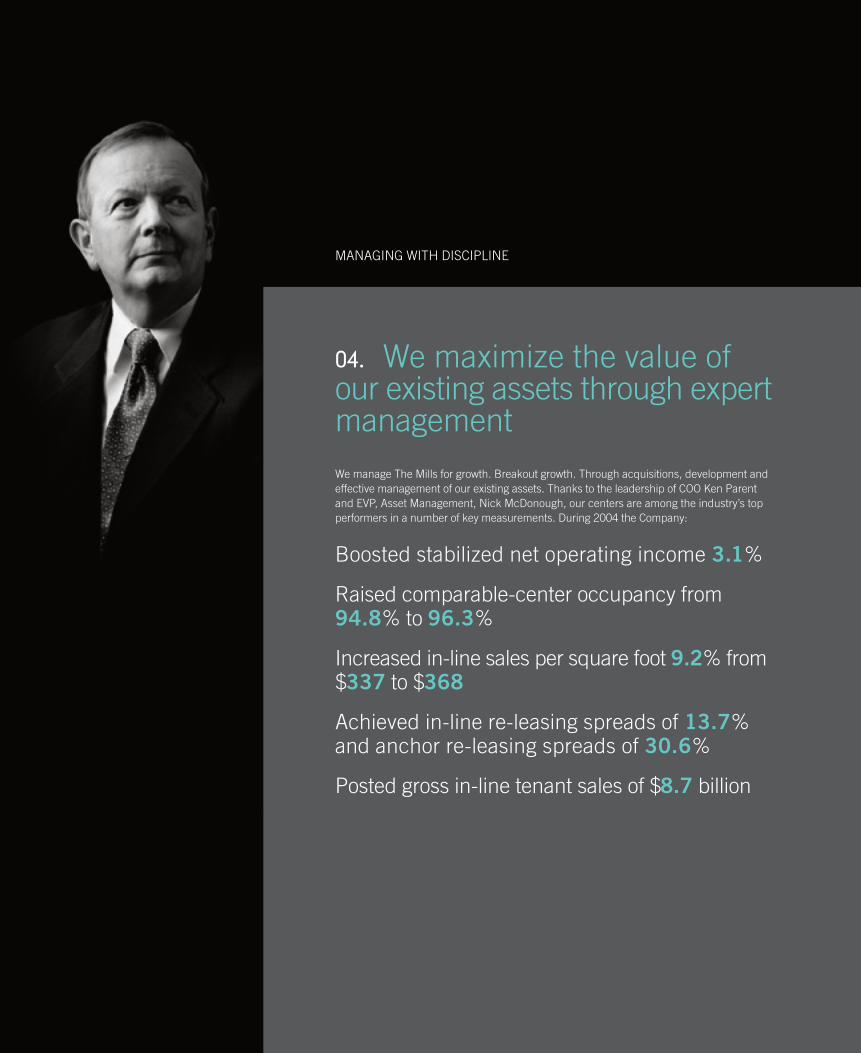
MANAGING WITH DISCIPLINE
Left to right:
JIM DAUSCH President, Development DivisionMARK ETTENGER President, The Mills CorporationJIM NAPOLIPresident, Operating Division

THE M
ILLS CO
RP
OR
ATION
Annual R
eport 2004
7
01. Our track record speaks to thestrength of our vision, the powerof our strategy and the talent ofour people
Led by Chairman and CEO Larry Siegel and President Mark Ettenger, the Operating Committeedirects the Company’s strategic decision-making process and drives its growth strategy. It is oneof the industry’s strongest, most disciplined and experienced teams of development, leasingand management professionals. They set our growth objectives and determine the course forachieving them.
We’ve built our business by being open to new ideas and cultivating our capacity to dream big.At The Mills, those extraordinary traits are made even more powerful by who we believe aresome of the best and brightest people in the real estate investment industry.
2000 2001 2002 2003 2004
17.018.3
20.4
33.3
46.7
Total Gross Leasable Area(millions of square feet,including community centers)

MANAGING WITH DISCIPLINE
2002 2003 2004
93.8% 94.8% 96.3%
Stabilized ComparableProperty Occupancy at Year End
02. We have a prolific developmentpipeline and leasing record
When it comes to enhancing and unlocking value, we believe our development team, led by Jim Dausch, is unrivaled. We have more than a dozen development and redevelopment projects in the U.S. and abroad in which we and our partners plan to invest nearly $3 billion.This pipeline will fuel high-value growth for years to come.
Our operating division, headed by Jim Napoli, boasts an all-star team of in-line leasing expertsand added more than 390 new in-line tenants to our portfolio in 2004. Gregg Goodman, ouranchor leasing leader, drove our leasing numbers to new highs by signing 756,000 square feetof new anchor leases.
Opened 3 Landmark Mills centers in 12 months(Nov. 2003 to Nov. 2004), adding 3.7 millionsquare feet of leasable space
Signed 756,000 square feet in new anchor leases(1)
Signed 986,000 square feet in new in-line leases(1)
(1) Excludes properties in their initial lease-up phase or under redevelopment.

THE M
ILLS CO
RP
OR
ATION
Annual R
eport 2004
9
03. We expanded our portfolio andour European presence throughtargeted acquisitions
Greg Neeb executes our strategy of acquiring productive U.S. regional malls that we plan tomake more valuable through redevelopment, expansion and re-leasing. He also manages theCompany’s acquisition financing strategy.
Acquired 10 properties with substantial upsidepotential, including 50% managing interestsin 9 malls from General Motors Pension Trust
Procured a $1 billion credit line and $200 millionterm loan from a consortium of leading commercial lenders
Ron Weidner is building an international operations platform to increase our presence abroad.
Acquired St. Enoch Centre in Glasgow, Scotland,the largest retail market in the U.K. outsidecentral London We expanded our European footprint in early 2005 by acquiring, with partner Ivanhoe Cambridge,the 715,000-square-foot St. Enoch Centre in Glasgow. Central Glasgow is the U.K.’s largest retailmarket outside central London and is in the midst of a renewal effort intended to transform the cityinto a major tourist destination.
MANAGING WITH DISCIPLINE
04. We maximize the value ofour existing assets through expertmanagement
We manage The Mills for growth. Breakout growth. Through acquisitions, development andeffective management of our existing assets. Thanks to the leadership of COO Ken Parent and EVP, Asset Management, Nick McDonough, our centers are among the industry’s top performers in a number of key measurements. During 2004 the Company:
Boosted stabilized net operating income 3.1%
Raised comparable-center occupancy from94.8% to 96.3%
Increased in-line sales per square foot 9.2% from$337 to $368
Achieved in-line re-leasing spreads of 13.7%and anchor re-leasing spreads of 30.6%
Posted gross in-line tenant sales of $8.7 billion

THE M
ILLS CO
RP
OR
ATION
Annual R
eport 2004
11
Left to right:
RON WEIDNERExecutive Managing Director,International OperationsKEN PARENTChief Operating OfficerNICK MCDONOUGHExecutive Vice President, Asset ManagementGREG NEEBExecutive Vice President, Chief Investment OfficerGREGG GOODMANExecutive Vice President, Anchor Leasing

REINVENTING RETAIL DEVELOPMENT

THE M
ILLS CO
RP
OR
ATION
Annual R
eport 2004
13
05. We know retail and under-stand the DNA of the consumer
As we see it, no two shopping destinations shouldever be quite the same. Not only must today’sshopping mall keep up with the times, it mustreflect the changing lifestyle of the consumer.
In each of our locations—whether in theMeadowlands, Minneapolis or Madrid—that lifestylehas a flavor that’s uniquely its own. No one tailorsthe consumer experience—or generates moreconsumer excitement—for each of its propertiesquite like The Mills.

REINVENTING RETAIL DEVELOPMENT
06. Mills locations employ thelatest in “retail technology” to createcustomized experiences that are in tune with their markets and hostunique arrays of tenants
We view each project as an opportunity to redefinethe consumer experience.

THE M
ILLS CO
RP
OR
ATION
Annual R
eport 2004
15
07. We’ve established relationshipswith more than 3,000 retailers in North America, South Americaand Europe
To create a unique experience for each location,a developer needs to be able to choose from awide array of shopping, sports and entertainmentoptions. Over the years, The Mills has establishedproductive and profitable relationships with morethan 3,000 of the world’s retailers. So, no matterwhere we’re developing The Mills experience, wecan deliver one of the most extensive collectionsof opportunities for consumers and retailers alike.
The result? For the consumer: the best possibleexperience in today’s highly competitive retailenvironment. For the retailer: a more profitablebusiness. For Mills investors: increased returns.

REINVENTING RETAIL DEVELOPMENT
08. Meadowlands Xanadu—bigideas for an extraordinary market
In March 2005, we and our partners received thefinal permit needed to begin construction ofMeadowlands Xanadu at the Meadowlands SportsComplex, across the Hudson River from Manhattan.Here, amid one of the world’s most vibrant and diverse—not to mention most affluent—markets,sits one of The Mills’ most exciting opportunities.
Such a compelling market demands an extraordinary destination. Our Meadowlands Xanadu conceptdelivers with 4.8 million square feet of sports, entertainment and retail, office and hotel space.
Our financial partner, KanAm, has fully funded its $250 million equity commitment, and before the first shovel hit the dirt, half the leasable retail and entertainment space in this projecthad identified potential tenants.
Meadowlands Xanadu will host a “groundbreaking” mix of tenants and consumer options togenerate an incomparable level of excitement and drawing power. Highlighting this state-of-the-art sports, entertainment and retail destination will be:
The first indoor ski resort in the United StatesThe country’s largest multiplex movie theaterTop-line restaurants from leading celebrity chefsNightclubs featuring world-renowned artistsA culinary arts school sponsored by VikingA pop entertainment district hosted by Entertainment WeeklyA fashion center hosted by Elle magazine
THE M
ILLS CO
RP
OR
ATION
Annual R
eport 2004
17
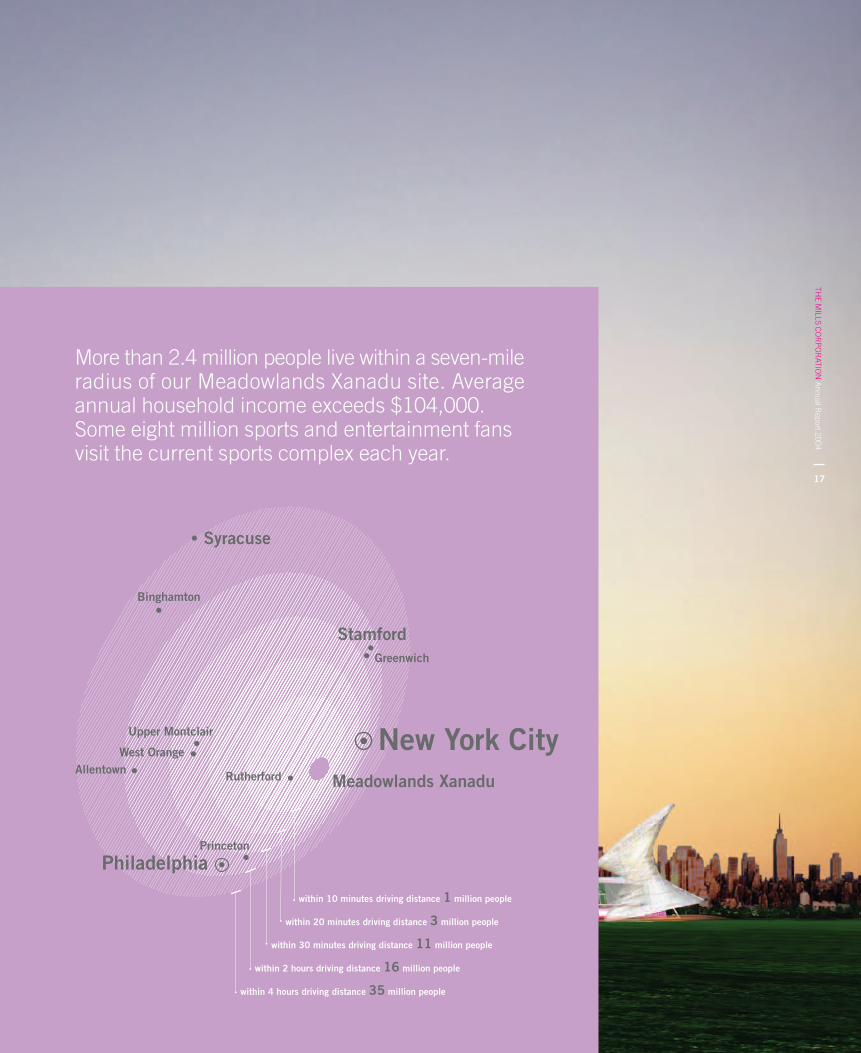
within 10 minutes driving distance 1 million people
within 20 minutes driving distance 3 million people
within 30 minutes driving distance 11 million people
within 2 hours driving distance 16 million people
within 4 hours driving distance 35 million people
Princeton
New York City
Philadelphia
Greenwich
Stamford
Syracuse
Meadowlands Xanadu
Binghamton
Upper Montclair
West Orange
RutherfordAllentown
More than 2.4 million people live within a seven-mileradius of our Meadowlands Xanadu site. Averageannual household income exceeds $104,000.Some eight million sports and entertainment fansvisit the current sports complex each year.

REINVENTING RETAIL DEVELOPMENT
09. We keep all our concepts inno-vative, fresh and state-of-the-art
We continue to develop and refine the concept of our Landmark Mills shopping and entertainmentdestinations. Pittsburgh Mills, scheduled to openin 2005, boasts several exciting new refinementsto an already-successful concept.Located about 15 miles northeast of downtown, Pittsburgh Mills occupies a 340-acre site. It will comprise 1.1 million square feet of enclosed shopping, dining and interactive entertainment.The indoor center will feature a mix of full-price department stores, traditional and nontraditionalanchors, full-price and value retail and entertainment.
Pittsburgh Mills also will include an open-air campus featuring big-box retailers, a diverse menuof restaurants and more. Few, if any, shopping centers can match Pittsburgh Mills’ innovativemerchandising mix that we believe will create an optimal shopping experience for consumers inthat growing market.

THE M
ILLS CO
RP
OR
ATION
Annual R
eport 2004
19
Meadowlands Xanadu in northern New Jersey, whichhas received all necessary approvals and permitsfor construction to commence, will redefine the consumer experience for the greater New York Citymarket. We strive to tailor a unique and exciting consumer experience for each of the markets we serve.

Taking notice of our accomplishments in the United Statesand Canada and deeply impressed with our proven successin Madrid, the city of Rome in November selected The Millsand our partners Lamaro Appalti S.p.a. and Cogeim to developthe site of the former Mercati Generali, located just a shortdistance from the Roman Forum and Coliseum. Representingthe first-ever adaptive reuse of a historical site in the city,the proposed development is scheduled to break ground insummer 2005.
WIDENING OUR HORIZONS

THE M
ILLS CO
RP
OR
ATION
Annual R
eport 2004
21
10. We’re building on our trackrecord…and our credibility…overseas
Establishing relationshipsWe see remarkable growth opportunities in Europe, Canada and other parts of the world. In May2003, we opened the first ground-up development of a premier retail and entertainment destination in Europe by any U.S.-based developer—Madrid Xanadú. It’s been a remarkablesuccess. Building one of Europe’s largest, most comprehensive (with 220 retail, dining andleisure options) and most successful consumer destinations tends to get your name noticed.We continue to build on the enormous credibility and leasing and development experience we gained in Madrid.
Opening new frontiersIn 14 years, no developer had successfully built and opened an enclosed retail center inCanada. That is until 2004, when we and partner Ivanhoe Cambridge opened Vaughan Millsnear Toronto. Vaughan Mills features 1.1 million square feet of leasable space and was 93%leased at opening. Vaughan Mills boasts Canada’s first Hudson’s Bay Company’s DesignerDepot, Bass Pro Shops Outdoor World, NASCAR SpeedPark, Lucky Strike Lanes, BurlingtonCoat Factory, Town Shoes Outlet, Tommy Bahama Outlet and Benetton Outlet. Vaughan Millsalso features the largest Tommy Hilfiger Outlet in the world, H&M, La Senza/La Senza Girl,Linens ’n Things, Urban Behavior, The Children’s Place Outlet and Winners and HomeSense.
The success of Vaughan Mills paves the way for additional opportunities in Canada. We andour development partner, Ivanhoe Cambridge, may develop a total of up to four Mills-brandedcenters in Canada.
WIDENING OUR HORIZONS
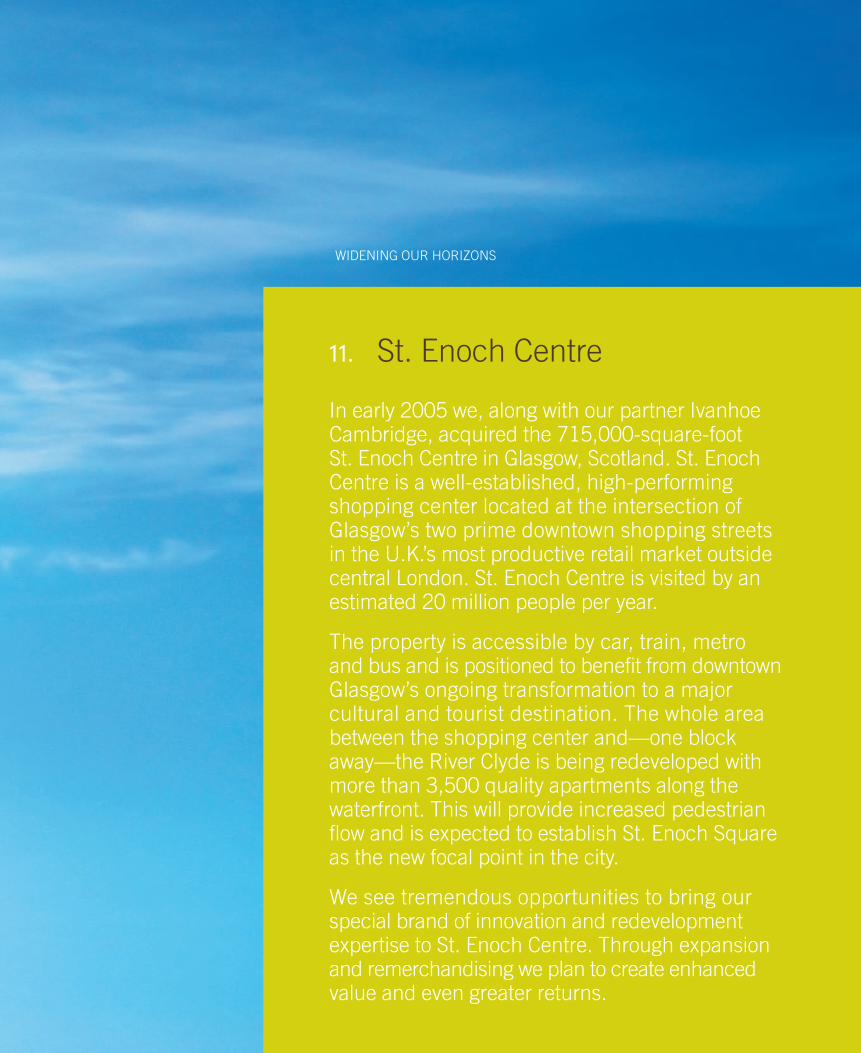
11. St. Enoch Centre
In early 2005 we, along with our partner IvanhoeCambridge, acquired the 715,000-square-footSt. Enoch Centre in Glasgow, Scotland. St. EnochCentre is a well-established, high-performingshopping center located at the intersection ofGlasgow’s two prime downtown shopping streetsin the U.K.’s most productive retail market outsidecentral London. St. Enoch Centre is visited by anestimated 20 million people per year.
The property is accessible by car, train, metro and bus and is positioned to benefit from downtownGlasgow’s ongoing transformation to a majorcultural and tourist destination. The whole areabetween the shopping center and—one blockaway—the River Clyde is being redeveloped withmore than 3,500 quality apartments along thewaterfront. This will provide increased pedestrianflow and is expected to establish St. Enoch Squareas the new focal point in the city.
We see tremendous opportunities to bring ourspecial brand of innovation and redevelopmentexpertise to St. Enoch Centre. Through expansionand remerchandising we plan to create enhancedvalue and even greater returns.

THE M
ILLS CO
RP
OR
ATION
Annual R
eport 2004
23
Visitors per year:
20million
Total leasable area:
715,000square feet
Area entitled for expansion:
50,000square feet
Occupancy:
98.6percent

WIDENING OUR HORIZONS
MILAN
RAVENSCRAIG
ROMEBARCELONA
VALENCIA
12. Building the future
Development opportunities in EuropeThe Mills is actively building an international operating platform to enable us to seize thetremendous opportunities that lie overseas. We are in negotiations to develop sites inRome, Valencia, Barcelona, Milan, Glasgow and other locations and, beginning in 2005,expect to break ground on one or more projects each year. We also continue to identify and evaluate acquisition opportunities.

THE M
ILLS CO
RP
OR
ATION
Annual R
eport 2004
25

MAXIMIZING VALUE
We look at ways to breathe new life into our assets. That allows us to add even morevalue to already-productive properties.
Del Amo Fashion Center, in Torrance,California, is one of the largest shopping centers in the United States. While thisproperty already is productive, we see a range of redevelopment opportunities thatwill transform Del Amo Fashion Center into a premier center with exceptional value.
THE M
ILLS CO
RP
OR
ATION
Annual R
eport 2004
27
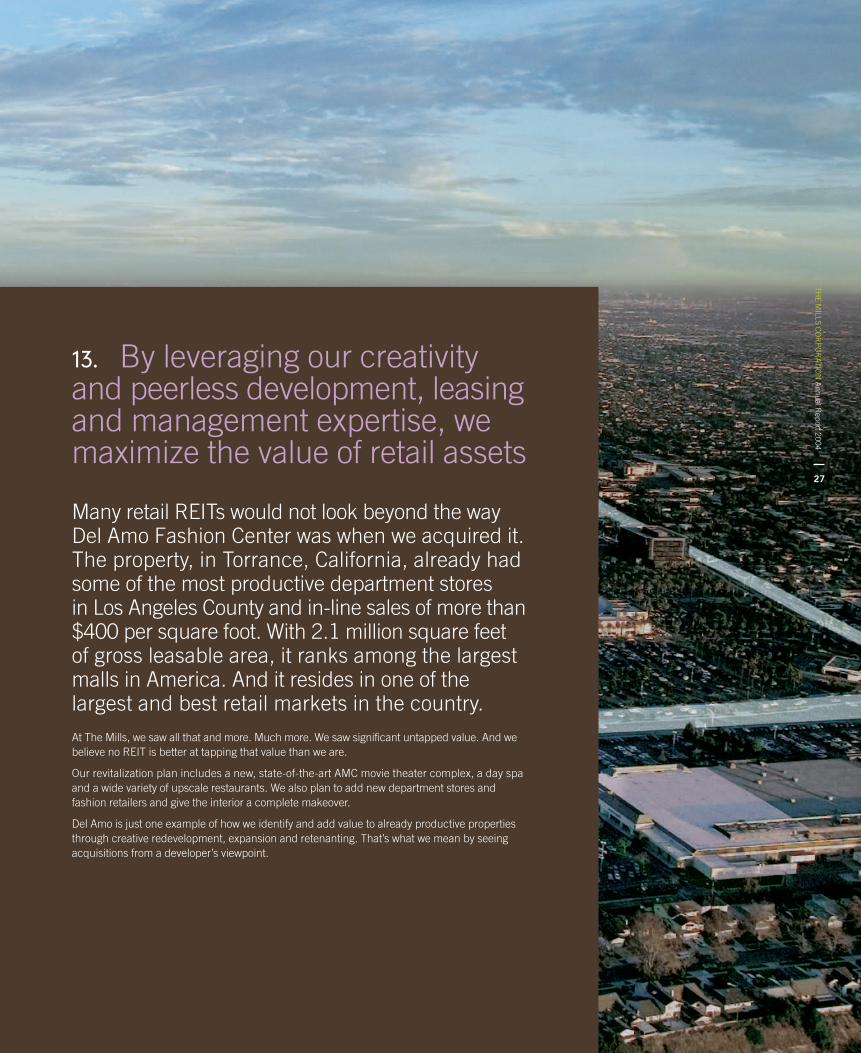
13. By leveraging our creativityand peerless development, leasingand management expertise, wemaximize the value of retail assets
Many retail REITs would not look beyond the wayDel Amo Fashion Center was when we acquired it.The property, in Torrance, California, already hadsome of the most productive department stores in Los Angeles County and in-line sales of more than$400 per square foot. With 2.1 million square feetof gross leasable area, it ranks among the largestmalls in America. And it resides in one of thelargest and best retail markets in the country.At The Mills, we saw all that and more. Much more. We saw significant untapped value. And webelieve no REIT is better at tapping that value than we are.
Our revitalization plan includes a new, state-of-the-art AMC movie theater complex, a day spaand a wide variety of upscale restaurants. We also plan to add new department stores and fashion retailers and give the interior a complete makeover.
Del Amo is just one example of how we identify and add value to already productive propertiesthrough creative redevelopment, expansion and retenanting. That’s what we mean by seeingacquisitions from a developer’s viewpoint.

MAXIMIZING VALUE
14. We are partners with some of the industry’s most respectedinstitutional investors
In October, we finalized the purchase of a 50%managing partner interest in nine regional mallproperties from General Motors Pension Trust(GMPT). That company originally considered splitting up the properties and selling several of themoutright. But our creative redevelopment plans—which showed how we could unlock their full valueand potential—changed GMPT’s mind. Thecompany decided to retain a half interest in all nineproperties and share in what we all expect will be substantial returns.In 2004, institutional investor JP Morgan Fleming purchased a 50% interest in Ontario Mills outside Los Angeles at a cap rate that corresponds to that of the most dominant, productivemalls in the best markets in the country. We long believed that our Landmark Mills propertiesshould be valued as such. This transaction proved it.
Later in the year, JP Morgan Fleming expanded its relationship with The Mills by agreeing topurchase an approximately 50% equity interest in Del Amo Fashion Center at a price that impliesa $40 million increase in total property valuation in the 18 months we had owned the asset. In addition, the deal entitles us to a higher percentage of revenues when certain returns areachieved. JP Morgan’s investment is a strong endorsement of our plan to revitalize this assetthrough innovative expansion, redevelopment and re-tenanting. JP Morgan and The Mills willshare the higher yields we both expect the property to generate.
That’s what we call maximizing value. And, at The Mills, that’s what it’s all about.

THE M
ILLS CO
RP
OR
ATION
Annual R
eport 2004
29
The entire center will receive a major renovation. We are razing a vacant 403,000-square-foot wing and replacing it with exciting outdoor entertainment and dining.We also plan to bring new anchor departmentstores and fashion retailers to Del AmoFashion Center.

Ontario Mills* Northpark Mall* Dover Mall* Franklin Mills*
Arundel Mills* Southridge Mall* The Block at Orange* Westland Mall*
Madrid Xanadú* Gurnee Mills* Arizona Mills*Del Amo Fashion Center*
The Mall at Tuttle Crossing*St. Enoch Centre* Broward Mall* Meadowlands Xanadu*
Meadowood Mall* Columbus City Center* Colorado Mills* Briarwood Mall*

Cincinnati Mills* Lakeforest* Grapevine Mills* Southdale Center*
Concord Mills* Opry Mills* Great Mall* The Falls*
Stoneridge Shopping Center* Potomac Mills* Hilltop Mall* St. Louis Mills*
Discover Mills* Katy Mills* Galleria at White Plains* The Esplanade*
Sawgrass Mills* Vaughan Mills* Marley Station* The Shops at Riverside*
The Mills Portfolio
At The Mills we boast a certain originality…a decidedly inventive flair. In fact, we’re alwayscreating. For one, we’re constantly developing more places…and more ways…for the world’sconsumers to shop, dine, play, relax and enjoy. This results in an ever-expanding variety ofunique and vital retail destinations that draw consumers by the millions. It also provides dramaticgrowth platforms for a tremendous variety of retail concepts. And this, in turn, creates theopportunity for investors to own a premier diversified real estate company with financial strength,industry-leading innovation and extraordinary potential for breakout growth.
size number opened/ (in millions of joint venture
name market acquired (A) of sq.ft.) anchors partners
OPERATING PROPERTIESArizona Mills Phoenix 1997 1.2 17 Taubman Realty
Arundel Mills Baltimore 2000 1.2 15 KanAm
The Block at Orange Los Angeles 1998 0.7 11 KanAm
Briarwood Mall Ann Arbor 2004 (A) 1.0 6 General Motors Pension Trust
Broward Mall Ft. Lauderdale 2003 (A) 1.0 4
Cincinnati Mills Cincinnati 2004 1.5 13
Colorado Mills Denver 2002 1.1 10 KanAm, Stevinson Holdings, Inc
Columbus City Center Columbus 2004 (A) 1.1 5 General MotorsPension Trust
Concord Mills Charlotte 1999 1.3 18 KanAm
Del Amo Fashion Center Los Angeles 2003 (A) 2.1 11 JP Morgan Fleming
Discover Mills Atlanta 2001 1.2 13 KanAm
Dover Mall Dover 2003 (A) 0.9 6
The Esplanade New Orleans 2003 (A) 0.9 3
The Falls Miami 2004 (A) 0.8 2 General Motors Pension Trust
Franklin Mills Philadelphia 1989 1.7 19
Galleria at White Plains New York City 2003 (A) 0.9 3
Grapevine Mills Dallas/Ft. Worth 1997 1.6 20 KanAm
Great Mall San Jose 2003 (A) 1.3 11 KanAm Grund
Gurnee Mills Chicago 1991 1.8 17
Gwinnett Place Atlanta 2003 (A) 1.3 5 Simon Property Group
Hilltop Mall San Francisco 2004 (A) 1.1 5 General MotorsPension Trust

Ontario Mills* Northpark Mall* Dover Mall* Franklin Mills*
Arundel Mills* Southridge Mall* The Block at Orange* Westland Mall*
Madrid Xanadú* Gurnee Mills* Arizona Mills*Del Amo Fashion Center*
The Mall at Tuttle Crossing*St. Enoch Centre* Broward Mall* Meadowlands Xanadu*
Meadowood Mall* Columbus City Center* Colorado Mills* Briarwood Mall*
size number opened/ (in millions of joint venture
name market acquired (A) of sq.ft.) anchors partners
OPERATING PROPERTIESKaty Mills Houston 1999 1.2 14 KanAm
Lakeforest Mall Washington, DC 2004 (A) 1.1 5 General Motors Pension Trust
The Mall at Tuttle Crossing Columbus 2004 (A) 1.1 5 General Motors Pension Trust
Marley Station Baltimore 2004 (A) 1.1 6 General Motors Pension Trust
Meadowood Mall Reno 2004 (A) 0.9 5 General Motors Pension Trust
Northpark Mall Jackson 2003 (A) 1.0 4
Ontario Mills Los Angeles 1996 1.5 21 JP Morgan Fleming
Opry Mills Nashville 2000 1.1 17 KanAm Grund
Potomac Mills Washington, DC 1985 1.6 20
Sawgrass Mills Ft. Lauderdale 1990 2.2 23
The Shops at Riverside Bergen County 2002 (A) 0.6 3
Southdale Center* Minneapolis 2005 (A) 1.3 5
Southridge Mall* Milwaukee 2005 (A) 1.2 8
St. Louis Mills St. Louis 2003 1.1 12 KanAm
Stoneridge San Francisco 2004 (A) 1.3 5 General Motors Shopping Center Pension Trust
Town Center at Cobb Atlanta 2003 (A) 1.3 5 Simon Property Group
Vaughan Mills Toronto, Canada 2004 1.1 12 Ivanhoe Cambridge
Westland Mall Miami 2004 (A) 0.8 3
INTERNATIONAL PROPERTIES
Madrid Xanadú Madrid, Spain 2003 1.4 14
St. Enoch Centre* Glasgow,Scotland 2005 (A) 0.7 5 Ivanhoe Cambridge
CONSTRUCTION/DEVELOPMENT PROPERTIES
Meadowlands Xanadu New York City 4.8 KanAm, Mack-Cali / Northern NJ Realty Group
Mercati Generali Rome, Italy 0.8 Cogeim Lamaro Appalti S.p.a.
Pittsburgh Mills Pittsburgh 1.1 KanAm, A.V. Associates
San Francisco Piers 27-31 San Francisco
Woodbridge Washington, DC
108 North State Street Chicago
* Properties acquired in 2005

Cincinnati Mills* Lakeforest* Grapevine Mills* Southdale Center*
Concord Mills* Opry Mills* Great Mall* The Falls*
Stoneridge Shopping Center* Potomac Mills* Hilltop Mall* St. Louis Mills*
Discover Mills* Katy Mills* Galleria at White Plains* The Esplanade*
Sawgrass Mills* Vaughan Mills* Marley Station* The Shops at Riverside*

Selected Consolidated Financial Data 17
Management’s Discussion and Analysis of Financial Condition and Results of Operations 18
Management’s Report 31
Reports of Independent Registered Public Accounting Firm 32
Consolidated Balance Sheets 34
Consolidated Statements of Income 35
Consolidated Statements of Total Comprehensive Income 36
Consolidated Statements of Stockholders’ Equity 37
Consolidated Statements of Cash Flows 38
Notes to Consolidated Financial Statements 39
Board of Directors and Executive Officers 57
Corporate Information 58
FINANCIAL REPORT

THE M
ILLS CO
RP
OR
ATION
Annual R
eport 2004
17
SELECTED CONSOLIDATED FINANCIAL DATA
The selected financial data that follows should be read in conjunction with the consolidated financial statements and accompanying notes of TMC and the discus-sion set forth in the section entitled “Management’s Discussion and Analysis of Financial Condition and Results of Operations,” each included elsewhere in thisAnnual Report.
Years Ended December 31, 2004 2003 2002 2001 2000
[Dollars in millions, except per share data] (Restated)[a] (Restated)[a] (Restated)[a] (Restated)[a]
Operating revenues $ 684.8 $ 400.8 $ 239.3 $ 195.6 $ 190.9
Income before minority interest in Mills LP $ 220.4 $ 146.1 $ 72.8 $ 22.9 $ 45.6Minority interest in Mills LP (30.5) (31.1) (22.3) (8.9) (18.4)
Income from continuing operations 189.9 115.0 50.5 14.0 27.2Discontinued operations, net of minority interest in Mills LP – 0.1 0.3 0.2 –Cumulative effect of FIN 46 adoption, net of minority interest in Mills LP[b] 42.1 – – – –
Net income $ 232.0 $ 115.1 $ 50.8 $ 14.2 $ 27.2
Earnings per common share – diluted:Continuing operations $ 2.71 $ 1.91 $ 1.33 $ 0.55 $ 1.17Discontinued operations – – 0.01 0.01 –Cumulative effect of FIN 46 adoption 0.79 – – – –
Earnings per share – diluted $ 3.50 $ 1.91 $ 1.34 $ 0.56 $ 1.17
Dividends paid per common share and unit $ 2.35 $ 2.24 $ 2.18 $ 2.12 $ 2.05
Weighted average number of shares outstanding (in thousands) – diluted 54,079 45,785 36,355 25,491 23,338
Funds From Operations (“FFO”)[c]:Mills LP FFO $ 301.9 $ 251.7 $ 154.6 $ 92.9 $ 96.9
Mills LP FFO available to common equity holders $ 257.1 $ 223.2 $ 152.0 $ 92.9 $ 96.9
Portfolio Data at end of period:Gross Leasable Area (“GLA”) (square feet in thousands) 46,687 33,287 20,400 18,261 17,047
Number of operating properties 38 26 17 16 14
Balance Sheet Data:Real estate assets before accumulated depreciation $6,192.0 $3,442.2 $2,219.5 $1,522.7 $1,337.9
Total assets $6,103.2 $3,276.4 $2,111.0 $1,303.5 $1,112.4
Mortgages, notes and other loans payable $3,826.6 $2,119.3 $1,236.7 $ 967.3 $ 908.9
[a] Restated for the impact of the matters discussed below and in Note 17 to the consolidated financial statements of TMC.[b] Cumulative effect on prior years of adopting FIN 46 on a prospective basis effective March 31, 2004. See below and Note 3 to the consolidated financial statements of TMC.[c] FFO is a widely used financial measure among equity REITs that we believe may provide a relevant basis for comparison among REITs. It is not a measure of financial performanceunder GAAP and should not be considered a measure of liquidity, an alternative to net income or an indicator of any other performance measure determined in accordance with GAAP. Investors and potential investors in our securities should not rely on this measure as a substitute for any GAAP measure, including net income. See“Management’s Discussion and Analysis of Financial Condition and Results of Operations – Funds From Operations” contained elsewhere herein.

18
MANAGEMENT’S DISCUSSION AND ANALYSIS OF FINANCIAL CONDITION AND RESULTS OF OPERATIONS
The following discussion analyzes the financial condition and results of opera-tions of The Mills Corporation, or TMC. TMC is the sole general partner of The MillsLimited Partnership, or Mills LP, and owned a1.00% general partner interest and a85.12% limited partner interest as of December 31, 2004. TMC conducts all of itsbusiness and owns all of its properties through Mills LP and Mills LP’s varioussubsidiaries. As the general partner of Mills LP, TMC has the exclusive power tomanage the business of Mills LP, subject to certain limited exceptions.
This discussion should be read in conjunction with TMC’s consolidated finan-cial statements and related notes included elsewhere in this report and theCritical Accounting Policies outlined at the end of this section. Forward-lookingstatements contained herein are based on current expectations and assumptionsthat are subject to risks and uncertainties and are not guarantees of future per-formance. Such forward-looking statements include, among others, statementsregarding development and construction costs, lease expirations and extensionof loan maturity dates. Actual results could differ materially because of factorsdiscussed in “Risk Factors” contained elsewhere in this report.
As more fully described in the notes to our consolidated financial statements,we have restated our previously issued consolidated financial statements to correct our accounting treatment of certain items, including the methodologywe used to determine our equity in joint venture earnings and the rates appliedin our capitalized interest calculations. All financial information containedherein has been revised to reflect the restatements.
OVERVIEWWe are a fully integrated, self-managed real estate investment trust (“REIT”)engaging in the ownership, development, redevelopment, leasing, acquisition,expansion and management of a portfolio of retail and entertainment-orientedcenters. As of March 31, 2005, we owned or had an interest in 41 properties,consisting of seventeen super-regional Mills Landmark Centers, twenty-tworegional 21st Century Retail and Entertainment Centers and two InternationalRetail and Entertainment Centers. Through an indirect wholly owned subsidiary,we provide development, management, leasing and financial services to entitiesowned by certain of our joint ventures.
EXECUTIVE SUMMARYWe are engaged in the development, acquisition and operation of retail andentertainment real estate. Our primary source of revenue is tenant leases and therefore we endeavor to provide an environment where consumers aredrawn to our properties providing tenants the ability to achieve success throughhigh sales volumes. Properly defining the market area and its demographics,along with evaluating trends in where and how people shop, are key elementsboth in identifying properties for acquisition and sites which can be success-fully developed.
In 2002, we articulated a three prong strategy of expanding beyond our super-regional Mills Landmark Centers to encompass regional 21st Century Retail and Entertainment Centers and International Retail and Entertainment Centers.Through December 31, 2004, this strategy has resulted in the acquisition of all, or a portion, of the ownership interests in nineteen 21st Century Retail andEntertainment Centers, two Mills landmark centers and the opening of MadridXanadú, our first international, ground-up development. At the same time, our historical development pipeline produced two additional Mills LandmarkCenters. We anticipate continuing this strategy of expansion through propertyacquisition and ground-up developments in the United States and elsewhere.
Operating results at our individual operating properties are impacted by thesupply and demand for retail space, the strength or weakness of consumerdemand and the financial health of retail tenants. Key measures used in evalu-ating the performance of our individual operating properties include in-linetenant sales volume, in-line tenant sales per square foot, average rents,re-leasing spreads and occupancy rates.
Individual operating property performance is also monitored and evaluatedusing certain non-GAAP financial measures, specifically funds from operations(“FFO”) and net operating income (“NOI”). FFO is a metric widely used in our industry and is used by us both as means to evaluate the performance ofour properties and as one of several criteria to determine performance basedbonuses. NOI affords us the opportunity to assess the results of an individualproperty before considering its unique capital structure and historical asset base.FFO and NOI are supplemental measures of operating performance and shouldnot be considered as measures of liquidity, alternatives to net income or any otherperformance measure determined in accordance with GAAP. Further, FFO andNOI measures presented by us may not be comparable to other similarly titledmeasures of other companies. We urge the users of our financial statements,including investors and potential investors in our securities, to carefully reviewthe reconciliations of these measures to comparable GAAP measurescontained below.
Interest rates are a critical factor in all facets of our business. Consistent withthe real estate industry, we finance our projects with significant amounts of debtso fluctuations in interest rates could have a significant impact on our results of operations. We attempt to mitigate our exposure to interest rate fluctuationsby using long-term fixed rate or hedged to maturity debt on our stabilized prop-erties and by hedging a portion of our floating rate construction debt.
In acquiring a property we evaluate the property’s historical tenant sales levels,average rents and re leasing spreads. Our ability to finance the investmentthrough debt and/or the sale of partnership interests is also a factor. Additionalconsiderations include expansion and/or redevelopment opportunities affordedby the property and the potential to add value to the existing property byenhancing the tenant mix and/or adding dining and entertainment options.
THE M
ILLS CO
RP
OR
ATION
Annual R
eport 2004
19
For foreign investments, we evaluate additional factors such as the ability towork with local partners and financiers; the stability of the local economy; costsassociated with foreign taxes; currency hedging strategies; statutory require-ments; and local customs.
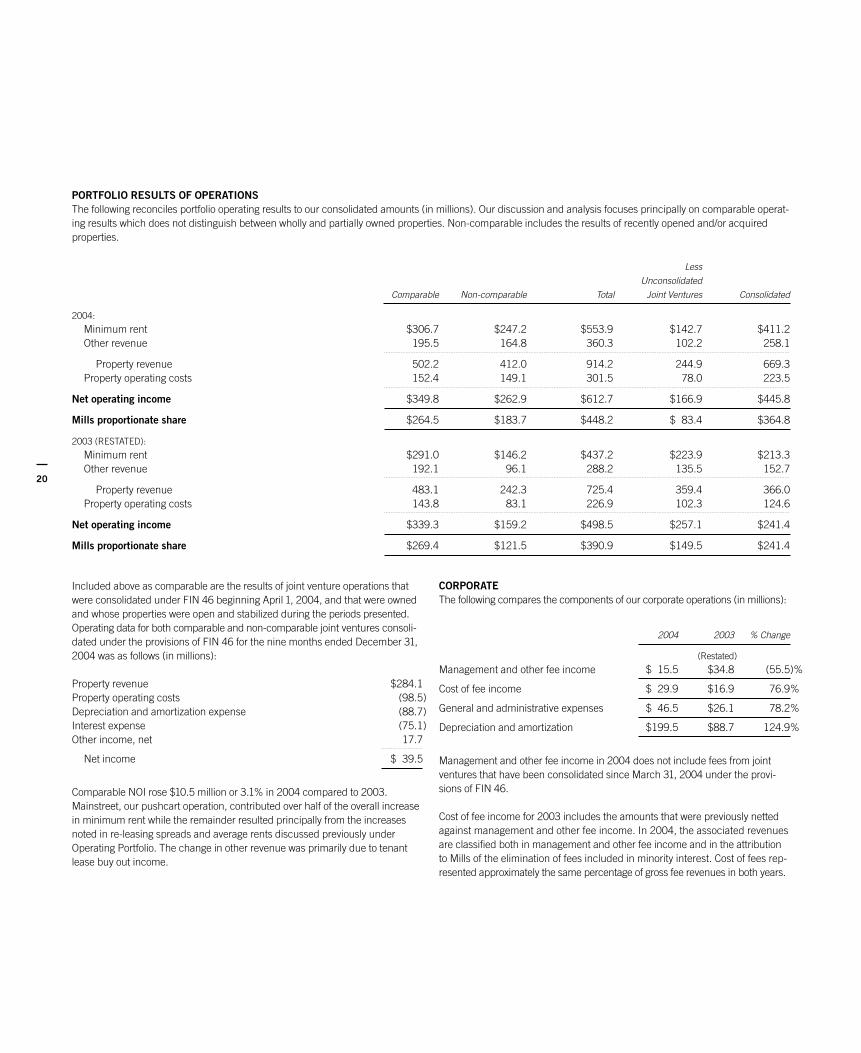
OPERATING PORTFOLIO DATAAs noted above, we use a number of key measures to evaluate the performanceof our individual operating properties. We also use these measures in reviewingthe performance of our combined portfolio of comparable properties. Com-parable properties for this purpose are defined as stabilized wholly ownedand/or joint venture operating properties that we have owned and/or that havebeen open for at least two years. Key measures for our comparable operatingportfolio in 2004 relative to 2003 were as follows:
In-line tenant sales increased in all categories: gross sales per square footrose $31 to $368; same space sales rose 3.5% and same center tenant salesper square foot rose $23 to $362.Total average rent per square foot increased $1.86 to $22.65: average rentper square foot for in line tenants rose $2.12 to $32.68 while average rent persquare foot for anchor tenants remained relatively constant increasing $0.02to $11.64.Re-leasing spreads, excluding properties in the initial lease up period, rose13.7% for in-line spaces and 30.6% for same space anchors.Comparable occupancy rose 1.5% to 96.3%; an overall occupancy rate of93.3% was maintained in both periods despite redevelopment efforts atvarious centers.Comparable NOI increased 3.1% to $349.8 million.Operating income increased 28.3% to $185.4 million.
The general improvement in our key operating metrics reflects a strengtheningU.S. economy in 2004 and the continuing achievements of our remerchandis-ing efforts. Re-leasing spreads illustrate that when leases terminate we are ableto re-lease the space to retailers at higher rents but even more importantly totenants that may generate much higher sales volumes thereby attracting moreconsumers to our properties and benefiting all of the retailers at the property.
NOI is a non-GAAP measure which we believe provides us the opportunity tobetter assess the results of our operating properties before considering eachproperty’s unique capital structure and historical asset base. For our purposes,NOI is comprised of property revenue (minimum rent, percentage rent, recover-ies from tenants and other property revenue) less recoverable expenses andother operating expenses. Other operating expense includes bad debt expensebut excludes interest expense, management fees and depreciation and amorti-zation. NOI measures presented by us may not be comparable to other similarlytitled measures of other companies. Operating income, a component of net-income, is considered by management to be the most comparable GAAP measure
relative to NOI. Reconciliations between operating income and NOI follow(in millions):
Years Ended December 31, 2004 2003 2002
(Restated) (Restated)
Consolidated:Operating income $185.4 $144.5 $ 88.2Add (deduct):
General and administrative 46.5 26.1 17.4Cost of fee income 29.9 16.9 15.3Depreciation and amortization 199.5 88.7 47.9Management and other fee income (15.5) (34.8) (36.3)
Consolidated NOI $445.8 $241.4 $132.5
RESULTS OF OPERATIONSThe comparability of our operating results over the past three years has beensignificantly impacted by changes in our consolidated property portfolio. As dis-cussed under Liquidity and Capital Resources, during this three year period, we have acquired all or a portion of 21 properties; we have sold or conveyed aportion of six properties; and we have opened or re-opened four properties. Inaddition, as described under Critical Accounting Policies, on March 31, 2004,we adopted the provisions of FIN 46 which resulted in consolidating the resultsof operations of 15 previously unconsolidated joint ventures effective April 1,2004. Our partners’ equity in the results of these consolidated joint venturesand the attribution to us, as primary beneficiary, of the elimination of interestand fees against the results of the consolidated joint ventures are classified as“Minority interest in consolidated joint ventures” in our income statement. Inevaluating our results of operations on a consolidated basis, it is important toisolate the impact of properties opened, acquired and sold during either period.In the following discussions we focus on our comparable operations which wedefine as properties that we have owned, that are stabilized, and which wereopen during the periods being compared.
2004 COMPARED TO 2003:TMC’s net income rose to $232.0 million from $115.1 million in 2003. The over-all increase reflects gains on the sale or conveyance of joint venture interests($99.3 million in 2004 versus $0.7 million in 2003); decreased interest expensedue to the capitalization of interest related to joint ventures consolidated uponadoption of FIN 46; and $21.2 million of development fees and interest incomerelated to our Meadowlands Xanadu development project. These increaseswere partially offset by foreign currency exchange gains of $15.2 million in 2004compared to gains of $38.6 million in 2003. The change also reflects TMC’sincreased ownership of Mills LP as compared to that as of December 31, 2003.TMC’s ownership in Mills LP increased to 86.12% as of December 31, 2004from 78.88% at December 31, 2003 primarily due to redemption of Mills LP units.Other factors contributing to the change are discussed below.
20
Included above as comparable are the results of joint venture operations thatwere consolidated under FIN 46 beginning April 1, 2004, and that were ownedand whose properties were open and stabilized during the periods presented.Operating data for both comparable and non-comparable joint ventures consoli-dated under the provisions of FIN 46 for the nine months ended December 31,2004 was as follows (in millions):
Property revenue $284.1Property operating costs (98.5)Depreciation and amortization expense (88.7)Interest expense (75.1)Other income, net 17.7
Net income $ 39.5
Comparable NOI rose $10.5 million or 3.1% in 2004 compared to 2003.Mainstreet, our pushcart operation, contributed over half of the overall increasein minimum rent while the remainder resulted principally from the increasesnoted in re-leasing spreads and average rents discussed previously underOperating Portfolio. The change in other revenue was primarily due to tenantlease buy out income.
PORTFOLIO RESULTS OF OPERATIONSThe following reconciles portfolio operating results to our consolidated amounts (in millions). Our discussion and analysis focuses principally on comparable operat-ing results which does not distinguish between wholly and partially owned properties. Non-comparable includes the results of recently opened and/or acquiredproperties.
Less
Unconsolidated
Comparable Non-comparable Total Joint Ventures Consolidated
2004:
Minimum rent $306.7 $247.2 $553.9 $142.7 $411.2Other revenue 195.5 164.8 360.3 102.2 258.1
Property revenue 502.2 412.0 914.2 244.9 669.3Property operating costs 152.4 149.1 301.5 78.0 223.5
Net operating income $349.8 $262.9 $612.7 $166.9 $445.8
Mills proportionate share $264.5 $183.7 $448.2 $ 83.4 $364.8
2003 (RESTATED):
Minimum rent $291.0 $146.2 $437.2 $223.9 $213.3Other revenue 192.1 96.1 288.2 135.5 152.7
Property revenue 483.1 242.3 725.4 359.4 366.0Property operating costs 143.8 83.1 226.9 102.3 124.6
Net operating income $339.3 $159.2 $498.5 $257.1 $241.4
Mills proportionate share $269.4 $121.5 $390.9 $149.5 $241.4
CORPORATEThe following compares the components of our corporate operations (in millions):
2004 2003 % Change
(Restated)
Management and other fee income $ 15.5 $34.8 (55.5)%
Cost of fee income $ 29.9 $16.9 76.9%
General and administrative expenses $ 46.5 $26.1 78.2%
Depreciation and amortization $199.5 $88.7 124.9%
Management and other fee income in 2004 does not include fees from jointventures that have been consolidated since March 31, 2004 under the provi-sions of FIN 46.
Cost of fee income for 2003 includes the amounts that were previously nettedagainst management and other fee income. In 2004, the associated revenuesare classified both in management and other fee income and in the attributionto Mills of the elimination of fees included in minority interest. Cost of fees rep-resented approximately the same percentage of gross fee revenues in both years.

THE M
ILLS CO
RP
OR
ATION
Annual R
eport 2004
21
General and administrative expenses increased $20.4 million to $46.5 millionin 2004, which reflects the incremental costs and our ongoing efforts to recruit,retain and reward the human resources necessary to manage a larger and more complex portfolio as well as costs incurred in 2004 to implement the require-ments of the Sarbanes-Oxley Act and the impact of changes in our capitaliza-tion of costs.
Depreciation and amortization expense increased primarily due to non-comparable operations, higher capital expenditures for space alterations fortenants whose leases commenced during 2004 or late in 2003, and our newsoftware systems which came on line July 1, 2004.
OTHERThe following compares components of other income (expense) in 2004 to2003 (in millions):
2004 2003 Change
(Restated)
Interest expense $(148.5) $(80.6) $(67.9)Foreign currency exchange (losses) gains 15.2 38.6 (23.4)Interest income 9.0 11.5 (2.5)Other, net 9.2 (3.2) 12.4Gain on sales of joint venture interests 99.3 0.7 98.6
Interest expense increased 84.2% on a consolidated basis. Of this, $56.9 mil-lion is attributable to the joint ventures consolidated upon the adoption ofFIN 46 offset in part by additional capitalized interest relating to these joint ventures. The remaining increase was due principally to higher average bal-ances on our line of credit.
Minority interest in consolidated joint ventures is the result of our consolidationof joint ventures pursuant to the provisions of FIN 46. The results of these jointventure operations are included in our consolidated results from April 1, 2004.Equity in earnings of consolidated joint ventures represents our partners’ sharein the results of these operations. The elimination of intercompany interest andfees against the results of these operations is attributed to us, as primary benefi-ciary, and includes development fees of $39.6 million and interest income of$8.3 million.
Foreign currency exchange gains result principally from re-measuring our non-U.S. investment and advance balances which are denominated in localcurrencies into the U.S. dollar for reporting purposes. Foreign currency exchangelosses recorded during the first half of 2004 were recovered in the second half of2004 as the U.S. dollar weakened relative to the euro and Canadian dollar.
Interest income declined by 21.7% since $8.1 million is reflected as attributionto us of the elimination of interest and fees in 2004 whereas the comparableamount of $3.4 million was reflected as interest income in 2003. Additionally,there was a lower advance to Madrid Xanadú in 2004 resulting in lower interestincome. These decreases were partially offset by $3.5 million of income earnedby our consolidated joint ventures during the last nine months of 2004.
Other, net increased $12.4 million primarily due to additional land sale incomeof $19.1 million, of which $13.2 million relates to joint ventures consolidatedupon the adoption of FIN 46. This increase was partially offset by additionalabandoned project costs of $6.1 million.
Gain on sales of joint venture interests reflects gains on the sale or conveyance of joint venture interests in six properties during 2004 compared to one in 2003as more fully described under Liquidity and Capital Resources.
2003 COMPARED TO 2002:RESULTS OF OPERATIONSIn evaluating our results of operations on a consolidated basis from year-to-year,it is important to isolate the impact of properties opened, acquired or sold dur-ing either period. Since for our consolidated portfolio, over 90% of the increasein each property related line item is related to the growth in the portfolio, ourdiscussion will focus on the portion of the increase or decrease related to ourstabilized properties that we have owned and/or that have been open for at leasttwo years (“Comparable Operations”). The acquisitions and developments arediscussed in the Liquidity and Capital Resources portion of this discussion.
The line items shown in the following tables are the items we think are impor-tant in understanding our operations and which had significant changes fromyear-to-year.
Comparison of Years ended December 31, 2003 and 2002The following table reflects key items from our audited statements of income(in millions):
2003 2002 % Change
(Restated) (Restated)
Revenues:Property revenue $366.0 $203.0 80.3%Management and other fee income 34.8 36.3 (4.1)%
Total operating revenues $400.8 $239.3
Operating expenses:Property operating expenses $124.6 $ 70.5 76.7%General and administrative expenses 26.1 17.4 50.0%Cost of fee income 16.9 15.3 10.5%Depreciation and amortization 88.7 47.9 85.2%
Total operating expenses $256.3 $151.1
Interest income $ 11.5 $ 7.4 55.4%
Interest expense, net $ 80.6 $ 55.7 44.7%
Foreign currency exchange gains, net $ 38.6 $ 11.6 232.8%
Income before minority interest in Mills LP increased $73.3 million or 100% in2003 primarily due to properties acquired in late 2002 and during 2003, prop-erties developed and placed in service in late 2002 and during 2003 andforeign currency exchange gains.

22
Property revenue – property revenue increased $163.0 million or 80.3% from2002 to 2003. Of the increase 7.0%, or $11.4 million, was contributed by ourComparable Operations and is attributable to a $9.2 million increase in mini-mum rent. Nearly half of the increase in minimum rent was contributed byMainstreet, our push cart operation. Other increases in minimum rent were dueto increased occupancy, higher rents and a full year of rents for tenants thatmoved into centers late in 2002.
Management and other fee income and Cost of fee income – management andother fee income decreased $1.5 million or 4.1% from 2002 to 2003. Cost of fee income increased $1.6 million or 10.5% from 2002 to 2003. While manage-ment fee income rose from our larger portfolio of unconsolidated joint ventures,developments fees decreased $4.4 million in 2003 when compared to 2002.Development, leasing and financing fees are related to specific transactionsand tend to have higher variability between periods. Cost of fee income was alower percentage of the associated revenues since development fees werehigher in 2002 and development fees have the highest profit margin.
Property operating expenses – property operating expenses, which includesrecoverable from tenants and other operating, increased $54.3 million, or 77.0%,from 2002 to 2003. Of the increase 5.3%, or $2.9 million, was related to ourComparable Operations.
General and administrative expenses – general and administrative expensesincreased $8.7 million or 50.0% from 2002 to 2003. Of the increase, $6.2 mil-lion is attributable to strengthening the corporate staff in terms of size, experienceand knowledge base to better manage the larger portfolio and the growing com-plexities of property acquisitions, international operations and our multi-faceteddevelopment opportunities.
Depreciation and amortization – depreciation and amortization increased85.2%, or $40.8 million from 2002 to 2003, of which $34.1 million is attributableto recently acquired and opened centers.
Interest income, net – interest income, net increased $4.1 million or 55.4%from 2002 to 2003. The increase is primarily attributable to interest earned onadvances to Madrid Xanadú made late in 2002 that were outstanding in 2003.
Interest expense – interest expense increased $24.9 million or 44.7% from2002 to 2003. New properties contributed $34.6 million of additional interestexpense while another $3.7 million was incurred on our line of credit, whichwas utilized to fund advances to joint ventures and for development expendi-tures. Partially offsetting these increases was an increase in capitalized interest.
Gain on foreign currency transactions – gain on foreign currency transactionsincreased $27.0 million or 232.8% from 2002 to 2003. The benefit results pri-marily from higher investment balances remeasured based on the weakeningUS dollar against the Euro. These gains result from re-measuring our investmentand advance balances which are denominated in local currencies into theU.S. dollar for reporting purposes.
UNCONSOLIDATED JOINT VENTURESThe following table reflects key items from the combined condensed results ofoperations of our unconsolidated joint ventures (in millions):
2003 2002 % Change
(Restated) (Restated)
Operating revenues $359.4 $288.2 24.7%
Operating expenses $226.9 $187.1 21.3%
Interest expense $107.4 $ 82.5 30.2%
Other income (expense) $ 10.9 $ 25.3 (56.9)%
Our equity in earnings $ 34.6 $ 24.0 44.2%
Operating revenues – operating revenues increased $71.2 million or 24.7%from 2002 to 2003. The increase is primarily attributable to recently acquiredand opened unconsolidated joint ventures.
Operating expenses – operating expenses increased $39.8 million or 21.3%from 2002 to 2003. The increase is primarily attributable to recently acquiredand opened unconsolidated joint ventures.
Interest expense – interest expense increased $24.9 million or 30.2% from2002 to 2003. Almost half of the increase is attributable to the recently acquiredand opened unconsolidated joint ventures. The other half is attributable totwo construction loans that were refinanced in late 2002 with higher fixed ratepermanent mortgage loans.
Other income (expense) – other income (expense) decreased $14.4 million or56.9% from 2002 to 2003. Higher land sales in 2002 coupled with start upcosts at our Madrid Xanadú Snow Dome venture in 2003 account for $8.0 mil-lion or 55.6% of the decrease.
Our equity in earnings – our equity in earnings increased $10.6 million or44.2% from 2002 to 2003. The increase is primarily attributable to the changesdescribed above.
FUNDS FROM OPERATIONS (“FFO”)FFO is a recognized metric by the real estate industry, in particular, REITs.Accounting for real estate assets using historical cost accounting under GAAPassumes that the value of such assets diminishes predictably over time. TheNational Association of Real Estate Investment Trusts (“NAREIT”) stated in itsApril 2002 White Paper on Funds from Operations, “since real estate asset val-ues have historically risen or fallen with market conditions, many industryinvestors have considered presentations of operating results for real estate companies that use historical cost accounting to be insufficient by themselves.” As a result, the concept of FFO was created by NAREIT. As defined by NAREIT,FFO is “net income (computed in accordance with GAAP), excluding gains orlosses from sales of property, plus depreciation and amortization, and afteradjustments for unconsolidated partnerships and joint ventures. Adjustmentsfor unconsolidated partnerships and joint ventures will be calculated to reflectfunds from operations on the same basis.”
THE M
ILLS CO
RP
OR
ATION
Annual R
eport 2004
23
For management analysis purposes, we adjust the NAREIT defined FFO toexclude the effects of foreign currency exchange rate fluctuations reflected in netincome arising primarily through the re-measurement process of translating for-eign investment and advance accounts for inclusion in our U.S. dollar financialstatements. Although we believe this adjustment presents FFO on a more com-parable basis to FFO presented by other REITs, it is important to realize that ourFFO computation may be significantly different from that used by other REITsand, accordingly, may, in fact, not be comparable.
TMC conducts all of its operations through Mills LP. In addition, if initiated by a holder of units of Mills LP, the minority interest in Mills LP is exchangeable in specified circumstances for either, in TMC’s sole discretion, shares of itscommon stock on a one-for-one basis or the cash equivalent. Accordingly, wepresent FFO data for both TMC and Mills LP. Management uses FFO to mea-sure operating performance of our business and as one of several criteria todetermine performance based bonuses. We offer this measure to assist theusers of our financial statements in analyzing our performance; however, this isnot a measure of financial performance under GAAP and should not be consid-ered a measure of liquidity, an alternative to net income or an indicator of anyother performance measure determined in accordance with GAAP. Investorsand potential investors in our securities should not rely on this measure as asubstitute for any GAAP measure, including net income.
The following reconciles income from continuing operations, which is consideredto be the most comparable GAAP measure, to FFO. We urge the users of ourfinancial statements, including investors and potential investors in our securities,to carefully review the following reconciliation (in millions).
Years Ended December 31, 2004 2003 2002
(Restated) (Restated)
TMC income from continuing operations $189.9 $115.0 $ 50.5Add (deduct):
Depreciation and amortization 194.7 85.3 47.9Equity in depreciation and amortization from unconsolidated joint ventures 33.4 61.7 45.3Partners’ share of depreciation and amortization from consolidated joint ventures (47.4) – –Gain on sales of joint venture interests (84.0) (0.7) –Foreign currency exchange gains (15.2) (38.6) (11.6)Equity in foreign currency exchange gains from unconsolidated joint ventures – (2.1) –Mills LP common unit holders’ share of above adjustments (10.9) (22.1) (25.9)
TMC FFO 260.5 198.5 106.2Add minority interest reflected as equity in Mills LP 41.4 53.2 48.4
Mills LP FFO 301.9 251.7 154.6Less preferred unit distributions (44.8) (28.5) (2.6)
FFO available to Mills LP common unit holders $257.1 $223.2 $152.0
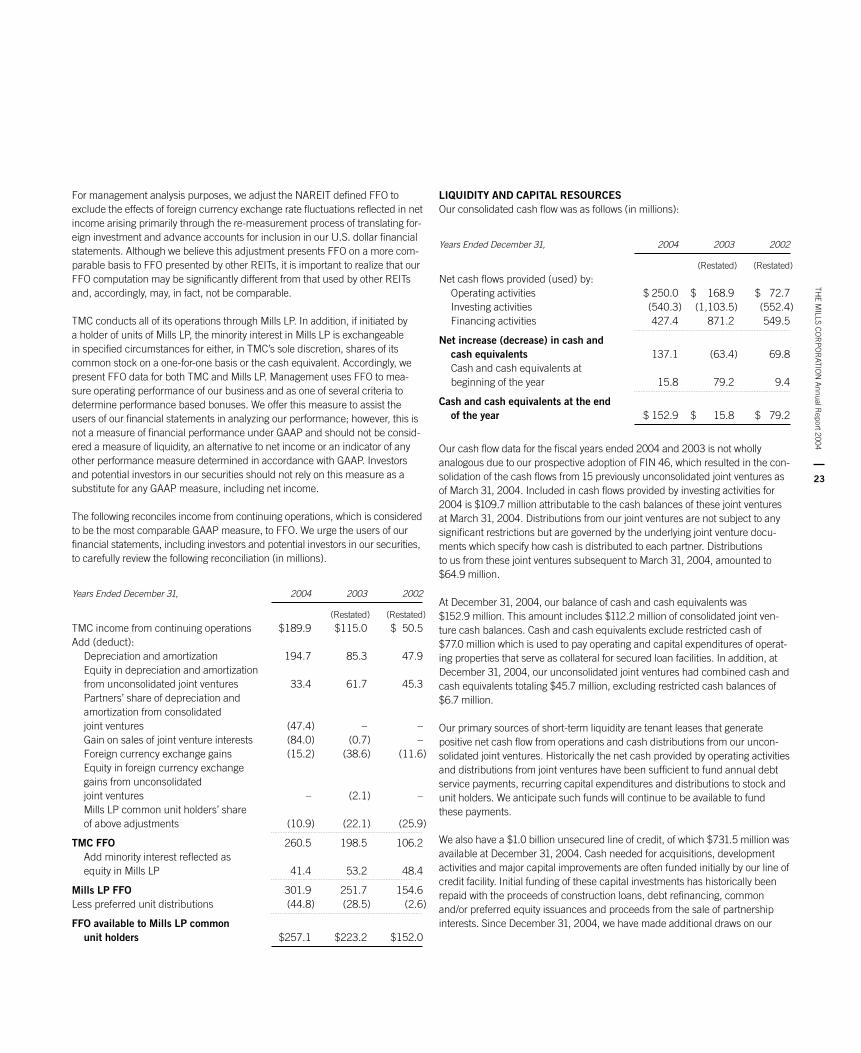
LIQUIDITY AND CAPITAL RESOURCESOur consolidated cash flow was as follows (in millions):
Years Ended December 31, 2004 2003 2002
(Restated) (Restated)
Net cash flows provided (used) by:Operating activities $ 250.0 $ 168.9 $ 72.7Investing activities (540.3) (1,103.5) (552.4)Financing activities 427.4 871.2 549.5
Net increase (decrease) in cash and cash equivalents 137.1 (63.4) 69.8Cash and cash equivalents at beginning of the year 15.8 79.2 9.4
Cash and cash equivalents at the end of the year $ 152.9 $ 15.8 $ 79.2
Our cash flow data for the fiscal years ended 2004 and 2003 is not wholly analogous due to our prospective adoption of FIN 46, which resulted in the con-solidation of the cash flows from 15 previously unconsolidated joint ventures asof March 31, 2004. Included in cash flows provided by investing activities for2004 is $109.7 million attributable to the cash balances of these joint venturesat March 31, 2004. Distributions from our joint ventures are not subject to anysignificant restrictions but are governed by the underlying joint venture docu-ments which specify how cash is distributed to each partner. Distributions to us from these joint ventures subsequent to March 31, 2004, amounted to$64.9 million.
At December 31, 2004, our balance of cash and cash equivalents was$152.9 million. This amount includes $112.2 million of consolidated joint ven-ture cash balances. Cash and cash equivalents exclude restricted cash of$77.0 million which is used to pay operating and capital expenditures of operat-ing properties that serve as collateral for secured loan facilities. In addition, atDecember 31, 2004, our unconsolidated joint ventures had combined cash andcash equivalents totaling $45.7 million, excluding restricted cash balances of$6.7 million.
Our primary sources of short-term liquidity are tenant leases that generate positive net cash flow from operations and cash distributions from our uncon-solidated joint ventures. Historically the net cash provided by operating activitiesand distributions from joint ventures have been sufficient to fund annual debtservice payments, recurring capital expenditures and distributions to stock andunit holders. We anticipate such funds will continue to be available to fundthese payments.
We also have a $1.0 billion unsecured line of credit, of which $731.5 million wasavailable at December 31, 2004. Cash needed for acquisitions, developmentactivities and major capital improvements are often funded initially by our line ofcredit facility. Initial funding of these capital investments has historically beenrepaid with the proceeds of construction loans, debt refinancing, commonand/or preferred equity issuances and proceeds from the sale of partnershipinterests. Since December 31, 2004, we have made additional draws on our
24
line of credit aggregating $188.0 million. Our ability to draw on our line of creditis subject to the maintenance of the financial ratios specified in the line of creditagreement. While we believe we will be able to maintain a capital structure thatwill enable us to have access to the line of credit, it is possible that certain of thefinancial ratios could constrain our ability to access the entire committed amount.
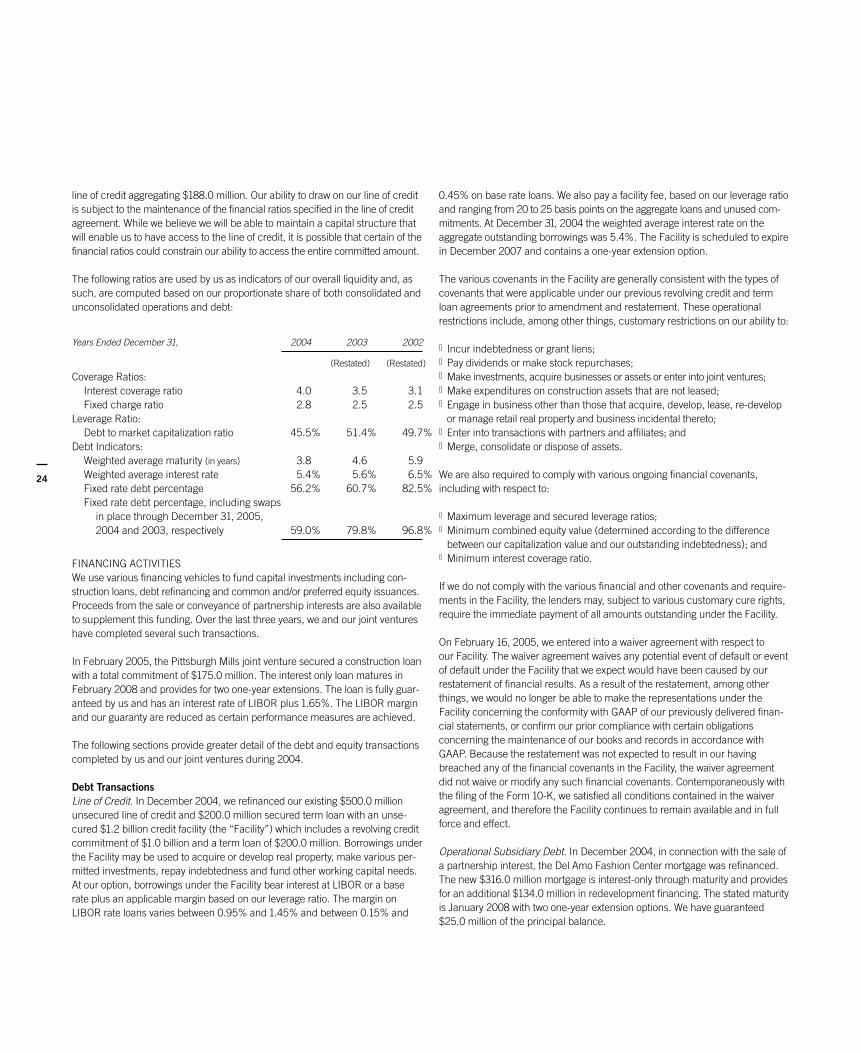
The following ratios are used by us as indicators of our overall liquidity and, assuch, are computed based on our proportionate share of both consolidated andunconsolidated operations and debt:
Years Ended December 31, 2004 2003 2002
(Restated) (Restated)
Coverage Ratios:Interest coverage ratio 4.0 3.5 3.1Fixed charge ratio 2.8 2.5 2.5
Leverage Ratio:Debt to market capitalization ratio 45.5% 51.4% 49.7%
Debt Indicators:Weighted average maturity (in years) 3.8 4.6 5.9Weighted average interest rate 5.4% 5.6% 6.5%Fixed rate debt percentage 56.2% 60.7% 82.5%Fixed rate debt percentage, including swaps
in place through December 31, 2005, 2004 and 2003, respectively 59.0% 79.8% 96.8%
FINANCING ACTIVITIESWe use various financing vehicles to fund capital investments including con-struction loans, debt refinancing and common and/or preferred equity issuances.Proceeds from the sale or conveyance of partnership interests are also availableto supplement this funding. Over the last three years, we and our joint ventureshave completed several such transactions.
In February 2005, the Pittsburgh Mills joint venture secured a construction loanwith a total commitment of $175.0 million. The interest only loan matures inFebruary 2008 and provides for two one-year extensions. The loan is fully guar-anteed by us and has an interest rate of LIBOR plus 1.65%. The LIBOR marginand our guaranty are reduced as certain performance measures are achieved.
The following sections provide greater detail of the debt and equity transactionscompleted by us and our joint ventures during 2004.
Debt TransactionsLine of Credit. In December 2004, we refinanced our existing $500.0 millionunsecured line of credit and $200.0 million secured term loan with an unse-cured $1.2 billion credit facility (the “Facility”) which includes a revolving creditcommitment of $1.0 billion and a term loan of $200.0 million. Borrowings underthe Facility may be used to acquire or develop real property, make various per-mitted investments, repay indebtedness and fund other working capital needs.At our option, borrowings under the Facility bear interest at LIBOR or a baserate plus an applicable margin based on our leverage ratio. The margin onLIBOR rate loans varies between 0.95% and 1.45% and between 0.15% and
0.45% on base rate loans. We also pay a facility fee, based on our leverage ratioand ranging from 20 to 25 basis points on the aggregate loans and unused com-mitments. At December 31, 2004 the weighted average interest rate on theaggregate outstanding borrowings was 5.4%. The Facility is scheduled to expirein December 2007 and contains a one-year extension option.
The various covenants in the Facility are generally consistent with the types ofcovenants that were applicable under our previous revolving credit and termloan agreements prior to amendment and restatement. These operationalrestrictions include, among other things, customary restrictions on our ability to:
Incur indebtedness or grant liens;Pay dividends or make stock repurchases;Make investments, acquire businesses or assets or enter into joint ventures;Make expenditures on construction assets that are not leased;Engage in business other than those that acquire, develop, lease, re-developor manage retail real property and business incidental thereto;Enter into transactions with partners and affiliates; andMerge, consolidate or dispose of assets.
We are also required to comply with various ongoing financial covenants,including with respect to:
Maximum leverage and secured leverage ratios;Minimum combined equity value (determined according to the differencebetween our capitalization value and our outstanding indebtedness); andMinimum interest coverage ratio.
If we do not comply with the various financial and other covenants and require-ments in the Facility, the lenders may, subject to various customary cure rights,require the immediate payment of all amounts outstanding under the Facility.
On February 16, 2005, we entered into a waiver agreement with respect to our Facility. The waiver agreement waives any potential event of default or eventof default under the Facility that we expect would have been caused by ourrestatement of financial results. As a result of the restatement, among otherthings, we would no longer be able to make the representations under theFacility concerning the conformity with GAAP of our previously delivered finan-cial statements, or confirm our prior compliance with certain obligationsconcerning the maintenance of our books and records in accordance withGAAP. Because the restatement was not expected to result in our havingbreached any of the financial covenants in the Facility, the waiver agreementdid not waive or modify any such financial covenants. Contemporaneously withthe filing of the Form 10-K, we satisfied all conditions contained in the waiveragreement, and therefore the Facility continues to remain available and in fullforce and effect.
Operational Subsidiary Debt. In December 2004, in connection with the sale ofa partnership interest, the Del Amo Fashion Center mortgage was refinanced.The new $316.0 million mortgage is interest-only through maturity and providesfor an additional $134.0 million in redevelopment financing. The stated maturityis January 2008 with two one-year extension options. We have guaranteed$25.0 million of the principal balance.

THE M
ILLS CO
RP
OR
ATION
Annual R
eport 2004
25
In connection with the acquisition of the 50.0% interest in the properties fromGM Trusts in October 2004, we obtained the following financings:
The $196.8 million Briarwood mortgage loan was amended and restated.$192.4 million of the loan is interest only through maturity, while the remain-ing $4.4 million amortizes on a 5 year amortization schedule thoughJuly 2009. The loan bears interest at a blended interest rate of 4.48% andmatures November 2009.The $148.2 million Falls mortgage loan was amended and restated. The inter-est only loan bears interest at a blended interest rate of 4.34% and maturesNovember 2009.The $293.8 million Stoneridge Mall mortgage loan was amended and restated.The loan bears interest at LIBOR plus 0.95% and matures November 2009.An interest rate swap fixes the interest rate at 4.63% on a notional amount of$176.3 million through maturity.We assumed the $46.2 million Hilltop mortgage loan. The interest only loanbears interest at LIBOR plus 0.65% and matures October 2005.We assumed the $99.0 million Lakeforest mortgage loan. The interest onlyloan bears interest at LIBOR plus 0.65% and matures October 2005.We assumed the $75.0 million Marley Station mortgage loan. The interestonly loan bears interest at LIBOR plus 0.65% and matures October 2005.We assumed the $120.0 million Mall at Tuttle Crossing mortgage loan. The loanbears interest at 5.05% and is interest only through November 2006. Thereafter,it amortizes on a 30 year schedule with a balloon payment due at maturity inNovember 2013.We financed the $182.0 million Meadowood Mall mortgage loan. The loan bearsinterest at LIBOR plus 0.87% and matures in November 2009. An interest rateswap fixes the interest rate at 4.08% on a notional amount of $109.2 millionthrough November 2007.
In October 2004, the Colorado Mills joint venture refinanced its constructionloan with a $170.0 million mortgage. The mortgage bears interest at LIBOR plus1.78% and is interest-only through maturity. The stated maturity date isNovember 2007 but we intend to exercise our two one-year extension options.
In April 2004, the Discover Mills joint venture construction loan was amendedand componentized into a $119.4 million mortgage and a $42.6 million mezzanine loan. The mortgage bears interest at LIBOR plus 1.75% while themezzanine loan bears interest at LIBOR plus 3.00%. On a notional amount of$39.5 million of the mezzanine loan, interest rate swaps fix the interest rate at4.69% through March 2005, 6.29% from April 2005 though March 2006 and7.53% from April 2006 through maturity. Both have a stated maturity of April 2007with one-year extension options and are fully guaranteed by us. Our guarantyfor the mortgage is reduced when certain performance measures are achieved.
In February 2004, construction financing for Vaughan Mills, an unconsoli-dated joint venture, was obtained from an affiliate of our partner in the project. The loan has a total commitment of $157.8 million and a stated maturity ofMarch 2006 with a one-year extension option. We guarantee 50.0% of the loanwhich has an interest rate of CDOR plus 2.25%. The CDOR margin and ourguaranty are reduced as certain performance measures are achieved.
In February 2004, we refinanced the Cincinnati Mills construction loan and thecommitment was increased to $122.0 million. The loan is 75% guaranteed byus and matures in February 2007 although it provides for two one-year exten-sions. The interest rate is LIBOR plus 2.00%. An interest rate swap fixes theinterest rate at 5.88% through October 2006 on a notional amount of $57.0 mil-lion. Our guaranty is reduced when certain performance measures are achieved.
In January 2004, in connection with the acquisition of Westland Mall, weobtained a $58.8 million mortgage. The mortgage bears interest at 4.95% andis interest-only through February 2007. Thereafter, it amortizes on a 30 yearschedule with a balloon payment due in February 2011.
In January 2004, we refinanced substantially all of the Concord MillsMarketplace construction loan with a $16.4 million mortgage. The new mort-gage bears interest at 5.76% and is amortizing on a 30 year schedule with a balloon payment due in February 2014.
Equity TransactionIn August 2004, we sold 316,250 shares of Series F Convertible CumulativeRedeemable Preferred Stock in an offering made under Rule144A of the SecuritiesAct to qualified institutional buyers generating net proceeds of $306.2 million.
INVESTING ACTIVITIESIn January 2005, together with our partner in Vaughan Mills, we purchasedSt. Enoch Centre in Glasgow, Scotland for $514.4 million, excluding transactioncosts. Each of us owns an undivided 50% interest in the property. The trans-action was financed with a mortgage on the property, our share of which was$179.3 million, and cash. In March 2005, we acquired Southdale Center nearMinneapolis, MN and Southridge Mall near Milwaukee, WI for $451.6 million.The transaction was financed with a $186.6 million mortgage for SouthdaleCenter, a $124.0 million mortgage for Southridge Mall, and cash.
The following sections describe our investing activities during 2004.
AcquisitionsIn October 2004, we purchased a 50% interest in nine regional mall properties(the “GM Portfolio”). We paid $452.1 million in cash for the equity in the under-lying entities. Our proportionate share of pre-existing property debt assumedwas $170 million, and our proportionate share of property debt incurred in con-nection with the transaction was $410 million. The GM Portfolio has a combinedGLA of 8.9 million square feet and includes Briarwood Mall, Columbus CityCenter, The Falls, Hilltop Mall, Lakeforest Mall, Marley Station, MeadowoodMall, Stoneridge Mall and The Mall at Tuttle Crossing.
In August 2004, we acquired our partner’s interest in Madrid Xanadú and theSnow Dome venture located at the property for an initial price of $45.0 million.The price is subject to adjustment utilizing a formula based on 2003 operatingresults. The amount, if any, of the adjustment has not been determined.
In January 2004, we acquired Westland Mall near Miami, Florida for $78.8 million.

26
DispositionsIn December 2004, we sold a 50% joint venture interest in Del Amo FashionCenter for $221.8 million, including $158.0 million of the venture’s debt. Werecognized no material gain or loss on the sale. In December 2004, we also solda 50% joint venture interest in a parcel of land adjacent to the Del Amo FashionCenter for $22.8 million and recognized a $15.3 million gain.
In August 2004, we and KanAm sold a 50% joint venture interest in OntarioMills for $170.3 million. The joint venture interest sold consisted of KanAm’sentire interest and a portion of our interest. We received proceeds of $50.7 mil-lion on our portion of the sale and recognized a gain of $39.6 million.
In March 2004, we conveyed a 51% joint venture interest in Opry Mills for pro-ceeds of $68.9 million and recognized a gain of $35.9 million. In conjunctionwith this transaction, we terminated a swap agreement and recorded a$5.3 million charge against the gain.
In June 2004, we recorded a gain of $8.5 million from our August 2003 con-veyance to KanAm of an additional 6.375% partnership interest in each of theArundel Mills, Concord Mills and Grapevine Mills centers for proceeds of$28.1 million. Due to our continuing involvement in the joint ventures, we wereprecluded from recognizing the transactions as sales until June 2004 when theunderlying joint venture agreements were amended to remove the terms com-prising the continuing involvement.
Projects OpenedVaughan Mills – Toronto, Canada: In November 2004, we opened the firstenclosed, regional shopping center to be built in Canada in over 14 yearsopened. The $240.0 million project was developed jointly with IvanhoeCambridge, a shopping center developer based in Montréal, Canada and wasfunded by the $157.8 million construction loan described previously with theremainder of the funding provided equally by us and Ivanhoe Cambridge. Weeach own an undivided 50% interest in the project as tenants in common andreceive 50% of all revenues and are responsible for funding 50% of all expenses.At any time after the fourth anniversary of the opening of the project, eitherco-owner may exercise a buy-sell provision.
Cincinnati Mills – Cincinnati, OH: In August 2004, we completed our $169.0 millionrenovation of the mall which we acquired in September 2002. The $169.0 millionproject was funded primarily by the $122.0 million construction loan describedabove.
Projects Under ConstructionWe currently have two projects under construction, which we anticipate willhave an aggregate of 3.3 million square feet of GLA upon completion. We arecurrently estimating the total development cost for these projects at $1.1 billion.
Pittsburgh Mills – Pittsburgh, PA: This project is scheduled to open during the summer of 2005. The joint venture building the center includes KanAm,AV Associates and us. We have a 37.5% capital contribution percentage and a56.3% residual sharing interest in the joint venture. As of December 31, 2004,the project was 72.8% pre-leased, including 9 anchor stores. The project isexpected to contain approximately 1.1 million square feet of GLA at full build-outat an estimated aggregate project cost of approximately $218.3 million. The
project costs will be funded by construction loans and equity contributions fromus and our joint venture partners. Our total expected equity contribution to theproject is $26.0 million. At December 31, 2004, we had contributed $57.8 mil-lion which, as a result of land sales and other project recoveries, was reduced to$26.1 million in January 2005.
Meadowlands Xanadu – East Rutherford, NJ: In December 2003, we executeda redevelopment agreement with the New Jersey Sports & Exposition Authority,or the NJSEA, pursuant to which we will redevelop the Continental Arena site.The project is being developed by a joint venture that includes Mills, KanAmand Mack-Cali Realty Corporation, or Mack-Cali. We executed a ground leasefor the site in October 2004, under which the joint venture is required to pay aninitial deposit totaling $160.0 million, of which $50.0 million was paid to escrowin March 2005 after receiving the required approvals and permits to proceed withthe project.
Upon completion, Meadowlands Xanadu is planned to include a 2.2 millionsquare feet family entertainment and recreation complex with five themedzones and an office and hotel component with four office buildings and a520-room hotel with conference and exhibition facilities. As of December 31,2004, we had invested $109.3 million, including capitalized interest, KanAmhad invested $210.2 million and Mack-Cali had invested $17.1 million.
In October 2004, an entity owned by Meadowlands Mills acquired a 587-acretract of land adjacent to the Continental Arena site, or the Empire Tract. In con-nection with the redevelopment agreement with NJSEA, we conveyed theEmpire Tract to a non-profit conservation trust in exchange for a payment orcredit of $26.8 million granted by the NJSEA.
Projects Under DevelopmentIn addition to the projects under construction, we are actively pursuing the development of other projects. These projects are at various stages of thedue diligence process during which we determine site/demographic viability,negotiate tenant commitments and work through the third party approvalprocesses. Generally we will not begin construction until we have completed ourdue diligence process and obtained pre-leasing commitments. While we currentlybelieve these projects will ultimately be completed, we cannot assure you that theywill actually be constructed or that they will have any particular level of operationalsuccess or ultimate value.
We currently have a number of projects under development. The four mostadvanced projects are discussed below. Our investment in these four projectswas $59.5 million as of December 31, 2004.
Mercati Generali – Rome, Italy. On November 19, 2004, the city of Romeannounced that we were the winning bidder to develop an urban retail, enter-tainment and cultural center on the former site of Mercati Generali, a generalfood market near the Roman Forum and Coliseum. On January 24, 2005, thecity of Rome issued the Provisional Award for the proposed development. Weanticipate receiving the Final Award no later than the end of the second quarterof 2005. Once the city of Rome has issued the Final Award, we have 60 days toexecute a Concession Agreement with the city, under which we will have theright to develop and operate the property for 60 years. Our development part-ners for the project are Lamaro Appalti S.p.a. and Cogeim S.p.a. We have

THE M
ILLS CO
RP
OR
ATION
Annual R
eport 2004
27
executed a preliminary joint venture agreement and expect to execute a defini-tive joint venture agreement before we execute the Concession Agreement withthe City of Rome. We anticipate breaking ground in 2005; the project is cur-rently expected to provide approximately 830,000 square feet of leisure,cultural and retail options.
108 North State Street – Chicago, IL. In June 2002, we were selected by theCity of Chicago to negotiate the development of 108 N. State Street, a key cityblock opposite the Marshall Fields department store in downtown Chicago, as a 21st Century Retail and Entertainment Center mixed-use project includingretail, office, residential and hotel uses. We are proceeding with obtaining theappropriate entitlements. We continue to discuss the proposed retail portionwith prospective tenants and continue to negotiate with an office developer todevelop the office portion of the project.
Woodbridge, VA. In 2004, we acquired property in northern Virginia locatednear Potomac Mills. We are proceeding with obtaining entitlements at the stateand local level. We and our partner, Lerner Enterprises, plan on developing anopen air 21st Century Retail and Entertainment Center.
San Francisco Piers 27–31 – San Francisco, CA. In April 2001, the SanFrancisco Port Commission awarded us the exclusive right to negotiate for along-term lease on Piers 27–31 on the San Francisco waterfront on which todevelop a 21st Century Retail and Entertainment Center full-price mixed-useretail, office, entertainment and recreation project. These negotiations began in2003 and are ongoing. Concurrent with these negotiations, we are proceedingwith obtaining entitlements at the state and local level.
Projects Under Redevelopment and RenovationWe are also engaged in various redevelopment and renovation projects at someof our operating properties. The following is a brief description of those projects:
Sawgrass – Ft. Lauderdale, FL. In 2004, we completed our renovation toupgrade the fourteen year old shopping center, which included replacing theflooring and interior graphics, introduced brighter color schemes, added newlighting fixtures and improved the seating areas in the food courts. We alsoimproved the exterior of the shopping center. We also begun construction of a110,000 square foot open-air promenade called The Colonnade, which will offeradditional retail and dining options, and is expected to open in the fourth quar-ter of 2005.
Del Amo – Los Angeles, CA. We continue to pursue our plan to redevelop ourDel Amo Fashion Center that will include the addition of new department storeanchors and the introduction of additional tenants with higher price points thanthe property’s current tenants. In 2004, we demolished the vacant wing, for-merly anchored by Montgomery Ward, and have begun to construct an open airretail and lifestyle wing, which we anticipate opening in the first half of 2006.Additionally, it is anticipated that a parcel of peripheral land will be sold.
In addition to the projects discussed above, we are also conducting due dili-gence on several other proposed sites for future projects, including sites inBoston, Massachusetts; Tampa, Florida; and San Francisco, California. We arealso reviewing other potential retail and entertainment development oppor-tunities internationally. For example, we are exploring follow-on opportunities
beyond Madrid Xanadú for sites in and around Seville, Valencia and Barcelona,Spain. In addition, we are pursuing various opportunities in the United Kingdomand Italy.
Strategic RelationshipsKanAm/KanAm Grund: We have a long-standing relationship with KanAm.KanAm currently manages approximately $10 billion on behalf of private andinstitutional investors through publicly offered real estate funds and privateplacements. Since 1994, KanAm has invested approximately $1.0 billion ofequity in our various projects. As of December 31, 2004, KanAm also owned1.23% of the common partnership units of Mills LP.
Ivanhoe Cambridge: We have a master agreement with Ivanhoe Cambridge,pursuant to which we have agreed, if we both deem feasible, to jointly acquire,develop, construct, own and operate Mills Landmark Centers in four provincesof Canada as well as one or more Block projects throughout Canada. Thisagreement extends through December 31, 2015.
GM Trusts: In August 2004, we purchased an approximate 50% managingmember LLC interest in nine regional mall properties from GM Trusts which is the holding company for certain investment advisors and fiduciaries and,through its affiliates, currently manages over $148 billion in total assets for affili-ated and unaffiliated trusts.
Future Capital RequirementsWe anticipate that future expenditures including operating expenses, interestexpenses and recurring principal payments on outstanding indebtedness,recurring capital expenditures; dividends to stockholders in accordance withREIT requirements and distributions to common unitholders, will be providedby cash generated from operations and potential peripheral land sales. Weanticipate that future development and non-recurring capital expenditures willbe funded from cash from operations, proceeds from land sales, future borrow-ings, joint venture equity contributions and proceeds from issuances ofpreferred and/or common equity. Access to such future capital is dependent onmany factors outside of our control. We believe that we will have access to addi-tional capital resources sufficient to expand and develop our business and tocomplete the projects currently under development. If we cannot raise the nec-essary capital, our immediate and long-term development plans could be curtailed.
Off Balance Sheet ArrangementsAs of December 31, 2004, our material off-balance sheet commitments wereas follows:
We had provided letters of credit totaling $22.3 million, of which $10.0 millionrelates to Meadowlands Xanadu, $5.0 million relates to Pittsburgh Mills and$5.8 million relates to Vaughan Mills. As of December 31, 2004 no amountshad been drawn on the letters.We had guaranteed $113.5 million of our unconsolidated joint venture debt, whichwill be reduced as certain performance criteria are met. We generally guaranty ourshare of any construction loan and our joint venture partners’ share of the con-struction loan until permanent financing is obtained.We generally guarantee a 9% preferred return on KanAm’s equity balance inour consolidated joint ventures until permanent financing is obtained.
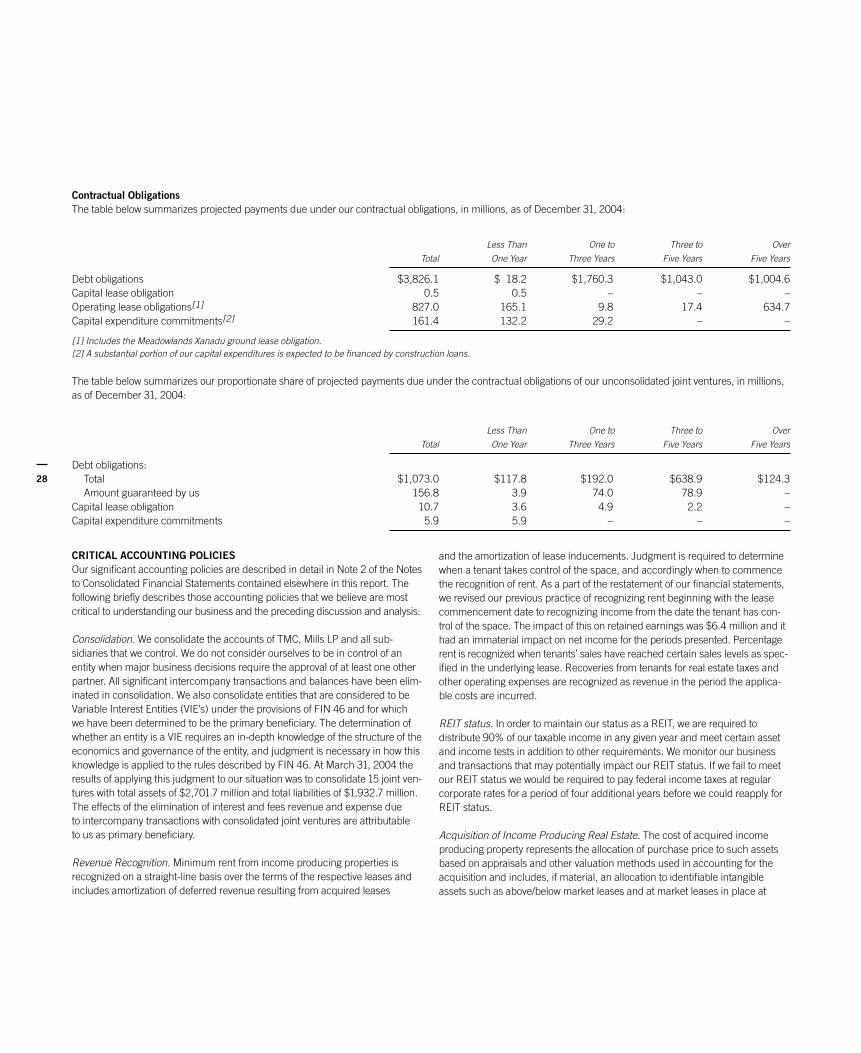
28
Contractual ObligationsThe table below summarizes projected payments due under our contractual obligations, in millions, as of December 31, 2004:
Less Than One to Three to Over
Total One Year Three Years Five Years Five Years
Debt obligations $3,826.1 $ 18.2 $1,760.3 $1,043.0 $1,004.6Capital lease obligation 0.5 0.5 – – –Operating lease obligations[1] 827.0 165.1 9.8 17.4 634.7Capital expenditure commitments[2] 161.4 132.2 29.2 – –
[1] Includes the Meadowlands Xanadu ground lease obligation.[2] A substantial portion of our capital expenditures is expected to be financed by construction loans.
The table below summarizes our proportionate share of projected payments due under the contractual obligations of our unconsolidated joint ventures, in millions,as of December 31, 2004:
Less Than One to Three to Over
Total One Year Three Years Five Years Five Years
Debt obligations:Total $1,073.0 $117.8 $192.0 $638.9 $124.3Amount guaranteed by us 156.8 3.9 74.0 78.9 –
Capital lease obligation 10.7 3.6 4.9 2.2 –Capital expenditure commitments 5.9 5.9 – – –
CRITICAL ACCOUNTING POLICIESOur significant accounting policies are described in detail in Note 2 of the Notesto Consolidated Financial Statements contained elsewhere in this report. Thefollowing briefly describes those accounting policies that we believe are mostcritical to understanding our business and the preceding discussion and analysis:
Consolidation. We consolidate the accounts of TMC, Mills LP and all sub-sidiaries that we control. We do not consider ourselves to be in control of anentity when major business decisions require the approval of at least one otherpartner. All significant intercompany transactions and balances have been elim-inated in consolidation. We also consolidate entities that are considered to beVariable Interest Entities (VIE’s) under the provisions of FIN 46 and for which we have been determined to be the primary beneficiary. The determination ofwhether an entity is a VIE requires an in-depth knowledge of the structure of theeconomics and governance of the entity, and judgment is necessary in how thisknowledge is applied to the rules described by FIN 46. At March 31, 2004 theresults of applying this judgment to our situation was to consolidate 15 joint ven-tures with total assets of $2,701.7 million and total liabilities of $1,932.7 million.The effects of the elimination of interest and fees revenue and expense due to intercompany transactions with consolidated joint ventures are attributable to us as primary beneficiary.
Revenue Recognition. Minimum rent from income producing properties is recognized on a straight-line basis over the terms of the respective leases andincludes amortization of deferred revenue resulting from acquired leases
and the amortization of lease inducements. Judgment is required to determinewhen a tenant takes control of the space, and accordingly when to commencethe recognition of rent. As a part of the restatement of our financial statements,we revised our previous practice of recognizing rent beginning with the leasecommencement date to recognizing income from the date the tenant has con-trol of the space. The impact of this on retained earnings was $6.4 million and ithad an immaterial impact on net income for the periods presented. Percentagerent is recognized when tenants’ sales have reached certain sales levels as spec-ified in the underlying lease. Recoveries from tenants for real estate taxes andother operating expenses are recognized as revenue in the period the applica-ble costs are incurred.
REIT status. In order to maintain our status as a REIT, we are required to distribute 90% of our taxable income in any given year and meet certain assetand income tests in addition to other requirements. We monitor our businessand transactions that may potentially impact our REIT status. If we fail to meetour REIT status we would be required to pay federal income taxes at regularcorporate rates for a period of four additional years before we could reapply forREIT status.
Acquisition of Income Producing Real Estate. The cost of acquired income producing property represents the allocation of purchase price to such assetsbased on appraisals and other valuation methods used in accounting for theacquisition and includes, if material, an allocation to identifiable intangibleassets such as above/below market leases and at market leases in place at
THE M
ILLS CO
RP
OR
ATION
Annual R
eport 2004
29
date of acquisition based on their fair values. External costs directly related toacquisition opportunities we are actively pursuing are capitalized. If we are suc-cessful in completing the acquisition, such costs are allocated to the acquiredproperty as part of the purchase price. If not, such costs are expensed in theperiod it becomes likely the acquisition will not be completed.
Income producing properties are individually evaluated for impairment whenvarious conditions exist that may indicate that it is probable that the sum ofexpected undiscounted future cash flows from a property is less than its his-torical net cost basis. Upon determination that a permanent impairment hasoccurred, we record an impairment charge equal to the excess of historical costbasis over fair value. In addition, we write off costs related to predevelopmentprojects when we determine it is no longer probable that we will develop theproject. Determining the fair value of an asset, and accordingly the impairmentchange, if any, to record, requires making judgmental estimates of the future cashflows and operations of the item, together with the selection of an appropriatediscount rate.
Equity Method. Equity in the income or loss of joint ventures is recorded on theequity method of accounting. We allocate income to equity participants basedon the terms of the respective partnership agreements upon an assumed liqui-dation of the joint venture at its depreciated book value as of the end of thereporting period. This requires an in-depth understanding of our joint ventures,many of which are complex. It is necessary to understand the implications ofparticular transactions during the year on the calculations.
Foreign Currency Translation. The functional currency for entities operating orprojects in development outside the United States is the currency of the countryin which the entity or project is located. The financial statements of such enti-ties are translated from the functional currency into U.S. dollars for inclusion in our financial statements. In addition, our foreign investment and relatedadvances are denominated in the foreign entity’s functional currency andre-measured to our functional currency of the U.S. dollar. We expect to settlethese amounts in the foreseeable future through distributions from the foreignentity. Accordingly, gains or losses resulting from the re-measurement areincluded in the determination of net income.
Capitalization of Development and Leasing Costs. We capitalize the costs ofdevelopment and leasing activities of our properties. These costs are incurredboth at the property location and at the regional and corporate office level. Theamount of capitalization depends, in part, on the identification and justifiableallocation of certain activities to specific projects and leases. Differences inmethodologies of cost identification and documentation, as well as differingassumptions as to the time incurred on projects, can yield significant differ-ences in the amounts capitalized.
Capitalization of Interest. Interest is capitalized on real estate and develop-ment assets, including investments in joint ventures, in accordance with theprovisions of Statement of Financial Accounting Standards, or SFAS, No. 34,“Capitalization of Interest Cost,” and SFAS No. 58, “Capitalization of InterestCost in Financial Statements that include Investments Accounted for by the
Equity Method.” The capitalization period commences when developmentbegins and continues until the asset is ready for its intended use or is aban-doned. The calculation includes interest costs that theoretically could havebeen avoided, based first on project specific borrowings then on an assumedrepayment of our highest rate debt, had the underlying development and con-struction activities not been undertaken. Judgment is necessary to determinespecifically when to commence and to cease capitalization, particularly in situations involving our redevelopment projects.
QUANTITATIVE AND QUALITATIVE DISCLOSURES ABOUT MARKET RISKIn the normal course of business, we and our joint ventures are exposed to theeffect of interest rate changes. To limit this exposure, we follow established riskmanagement policies and procedures including the use of a variety of derivativefinancial instruments to manage, or hedge, interest rate risk. We do not usederivative instruments for speculative purposes. Derivative instruments used forhedging must be effective in reducing the interest rate risk exposure. Changesin the hedging instrument’s fair value related to the effective portion of the riskbeing hedged are included in accumulated other comprehensive income (loss).Hedge effectiveness criteria also require that it be probable that the underlyingtransaction occurs. Hedges that meet these criteria are formally designated ascash flow hedges at the inception of the derivative contract. When the terms ofan underlying transaction are modified, or when the underlying hedged itemceases to exist, the change in the fair value of the derivative instrument ismarked to market with the change included in net income in each period untilthe derivative instrument matures. Any derivative instrument used for risk man-agement that becomes ineffective is marked to market through earnings.
Depending on the underlying exposure, interest rate swaps, caps and floors,options, forwards or a combination thereof, may be used to manage interest raterisk. Interest rate swaps and collars are contractual agreements with third partiesto exchange fixed and floating interest payments periodically without theexchange of the underlying principal amounts (notional amounts). In the unlikelyevent that a counterparty fails to meet the terms of an interest rate swap contractor collar agreement, the exposure is limited to the interest rate differential on thenotional amount. We do not anticipate non-performance by any of our counter-parties. Net interest differentials to be paid or received under a swap contractand/or collar agreement are accrued as interest expense as incurred or earned.
Interest rate hedges, designated as cash flow hedges, hedge the future cashoutflows on debt. Interest rate swaps that convert variable payments to fixedpayments, interest rate caps, floors, collars and forwards are cash flow hedges.The unrealized gains or losses in the fair value of these hedges are reported onthe balance sheet and included in accounts payable and other liabilities or ininvestment in unconsolidated joint ventures with a corresponding adjustment toeither accumulated other comprehensive income or earnings depending on thehedging relationship. If the hedging transaction is a cash flow hedge, then theoffsetting gains/losses are reported in accumulated other comprehensiveincome to the extent of the effective portion of the risk being hedged. Somederivative instruments are associated with the hedge of an anticipated trans-action. Over time, the unrealized gains/losses held in accumulated othercomprehensive income (loss) will be reclassified to earnings consistent with
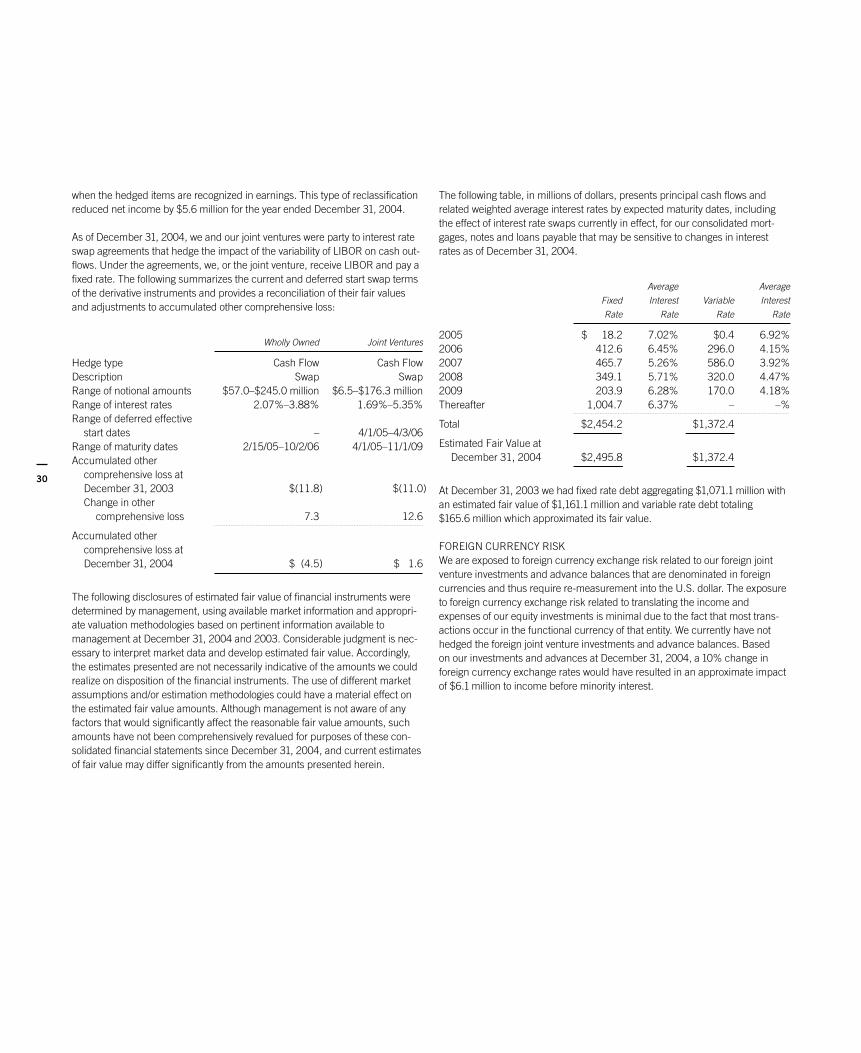
30
when the hedged items are recognized in earnings. This type of reclassificationreduced net income by $5.6 million for the year ended December 31, 2004.
As of December 31, 2004, we and our joint ventures were party to interest rateswap agreements that hedge the impact of the variability of LIBOR on cash out-flows. Under the agreements, we, or the joint venture, receive LIBOR and pay afixed rate. The following summarizes the current and deferred start swap termsof the derivative instruments and provides a reconciliation of their fair valuesand adjustments to accumulated other comprehensive loss:
Wholly Owned Joint Ventures
Hedge type Cash Flow Cash FlowDescription Swap SwapRange of notional amounts $57.0–$245.0 million $6.5–$176.3 millionRange of interest rates 2.07%–3.88% 1.69%–5.35%Range of deferred effective
start dates – 4/1/05–4/3/06Range of maturity dates 2/15/05–10/2/06 4/1/05–11/1/09Accumulated other
comprehensive loss at December 31, 2003 $(11.8) $(11.0)Change in other
comprehensive loss 7.3 12.6
Accumulated other comprehensive loss at December 31, 2004 $ (4.5) $ 1.6
The following disclosures of estimated fair value of financial instruments weredetermined by management, using available market information and appropri-ate valuation methodologies based on pertinent information available tomanagement at December 31, 2004 and 2003. Considerable judgment is nec-essary to interpret market data and develop estimated fair value. Accordingly,the estimates presented are not necessarily indicative of the amounts we couldrealize on disposition of the financial instruments. The use of different marketassumptions and/or estimation methodologies could have a material effect onthe estimated fair value amounts. Although management is not aware of anyfactors that would significantly affect the reasonable fair value amounts, suchamounts have not been comprehensively revalued for purposes of these con-solidated financial statements since December 31, 2004, and current estimatesof fair value may differ significantly from the amounts presented herein.
The following table, in millions of dollars, presents principal cash flows andrelated weighted average interest rates by expected maturity dates, includingthe effect of interest rate swaps currently in effect, for our consolidated mort-gages, notes and loans payable that may be sensitive to changes in interestrates as of December 31, 2004.
Average Average
Fixed Interest Variable Interest
Rate Rate Rate Rate
2005 $ 18.2 7.02% $0.4 6.92%2006 412.6 6.45% 296.0 4.15%2007 465.7 5.26% 586.0 3.92%2008 349.1 5.71% 320.0 4.47%2009 203.9 6.28% 170.0 4.18%Thereafter 1,004.7 6.37% – –%
Total $2,454.2 $1,372.4
Estimated Fair Value at December 31, 2004 $2,495.8 $1,372.4
At December 31, 2003 we had fixed rate debt aggregating $1,071.1 million withan estimated fair value of $1,161.1 million and variable rate debt totaling$165.6 million which approximated its fair value.
FOREIGN CURRENCY RISKWe are exposed to foreign currency exchange risk related to our foreign jointventure investments and advance balances that are denominated in foreigncurrencies and thus require re-measurement into the U.S. dollar. The exposureto foreign currency exchange risk related to translating the income andexpenses of our equity investments is minimal due to the fact that most trans-actions occur in the functional currency of that entity. We currently have nothedged the foreign joint venture investments and advance balances. Based on our investments and advances at December 31, 2004, a 10% change in foreign currency exchange rates would have resulted in an approximate impactof $6.1 million to income before minority interest.

THE M
ILLS CO
RP
OR
ATION
Annual R
eport 2004
31
MANAGEMENT’S REPORT
Management’s Annual Report on Internal Control over Financial Reporting.Management of TMC is responsible for establishing and maintaining adequateinternal control over financial reporting as defined in Rule 13a 15(f) under theExchange Act. TMC’s internal control system is designed to provide reasonableassurance to TMC’s management and Board of Directors regarding the prepa-ration and fair presentation of published financial statements.
Management has assessed the effectiveness of TMC’s internal control overfinancial reporting as of December 31, 2004. In making its assessment of inter-nal control over financial reporting, management used the criteria set forth bythe Committee of Sponsoring Organizations (“COSO”) of the TreadwayCommission in Internal Control – Integrated Framework.
In performing this assessment, management reviewed TMC’s selection, appli-cation and monitoring of accounting policies and as a result of this review,management concluded that TMC’s controls over the selection, application andmonitoring of accounting policies were insufficient. On February 15, 2005,TMC, determined to restate certain of its previously issued financial statementsto reflect the correction of errors arising from its historical use of certainaccounting policies, including calculation of equity in earnings, capitalization of interest and other costs, sales of joint venture interests, promotion funds, and the income statement presentation of fees and associated costs. Details of the restatements are included in Note 17 of the Notes to ConsolidatedFinancial Statements.
Management evaluated the impact on TMC’s assessment of its system of inter-nal control and has concluded that the control deficiency that resulted in theinappropriate selection, application and monitoring of accounting policies rep-resented a material weakness. As a result of this material weakness in TMC’sinternal control over financial reporting, management has concluded that, as of December 31, 2004, TMC’s internal control over financial reporting was noteffective based on the criteria set forth by the COSO of the Treadway Commissionin Internal Control – Integrated Framework. A material weakness in internalcontrol over financial reporting is a control deficiency (within the meaning ofPCAOB Auditing Standard No. 2), or combination of control deficiencies, thatresults in there being more than a remote likelihood that a material misstate-ment of the annual or interim financial statements will not be prevented ordetected. PCAOB Auditing Standard No. 2 identifies a number of circumstances
(including the restatement of previously issued financial statements to reflectthe correction of a misstatement) that, because of their likely significant nega-tive effect on internal control over financial reporting, are to be regarded asstrong indicators that a material weakness exists.
TMC’s independent registered public accounting firm, Ernst & Young LLP, hasissued an attestation report on management’s assessment of TMC’s internalcontrol over financial reporting. This report appears below.
Remediation Steps to Address Material Weakness. To remediate the materialweakness in TMC’s internal control over financial reporting, TMC has implementedadditional review procedures over the selection, application and monitoring of appropriate accounting policies. We have hired additional accounting staffincluding an experienced Chief Accounting Officer. We have also identifiedexpert accounting consultants for input on financial reporting matters.
Change in Internal Control Over Financial Reporting. As previously reported,we implemented a new general ledger system on July 1, 2004. During theremainder of the year we continued to improve and change processes sur-rounding that implementation. Also, as part of an ongoing focus on accountingpolicies used by TMC, we conducted a review of the selection, application andmonitoring of our historical accounting policies, as described above. Other thanthese items, there were no changes in TMC’s internal control over financialreporting that occurred during TMC’s fiscal quarter ending December 31, 2004that have materially affected, or are reasonably likely to materially affect, TMC’sinternal control over financial reporting.
NEW YORK STOCK EXCHANGE REQUIRED DISCLOSURESOn July 7, 2004, our Chief Executive Officer certified that he was not aware ofany violation by the Company of the New York Stock Exchanges CorporateGovernance listing standards, other than has been notified to the Exchangepursuant to section 303A.12(b), of which there was none.
We have filed with the Securities and Exchange Commission, as exhibits to ourAnnual Report on Form 10-K for the year ended December 31, 2004, our ChiefExecutive Officer’s and Chief Financial Officer’s certifications required bySection 302 of the Sarbanes Oxley Act of 2002.

32
REPORT OF INDEPENDENT REGISTERED PUBLIC ACCOUNTING FIRM ON INTERNAL CONTROL OVER FINANCIAL REPORTING
The Board of Directors and Shareholders of The Mills Corporation
We have audited management’s assessment, included in the accompanyingManagement’s Annual Report on Internal Control over Financial Reporting, thatThe Mills Corporation did not maintain effective internal control over financialreporting as of December 31, 2004, because of the effect of the Company’sinsufficient controls over the appropriate selection, application and monitoringof accounting policies, based on criteria established in Internal Control –Integrated Framework issued by the Committee of Sponsoring Organizations of the Treadway Commission (the COSO criteria). The Mills Corporation’s man-agement is responsible for maintaining effective internal control over financialreporting and for its assessment of the effectiveness of internal control overfinancial reporting. Our responsibility is to express an opinion on management’sassessment and an opinion on the effectiveness of the Company’s internal con-trol over financial reporting based on our audit.
We conducted our audit in accordance with the standards of the PublicCompany Accounting Oversight Board (United States). Those standards requirethat we plan and perform the audit to obtain reasonable assurance aboutwhether effective internal control over financial reporting was maintained in allmaterial respects. Our audit included obtaining an understanding of internalcontrol over financial reporting, evaluating management’s assessment, testingand evaluating the design and operating effectiveness of internal control, andperforming such other procedures as we considered necessary in the circum-stances. We believe that our audit provides a reasonable basis for our opinion.
A company’s internal control over financial reporting is a process designed toprovide reasonable assurance regarding the reliability of financial reporting and the preparation of financial statements for external purposes in accordancewith generally accepted accounting principles. A company’s internal controlover financial reporting includes those policies and procedures that (1) pertainto the maintenance of records that, in reasonable detail, accurately and fairlyreflect the transactions and dispositions of the assets of the company; (2) pro-vide reasonable assurance that transactions are recorded as necessary topermit preparation of financial statements in accordance with generally acceptedaccounting principles, and that receipts and expenditures of the company arebeing made only in accordance with authorizations of management and directorsof the company; and (3) provide reasonable assurance regarding prevention ortimely detection of unauthorized acquisition, use, or disposition of the com-pany’s assets that could have a material effect on the financial statements.
Because of its inherent limitations, internal control over financial reporting maynot prevent or detect misstatements. Also, projections of any evaluation ofeffectiveness to future periods are subject to the risk that controls may becomeinadequate because of changes in conditions, or that the degree of compliancewith the policies or procedures may deteriorate.
A material weakness is a control deficiency, or combination of control deficien-cies, that results in more than a remote likelihood that a material misstatementof the annual or interim financial statements will not be prevented or detected.The following material weakness has been identified and included in manage-ment’s assessment: In its assessment as of December 31, 2004, managementidentified as a material weakness the Company’s insufficient controls over theselection, application and monitoring of accounting policies, including calcu-lation of equity in earnings, capitalization of interest and other costs, sales ofjoint venture interests, acquisition purchase price accounting, promotion funds,straight-line rent, lease inducements, tenant allowances and the income state-ment presentation of fees and associated costs. As a result of this materialweakness in internal control, The Mills Corporation concluded the Company’spreviously issued financial statements should be restated. The restatement is discussed in detail in Note 17 of the Notes to the Consolidated FinancialStatements. This material weakness was considered in determining the nature,timing, and extent of audit tests applied in our audit of the 2004 financial state-ments, and this report does not affect our report dated March 31, 2005 onthose financial statements.
In our opinion, management’s assessment that The Mills Corporation did notmaintain effective internal control over financial reporting as of December 31,2004, is fairly stated, in all material respects, based on the COSO control criteria.Also, in our opinion, because of the effect of the material weakness describedabove on the achievement of the objectives of the control criteria, The MillsCorporation has not maintained effective internal control over financial reportingas of December 31, 2004, based on the COSO control criteria.
We also have audited, in accordance with the standards of the Public CompanyAccounting Oversight Board (United States), the 2004 consolidated financialstatements of The Mills Corporation and our report dated March 31, 2005,expressed an unqualified opinion thereon.
McLean, VirginiaMarch 31, 2005

THE M
ILLS CO
RP
OR
ATION
Annual R
eport 2004
33
REPORT OF INDEPENDENT REGISTERED PUBLIC ACCOUNTING FIRM
The Board of Directors and Shareholders of The Mills Corporation
We have audited the accompanying consolidated balance sheets of The MillsCorporation as of December 31, 2004 and 2003, and the related consolidatedstatements of income, total comprehensive income, stockholders’ equity andcash flows for each of the three years in the period ended December 31, 2004.These consolidated financial statements are the responsibility of the manage-ment of The Mills Corporation. Our responsibility is to express an opinion onthese consolidated financial statements based on our audits.
We conducted our audits in accordance with the standards of the PublicCompany Accounting Oversight Board (United States). Those standards requirethat we plan and perform the audit to obtain reasonable assurance aboutwhether the financial statements are free of material misstatement. An auditincludes examining, on a test basis, evidence supporting the amounts and disclosures in the financial statements. An audit also includes assessing theaccounting principles used and significant estimates made by management, as well as evaluating the overall financial statement presentation. We believethat our audits provide a reasonable basis for our opinion.
In our opinion, the consolidated financial statements referred to above presentfairly, in all material respects, the consolidated financial position of The MillsCorporation as of December 31, 2004 and 2003, and the consolidated resultsof its operations and its cash flows for each of the three years in the periodended December 31, 2004, in conformity with U.S. generally acceptedaccounting principles.
As discussed in Note 17 of the Notes to the Consolidated Financial Statements,the accompanying consolidated balance sheet as of December 31, 2003 andthe related consolidated statements of income, total comprehensive income,stockholders’ equity, and cash flows for the years ended December 31, 2003and 2002 have been restated.
In 2004, as discussed in Note 3 of the Notes to the Consolidated FinancialStatements, The Mills Corporation adopted the provisions of FIN No. 46(R),“Consolidation of Variable Interest Entities.” In 2002, as discussed in Note 3 of the Notes to the Consolidated Financial Statements, The Mills Corporationchanged its method of accounting for stock-based compensation plans.
We also have audited, in accordance with the standards of the Public CompanyAccounting Oversight Board (United States), the effectiveness of The MillsCorporation’s internal control over financial reporting as of December 31, 2004,based on criteria established in Internal Control—Integrated Framework issuedby the Committee of Sponsoring Organizations of the Treadway Commissionand our report dated March 31, 2005 expressed an unqualified opinion onmanagement’s assessment and an adverse opinion on the effectiveness ofinternal control over financial reporting.
McLean, VirginiaMarch 31, 2005

34
CONSOLIDATED BALANCE SHEETS
December 31, 2004 2003
(Dollars in millions, except per share data) (Restated)
ASSETS
Income producing property:Land and land improvements $ 819.3 $ 420.2Building and improvements 3,780.2 1,857.0Furniture, fixtures and equipment 131.1 60.7Less accumulated depreciation and amortization (811.8) (400.7)
Net income producing property 3,918.8 1,937.2Construction in progress 732.9 298.4Investment in unconsolidated joint ventures 728.5 805.9
Net real estate and development assets 5,380.2 3,041.5Cash and cash equivalents 152.9 15.8Restricted cash 77.0 37.5Accounts receivable, net 246.5 81.4Notes receivable, net 62.1 25.7Deferred costs and other intangibles, net 157.1 63.5Other assets 27.4 11.0
Total Assets $6,103.2 $3,276.4
LIABILITIES AND STOCKHOLDERS’ EQUITY
Mortgages, notes, and loans payable $3,826.6 $2,119.3Accounts payable and other liabilities 338.5 226.8
4,165.1 2,346.1Minority interests:
Mills LP 95.7 118.2Consolidated joint ventures 587.9 –
Series B Cumulative Redeemable Preferred Stock, par value $0.01, 4,300,000 shares authorized, issued and outstanding 107.5 107.5
Series C Cumulative Redeemable Preferred Stock, par value $0.01, 3,500,000 shares authorized, issued and outstanding 87.5 87.5
Series E Cumulative Redeemable Preferred Stock, par value $0.01, 8,545,000 shares authorized, issued and outstanding 213.6 213.6
Series F Convertible Cumulative Redeemable Preferred Stock, par value $0.01, 316,250 shares authorized, issued and outstanding 316.3 –
Common stock, par value $0.01,100,000,000 shares authorized, 55,654,194 and 50,297,623 shares issued and outstanding in 2004 and 2003, respectively 0.6 0.5
Additional paid in capital 970.5 915.5Accumulated deficit (439.1) (497.7)Accumulated other comprehensive loss (2.4) (14.8)
Total stockholders’ equity 1,254.5 812.1
Total Liabilities and Stockholders’ Equity $6,103.2 $3,276.4
See Accompanying Notes to Consolidated Financial Statements.

THE M
ILLS CO
RP
OR
ATION
Annual R
eport 2004
35
CONSOLIDATED STATEMENTS OF INCOME
Years Ended December 31, 2004 2003 2002
(Dollars in millions, except per share data) (Restated) (Restated)Revenues:
Minimum rent $ 411.2 $213.3 $119.0Percentage rent 9.3 5.6 2.3Recoveries from tenants 202.3 119.3 66.0Other property revenue 46.5 27.8 15.7Management fee income 11.6 15.7 14.7Other fee income 3.9 19.1 21.6
Total operating revenues 684.8 400.8 239.3
Expenses:Recoverable from tenants 193.5 112.4 64.2Other operating expenses 30.0 12.2 6.3General and administrative 46.5 26.1 17.4Cost of fee income 29.9 16.9 15.3Depreciation and amortization 199.5 88.7 47.9
Total operating expenses 499.4 256.3 151.1
Operating income 185.4 144.5 88.2Other income (expense):
Interest expense, net (148.5) (80.6) (55.7)Equity in earnings of unconsolidated joint ventures 15.3 34.6 24.0Minority interest in consolidated joint ventures
Minority interest in earnings (12.4) – –Attribution to Mills of the elimination of interest and fees 47.9 – –
Foreign currency exchange gains, net 15.2 38.6 11.6Interest income 9.0 11.5 7.4Other income (expense), net 9.2 (3.2) (2.7)
Income before gain on sales of joint venture interests and minority interest in Mills LP 121.1 145.4 72.8Gain on sales of joint venture interests 99.3 0.7 –
Income before minority interest in Mills LP 220.4 146.1 72.8Minority interest in Mills LP income, including Series D preferred unit distributions (30.5) (31.1) (22.3)
Income from continuing operations 189.9 115.0 50.5Discontinued operations, net of minority interest in Mills LP – 0.1 0.3Cumulative effect of FIN 46 adoption, net of minority interest in Mills LP 42.1 – –
Net income 232.0 115.1 50.8Preferred stock dividends (43.9) (27.8) (2.6)
Income available to common stockholders $ 188.1 $ 87.3 $ 48.2
Earnings per common share – basic:Continuing operations $ 2.75 $ 1.94 $ 1.35Discontinued operations – – 0.01Cumulative effect of FIN 46 adoption 0.80 – –
Earning per common share – basic $ 3.55 $ 1.94 $ 1.36
Earnings per common share–diluted:Continuing operations $ 2.71 $ 1.91 $ 1.33Discontinued operations – – 0.01Cumulative effect of FIN 46 adoption 0.79 – –
Earning per common share – diluted $ 3.50 $ 1.91 $ 1.34
Weighted average shares outstanding (in thousands):Basic 53,055 44,864 35,491
Diluted 54,079 45,785 36,355
Dividends paid per common share $ 2.35 $ 2.24 $ 2.18
See Accompanying Notes to Consolidated Financial Statements.
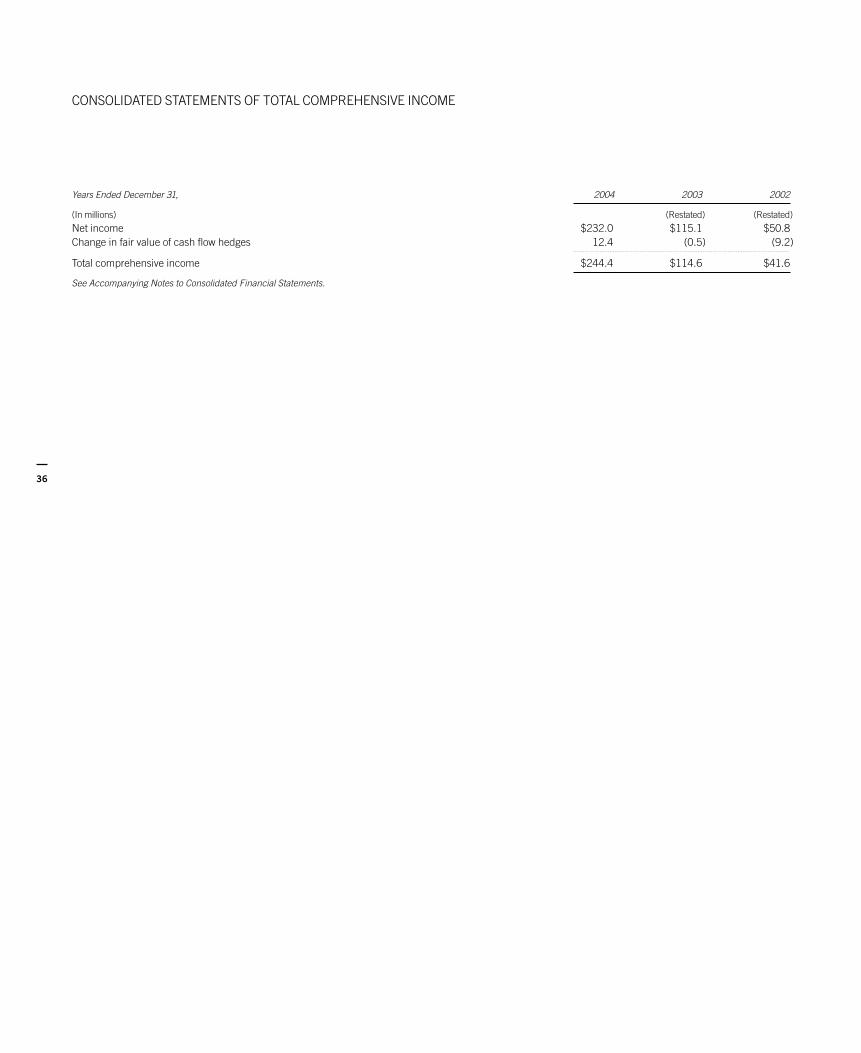
36
CONSOLIDATED STATEMENTS OF TOTAL COMPREHENSIVE INCOME
Years Ended December 31, 2004 2003 2002
(In millions) (Restated) (Restated)
Net income $232.0 $115.1 $50.8Change in fair value of cash flow hedges 12.4 (0.5) (9.2)
Total comprehensive income $244.4 $114.6 $41.6
See Accompanying Notes to Consolidated Financial Statements.

THE M
ILLS CO
RP
OR
ATION
Annual R
eport 2004
37
CONSOLIDATED STATEMENTS OF STOCKHOLDERS’ EQUITY
Accumulated
Additional Other
Preferred Common Stock Paid-In Accumulated Comprehensive
(In millions) Stock Shares Amount Capital Deficit Loss Total
Balances, December 31, 2001As previously reported $ – 28.5 $0.3 $ 526.2 $(424.6) $ (5.1) $ 96.8Cumulative effect of restatement – – – – (17.1) – (17.1)
As restated – 28.5 0.3 526.2 (441.7) (5.1) 79.7Sale of capital stock 192.5 13.3 0.1 357.4 – – 550.0Employee benefit plans – 0.8 – 19.8 – – 19.8Mills LP units exchanged – 0.6 – 16.3 – – 16.3Change in fair value of
cash flow hedges – – – – – (9.2) (9.2)Dividends declared:
Common stock – – – – (86.1) – (86.1)Preferred stock – – – – (2.6) – (2.6)
Adjustment to minority interest from increased ownership in Mills LP – – – (106.5) – – (106.5)
Net income – – – – 50.8 – 50.8
Balances, December 31, 2002 192.5 43.2 0.4 813.2 (479.6) (14.3) 512.2Sale of capital stock 216.1 – – (3.4) – – 212.7Employee benefit plans – 1.2 – 23.3 – – 23.3Series A preferred stock conversion – 3.1 0.1 74.9 – – 75.0Mills LP units exchanged – 2.8 – 22.6 – – 22.6Change in fair value of
cash flow hedges – – – – – (0.5) (0.5)Dividends declared:
Common stock – – – – (105.4) – (105.4)Preferred stock – – – – (27.8) – (27.8)
Adjustment to minority interest from increased ownership in Mills LP – – – (15.1) – – (15.1)
Net income – – – – 115.1 – 115.1
Balances, December 31, 2003 408.6 50.3 0.5 915.5 (497.7) (14.8) 812.1Sale of capital stock 316.3 – – (10.1) – – 306.2Employee benefit plans – 0.7 0.1 19.7 – – 19.8Mills LP units exchanged – 4.7 – 38.0 – – 38.0Change in fair value of
cash flow hedges – – – – – 12.4 12.4Dividends declared:
Common stock – – – – (129.5) – (129.5)Preferred stock – – – – (43.9) – (43.9)
Adjustment to minority interest from increased ownership in Mills LP – – – 7.4 – – 7.4
Net income – – – – 232.0 – 232.0
Balances, December 31, 2004 $724.9 55.7 $0.6 $ 970.5 $(439.1) $ (2.4) $1,254.5
See Accompanying Notes to Consolidated Financial Statements.
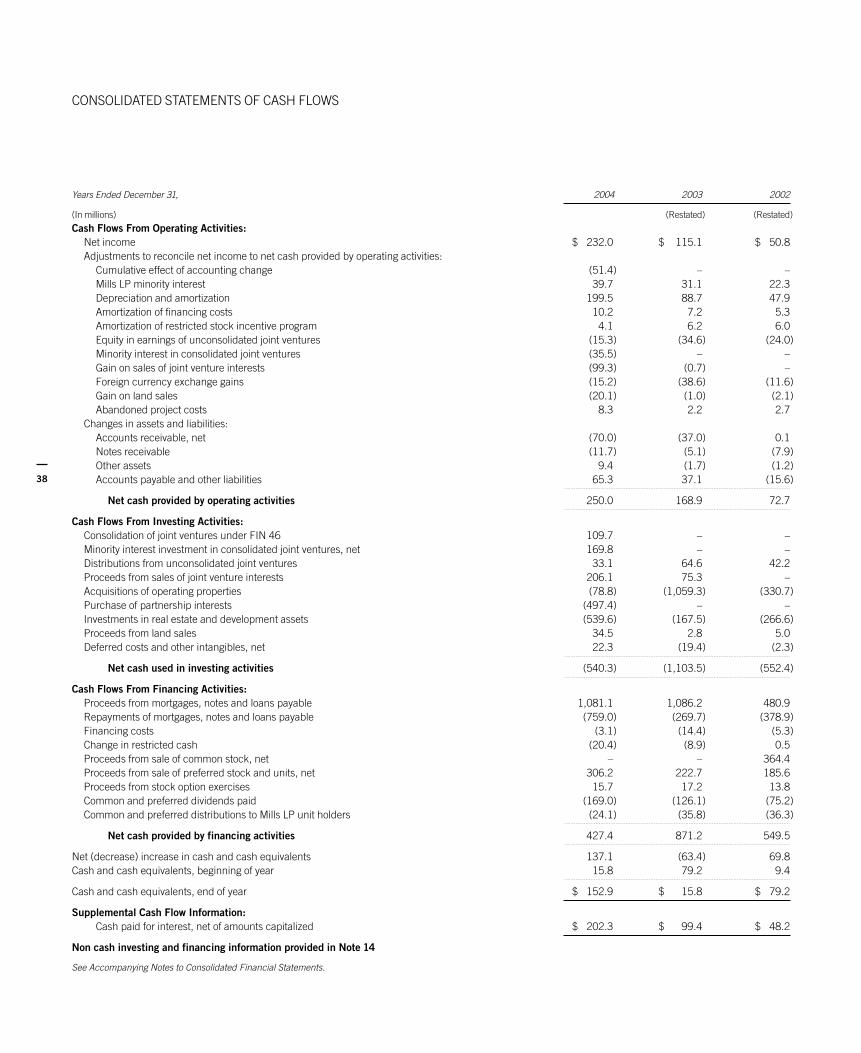
38
CONSOLIDATED STATEMENTS OF CASH FLOWS
Years Ended December 31, 2004 2003 2002
(In millions) (Restated) (Restated)
Cash Flows From Operating Activities:Net income $ 232.0 $ 115.1 $ 50.8Adjustments to reconcile net income to net cash provided by operating activities:
Cumulative effect of accounting change (51.4) – –Mills LP minority interest 39.7 31.1 22.3Depreciation and amortization 199.5 88.7 47.9Amortization of financing costs 10.2 7.2 5.3Amortization of restricted stock incentive program 4.1 6.2 6.0Equity in earnings of unconsolidated joint ventures (15.3) (34.6) (24.0)Minority interest in consolidated joint ventures (35.5) – –Gain on sales of joint venture interests (99.3) (0.7) –Foreign currency exchange gains (15.2) (38.6) (11.6)Gain on land sales (20.1) (1.0) (2.1)Abandoned project costs 8.3 2.2 2.7
Changes in assets and liabilities:Accounts receivable, net (70.0) (37.0) 0.1Notes receivable (11.7) (5.1) (7.9)Other assets 9.4 (1.7) (1.2)Accounts payable and other liabilities 65.3 37.1 (15.6)
Net cash provided by operating activities 250.0 168.9 72.7
Cash Flows From Investing Activities:Consolidation of joint ventures under FIN 46 109.7 – –Minority interest investment in consolidated joint ventures, net 169.8 – –Distributions from unconsolidated joint ventures 33.1 64.6 42.2Proceeds from sales of joint venture interests 206.1 75.3 –Acquisitions of operating properties (78.8) (1,059.3) (330.7)Purchase of partnership interests (497.4) – –Investments in real estate and development assets (539.6) (167.5) (266.6)Proceeds from land sales 34.5 2.8 5.0Deferred costs and other intangibles, net 22.3 (19.4) (2.3)
Net cash used in investing activities (540.3) (1,103.5) (552.4)
Cash Flows From Financing Activities:Proceeds from mortgages, notes and loans payable 1,081.1 1,086.2 480.9Repayments of mortgages, notes and loans payable (759.0) (269.7) (378.9)Financing costs (3.1) (14.4) (5.3)Change in restricted cash (20.4) (8.9) 0.5Proceeds from sale of common stock, net – – 364.4Proceeds from sale of preferred stock and units, net 306.2 222.7 185.6Proceeds from stock option exercises 15.7 17.2 13.8Common and preferred dividends paid (169.0) (126.1) (75.2)Common and preferred distributions to Mills LP unit holders (24.1) (35.8) (36.3)
Net cash provided by financing activities 427.4 871.2 549.5
Net (decrease) increase in cash and cash equivalents 137.1 (63.4) 69.8Cash and cash equivalents, beginning of year 15.8 79.2 9.4
Cash and cash equivalents, end of year $ 152.9 $ 15.8 $ 79.2
Supplemental Cash Flow Information:Cash paid for interest, net of amounts capitalized $ 202.3 $ 99.4 $ 48.2
Non cash investing and financing information provided in Note 14
See Accompanying Notes to Consolidated Financial Statements.

THE M
ILLS CO
RP
OR
ATION
Annual R
eport 2004
39
NOTES TO CONSOLIDATED FINANCIAL STATEMENTS(Dollars in millions except per share data)
1. ORGANIZATIONThe Mills Corporation, or TMC, is a fully integrated, self-managed real estateinvestment trust (“REIT”) that provides development, redevelopment, leasing,financing, management and marketing services to its properties. TMC con-ducts all of its business and owns all of its properties through The Mills LimitedPartnership, or Mills LP, and its various subsidiaries. TMC is the sole generalpartner of Mills LP and owned a 1.00% general partner interest and an 85.12%limited partner interest as of December 31, 2004.
As of December 31, 2004, we owned or had an interest in 38 retail and enter-tainment oriented centers comprised of 17 Mills Landmark Centers, 20 regional21st Century Retail and Entertainment Centers and one International Retail and Entertainment Center. Of these, five Mills Landmark Centers, seven21st Century Retail and Entertainment Centers and the International Retail andEntertainment Center were wholly owned by us. We also owned three commu-nity shopping centers, a portfolio of 19 single tenant properties and other relatedcommercial development.
2. SUMMARY OF SIGNIFICANT ACCOUNTING POLICIESBASIS OF PRESENTATIONWe consolidate the accounts of TMC, Mills LP and all subsidiaries that we control. We do not consider ourselves to be in control of an entity when majorbusiness decisions require the approval of at least one other partner. All sig-nificant intercompany transactions and balances have been eliminated inconsolidation.
We also consolidate entities that are considered to be variable interest entities(VIE’s) and for which we have been determined to be the primary beneficiary.The determination of whether an entity is a VIE requires knowledge of the structure of the economics and the governance of the entity, and judgment isnecessary in how this knowledge is applied to the underlying rules. The effectsof the elimination of interest and fee revenue and expense due to intercompanytransactions between entities that are less than 100% owned are attributable tous as primary beneficiary.
Equity in the income or loss of joint ventures is recorded on the equity methodof accounting. We allocate income to equity participants based on the terms of the respective partnership agreements upon an assumed liquidation of thejoint venture at its depreciated book value as of the end of the reporting period.Partner distributions are defined by the individual joint venture agreements.Generally, net ordinary cash flow is distributed to each partner first to pay pref-erences on unreturned capital balances, including cumulative unpaidpreferences, and thereafter in accordance with specified residual sharing per-centages. Cash flow from capital events, including refinancing and asset sales,is generally allotted first to partners in an amount equal to their unreturned cap-ital account and thereafter in accordance with residual sharing percentages.
Basis differences in our investments in joint ventures primarily result from theacquisition of partnership interests which are not reflected at the joint venturelevel; capitalized interest on the investment balance; and capitalized develop-ment and leasing costs recovered by us through fees earned during projectdevelopment and construction. Basis differences in unconsolidated joint ventures were $678.8 million at December 31, 2004 and are amortized over25 years.
REAL ESTATE AND DEVELOPMENT ASSETSIncome producing property is stated at cost and includes all costs related toacquisition, development, leasing and construction, including tenant improve-ments, interest incurred during construction, costs of predevelopment andcertain direct and indirect costs of development. Cost incurred during the pre-development stage are capitalized once management has determined that theproject and the acquisition of a site is feasible and it is probable that manage-ment will be able to proceed. Land held for sale is carried at the lower of cost orfair value less costs to sell. Expenditures for ordinary maintenance and repairsare expensed to operations as they are incurred. Significant renovations andimprovements which improve or extend the useful life of the asset are capitalized.
Operating properties are evaluated on an individual basis for impairment whenconditions exist that may indicate that it is probable that the sum of expectedundiscounted future cash flows from a property is less than the historical netcost basis. Upon determination that a permanent impairment has occurred, an impairment charge equal to the excess of historical cost basis over fair valueis recorded. Costs related to predevelopment projects are expensed when it isdetermined that it is no longer probable we will develop the project and couldbe material.
The cost of acquired operating properties represents the allocation of purchaseprice to the underlying assets and liabilities, including identifiable intangibleassets such as above/below market leases and at market leases, based onappraisals and other valuation methods. Amortization expense related to suchintangibles for the years ended December 31, 2004 and 2003 was $8.6 millionand $4.7 million, respectively. The estimated aggregate amortization expensefor 2005, 2006, 2007, 2008 and 2009 is $4.7 million, $3.6 million, $2.8 million,$2.2 million and $1.7 million, respectively. External costs directly related toacquisition opportunities being actively pursued by us are capitalized. If we aresuccessful in completing the acquisition, such costs are allocated to the acquiredproperty as part of the purchase price. If not, such costs are expensed in theperiod it becomes likely the acquisition will not be completed.
Interest is capitalized on real estate and development assets, including invest-ments in joint ventures, in accordance with the provisions of Statement ofFinancial Accounting Standards (“SFAS”) No. 34, “Capitalization of Interest Cost,”and SFAS No. 58, “Capitalization of Interest Cost in Financial Statements thatinclude Investments Accounted for by the Equity Method.” The capitalizationperiod commences when development begins and continues until the asset isready for its intended use or is abandoned. The amount capitalized is based onthe stated interest rates, including amortization of deferred financing costs. Thecalculation includes interest costs that theoretically could have been avoided,based first on project-specific borrowings, then on an assumed repayment of ourhighest rate debt, had the underlying development and construction activities notbeen undertaken. For the years ended December 31, 2004, 2003 and 2002,interest was capitalized at an average rate of 7.8%, 8.6% and 9.4%, respectively,and amounted to $56.8 million, $48.0 million and $34.3 million, respectively.
Depreciation expense amounting to $158.4 million, $70.0 million and$38.8 million for the years ended December 31, 2004, 2003 and 2002,
40
respectively, was computed using the straight-line method over the estimateduseful lives of the assets, as follows:
Building and improvements 10–40 yearsLand improvements 20 yearsFurniture, fixtures and equipment 5–10 yearsTenant improvements Lesser of life of asset or term of lease
CASH AND CASH EQUIVALENTSHighly liquid investments with an original maturity of three months or less areconsidered to be cash equivalents.
RESTRICTED CASHRestricted cash is comprised primarily of funds on deposit in cash collateralaccounts controlled by the lenders. Proceeds from certain transactions are heldin such accounts to fund maintenance reserves, interest, taxes and debt pay-ments for the property associated with the loan.
ACCOUNTS RECEIVABLE, NETAccounts receivable include amounts billed to tenants, deferred rent result-ing from the straight-line recognition of rental income and accrued recoveries.Collectibility of these receivables is evaluated on a regular basis and theallowance for doubtful accounts is adjusted accordingly. At December 31, 2004and 2003 the allowance for doubtful accounts was $15.2 million and $4.3 mil-lion, respectively.
DEFERRED COSTS AND OTHER INTANGIBLES, NETDeferred costs and other intangibles include loan fees, leasing costs and thevalue of in-place leases related to operating property acquisitions. Loan fees,including related expenses, are amortized on a straight-line basis which approx-imates the interest method over the terms of the related notes. Leasing costsare amortized on a straight-line basis over the term of the related leases. Thevalues of leases in-place at the date an operating property was acquired areamortized on a straight-line basis over the terms of the underlying leases. Forthe years ended December 31, 2004, 2003 and 2002, amortization expensewas $54.5 million, $25.8 million and $14.4 million, respectively. Accumulatedamortization was $115.8 million and $61.3 million, at December 31, 2004 and2003, respectively.
REVENUE RECOGNITIONAs lessor, we retain substantially all the risks and benefits of property ownershipand accounts for our leases as operating leases. Minimum rent from incomeproducing properties is recognized on a straight-line basis over the terms of therespective leases and includes amortization of deferred revenue resulting fromacquired leases and the amortization of lease inducements. The term of eachlease is based on the period during which a tenant has control of the space. Judg-ment is required to determine when a tenant takes control of the space, and
accordingly when to commence the recognition of rent. As a part of the restate-ment of our financial statements we revised our previous practice of recognizingrent beginning with the lease commencement date to recognizing income fromthe date the tenant has control of the space. The cumulative impact of this wasan adjustment to retained earnings of $6.4 million and an immaterial impact onnet income for the periods presented. Percentage rent is recognized when ten-ants’ sales have reached certain sales levels as specified in the underlyinglease. Recoveries from tenants for real estate taxes and other operating expensesare recognized as revenue in the period the applicable costs are incurred.
We provide management, leasing, development and financing services to mostof our joint venture properties, for which we earn various fees. Managementfees are a percentage of the monthly rental revenue received by the joint ven-ture and recognized when such revenue is received by the property. Leasingfees are recognized upon execution of the lease and represent an agreed-uponrate per square foot of space leased. Development fees are recognized on thepercentage completion method based on the proportion of our costs incurred to our expected total costs to be incurred. Financial service fees are a statedpercentage of the loan commitment obtained and recognized when the loanagreement is executed by the lender. We expense leasing and financing over-head costs to the extent of our partners’ interests in the underlying entities.Other fee income reflects leasing, development and financing fees from uncon-solidated joint ventures after the elimination of intercompany profit.
OTHER PROPERTY REVENUEOther property revenue includes rent from tenants with original leases of oneyear or less, temporary in-line space, kiosks and ATM space. It also includes leasetermination fees and recoveries of previously deemed uncollectible receivables.
DERIVATIVES AND HEDGINGA variety of derivative financial instruments are used to manage, or hedge, ourexposure to the impact of changing interest rates. Derivative contracts are des-ignated and qualify as cash flow hedges because, at inception, it is expectedthat the instrument will be effective in reducing interest rate exposure and thatthe underlying transaction will occur. Derivative instruments are not used forspeculative purposes.
Derivative instruments are stated at fair value. Fair value is determined usingvarious methods and assumptions based on market conditions and risks exist-ing at each balance sheet date. In most cases, standard market conventionsand techniques, such as discounted cash flow analysis, option pricing models,replacement cost and termination cost, are used to determine fair value. Allmethods of assessing fair value result in a value which may never be realized.
The fair value of derivative instruments are included in accounts payable andother liabilities and changes are charged to accumulated other comprehensiveloss. In the event the instrument is determined to be no longer effective, theitem being hedged no longer exists or the terms of the underlying transactionare modified, the fair value adjustment is charged to earnings as interestexpense. Unrealized gains or losses charged to accumulated other compre-hensive income are eventually recognized in earnings as the underlying hedgeditem is recognized.

THE M
ILLS CO
RP
OR
ATION
Annual R
eport 2004
41
INCOME TAXESWe have elected for TMC to be taxed as a REIT under Sections 856-860 of theInternal Revenue Code (the “Code”). As a REIT, we will generally not be subjectto federal and state income taxes on our net taxable income that we currentlydistribute to stockholders. In order to maintain REIT status, we are required todistribute at least 90% of our taxable income to our stockholders and are subjectto various other requirements including meeting certain asset and income tests.Because we believe we will maintain our REIT status and distribute in excess ofour taxable income, U.S. federal income taxes may not apply. Differencesbetween net income available to common stockholders for financial reportingpurposes and taxable income before dividend deductions relate primarily to realestate depreciation, recognition of gains and losses from asset transactions andforeign currency exchange gains and losses. The tax treatment of dividendspaid per common share was as follows:
Years Ended December 31, 2004 2003 2002
(unaudited)
Ordinary income per common share $1.19 $1.08 $ .75Capital gain per common share 0.60 .15 .12Unrecaptured Section 1250 gains 0.02 – –Return of capital per common share 0.54 1.01 1.31
Dividends paid per common share $2.35 $2.24 $2.18
The Code provides that a REIT may own stock in subsidiaries engaged in busi-nesses which generate nonqualifying income, which are referred to herein astaxable REIT subsidiaries. The stock value of these businesses are subject tocertain limitations and both the REIT and the taxable REIT subsidiaries are sub-ject to strict rules governing ownership, operation and taxation. MillsServicesCorp., or MSC, and its subsidiaries have made elections to be treated as taxableREIT subsidiaries.
MSC, a subchapter C corporation, is subject to federal and state income taxesat the prevailing tax rates. As of December 31, 2004, MSC had an estimatedfederal net operating loss carry forward of $42.5 million. Deferred tax assetsrelating primarily to the loss carry forward have been offset in their entirety by a valuation allowance since there is no assurance MSC will generate taxableincome in the future.
FOREIGN OPERATIONSThe functional currency for entities operating or projects in development out-side the United States is the currency of the country in which the entity orproject is located. The financial statements of such entities are translated fromthe functional currency into U.S. dollars for inclusion in our financial statements.Gains or losses resulting from translation are accounted for as a component of other comprehensive income or loss.
Our non-U.S. investment and related advances are denominated in the non-U.S. entity’s functional currency and re-measured to our functional currency of the U.S. dollar. We expect to settle these amounts in the foreseeable futurethrough distributions from the entities. Accordingly, gains or losses resultingfrom the re-measurement are included in the determination of net income.Foreign currency exchange losses and gains for the periods presented aroseprimarily as a result of this re-measurement.
As of December 31, 2004 and 2003, our overall investment in non-U.S. opera-tions approximated $270.0 million and $210.9 million, respectively. Each of ournon-U.S. operations is subject to certain foreign corporate-level income taxes.
SEGMENT REPORTINGWe consider each of our properties a separate operating segment that areaggregated and reported as a single segment. Discrete financial information is available and each property’s operating results are reviewed by the chiefoperating decision maker in the determination of resource allocation and per-formance. This single reportable segment represents over 90% of our assets,revenues and income for each of the years presented. Future prospects for eachproperty are similar and all have essentially the same economic characteristicswith similar returns, occupancy and tenants and are sited near a metropolitanarea with similar demographics and site characteristics.
EARNINGS PER COMMON SHAREBasic earnings per common share is calculated by dividing income availableto common stockholders by the weighted average number of common sharesoutstanding during the period. Diluted earnings per common share reflects thedilutive impact of the assumed conversion of stock issued pursuant to ourrestricted stock and stock option incentive plans using the treasury stock methodand the if-converted method for our convertible preferred stock.
TAX INCREMENT FINANCINGTax increment financing is a common form of project infrastructure financingexpected to be repaid through future tax assessments. In determining if suchfinancing should be recorded, factors including whether the assessment is fixed or variable and the probability we will become obligated for such financingis considered.
USE OF ESTIMATESThe preparation of consolidated financial statements in conformity with U.S.generally accepted accounting principles (“GAAP”) requires management tomake estimates and assumptions that affect the amounts reported in the con-solidated financial statements and accompanying notes. Actual results coulddiffer from those estimates.
RECLASSIFICATIONSCertain amounts in the 2003 and 2002 consolidated financial statements havebeen reclassified to conform to the current year presentation.
3. NEW AND PENDING ACCOUNTING PRONOUNCEMENTSSTANDARDS IMPLEMENTED AND TRANSITION ADJUSTMENTFIN 45 – Effective October 1, 2003, we adopted the disclosure provisions ofFinancial Accounting Standards Board Interpretation (“FIN”) No. 45, “Guarantor’sAccounting and Disclosure Requirements for Guarantees, including DirectGuarantees of Indebtedness of Others.” Initial recognition and measurementprovisions of FIN 45 were adopted on a prospective basis for guarantees issuedafter December 31, 2002. Under FIN 45, the fair value of a guarantee is recordedas a liability at its inception, with the offsetting entry recorded based on the circumstances in which the guarantee was issued. The adoption of this pro-nouncement did not have a material impact on our financial condition or resultsof operations.
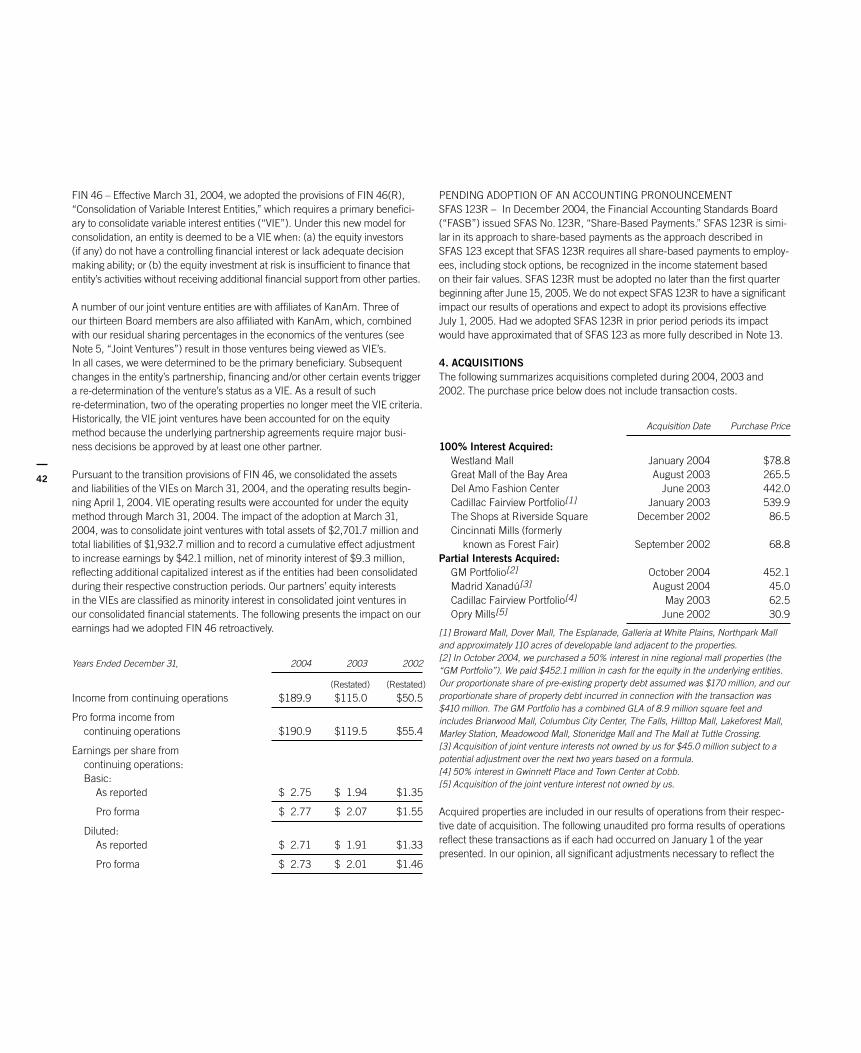
42
FIN 46 – Effective March 31, 2004, we adopted the provisions of FIN 46(R),“Consolidation of Variable Interest Entities,” which requires a primary benefici-ary to consolidate variable interest entities (“VIE”). Under this new model forconsolidation, an entity is deemed to be a VIE when: (a) the equity investors (if any) do not have a controlling financial interest or lack adequate decisionmaking ability; or (b) the equity investment at risk is insufficient to finance thatentity’s activities without receiving additional financial support from other parties.
A number of our joint venture entities are with affiliates of KanAm. Three of our thirteen Board members are also affiliated with KanAm, which, combinedwith our residual sharing percentages in the economics of the ventures (seeNote 5, “Joint Ventures”) result in those ventures being viewed as VIE’s.In all cases, we were determined to be the primary beneficiary. Subsequentchanges in the entity’s partnership, financing and/or other certain events triggera re-determination of the venture’s status as a VIE. As a result of suchre-determination, two of the operating properties no longer meet the VIE criteria.Historically, the VIE joint ventures have been accounted for on the equitymethod because the underlying partnership agreements require major busi-ness decisions be approved by at least one other partner.
Pursuant to the transition provisions of FIN 46, we consolidated the assets and liabilities of the VIEs on March 31, 2004, and the operating results begin-ning April 1, 2004. VIE operating results were accounted for under the equitymethod through March 31, 2004. The impact of the adoption at March 31,2004, was to consolidate joint ventures with total assets of $2,701.7 million andtotal liabilities of $1,932.7 million and to record a cumulative effect adjustmentto increase earnings by $42.1 million, net of minority interest of $9.3 million,reflecting additional capitalized interest as if the entities had been consolidatedduring their respective construction periods. Our partners’ equity interests in the VIEs are classified as minority interest in consolidated joint ventures in our consolidated financial statements. The following presents the impact on ourearnings had we adopted FIN 46 retroactively.
Years Ended December 31, 2004 2003 2002
(Restated) (Restated)
Income from continuing operations $189.9 $115.0 $50.5
Pro forma income from continuing operations $190.9 $119.5 $55.4
Earnings per share from continuing operations:Basic:
As reported $ 2.75 $ 1.94 $1.35
Pro forma $ 2.77 $ 2.07 $1.55
Diluted:As reported $ 2.71 $ 1.91 $1.33
Pro forma $ 2.73 $ 2.01 $1.46
PENDING ADOPTION OF AN ACCOUNTING PRONOUNCEMENTSFAS 123R – In December 2004, the Financial Accounting Standards Board(“FASB”) issued SFAS No.123R, “Share-Based Payments.” SFAS 123R is simi-lar in its approach to share-based payments as the approach described inSFAS 123 except that SFAS 123R requires all share-based payments to employ-ees, including stock options, be recognized in the income statement based on their fair values. SFAS 123R must be adopted no later than the first quarterbeginning after June 15, 2005. We do not expect SFAS 123R to have a significantimpact our results of operations and expect to adopt its provisions effectiveJuly 1, 2005. Had we adopted SFAS 123R in prior period periods its impactwould have approximated that of SFAS 123 as more fully described in Note 13.
4. ACQUISITIONSThe following summarizes acquisitions completed during 2004, 2003 and2002. The purchase price below does not include transaction costs.
Acquisition Date Purchase Price
100% Interest Acquired:Westland Mall January 2004 $78.8Great Mall of the Bay Area August 2003 265.5Del Amo Fashion Center June 2003 442.0Cadillac Fairview Portfolio[1] January 2003 539.9The Shops at Riverside Square December 2002 86.5Cincinnati Mills (formerly
known as Forest Fair) September 2002 68.8Partial Interests Acquired:
GM Portfolio[2] October 2004 452.1Madrid Xanadú[3] August 2004 45.0Cadillac Fairview Portfolio[4] May 2003 62.5Opry Mills[5] June 2002 30.9
[1] Broward Mall, Dover Mall, The Esplanade, Galleria at White Plains, Northpark Malland approximately 110 acres of developable land adjacent to the properties.[2] In October 2004, we purchased a 50% interest in nine regional mall properties (the“GM Portfolio”). We paid $452.1 million in cash for the equity in the underlying entities.Our proportionate share of pre-existing property debt assumed was $170 million, and ourproportionate share of property debt incurred in connection with the transaction was$410 million. The GM Portfolio has a combined GLA of 8.9 million square feet andincludes Briarwood Mall, Columbus City Center, The Falls, Hilltop Mall, Lakeforest Mall,Marley Station, Meadowood Mall, Stoneridge Mall and The Mall at Tuttle Crossing.[3] Acquisition of joint venture interests not owned by us for $45.0 million subject to apotential adjustment over the next two years based on a formula.[4] 50% interest in Gwinnett Place and Town Center at Cobb.[5] Acquisition of the joint venture interest not owned by us.
Acquired properties are included in our results of operations from their respec-tive date of acquisition. The following unaudited pro forma results of operationsreflect these transactions as if each had occurred on January 1 of the year presented. In our opinion, all significant adjustments necessary to reflect the

THE M
ILLS CO
RP
OR
ATION
Annual R
eport 2004
43
effects of the acquisitions, the equity offerings and use of the line of credit havebeen made.
Unaudited Pro Forma
Years Ended December 31, 2004 2003
(Restated)
Operating revenues $688.1 $419.6
Net income $227.9 $128.8
Income per common share – basic $ 3.57 $ 2.12
Income per common share – diluted $ 3.51 $ 2.09
The following summarizes the purchase price allocation for the 2004 and2003 acquisitions:
2004 2003
Income producing property $ 76.6 $1,206.6Investment in unconsolidated joint ventures 452.1 62.5Deferred costs and other intangibles, net 2.7 71.4Mortgages, notes and loans payable assumed – (65.9)Accounts payable and other liabilities (0.5) (20.4)
Net assets acquired $530.9 $1,254.2
5. JOINT VENTURESJoint ventures are commonly used in the real estate industry to fund develop-ment and/or expansion and to diversify risk in a particular property or area. Weheld joint venture interests in 27 properties as of December 31, 2004 and 17 asof December 31, 2003, as well as interests in various predevelopment projects.Joint venture interests are accounted for under the equity method while theventure is unconsolidated. Consolidation occurs when we gain unilateral controlof the entity through the acquisition of additional partnership interests or whenthe entity becomes a variable interest entity for which we are determined to bethe primary beneficiary. The following summarizes our residual sharing and
capital contribution percentages in our consolidated and unconsolidated realestate joint ventures at December 31, 2004:
Residual Capital
Sharing Contribution
Percentage Percentage
Consolidated Joint Ventures:Operating properties:
Arundel Mills 59.3% 39.5%The Block at Orange 50.0% –Colorado Mills 56.3% 37.5%Concord Mills 59.3% 39.5%Discover Mills 50.0% –Grapevine Mills 59.3% 39.5%Great Mall of the Bay Area 75.0% 49.0%Katy Mills 62.5% 25.0%Opry Mills 75.0% 49.0%St. Louis Mills 75.0% 50.0%Arundel Mills Marketplace 59.3% 39.5%
Properties under development:Meadowlands Xanadu[1] 53.3% 26.67%Pittsburgh Mills 56.3% 37.5%
Unconsolidated Operating Property Joint Ventures:Arizona Mills 50.0% 50.0%Ontario Mills 50.1% 50.1%Briarwood Mall[2] 50.0% 50.0%Columbus City Center[2] 50.0% 50.0%Del Amo Fashion Center 75.0% 50.0%The Falls[2] 50.0% 50.0%Gwinnett Place[3] 50.0% 50.0%Hilltop Mall[2] 49.9% 49.9%Lakeforest Mall[2] 50.0% 50.0%Marley Station[2] 50.0% 50.0%Meadowood Mall[2] 50.0% 50.0%Stoneridge Mall[2] 49.9% 49.9%Town Center at Cobb[3] 50.0% 50.0%The Mall at Tuttle Crossing[2] 50.0% 50.0%Vaughan Mills 50.0% 50.0%
[1] Percentages are subject to change based upon project scope and required contributions[2] GM Portfolio properties acquired in October 2004[3] Cadillac Fairview portfolio acquired in May 2003
AGREEMENTSWe are committed to providing additional equity to certain of our joint venturesunder development pursuant to the relevant joint venture agreements and weguarantee certain joint venture partners’ preference returns and the repaymentof construction debt. Guarantees generally remain in effect until certain debtservice coverage tests are met or a permanent loan is obtained, which generallyoccurs within two to four years after a property’s grand opening. We would beliable under the guarantees if the proceeds are insufficient to fund preferencepayments, the project’s construction is not completed or the construction loanis not refinanced at or before maturity. Most of our joint venture agreements

44
with KanAm contain provisions whereby we or KanAm can require the purchaseor sale of KanAm’s ownership interests.
The following summarizes certain significant joint venture agreement provisionsand activities:
Meadowlands XanaduMeadowlands Xanadu is being developed on the site of the Continental Arena in New Jersey pursuant to an agreement with the New Jersey Sports andExposition Authority, or the NJSEA. It is being developed through a joint venturebetween Meadowlands Mills Limited Partnership, or Meadowlands Mills, andaffiliates of Mack-Cali Realty Corporation, or Mack-Cali. Meadowlands Mills isobligated to contribute capital up to a maximum 40% of net project costs whileMack-Cali is obligated to contribute capital up to a maximum $32.5 million.Commencing on the sixth anniversary of opening, the agreement provides thateither party may put their interest in the partnership to the other for a pricebased on the fair value of the project at that time.
Meadowlands Mills is a partnership between us and KanAm. In October 2004, anentity owned by Meadowlands Mills acquired a 587-acre tract of land adjacentto the Continental Arena site, or the Empire Tract. In connection with the redevelopment agreement with NJSEA, we conveyed the Empire Tract to a non-profit conservation trust in exchange for a payment or credit of $26.8 mil-lion granted by the NJSEA. As of December 31, 2004, we had investedapproximately $109.3 million in Meadowlands Mills and KanAm had invested$210.2 million.
Pittsburgh MillsPittsburgh Mills is expected to open during the summer of 2005 and is beingdeveloped by Pittsburgh Mills Limited Partnership, a joint venture betweenMills-KanAm Pittsburgh Limited Partnership (“Mills-KanAm Pittsburgh”) andAV Associates Limited Partnership. Mills-KanAm Pittsburgh, through which weown our interest in the Pittsburgh Mills project, is a joint venture with KanAm.For one to three years following the opening of the project, AV Associates mayelect to convert a portion of its interest in the partnership to, at our option, cashor units of Mills LP. Commencing on the fifth anniversary of the project’s open-ing, AV Associates may put, and we may call, all of AV Associates’ remainingpartnership interest for a purchase price based on the fair market value of theproperty and paid, at our option, in cash or units of Mills LP. As of December 31,2004, we and KanAm had each invested $57.8 million.
Vaughan MillsWe and Ivanhoe Cambridge each own an undivided 50% interest, as tenants in common, in Vaughan Mills, which opened in November 2004. At any timefollowing the fourth anniversary of the opening of the project, either party mayexercise a buy-sell provision pursuant to which the offering party can requirethat the other party either purchase for cash the offering party’s entire interest inthe project or sell to the offering party the interest of the other party.
SALE OR CONVEYANCE OF PARTNERSHIP INTERESTSIn December 2004, we sold a 50% joint venture interest in Del Amo FashionCenter for $221.8 million, including $158.0 million of the venture’s debt. Werecognized no material gain or loss on the sale. We included it in our consoli-dated results of operations from its date of acquisition in June 2003 through thedate the interest was sold and have since accounted for it on the equity methodas an unconsolidated joint venture.
Also in December 2004, we sold a 50% joint venture interest in a parcel of landadjacent to the Del Amo Fashion Center for $22.8 million in cash and recog-nized a $15.3 million gain.
In August 2004, we and KanAm sold a 50% joint venture interest in OntarioMills for $170.3 million. The joint venture interest sold consisted of KanAm’sentire interest and a portion of the interest held by us. We received proceeds of $50.7 million and recognized a gain of $39.6 million on our portion of thesale. Ontario Mills was an unconsolidated joint venture through March 31,2004; was consolidated under FIN 46 from April 1, 2004, through August 27,2004, and has since been accounted for on the equity method as an uncon-solidated joint venture.
In June 2004, we recorded a gain of $8.5 million from our August 2003 con-veyance to KanAm of an additional 6.375% partnership interest in each of theArundel Mills, Concord Mills and Grapevine Mills centers for proceeds of$28.1 million. Due to our continuing involvement in the joint ventures, we wereprecluded from recognizing the transactions as sales until June 2004 when the underlying joint venture agreements were amended to remove the termscomprising the continuing involvement.
In March 2004, we conveyed an approximately 50% joint venture interest inOpry Mills to KanAm Grund Kapitalanlagegesellshaft mbH (“KanAm Grund”)for $68.9 million and a gain of $35.9 million was recognized. KanAm Grund isan affiliate of KanAm, a German syndicator of real estate funds with whom we have had a long standing relationship. In connection with this transaction,we terminated a swap agreement and recorded a $5.3 million charge againstthe gain. Opry Mills was an unconsolidated joint venture through June 2002when we acquired our then partner’s remaining interest. It was a wholly ownedentity from June 2002 through March 23, 2004, and has since been accountedfor as a consolidated joint venture.
In December 2003, we conveyed a 50% joint venture interest in the Great Mallof the Bay Area to KanAm Grund for $47.2 million and recognized a $0.7 milliongain. The Great Mall of the Bay Area was consolidated as a wholly owned entityfrom August 2003 through December 17, 2003; was accounted for as anunconsolidated joint venture through March 31, 2004; and was consolidatedunder FIN 46 effective March 31, 2004.
MINORITY INTEREST IN CONSOLIDATED JOINT VENTURESUpon the adoption of FIN 46 we consolidated 15 joint venture properties whichwere previously accounted for under equity method. One such property (OntarioMills) was deconsolidated subsequently as a result of the sale of equity interests. We have since acquired our partner’s interest in a second property(Madrid Xanadú).
Our consolidated joint ventures are variable interest entities (“VIE”) for whichwe have been determined to be the primary beneficiary. Pursuant to the transi-tion provisions of FIN 46, we consolidated the assets and liabilities of theseentities on March 31, 2004, and the operating results beginning April 1, 2004.The impact of the adoption at March 31, 2004, was to consolidate joint ventureswith total assets of $2,701.7 million and total liabilities of $1,932.7 million and to record a cumulative effect adjustment to earnings of $42.1 million, net ofminority interest of $9.3 million, reflecting additional capitalized interest as if theentities had been consolidated during their respective construction periods. For the three months ended March 31, 2004 equity in the earnings of theseventures amounted to $8.2 million.

THE M
ILLS CO
RP
OR
ATION
Annual R
eport 2004
45
Equity interests in these joint ventures not owned by us are classified as minorityinterest in consolidated joint ventures in our consolidated financial statements.Included in our net income is the attribution to us, as primary beneficiary, of the effects of the elimination of interest and fees. For the period April 1, 2004through December 31, 2004, such amount included development fees of$39.6 million and interest income of $8.3 million. Distributions paid to or contri-butions received from our consolidated joint ventures are reflected as minorityinterest, net in our consolidated statement of cash flows.
Our consolidated operating property joint ventures are primarily financedthrough third party mortgages collateralized by their respective operating prop-erty. The creditors of such ventures do not have recourse to our general creditexcept when we have provided a guaranty. At December 31, 2004, such mort-gages aggregated $1.6 billion and are included in mortgages, notes and otherloans payable in our consolidated balances sheet. The carrying value of therelated collateral aggregated $2.1 billion and is classified in the net real estateand development assets section of our consolidated balance sheet atDecember 31, 2004.
UNCONSOLIDATED JOINT VENTURESAs of December 31, 2004, preference returns to the joint venture partners werecurrent and we had guaranteed repayment of $113.5 million of joint venturedebt and joint venture letters of credit of $5.8 million. We would be required toguarantee an additional $5.6 million if the joint ventures borrow up to the totalconstruction loan commitments. We are also contingently liable for propertytaxes and assessments levied against Ontario Mills Limited Partnership by theCity of Ontario Special Assessment District (“City”). The remaining aggregateamount of the special tax assessment is $10.6 million and will be collectedthrough 2020 to fund debt service on bonds issued by the City.
Condensed combined financial statements of our unconsolidated jointventures follow:
CONDENSED COMBINED BALANCE SHEETS:
December 31, 2004 2003
(Restated)
Assets:Net income producing property $2,379.2 $2,167.5Construction in progress 138.9 481.5Cash and cash equivalents 45.7 119.2Restricted cash 6.7 40.5Accounts and notes receivable, net 74.1 135.2Deferred costs, net 53.8 122.1Other 68.7 103.7
Total assets $2,767.1 $3,169.7
Liabilities and Equity:Debt $2,162.6 $2,204.9Other liabilities* 132.1 246.6Equity 472.4 718.2
Total liabilities and equity $2,767.1 $3,169.7
*Includes amounts due to Mills.
CONDENSED COMBINED RESULTS OF OPERATIONS:
Year Ended December 31, 2004 2003 2002
(Restated) (Restated)
Revenue:Minimum rent $142.7 $223.9 $181.4Other property revenue 102.2 135.5 106.8
Total operating revenues 244.9 359.4 288.2Expenses:Property operating expenses* 87.3 117.1 92.6Depreciation and amortization 64.3 109.8 94.5
Total operating expenses 151.6 226.9 187.1
Operating income 93.3 132.5 101.1Other income (expense):Interest expense (77.0) (107.4) (82.5)Foreign currency exchange gains, net – 1.9 –Other income (expense), net 5.1 9.0 25.3
Net income $ 21.4 $ 36.0 $ 43.9
Mills equity in earnings $ 15.3 $ 34.6 $ 24.0
*Includes management and other fees.
Significant accounting policies used by our unconsolidated joint ventures areconsistent with ours.
Effective March 31, 2004, 15 previously unconsolidated joint ventures wereconsolidated upon adoption of FIN 46. Also during 2004, we increased ourinterests in unconsolidated joint ventures with the GM Portfolio purchase inOctober 2004 and the sale of joint venture interests in Del Amo Fashion Centerin December 2004 and Ontario Mills in August 2004. In November 2004, the Vaughan Mills which is owned by a joint venture, opened. During 2003,operating unconsolidated joint ventures increased by five properties: (1) theDecember 2003 conveyance of an interest in the Great Mall of the Bay Area;(2) and (3) the May 2003 acquisition of interests in Gwinnett Place and TownCenter at Cobb in connection with the Cadillac Fairview Portfolio acquisition;(4) and (5) openings of the St. Louis Mills and Madrid Xanadú developments.
During 2004, the following financing transactions were completed on behalf of our unconsolidated joint venture properties:
In December 2004, in connection with the sale of a partnership interest, theDel Amo Fashion Center mortgage was refinanced. The new $316.0 million mort-gage is interest-only through maturity and provides for an additional $134.0 millionin redevelopment financing. The stated maturity is January 2008 with two one-year extension options. We have guaranteed $25.0 million of principal.In March 2004, construction financing for Vaughan Mills, an unconsolidatedjoint venture, was obtained from an affiliate of our partner in the project. Theconstruction loan has a total commitment of $157.8 million and a stated matu-rity of March 2006 with a one-year extension option. The loan bears interest atCDOR plus 2.25%. The CDOR margin is reduced as the project meets speci-fied completion, occupancy and leasing requirements are met and debtservice coverage ratios are achieved. Our guaranty of 50% of the constructionborrowings is reduced when certain performance measures are achieved.
Advances to unconsolidated joint ventures were $19.6 million, $114.9 millionand $127.6 million as of December 31, 2004, 2003 and 2002, respectively. Weearned interest on such advances of $11.1 million, $8.2 million and $4.3 millionfor the years ended December 31, 2004, 2003 and 2002, respectively.

46
6. MORTGAGES, NOTES AND LOANS PAYABLEMortgages, notes and loans payable, consist of the following:
December 31, 2004 2003
WHOLLY OWNED PROPERTY DEBT:
Broward Mall – Interest is payable monthly and principal payments are due in March with $1.5 million due in 2005; $2.0 million due annually from 2006 through 2008; and a balloon payment due in 2009. Mortgage was adjusted to fair value in the allocation of purchase price resulting in an effective interest rate of 5.34%. $ 62.1 $ 64.4
Cincinnati Mills[a] – Principal is due December 2006; interest rate at LIBOR plus 2.00%. An interest rate swap fixes interest at 5.88% through October 2006 on a notional amount of $57.0 million. Mills guarantees 75% of the balance. 122.0 58.4
Concord Mills Marketplace[b] – Balloon payment is due in February 2014; interest rate is 5.76%. 14.3 –Concord Mills Marketplace – Refinanced in January 2004 – 17.8Del Amo Fashion Center – deconsolidated in December 2004 upon sale of partnership interest – 287.0Dover Mall, The Esplanade, Galleria at White Plains and Northpark Mall Cross Collateralized[a] – Principal is due
February 2008, including two one-year extension options; interest rate is LIBOR plus 2.10%. The LIBOR floor is 1.75% on a notional amount of $75.0. An interest rate swap fixes the interest rate at 4.17% on the remaining $245.0 million through February 2005. 320.0 320.0
Franklin Mills/Liberty Plaza[b] – Balloon payment is due May 2007; blended interest rate is 7.67% 130.8 132.9Madrid Xanadú[a] – Loan is denominated in Euros and has a total commitment of $240.5 million. Interest rate is
EURIBOR plus 1.55%. Principal is due May 2006 but may be extended under two one-year options subject to certain conditions. Mills guarantees 2% of the balance, consolidated in 2004. 239.5 –
Potomac Mills/Gurnee Mills[b] – Balloon payment is due March 2011; interest rate is 7.46%. 343.0 346.5The Shops at Riverside Square – Interest is payable monthly through January 2005; principal and interest payments are
due thereafter based on 30 year amortization with a balloon payment due January 2013; interest rate is 5.77%. 65.0 65.0Sawgrass Mills[b] – Balloon payment is due July 2006; interest rate is 7.18% per annum. 290.3 293.4Sawgrass Mills[b] (mezzanine loan) – Balloon payment is due in July 2006; interest rate is LIBOR plus 4.50%. 35.7 36.1Westland Mall – Interest is payable monthly through February 2007; principal and interest payments are due thereafter
based on 30-year amortization with a balloon payment due February 2011; interest rate is 4.95%. 58.8 –Net Leased Properties[a] – Principal maturity dates range from October 2010 to January 2023; weighted average interest
rate is 8.57%. 47.4 47.4
CONSOLIDATED JOINT VENTURE PROPERTY DEBT
Arundel Mills[a] – Principal is due June 2010; interest rate is 4.61%. Provided certain conditions are met, an additional $40.0 million may be borrowed. 187.0 –
Arundel Marketplace[b] – Balloon payment is due January 2014; interest rate is 5.92%. 12.3 –The Block at Orange[a] – Balloon payment is due January 2009. Through April 2006 two interest rate swaps fix the rate
at 6.67% and 5.69% on varying notional amounts which total the outstanding balance of the mortgage. From May 2006 through the extended maturity an interest rate swap fixes the interest rate at 5.69% on a notional amount of $135.0 million. 135.0 –
Colorado Mills[a] – Principal is due November 2009, including two one-year extension options; interest rate is LIBOR plus 1.78%. 170.0 –
Concord Mills[b] – Balloon payment is due December 2012; interest rate is 6.13%. 176.9 –Discover Mills[a] – Principal is due April 2007 and has a one-year extension option. On a notional amount of
$110.5 million of the $119.4 million mortgage loan, interest rate swaps fix the interest rate at 3.44% through March 2005, 5.04% from April 2005 through March 2006, and 6.28% from April 2006 through maturity. On a notional amount of $39.5 million of the $42.6 million mezzanine loan, interest rate swaps fix the interest rate at 4.69% through March 2005, 6.29% from April 2005 through March 2006, and 7.53% from April 2006 through maturity. Mills guarantees 100% of the loan. 162.0 –
Grapevine Mills[b] – Balloon payment is due October 2008; interest rate is 6.47% 151.3 –Grapevine Mills II[b] – Balloon payment is due November 2008; interest rate is 8.39%. 14.1 –Great Mall of the Bay Area[a] – Principal is due September 2008; interest rate is 4.80%. 175.0 –Katy Mills[a] – Principal is due January 2013; interest rate is 6.69%. Mills guarantees 10% of the balance. 148.0 –

THE M
ILLS CO
RP
OR
ATION
Annual R
eport 2004
47
The weighted average interest rate on our debt was 5.38% and 5.59% atDecember 31, 2004 and 2003, respectively. Of the total outstanding debt,$2.5 billion and $1.1 billion was fixed rate at December 31, 2004 and 2003,respectively. The revolving line of credit and term loan are our only unsecuredborrowings ($452.0 million at December 31, 2004). At December 31, 2004, we had total recourse debt of $3.4 billion.
Certain mortgages, notes and loans payable agreements contain restrictivecovenants relating to the maintenance of specified financial performance ratiossuch as minimum net worth, debt service coverage ratio, loan to value andrestriction on future dividend and distribution payments. As of December 31,2004, we were in compliance with these covenants. We have reviewed therestatement adjustments with our lenders and have received the requiredwaivers of certain representations and non-financial covenants that are affectedby the restatement adjustments described in Note 17. Contemporaneously withthe filing of the Form 10-K, we satisfied all conditions contained in the waiveragreement, and therefore the Facility continues to remain available and in fullforce and effect.
Aggregate annual maturities at December 31, 2004 are as follows:
2005 $ 18.72006 708.62007 1,051.72009 669.12010 373.9Thereafter 1,004.6
$3,826.6
In December 2004, we refinanced our existing $500.0 million unsecured line of credit and $200.0 million secured term loan with an unsecured $1.2 billioncredit facility (the “Facility”) which includes a revolving credit commitment of$1.0 billion and a term loan of $200.0 million. Borrowings under the Facilitymay be used to acquire or develop real property, make various permitted invest-ments, repay indebtedness and fund other working capital needs. The ability todraw on the line of credit is subject to the maintenance of certain financial ratiosas specified in the line of credit agreement. At our option, borrowings under the
Facility bear interest at LIBOR, EURIBOR or a base rate plus an applicable mar-gin based on our leverage ratio. The margin on LIBOR rate loans varies between0.95% and 1.45% (1.18% at December 31, 2004) and between 0.15% and 0.45%on base rate loans (0.15% at December 31, 2004). A facility fee, based on ourleverage ratio and ranging from 20 to 25 base points on the aggregate loansand unused commitments is also required. At December 31, 2004 the weightedaverage interest rate on the aggregate outstanding borrowings was 5.4%. TheFacility is scheduled to expire in December 2007 and contains a one-yearextension option.
7. FINANCIAL INSTRUMENTS – DERIVATIVES AND HEDGINGIn the normal course of business, we and our joint ventures are exposed to theeffect of interest rate changes. To limit this exposure, established risk manage-ment policies and procedures including the use of a variety of derivative financialinstruments to manage, or hedge, interest rate risk are followed. Derivativeinstruments are not used for speculative purposes. Derivative instruments usedfor hedging must be effective in reducing the interest rate risk exposure. Changesin the hedging instrument’s fair value related to the effective portion of the riskbeing hedged are included in accumulated other comprehensive income (loss).Hedge effectiveness criteria also require that it be probable that the underlyingtransaction occurs. Hedges that meet these criteria are formally designated ascash flow hedges at the inception of the derivative contract. When the terms of an underlying transaction are modified, or when the underlying hedged itemceases to exist, the change in the fair value of the derivative instrument ismarked to market with the change included in net income in each period untilthe derivative instrument matures. Any derivative instrument used for risk management that becomes ineffective is marked to market through earnings.
Depending on the underlying exposure, interest rate swaps, caps and floors,options, forwards or a combination thereof, may be used to manage interest raterisk. Interest rate swaps and collars are contractual agreements with third par-ties to exchange fixed and floating interest payments periodically without theexchange of the underlying principal amounts (notional amounts). In the unlikelyevent that a counterparty fails to meet the terms of an interest rate swap contractor collar agreement, the exposure is limited to the interest rate differential onthe notional amount. We do not anticipate non-performance by any of ourcounterparties. Net interest differentials to be paid or received under a swapcontract and/or collar agreement are accrued as interest expense as incurredor earned.
December 31, 2004 2003
Opry Mills[a] – Principal is due October 2007, including two one-year extensions; interest rate is LIBOR plus 1.18%. An interest rate swap fixes LIBOR at 2.50% on the balance through maturity fixing interest at 3.68%. Provided certain terms and conditions are met, an additional $25.0 million may be borrowed. 175.0 175.0
St. Louis Mills[a] – Principal is due May 2006; interest rate is LIBOR plus 1.95%. Interest rate swaps fix the interest rate at 4.36% and 4.15% on notional amounts of $55.0 million and $55.0 million, respectively, through October 2005 and 5.80% from November 2005 through April 2006 on a notional amount of $110.0 million. 131.1 –
Other 8.0 13.4
OTHER:
Line of credit[a] – see description below 252.0 227.0Term loan[a] – see description below 200.0 35.0
$3,826.6 $2,119.3
[a] Requires monthly interest only payments through maturity.[b] Monthly interest and principal payments based on a 30 year amortization schedule with a balloon payment due at maturity.

48
Interest rate hedges, designated as cash flow hedges, hedge the future cashoutflows on debt. Interest rate swaps that convert variable payments to fixedpayments, interest rate caps, floors, collars and forwards are cash flow hedges.The unrealized gains or losses in the fair value of these hedges are reported onthe balance sheet and included in accounts payable and other liabilities or ininvestment in unconsolidated joint ventures with a corresponding adjustment to either accumulated other comprehensive income or earnings depending onthe hedging relationship. If the hedging transaction is a cash flow hedge, thenthe offsetting gains/losses are reported in accumulated other comprehensiveincome to the extent of the effective portion of the risk being hedged. Changesin the fair value of the hedging instrument related to the effective portion of therisk being hedged are included in accumulated other comprehensive income(loss). Changes in fair value representing (1) the ineffectiveness of the hedgingrelationship and (2) any other component of fair value not related to the riskbeing hedged are recorded as interest expense through earnings. Changes infair value representing ineffectiveness of the hedging relationship are minimalfor all periods presented. Some derivative instruments are associated with thehedge of an anticipated transaction. Over time, the unrealized gains/losses heldin accumulated other comprehensive income (loss) will be reclassified to earn-ings consistent with when the hedged items are recognized in earnings. Thistype of reclassification reduced net income by $5.6 million for the year endedDecember 31, 2004.
As of December 31, 2004, we and our joint ventures were party to interest rateswap agreements that hedge the impact of the variability of LIBOR on cash out-flows. Under the agreements, we, or the joint venture, receive LIBOR and pay afixed rate. The following summarizes the current and deferred start swap termsof the derivative instruments and provides a reconciliation of their fair valuesand adjustments to accumulated other comprehensive (loss) income:
Wholly Owned Joint Ventures
Hedge Type Cash Flow Cash FlowDescription Swap SwapRange of notional amounts $57.0–$245.0 million $6.5–$176.3 millionRange of interest rate 2.07%–3.88% 1.69%–5.35%Range of deferred effective
start dates – 4/1/05–4/3/06Range of maturity dates 2/15/05–10/2/06 4/1/05–11/1/09Accumulated other
comprehensive loss at December 31, 2003 $(11.8) $(11.0)
Change in fair value 7.3 12.6
Accumulated other comprehensive (loss) income at December 31, 2004 $ (4.5) $ 1.6
Within the next twelve months, we expect to recognize interest expense of$1.7 million currently unrealized in accumulated other comprehensive losswhile our unconsolidated joint ventures expect to recognize $2.0 million, of whichour share is $(0.6) million. Other comprehensive loss, including our proportion-ate share of our joint venture balances, at December 31, 2004 and 2003 was
$2.4 million and $14.7 million, respectively. Comprehensive income for the yearsended December 31, 2004, 2003 and 2002 was $244.4 million, $114.6 millionand $41.6 million, respectively.
8. FAIR VALUE OF FINANCIAL INSTRUMENTSThe following disclosures of estimated fair value of financial instruments weredetermined by management, using available market information and appropri-ate valuation methodologies. Considerable judgment is necessary to interpretmarket data and develop estimated fair value. Accordingly, the estimates pre-sented herein are not necessarily indicative of the amounts the Company couldrealize on disposition of the financial instruments. The use of different marketassumptions and/or estimation methodologies could have a material effect on theestimated fair value amounts.
Cash equivalents, restricted cash, accounts and notes receivable, accountspayable and other liabilities are carried at amounts which reasonably approxi-mate their fair values.
Fixed rate debt with an aggregate carrying value of $2,454.2 million and$1,135.1 million had an estimated aggregate fair value of $2,495.8 million and$1,210.4 million at December 31, 2004 and 2003, respectively. Estimated fairvalue of fixed rate debt is based on interest rates currently available to us forissuance of debt with similar terms, credit risk and remaining maturities. Theestimated fair value of our variable rate debt is estimated to be approximatelyequal to its carrying value of $1,372.4 million and $984.2 million atDecember 31, 2004 and 2003, respectively.
Disclosure about fair value of financial instruments is based on pertinent infor-mation available to management at December 31, 2004 and 2003. Althoughmanagement is not aware of any factors that would significantly affect the reasonableness of the fair value amounts, such amounts have not been com-prehensively revalued for purposes of these consolidated financial statementssince December 31, 2004, and current estimates of fair value may differ signifi-cantly from the amounts presented herein.
9. LEASING ACTIVITIESWe have noncancellable tenant leases with remaining terms ranging from one to 20 years which require payment of specified minimum rent amounts. A majority of these leases also require the tenants to reimburse substantially allof the operating expenses of the properties. Minimum rent commitments undertenant leases at December 31, 2004, are as follows:
2005 $ 359.12006 329.12007 307.02008 277.82009 240.9Thereafter 985.6
$2,499.5
We are also subject to a noncancellable operating lease for our corporate head-quarters in Arlington, VA which expires in April 2006 and requires minimumpayments of $3.7 million and $1.8 million for the years ending December 31,

THE M
ILLS CO
RP
OR
ATION
Annual R
eport 2004
49
2005 and 2006, respectively. Rent expense amounted to $4.3 million, $3.2 mil-lion and $3.1 million for the years ended December 31, 2004, 2003 and2002, respectively.
In 2004, we entered into an agreement to lease new headquarters space begin-ning in April 2006. The lease is noncancellable with a term of 13 years. Minimumannual payments under our new lease total $7.4 million, $9.2 million, $9.4 mil-lion and $100.0 million for the years ending December 31, 2007, 2008, 2009and thereafter, respectively.
Also in 2004, the ground lease with NJSEA for the Meadowlands Xanadu sitewas signed. The 75 year lease term is expected to commence during mid-2005. The lease requires a deposit of $160.0 million, $50.0 million of whichwas placed in escrow when construction began in March 2005. On the thirdanniversary of the lease term commencement, a one time payment of$15.0 million is due. Beginning on the 16th anniversary of the lease term commencement annual rent payments begin. The payments for years 16 to 75of the lease term total $547.8 million.
10. SERIES A CUMULATIVE CONVERTIBLE PREFERRED STOCKIn October and November 2003, 750,000 shares of Series A CumulativeConvertible Preferred Stock were converted into 3,153,368 shares of TMC common stock. Series A dividends were accounted for as interest expense due to the stock’s redemption features.
11. MINORITY INTEREST IN MILLS LPTMC is the sole general partner of Mills LP and owned a 1.00% general partnerinterest and an 85.12% limited partner interest as of December 31, 2004.Minority interest in Mills LP is comprised of Mills LP common and preferred unitsafter eliminating TMC’s ownership units. Common minority interest is increasedand decreased, respectively, for income and distributions allocated to commonunits not held by TMC. Periodically, TMC raises additional equity through theissuance of common or preferred stock and contributes the proceeds to Mills LP
for an equivalent number of common or preferred units. In the event of otherchanges in common equity, an adjustment to minority interest in Mills LP andstockholders’ equity is recorded to reflect TMC’s increased or decreased owner-ship in Mills LP.
At December 31, 2004 and 2003, there were 8,967,494 and 13,464,161 com-mon limited partnership units of Mills LP, representing ownership of 13.88%and 21.12%, respectively, not held by TMC. If initiated by the unitholder theseunits are exchangeable in specified circumstances for either, at our option,shares of TMC common stock on a one for one basis or the cash equivalent.This exchange right has not been considered in TMC’s computation of pershare data, as it does not have a dilutive effect.
In March 2003, Mills LP sold 400,000 of 8.75% Series D CumulativeRedeemable Preferred Units in a private placement to two investors at a pur-chase price of $25.00 per unit. The net proceeds of $10.0 million were used to reduce borrowings under our line of credit. Series D preferred units areexchangeable for TMC’s Series D Cumulative Redeemable Preferred Stock on a one-for-one basis at any time after a registration statement covering theSeries D preferred shares is declared effective by the Securities and ExchangeCommission. Distributions on Series D preferred units are payable quarterly inarrears at 8.75% of the liquidation preference of $25.00 per unit. On or afterMarch 26, 2008, Series D preferred units and Series D preferred stock may beredeemed by Mills LP or TMC, as appropriate, at $25.00 per unit or share, asapplicable. Holders of Series D preferred stock, if any shares are outstanding,will have limited voting rights if dividends are not paid for six or more quarterlyperiods and in certain events. Series D preferred units are included in minorityinterest on the consolidated balance sheet at a value of $25 per share plusaccrued dividends, if any. Dividends paid or accrued are included in minorityinterest on the consolidated statements of income.
In June 2004, Mills LP issued 170,482 common partnership units to purchasea parcel of land with a $7.5 million agreed value.
12. CAPITAL STOCKThe number of shares authorized and outstanding was as follows:
December 31, 2004 December 31, 2003
Authorized Outstanding Authorized Outstanding
(Shares in thousands)
Common stock, $0.01 par value 100,000 55,654 100,000 50,298Non voting common stock, $0.01 par value 50,000 – 50,000 –Preferred stock:
Series A Cumulative Convertible, $0.01 par value – – 750 –Series B Cumulative Redeemable, $0.01 par value 4,300 4,300 4,300 4,300Series C Cumulative Redeemable, $0.01 par value 3,500 3,500 3,500 3,500Series D Cumulative Redeemable, $0.01 par value 400 – 400 –Series E Cumulative Redeemable, $0.01 par value 8,545 8,545 8,545 8,545Series F Convertible Cumulative Redeemable, $0.01 par value 316 316 – –Undesignated 2,939 – 3,255 –

50
SERIES B AND C CUMULATIVE REDEEMABLE PREFERRED STOCKIn October and December 2002, TMC sold a total of 4,300,000 shares of 9%Series B Cumulative Redeemable Preferred Stock and 3,400,000 of 9% SeriesC Cumulative Redeemable Preferred Stock, both with a par value of $0.01 pershare, for $25.00 per share in an underwritten public offering. In January 2003,an additional 100,000 shares of Series C preferred stock were sold in a publicoffering at an initial price of $25.23 per share. The aggregate net proceeds of$187.9 million and were contributed to Mills LP in exchange for preferred unitswhich have economic terms substantially identical to the Series B and C pre-ferred stock. Net proceeds from the Series B preferred stock sale were used to reduce borrowings under our line of credit, to fund development efforts andas working capital. Net proceeds from the Series C preferred stock were used to fund acquisitions in 2003. Dividends on the Series B and Series C preferredstock are payable quarterly at 9% of the liquidation preference of $25.00 pershare. Holders of the stock will have limited voting rights only if dividends arenot paid for six or more quarterly periods.
SERIES E CUMULATIVE REDEEMABLE PREFERRED STOCKIn May 2003, TMC sold a total of 6,440,000 shares of 8.75% Series E CumulativeRedeemable Preferred Stock, par value $0.01 per share, for $25.00 per sharein an underwritten public offering. In October and November 2003, TMC soldan additional 2,105,000 shares of Series E preferred stock for $26.24 per sharein two public offerings. The aggregate net proceeds of $210.5 million were contributed to Mills LP in exchange for preferred units having economic termssubstantially identical to the Series E preferred stock. The net proceeds wereused to reduce our line of credit and certain other indebtedness. Dividends onthe Series E preferred stock are payable quarterly at 8.75% of the liquidationpreference of $25.00 per share. On or after May 5, 2008, the Series E preferredstock may be redeemed by TMC at $25.00 per share. Holders of the Series Epreferred stock will have limited voting rights if dividends are not paid for six ormore quarterly periods and in certain other events.
SERIES F CUMULATIVE REDEEMABLE PREFERRED STOCKIn August 2004, TMC sold 316,250 shares of 6.75% Series F ConvertibleCumulative Redeemable Preferred Stock, par value $0.01 per share and a liqui-dation preference of $1,000 per share, in an offering made under Rule 144A ofthe Securities Act to qualified institutional buyers. Net proceeds of $306.2 mil-lion were contributed to Mills LP in exchange for preferred units with economicterms substantially identical to the Series F preferred stock. The net proceedswere used to reduce borrowings under our line of credit. Each share of Series Fpreferred stock is convertible into 16.6529 shares of TMC common stock, sub-ject to specified adjustments, if the closing sale price of TMC common stockreaches, or the trading price of Series F preferred stock falls below specifiedthresholds or under certain other circumstances. On or after August 5, 2009,the Series F preferred stock may be redeemed by us at its liquidation value onlyif the closing price of TMC common stock has exceeded 130% of the conver-sion price for at least 20 of 30 consecutive trading days immediately prior tonotice of redemption. Holders of the Series F preferred stock will have limitedvoting rights if dividends are not paid for six or more quarterly periods and incertain other events.
Pursuant to a registration rights agreement, we had agreed to use our reason-able best efforts to cause a shelf registration statement with respect to the resaleof the Series F preferred stock and the TMC common stock issuable upon conver-sion of such preferred stock to become effective within 180 days after the originalissuance of the Series F preferred stock. To date, we have not filed the shelf regis-tration statement, and, as such, we are required to pay liquidated damages at arate of 0.25% per annum for the first 90 days and 0.50% per annum until theregistration default is cured.
EARNINGS PER SHAREThe following table sets forth the computation of basic and diluted earnings percommon share:
Years Ended December 31, 2004 2003 2002
(Restated) (Restated)
Numerator:Net income $232.0 $115.1 $50.8
Less preferred stock dividends (43.9) (27.8) (2.6)Adjustment to minority interest 0.4 (0.2) (0.1)
Numerator for basic earnings per common share 188.5 87.1 48.1Adjustment to minority interest 0.6 0.5 0.4
Numerator for diluted earnings per common share $189.1 $ 87.6 $48.5
Denominator (shares in thousands):Weighted average shares 53,480 45,149 35,726Unvested restricted stock awards (425) (285) (235)
Denominator for basic earnings per share 53,055 44,864 35,491Effect of dilutive securities
(employee stock options and restricted stock awards) 1,024 921 864
Denominator for diluted earnings per share 54,079 45,785 36,355
Basic earnings per common share $ 3.55 $ 1.94 $1.36
Diluted earnings per common share $ 3.50 $ 1.91 $1.34
Our Series F Convertible Cumulative Redeemable Preferred Stock and certainstock options are excluded from the computation of basic and diluted earningsper common share as their impact is anti-dilutive.
STOCK OPTION PLANSEffective January 1, 2002, we adopted the fair value recognition provisions ofSFAS No.123 “Accounting for Stock Based Compensation,” on a prospectivebasis to all employee awards granted, modified or settled after the effectivedate. Because our awards vest over periods ranging from three to ten years, the cost related to stock based employee compensation is less than would havebeen recognized had the fair value method been applied to all outstanding and
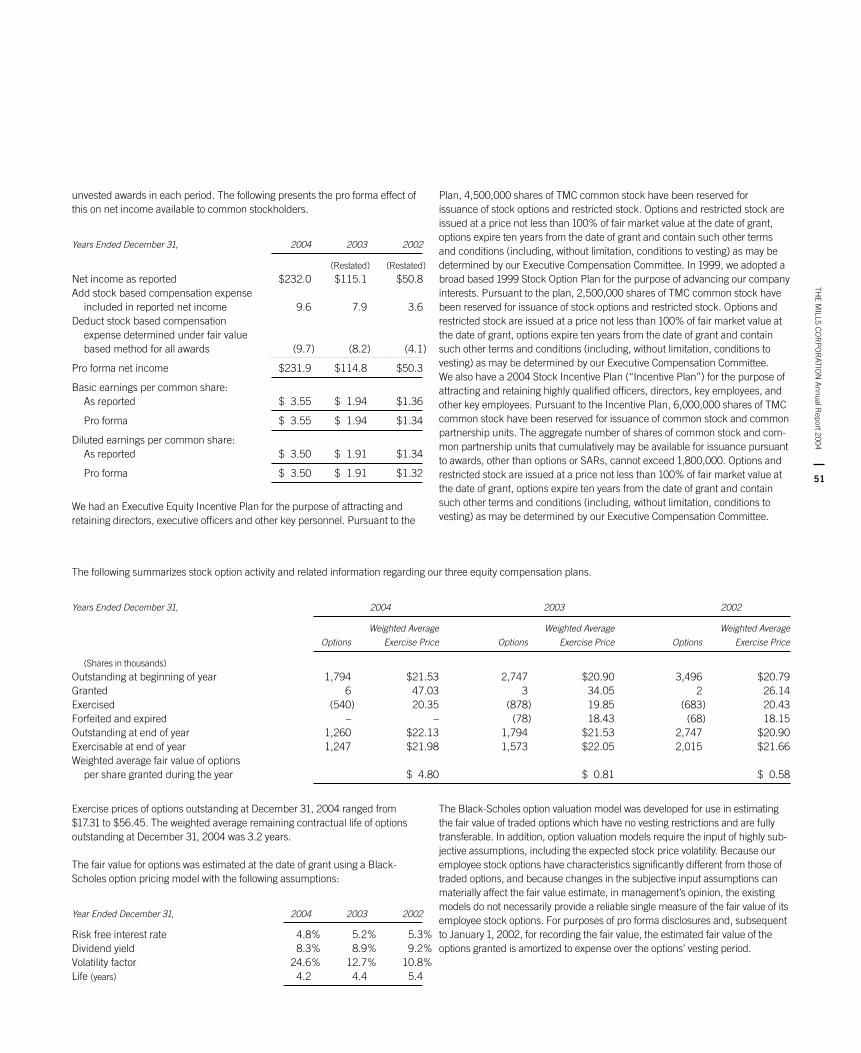
THE M
ILLS CO
RP
OR
ATION
Annual R
eport 2004
51
unvested awards in each period. The following presents the pro forma effect ofthis on net income available to common stockholders.
Years Ended December 31, 2004 2003 2002
(Restated) (Restated)
Net income as reported $232.0 $115.1 $50.8Add stock based compensation expense
included in reported net income 9.6 7.9 3.6Deduct stock based compensation
expense determined under fair value based method for all awards (9.7) (8.2) (4.1)
Pro forma net income $231.9 $114.8 $50.3
Basic earnings per common share:As reported $ 3.55 $ 1.94 $1.36
Pro forma $ 3.55 $ 1.94 $1.34
Diluted earnings per common share:As reported $ 3.50 $ 1.91 $1.34
Pro forma $ 3.50 $ 1.91 $1.32
We had an Executive Equity Incentive Plan for the purpose of attracting andretaining directors, executive officers and other key personnel. Pursuant to the
Plan, 4,500,000 shares of TMC common stock have been reserved forissuance of stock options and restricted stock. Options and restricted stock areissued at a price not less than 100% of fair market value at the date of grant,options expire ten years from the date of grant and contain such other termsand conditions (including, without limitation, conditions to vesting) as may bedetermined by our Executive Compensation Committee. In 1999, we adopted abroad based 1999 Stock Option Plan for the purpose of advancing our companyinterests. Pursuant to the plan, 2,500,000 shares of TMC common stock havebeen reserved for issuance of stock options and restricted stock. Options andrestricted stock are issued at a price not less than 100% of fair market value atthe date of grant, options expire ten years from the date of grant and containsuch other terms and conditions (including, without limitation, conditions tovesting) as may be determined by our Executive Compensation Committee. We also have a 2004 Stock Incentive Plan (“Incentive Plan”) for the purpose ofattracting and retaining highly qualified officers, directors, key employees, andother key employees. Pursuant to the Incentive Plan, 6,000,000 shares of TMCcommon stock have been reserved for issuance of common stock and commonpartnership units. The aggregate number of shares of common stock and com-mon partnership units that cumulatively may be available for issuance pursuantto awards, other than options or SARs, cannot exceed 1,800,000. Options andrestricted stock are issued at a price not less than 100% of fair market value atthe date of grant, options expire ten years from the date of grant and containsuch other terms and conditions (including, without limitation, conditions tovesting) as may be determined by our Executive Compensation Committee.
The following summarizes stock option activity and related information regarding our three equity compensation plans.
Years Ended December 31, 2004 2003 2002
Weighted Average Weighted Average Weighted Average
Options Exercise Price Options Exercise Price Options Exercise Price
(Shares in thousands)
Outstanding at beginning of year 1,794 $21.53 2,747 $20.90 3,496 $20.79Granted 6 47.03 3 34.05 2 26.14Exercised (540) 20.35 (878) 19.85 (683) 20.43Forfeited and expired – – (78) 18.43 (68) 18.15Outstanding at end of year 1,260 $22.13 1,794 $21.53 2,747 $20.90Exercisable at end of year 1,247 $21.98 1,573 $22.05 2,015 $21.66Weighted average fair value of options
per share granted during the year $ 4.80 $ 0.81 $ 0.58
Exercise prices of options outstanding at December 31, 2004 ranged from$17.31 to $56.45. The weighted average remaining contractual life of optionsoutstanding at December 31, 2004 was 3.2 years.
The fair value for options was estimated at the date of grant using a Black-Scholes option pricing model with the following assumptions:
Year Ended December 31, 2004 2003 2002
Risk free interest rate 4.8% 5.2% 5.3%Dividend yield 8.3% 8.9% 9.2%Volatility factor 24.6% 12.7% 10.8%Life (years) 4.2 4.4 5.4
The Black-Scholes option valuation model was developed for use in estimatingthe fair value of traded options which have no vesting restrictions and are fullytransferable. In addition, option valuation models require the input of highly sub-jective assumptions, including the expected stock price volatility. Because ouremployee stock options have characteristics significantly different from those oftraded options, and because changes in the subjective input assumptions canmaterially affect the fair value estimate, in management’s opinion, the existingmodels do not necessarily provide a reliable single measure of the fair value of itsemployee stock options. For purposes of pro forma disclosures and, subsequentto January 1, 2002, for recording the fair value, the estimated fair value of theoptions granted is amortized to expense over the options’ vesting period.
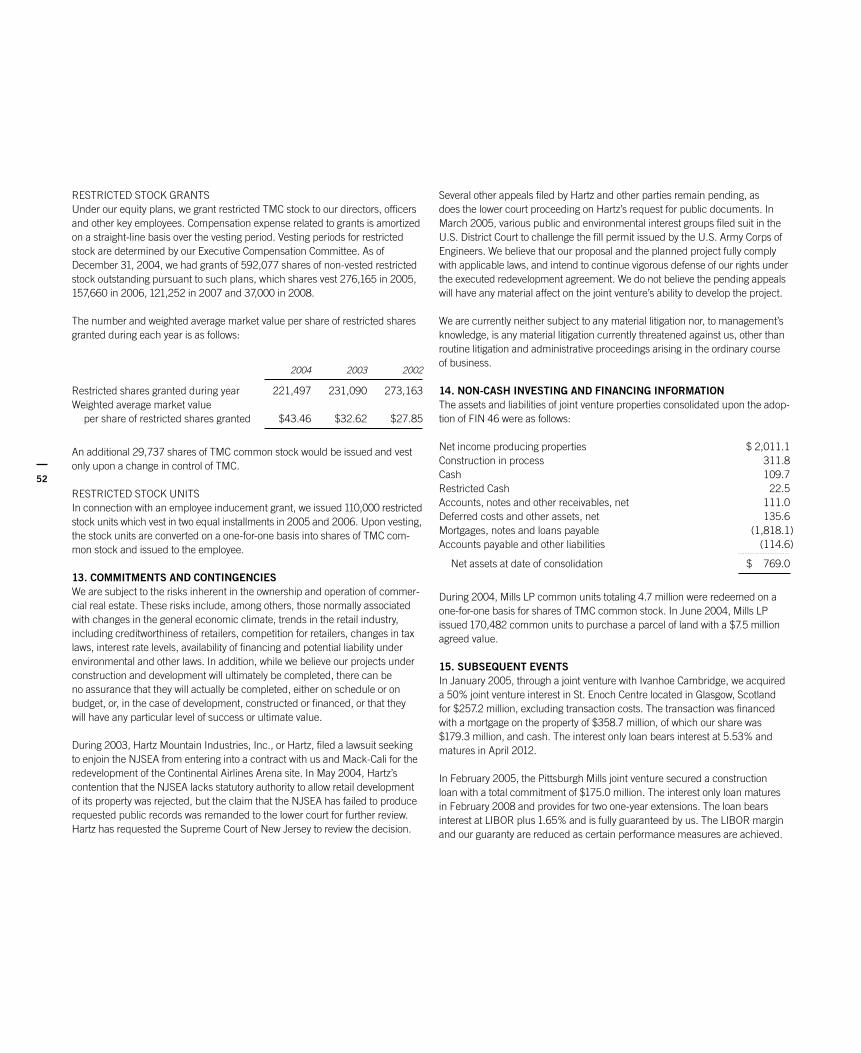
52
RESTRICTED STOCK GRANTSUnder our equity plans, we grant restricted TMC stock to our directors, officersand other key employees. Compensation expense related to grants is amortizedon a straight-line basis over the vesting period. Vesting periods for restrictedstock are determined by our Executive Compensation Committee. As ofDecember 31, 2004, we had grants of 592,077 shares of non-vested restrictedstock outstanding pursuant to such plans, which shares vest 276,165 in 2005,157,660 in 2006, 121,252 in 2007 and 37,000 in 2008.
The number and weighted average market value per share of restricted sharesgranted during each year is as follows:
2004 2003 2002
Restricted shares granted during year 221,497 231,090 273,163Weighted average market value
per share of restricted shares granted $43.46 $32.62 $27.85
An additional 29,737 shares of TMC common stock would be issued and vestonly upon a change in control of TMC.
RESTRICTED STOCK UNITSIn connection with an employee inducement grant, we issued 110,000 restrictedstock units which vest in two equal installments in 2005 and 2006. Upon vesting,the stock units are converted on a one-for-one basis into shares of TMC com-mon stock and issued to the employee.
13. COMMITMENTS AND CONTINGENCIESWe are subject to the risks inherent in the ownership and operation of commer-cial real estate. These risks include, among others, those normally associatedwith changes in the general economic climate, trends in the retail industry,including creditworthiness of retailers, competition for retailers, changes in taxlaws, interest rate levels, availability of financing and potential liability underenvironmental and other laws. In addition, while we believe our projects underconstruction and development will ultimately be completed, there can be no assurance that they will actually be completed, either on schedule or onbudget, or, in the case of development, constructed or financed, or that they will have any particular level of success or ultimate value.
During 2003, Hartz Mountain Industries, Inc., or Hartz, filed a lawsuit seekingto enjoin the NJSEA from entering into a contract with us and Mack-Cali for theredevelopment of the Continental Airlines Arena site. In May 2004, Hartz’s contention that the NJSEA lacks statutory authority to allow retail developmentof its property was rejected, but the claim that the NJSEA has failed to producerequested public records was remanded to the lower court for further review.Hartz has requested the Supreme Court of New Jersey to review the decision.
Several other appeals filed by Hartz and other parties remain pending, as does the lower court proceeding on Hartz’s request for public documents. InMarch 2005, various public and environmental interest groups filed suit in theU.S. District Court to challenge the fill permit issued by the U.S. Army Corps ofEngineers. We believe that our proposal and the planned project fully complywith applicable laws, and intend to continue vigorous defense of our rights underthe executed redevelopment agreement. We do not believe the pending appealswill have any material affect on the joint venture’s ability to develop the project.
We are currently neither subject to any material litigation nor, to management’sknowledge, is any material litigation currently threatened against us, other thanroutine litigation and administrative proceedings arising in the ordinary courseof business.
14. NON-CASH INVESTING AND FINANCING INFORMATIONThe assets and liabilities of joint venture properties consolidated upon the adop-tion of FIN 46 were as follows:
Net income producing properties $ 2,011.1Construction in process 311.8Cash 109.7Restricted Cash 22.5Accounts, notes and other receivables, net 111.0Deferred costs and other assets, net 135.6Mortgages, notes and loans payable (1,818.1)Accounts payable and other liabilities (114.6)
Net assets at date of consolidation $ 769.0
During 2004, Mills LP common units totaling 4.7 million were redeemed on aone-for-one basis for shares of TMC common stock. In June 2004, Mills LPissued 170,482 common units to purchase a parcel of land with a $7.5 millionagreed value.
15. SUBSEQUENT EVENTSIn January 2005, through a joint venture with Ivanhoe Cambridge, we acquireda 50% joint venture interest in St. Enoch Centre located in Glasgow, Scotlandfor $257.2 million, excluding transaction costs. The transaction was financedwith a mortgage on the property of $358.7 million, of which our share was$179.3 million, and cash. The interest only loan bears interest at 5.53% andmatures in April 2012.
In February 2005, the Pittsburgh Mills joint venture secured a construction loan with a total commitment of $175.0 million. The interest only loan maturesin February 2008 and provides for two one-year extensions. The loan bearsinterest at LIBOR plus 1.65% and is fully guaranteed by us. The LIBOR marginand our guaranty are reduced as certain performance measures are achieved.

THE M
ILLS CO
RP
OR
ATION
Annual R
eport 2004
53
In March 2005, in connection with the $451.6 million acquisition of SouthdaleCenter in Minneapolis, MN and Southridge Mall in Milwaukee, WI, we securedtwo mortgage loans. The $186.6 million Southdale loan is interest only throughmaturity, bears interest at 5.18%, and matures in April 2010. The $124.0 millionSouthridge loan is interest only through maturity, bears interest at 5.23%, andmatures in April 2012.
16. UNAUDITED QUARTERLY RESULTS OF OPERATIONSOur summarized results of operations by quarter for 2004 and 2003 were as follows:
Three Months Ended
2004: December 31 September 30 June 30 March 31
(Restated) (Restated) (Restated)
Operating revenues $213.7 $185.6 $186.2 $99.3Income from continuing operations 54.1 62.3 29.3 44.2Net income 54.1 62.3 29.3 86.3Income from continuing operations per share:
Basic 0.72 0.97 0.38 0.67Diluted 0.71 0.95 0.38 0.66
Net earnings per share:Basic 0.72 0.97 0.38 1.48Diluted 0.71 0.95 0.38 1.45
Weighted average common shares outstanding (in thousands):Basic 54,721 54,079 53,489 50,384Diluted 55,948 55,120 54,332 51,356
Three Months Ended,
2003: December 31 September 30 June 30 March 31
(Restated) (Restated) (Restated) (Restated)
Operating revenues $130.0 $105.4 $88.6 $76.8Income from continuing operations 38.4 18.4 37.9 20.3Net income 38.4 18.4 37.9 20.4Income from continuing operations per share:
Basic 0.62 0.24 0.71 0.37Diluted 0.61 0.24 0.70 0.36
Net earnings per share:Basic 0.62 0.24 0.71 0.37Diluted 0.61 0.24 0.70 0.36
Weighted average common shares outstanding:Basic 48,221 44,094 43,562 43,173Diluted 49,318 45,051 44,441 43,924
*Results of operations for the seven quarterly periods ended September 30, 2004, were restated for the matters discussed in Note 17. The impact of the restatement on the data pre-sented above is summarized below.
In March 2005, we refinanced the Sawgrass mezzanine mortgage loan with aninitial advance of $40.0 million that paid off the existing loan. The new loan has a total commitment of $73.8 million. The interest rate on the initial advance of$40.0 million is LIBOR plus 3.50%, while any additional proceeds bear interestat LIBOR plus 2.00%. The interest only loan matures in July 2006 and is fullyguaranteed by us.

54
The quarterly impact of the restatement adjustments were as follows:
Three Months Ended,
2004: September 30 June 30 March 31
(Dollars in millions, except per share data) (Unaudited)
Increase (decrease) in income from continuing operations:Equity in earnings $ (1.8) $ 3.9 $ 2.9Capitalized interest 1.4 1.5 (0.2)Other capitalized costs (0.2) (1.8) (1.7)Gain on sales of joint venture interests (2.2) 8.5 0.6Promotion funds (0.4) (0.4) (0.3)Other 2.1 (0.5) 0.1
Increase (decrease) in Mills LP income from continuing operations (1.1) 11.2 1.4Mills LP minority interest’s share of the restatement adjustments 0.2 (2.0) (0.3)
Increase (decrease) in TMC net income from continuing operations $ (0.9) $ 9.2 $ 1.1
Increase (decrease) in diluted earnings per common share from continuing operations:Equity in earnings $(0.03) $ 0.06 $ 0.04Capitalized interest 0.02 0.03 –Other capitalized costs – (0.03) (0.02)Gain on sales of joint venture interests (0.03) 0.13 0.01Promotion funds (0.01) (0.01) (0.01)Other 0.03 (0.01) –
Increase (decrease) in diluted earnings per common share from continuing operations $(0.02) $ 0.17 $ 0.02
Three Months Ended,
2003: December 31 September 30 June 30 March 31
(Dollars in millions, except per share data) (Unaudited)
Increase (decrease) in income from continuing operations:Equity in earnings $ 0.2 $ 1.6 $ 3.6 $ 1.4Capitalized interest (0.1) (0.9) (1.5) (1.4)Other capitalized costs 0.1 (1.1) – (0.4)Gain on sales of joint venture interests – (8.5) – –Promotion funds (0.1) (0.1) (0.1) (0.1)Other (0.8) (0.1) (1.4) –
Increase (decrease) in Mills LP income from continuing operations (0.7) (9.1) 0.6 (0.5)Mills LP minority interest’s share of the restatement adjustments 0.2 2.3 (0.1) 0.1
Increase (decrease) in TMC net income from continuing operations $ (0.5) $ (6.8) $ 0.5 $ (0.4)
Increase (decrease) in diluted earnings per common share from continuing operations:Equity in earnings $ – $ 0.03 $ 0.06 $ 0.02Capitalized interest – (0.02) (0.03) (0.02)Other capitalized costs – (0.02) – (0.01)Gain on sales of joint venture interests – (0.14) – –Promotion funds – – – –Other (0.02) – (0.02) –
Increase (decrease) in diluted earnings per common share from continuing operations $(0.02) $(0.15) $0.01 $(0.01)
Refer to Note 17 for a description of the significant aspects of the restatement.

THE M
ILLS CO
RP
OR
ATION
Annual R
eport 2004
55
17. RESTATEMENTWe announced on February 16, 2005, that we would restate our audited financial results for the fiscal years ended December 31, 2003 and 2002, andour unaudited quarterly results for the first three quarters of 2004 to correct our accounting treatment of various items to conform with Generally AcceptedAccounting Principles, or GAAP. The following describes the significant aspectsof the restatement.
Equity in earnings. We changed our method of computing our equity in theearnings of our joint ventures and have applied the change retroactively to the origination of our involvement in each of these joint ventures. Previously,we used an estimate of our economic ownership in the joint venture based on projected cash flows. The method reflected in the restatement allocatesincome to equity participants based on the terms of the respective partner-ship agreements upon an assumed liquidation of the joint venture at itsdepreciated book value as of the end of the reporting period.Capitalized interest. We changed our method for capitalizing the interest onborrowings made to fund our development and other construction projects.Previously, we capitalized interest using computed rates on excess proceedsfrom refinancing various loans based on an incremental interest cost approach.The amount we now capitalize is based on the stated interest rates, includingamortization of deferred financing costs. The calculation includes interestcosts that theoretically could have been avoided, based first on project spe-cific borrowings then on an assumed repayment of our highest rate debt, hadthe underlying development and construction activities not been undertaken.Other capitalized costs. We changed our accounting for leasing and financ-ing overhead to expense these costs as incurred to the extent of our partners’interests in the underlying entities. We previously capitalized these costs andexpensed them as the related fees were recognized. We also corrected ouraccounting for lease inducements to amortize them against revenue over thelife of the lease.Gain on sale of joint venture interests. In the third quarter of 2003, wereported a sale of partial interests in three joint ventures and recognized anaggregate gain of $8.5 million. Due to our continuing involvement in the jointventures, SFAS 66 precluded us from recognizing the transactions as sales in2003. In the restatement, we recorded the sales and related gains in the sec-ond quarter of 2004 when the underlying joint venture agreements wereamended to remove the terms comprising the continuing involvement.Promotion funds. Under our lease agreements, tenants are required to fund costs associated with promoting the property. The restatement reflectsamounts received from tenants as “Recoveries from tenants” and the associ-ated expenses are reflected as “Recoverable from tenants.” These amountshad previously been presented on a net basis. Currently, revenues in excessof expenses are deferred until the associated costs are incurred and promo-tion costs are expensed as incurred.
Other. In conjunction with the restatement, we also made adjustments to ouraccounting for various other miscellaneous items, including (i) calculatingstraight-line rent from the date the tenant takes control of the space, ratherthan our previous practice of recognizing rent as of lease commencementdate; (ii) the correction of some purchase price adjustments; and (iii) restatinggains on residual land sales from joint ventures to expense capitalized interestupon sale.
In addition, we have grossed up our income statement to no longer net certainfees and the costs incurred to earn those fees.
The following summarizes the restatement adjustments made to the consoli-dated statements of income. For periods prior to 2002 the restatements wereeffectuated through a cumulative adjustment as of January 1, 2002, of$17.1 million to TMC’s accumulated deficit.
Years Ended December 31, 2003 2002
(Dollars in millions, except per share data)
Increase (decrease) in income from continuing operations:Equity in earnings $ 6.8 $ (6.5)Capitalized interest (3.9) (7.6)Other capitalized costs (1.4) (2.2)Gain on sales of joint venture interests (8.5) –Promotion funds (0.4) (0.5)Other (2.3) (0.4)
Decrease in Mills LP income from continuing operations (9.7) (17.2)Mills LP minority interest’s share of the
restatement adjustments 2.5 5.4
Decrease in TMC net income from continuing operations $ (7.2) $(11.8)
Increase (decrease) in diluted earnings per common share from continuing operations:Equity in earnings $ 0.10 $(0.12)Capitalized interest (0.06) (0.14)Other capitalized costs (0.02) (0.04)Gain on sales of joint venture interests (0.14) –Promotion funds – (0.01)Other (0.04) (0.01)
Decrease in diluted earnings per common share from continuing operations $(0.16) $(0.32)

56
The following summarizes the impact of the restatement on the individual com-ponents of our consolidated statements of income.
Years Ended December 31, 2003 2002
Property revenuesMinimum rent $ (0.4) $ (0.6)[c]
Recoveries from tenants 11.7 7.9[e]
Management fees 3.8 3.7[f]
Other fee income 14.6 12.8[c,f]
Total operating expenses 29.7 23.8Property operating expenses
Recoverable from tenants 15.9 11.7[e,f]
Other operating expenses (0.5) –[g]
General and administrative expenses 1.4 (0.4)[g]
Cost of fee income 16.9 15.3[c,f]
Depreciation and amortization (1.0) (0.5)[c]
Total operating expenses 32.7 26.1
Operating income (3.0) (2.3)Interest expense (3.9) (7.6)[b]
Other income, net (1.1) (0.8)[g]
Income before joint venture operations and minority interest in Mills LP (8.0) (10.7)Sales of joint venture interests (8.5) –[d]
Equity in earnings of unconsolidated joint ventures 6.8 (6.5)[a]
Mills LP net income (9.7) (17.2)Minority interest in Mills LP 2.5 5.4
TMC net income $ (7.2) $(11.8)
[a] Equity in earnings[b] Capitalized interest[c] Other capitalized costs[d] Gain on sale of joint venture interests[e] Promotion funds[f] Income statement gross-up of fees and costs to earn those fees[g] Other
THE M
ILLS CO
RP
OR
ATION
Annual R
eport 2004
57
BOARD OF DIRECTORS THE MILLS CORPORATION
Laurence C. Siegel[E]
Chairman of the BoardChief Executive Officer –The Mills CorporationTerm Expires June 2005*
Charles R. Black, Jr.President and Chief Executive Officer –Black, Kelly, Scruggs & HealeyTerm Expires June 2006
Dietrich von BoetticherVice Chairman of the Board Partner – von Boetticher, Hasse, LohmannTerm Expires June 2006
James C. Braithwaite[E]
President – KanAm Realty, Inc.Term Expires June 2007
S. Joseph Bruno[A]
President – Building HopeTerm Expires June 2006
The Honorable Joseph B. Gildenhorn[A]
Founding Officer – The JBG CompaniesTerm Expires June 2007
John M. Ingram[E]
Vice Chairman of the BoardPrincipal – Ingram Realty AdvisorsTerm Expires June 2006
Sir Frank LamplLife President – Bovis Lend LeaseTerm Expires June 2007
Colombe Nicholas[A]
Member – Financo Global ConsultingTerm Expires June 2005*
Harry H. Nick[E]
Principal –Seneca Investment GroupTerm Expires June 2007
Franz von PerfallPresident – KanAm International, GmbHTerm Expires June 2005*
Robert P. Pincus[E][A]
Chairman – Milestone Capital Partners, L.P.Term Expires June 2007
Cristina L. Rose[A]
Senior Managing Director – GCG Rose & KindelTerm Expires June 2005*
[E] Executive Committee[A] Audit Committee*Nominees for re-election at the 2005 Annual Shareholders Meeting
EXECUTIVE OFFICERSTHE MILLS CORPORATION
Laurence C. SiegelChairman and Chief Executive Officer
Mark D. EttengerPresident
James F. DauschPresident, Development Division
James A. NapoliPresident, Operating Division
Kenneth R. Parent Chief Operating Officer
Gregg M. GoodmanExecutive Vice President, Anchor Leasing
Nicholas McDonoughExecutive Vice President, Asset Management
Mary Jane MorrowExecutive Vice President, Chief Financial Officer
D. Gregory NeebExecutive Vice President, Chief Investment Officer
Ronald WeidnerExecutive Managing Director,International Operations

58
CORPORATE INFORMATIONTHE MILLS CORPORATION
Common StockThe Mills Corporation common stock is traded on the New York Stock Exchange under the symbol “MLS.”
The Mills Corporation Stock Price and Dividend
Dividend
2004 High Low (per share)
First Quarter $53.29 $43.35 $.5650Second Quarter $53.54 $38.48 $.5950Third Quarter $52.60 $44.89 $.5950Fourth Quarter $63.76 $52.00 $.5950
Dividend
2003 High Low (per share)
First Quarter $31.59 $27.55 $.5475Second Quarter $34.15 $31.38 $.5650Third Quarter $39.35 $33.37 $.5650Fourth Quarter $44.00 $39.58 $.5650
Corporate InformationPersons interested in financial or general information about The Mills Corporation shouldcontact Investor Relations: 877/396-0206.
News releases issued by The Mills Corporation areavailable on the Internet at www.themills.com/media.You may also obtain news from the Business Wirewebsite at www.BusinessWire.com. Search for TheMills Corporation or our ticker symbol, MLS.
As of December 31, 2004, The Mills Corporationhad approximately 1,150 employees.
As of March 28, 2005, The Mills Corporation had1,078 stockholders of record.
Corporate HeadquartersThe Mills Corporation1300 Wilson BoulevardArlington, VA 22209Tel: 703/526-5000Fax: 703/526-5111Website: www.themills.com
MembershipsInternational Council of Shopping CentersNational Association of
Real Estate Investment Trusts, Inc.Urban Land Institute
Transfer AgentEquiServe Trust, N.A.P.O. Box 43069Providence RI 02940-3069800/446-2617Outside the U.S. 781/575-2000Hearing Impaired 800/952-9245www.equiserve.com
Legal CounselHogan & Hartson, LLP555 13th Street, NWWashington, DC 20004
SEC Form 10-KAdditional copies of this Annual Report and theForm 10-K are available from the Company orthrough The Wall Street Journal Annual ReportsService at 800/654-2582. You must give the tickersymbol when ordering. Also, you can visit The MillsCorporation website to obtain these documents atwww.themills.com/investors.
Independent Registered Public Accounting FirmErnst & Young LLP8484 Westpark DriveMcLean, VA 22102
Dividend Reinvestment and Share Purchase PlanShareholders may automatically reinvest their dividends in additional common stock of The MillsCorporation through the Dividend ReinvestmentPlan that also provides for purchase by voluntarycash contributions. The Company pays for costsand commissions associated with the plan. For additional information, please contact:
The Mills Corporation Dividend Reinvestment PlanEquiServe Trust, N.A.P.O. Box 43069Providence, RI 02940-3069800/446-2617Outside the U.S. 781/575-2000Hearing Impaired 800/952-9245www.equiserve.com
Annual MeetingThe Company’s Annual Meeting of Shareholderswill be held at 10:00 am (EDT) on June 7, 2005 at the Hyatt Regency Crystal City, 2799 JeffersonDavis Highway, Arlington, VA 22202.
Equal Opportunity EmployerThe Mills Corporation is an equal opportunityemployer. We believe that the talents of dedicatedand diverse employees represent our most impor-tant resource, and we realize that this philosophy isessential to our continued growth and development.
© 2005 The Mills CorporationArizona Mills, Arundel Mills, Block 37, BriarwoodMall, Broward Mall, Candlestick Mills, CincinnatiMills, Colorado Mills, Columbus City Center,Concord Mills, Del Amo Fashion Center, DiscoverMills, Dover Commons, Dover Mall, ExpandingRetail Boundaries, Experience The Mills Effect,FoodBrand, Franklin Mills, Georgia Walk of Fame,Grapevine Mills, Great Mall, Gurnee Mills, HilltopMall, Ice Zone, Katy Mills, Lakeforest Mall, MadridXanadu, Mainstreet Retail, Marley Station,Meadowlands Xanadu, Meadowood Mall, MillsGlobal, Mills Music Café, Mills Music Makers, MillsMusic Mentors, MillsServices, MillsTV, MillsXanadu, Muggsy’s Meadow, Northpark Mall,Ontario Mills, Opry Mills, Outer Harbor ArundelMills, Perfect Picks, Pittsburgh Mills, Potomac Mills,Sawgrass Mills, Shoppertainment, Shop TogetherEat Together Play Together, Southridge Mall,Southdale Mall, SportsStreet, St. Enoch Centre,St. Louis Mills, Stoneridge Shopping Center, TheBlock, The Block at Orange, The Colonnade Outletsat Sawgrass, The Esplanade, The Falls ShoppingCenter, The Future is a Different Place,The Galleria at White Plains, The Mall at TuttleCrossing, The Mills, The Mills Effect, The NextGeneration of Retailing, The Oasis, The Oasis at Sawgrass Mills, The Piers 27–31, The Shops atRiverside, There’s Just More at The Mills, VaughanMills, Westland Mall, Where Great Shopping Lives,Where Style Starts, and their respective logos areservice marks of The Mills Corporation and its affiliates.

Des
ign
byA
ddis
on
ww
w.a
ddis
on.c
om

THE MILLS CORPORATION
1300 Wilson BoulevardArlington, VA 22209
703.526.5000
www.themills.com
NYSE: MLS


