Page 1
www.elsevier.com/locate/marchem
Marine Chemistry 84 (2004) 243–265
Excess nitrate and nitrogen fixation in the North Atlantic Ocean
Dennis A. Hansella,*, Nicholas R. Batesb, Donald B. Olsona
aRosenstiel School of Marine and Atmospheric Science, University of Miami, Miami, FL 33149, USAbBermuda Biological Station for Research, Inc., St. Georges, GE 01 Bermuda
Received 20 September 2002; received in revised form 7 August 2003; accepted 8 August 2003
Abstract
The process of nitrogen fixation in the subtropical North Atlantic has received considerable study over the last few
decades. The findings have highlighted a large discrepancy in estimates for the locations and rates of nitrogen fixation when
results from biological techniques are compared to geochemical techniques. Here, we evaluated the distribution and rates of
excess nitrate development in the North Atlantic using World Ocean Circulation Experiment (WOCE) nutrient data. These
data indicate that excess nitrate development is largely confined to depths of f 150–400 m in the region of 15–25jN by
25–75jW, an area considerably smaller than that employed by Gruber and Sarmiento [Glob. Biogeochem. Cycles 11 (1997)
235] (10–50jN by 10–90jW) to estimate rates of nitrogen fixation in the North Atlantic. The areally integrated nitrogen
fixation rate for the subtropical North Atlantic was 0.045 mol N m� 2 year� 1, or 62% of the geochemical estimate by Gruber
and Sarmiento [Glob. Biogeochem. Cycles 11 (1997) 235]. The regional rate of fixation was 3.1�1011 mol N year� 1 (1.5–
4.6� 1011 mol N year� 1 given a 50% uncertainty), similar to rates expected from biological measures of fixation, but only
15% of the areal rate estimated by Gruber and Sarmiento [Glob. Biogeochem. Cycles 11 (1997) 235]. An accurate
assessment of the region over which excess nitrate accumulates is critical to the estimate of nitrogen fixation, but remains
prone to large uncertainty because of the gaps in spatial coverage. Additional survey work in the North Atlantic must be
done to lessen the uncertainty. With this work, we reduce the differences between the biological and geochemical rate
estimates, and describe a conceptual model for the location and dynamics of nitrate excess development in the North
Atlantic.
D 2003 Elsevier B.V. All rights reserved.
Keywords: Nitrate; Phosphate; N/P ratio; Subtropical North Atlantic; Nitrogen fixation
1. Introduction
Nitrogen is the limiting nutrient for phytoplankton
growth and export production in many regions of the
global ocean (Codispoti, 1989). The biological pump
removes N from the euphotic zone with high efficiency.
0304-4203/$ - see front matter D 2003 Elsevier B.V. All rights reserved.
doi:10.1016/j.marchem.2003.08.004
* Corresponding author. Tel.: +1-305-361-4078.
E-mail address: [email protected] (D.A. Hansell).
The N-bearing, sinking biogenic particles carry carbon
away from the surface ocean, thus sequestering carbon
into the ocean interior and away from the atmosphere
on time scales of years to centuries. The oceanic
nitrogen budget is not static, but set by the balance of
sources and sinks. Fixed nitrogen is lost from the
oceans during the process of denitrification. In order
to maintain the global budget, sources of new nitrogen
are required. These sources include wet and dry depo-
sition of N from the atmosphere, riverine inputs of
Page 2
D.A. Hansell et al. / Marine Chemistry 84 (2004) 243–265244
inorganic and organic N, and N2 fixation by marine
diazotrophs.
The new N supply most difficult to accurately
quantify is N2 fixation by pelagic phytoplankton
such as Trichodesmium. The global N2 fixation rate
in the ocean has been recently estimated at
8F 3� 1012 mol N year� 1, with c 2� 1012 mol
N year� 1 fixed in the North Atlantic Ocean (Gruber
and Sarmiento, 1997, hereafter GS97). A similar
global rate has been estimated by Lee et al. (2002)
who evaluated net carbon production in nitrate-
depleted tropical and subtropical waters. The GS97
rate of N2 fixation could remove c 5� 1013 mol C
year� 1 from the upper ocean, or 10% of marine
new production estimated by Chavez and Togg-
weiler (1995). Because of the high N/P ratio of
marine diazotrophs, mineralization of these sinking
particles below the euphotic zone can result in
nitrate concentrations in excess of those predicted
from phosphate concentrations and N/P element
stoichiometry (e.g., Redfield et al., 1963; Takahashi
et al., 1985; Anderson and Sarmiento, 1994). N2
fixation was invoked by Fanning (1987, 1992) to
explain high N/P ratios, for example, in the ther-
mocline waters of the western North Atlantic sub-
tropical gyre (or Sargasso Sea). More recently, the
parameter N* was introduced by Michaels et al.
(1996) and Gruber and Sarmiento (1997) to indicate
the degree to which the nitrate concentration is in
excess of that expected from the remineralization of
phosphate at stoichiometries of 16:1 (Redfield et al.,
1963). N* spatial distributions (and concentration
gradients) in the main thermoclines of the world’s
oceans broadly reflect the global distribution of N2
fixation and denitrification. Elevated N* values
indicate a history of net additions of N relative to
P, while low values indicate net removal of N due
to denitrification.
Over the past decade, both geochemical and direct
biological techniques have been employed to deter-
mine the distribution and rates of N2 fixation in the
North Atlantic. Based on depth integrated excess
nitrate (N*) and rates of thermocline ventilation,
annual rates of N2 fixation in the subtropical gyre
of the North Atlantic have been calculated to lie in
the range of 72 mmol N m� 2 year� 1 (GS97) to
133–230 mmol N m� 2 year� 1 (Michaels et al.,
1996). The region of the N* maximum was located
in the western Sargasso Sea, largely between 20jand 40jN in the waters of the main thermocline
(between 200 and 600 m).
These geochemical estimates of N2 fixation in the
western Sargasso Sea (Michaels et al., 1996; GS97)
are several fold higher than most direct biological
measurements of N2 fixation by dominant diazotro-
phic phytoplankton (i.e., Trichodesmium spp.) in the
overlying water. Carpenter (1983) reviewed studies
of directly determined N2 fixation in the entire
Atlantic and found relatively low rates of 0.25–
2.26 mmol N m� 2 year� 1. Capone et al. (1997),
summarizing work in the North Atlantic over the
past few decades, reported a broad range of N2
fixation rates, from 0.51 mmol N m� 2 year� 1 in
the NW Sargasso Sea to 101 mmol N m� 2 year� 1
in the NE Caribbean Sea. In the SW North Atlantic,
Carpenter et al. (1999) reported elevated nitrogen
fixation rates of 3 mmol N m� 2 day� 1 in an
extensive bloom of a colonial diatom containing an
N2-fixing cyanobacterial endosymbiont. They esti-
mated that 4�1010 mol N could be added to the
euphotic zone by the N2 fixers over the lifetime of
the bloom (10 days). More recently, Orcutt et al.
(2001) measured low mean annual rates of N2
fixation (15 mmol N m� 2 year� 1) at the Bermuda
Atlantic Time-series Study (BATS) site. They found
that the surface waters of the western Sargasso Sea
near Bermuda have relatively low densities of Tri-
chodesmium colonies and trichomes, but seasonally
elevated biomass was found during the stratified
summer months in some, but not all, years. South
of Bermuda (26jN) the fixation rate was higher at 34
mmol N m� 2 year� 1.
Except for the single very high rate reported by
Capone et al. (1997) in the NE Caribbean, the N2
fixation rates determined using direct methods are
considerably lower (0.25–34 mmol N m� 2 year� 1)
than the geochemical estimates of 72–230 mmol N
m� 2 year� 1 (Michaels et al., 1996; GS97). It appears
that, even with interannual variability, the biologically
measured fixation rates do not account for more than
20% of the minimum rate determined geochemically.
Some of the biological rates reported may be under-
estimates of the true rates due to undersampling of the
complete suite of diazotrophs present (Zehr et al.,
2001), but the extent of the underestimate is not
known.
Page 3
D.A. Hansell et al. / Marine Chemistry 84 (2004) 243–265 245
The goals of this paper are to develop an improved
understanding of the spatial distribution and produc-
tion of the excess nitrate found in the subtropical gyre
of the North Atlantic. Our approach was to quantify
geochemically the rate of excess nitrogen production
using end-member analyses and isopycnal mixing
considerations. This approach narrows the discrepancy
between geochemical and biological estimates of ni-
trogen fixation rates. The temporal variability for
excess nitrate in the Sargasso Sea is large. An analysis
of that variability can be found in Bates and Hansell
(2003).
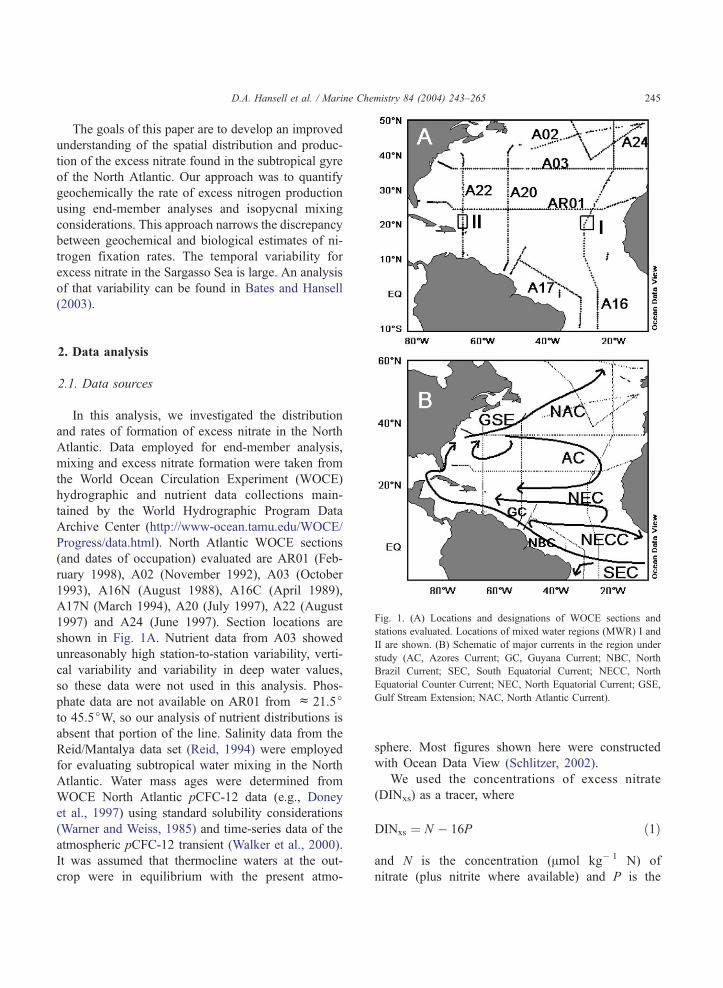
Fig. 1. (A) Locations and designations of WOCE sections and
stations evaluated. Locations of mixed water regions (MWR) I and
II are shown. (B) Schematic of major currents in the region under
study (AC, Azores Current; GC, Guyana Current; NBC, North
Brazil Current; SEC, South Equatorial Current; NECC, North
Equatorial Counter Current; NEC, North Equatorial Current; GSE,
Gulf Stream Extension; NAC, North Atlantic Current).
2. Data analysis
2.1. Data sources
In this analysis, we investigated the distribution
and rates of formation of excess nitrate in the North
Atlantic. Data employed for end-member analysis,
mixing and excess nitrate formation were taken from
the World Ocean Circulation Experiment (WOCE)
hydrographic and nutrient data collections main-
tained by the World Hydrographic Program Data
Archive Center (http://www-ocean.tamu.edu/WOCE/
Progress/data.html). North Atlantic WOCE sections
(and dates of occupation) evaluated are AR01 (Feb-
ruary 1998), A02 (November 1992), A03 (October
1993), A16N (August 1988), A16C (April 1989),
A17N (March 1994), A20 (July 1997), A22 (August
1997) and A24 (June 1997). Section locations are
shown in Fig. 1A. Nutrient data from A03 showed
unreasonably high station-to-station variability, verti-
cal variability and variability in deep water values,
so these data were not used in this analysis. Phos-
phate data are not available on AR01 from c 21.5jto 45.5jW, so our analysis of nutrient distributions is
absent that portion of the line. Salinity data from the
Reid/Mantalya data set (Reid, 1994) were employed
for evaluating subtropical water mixing in the North
Atlantic. Water mass ages were determined from
WOCE North Atlantic pCFC-12 data (e.g., Doney
et al., 1997) using standard solubility considerations
(Warner and Weiss, 1985) and time-series data of the
atmospheric pCFC-12 transient (Walker et al., 2000).
It was assumed that thermocline waters at the out-
crop were in equilibrium with the present atmo-
sphere. Most figures shown here were constructed
with Ocean Data View (Schlitzer, 2002).
We used the concentrations of excess nitrate
(DINxs) as a tracer, where
DINxs ¼ N � 16P ð1Þ
and N is the concentration (Amol kg� 1 N) of
nitrate (plus nitrite where available) and P is the
Page 4
D.A. Hansell et al. / Marine Chemistry 84 (2004) 243–265246
concentration of soluble reactive phosphate (Amol
kg� 1 P). DINxs is the excess in nitrate concentra-
tion relative to that expected from Redfield et al.
(1963) stoichiometry. The coefficient 16 is the
Redfield ratio of N/P, as confirmed by Takahashi
et al. (1985) and Anderson and Sarmiento (1994).
The coefficient was likewise employed by GS97 in
their evaluation of N* distributions. The GS97
definition of N* is:
N* ¼ ðN � 16P þ 2:90Þ � 0:87 ð2Þ
The constant 2.90 and the 0.87 multiplier were
used in the N* equation to force the global mean
N* value to be zero. More recently, the equation
has been modified with removal of the multiplier
0.87 (Deutsch et al., 2001). The relationship be-
tween N*, as modified by Deutsch et al. (2001),
and DINxs is
N* ¼ DINxs þ 2:9 ð3Þ
giving a constant offset of 2.9 Amol kg� 1 N
between the two variables. We elected to use the
variable DINxs instead of N* since we focused on a
single ocean basin and hence did not require the
constant to force the global mean N* value to be
zero (GS97). Given the constant offset, spatial
gradients of the excess nitrate, whether calculated
as N* or DINxs, would be identical.
2.2. Water mass composition determination
In this paper, the distribution of DINxs was calcu-
lated primarily for the tropical and subtropical North
Atlantic. From the distributions and water mass ages,
we estimated the rate of DINxs development, as well
as identified regions of DINxs decrease due to water
mass mixing. In order to account for binary mixing in
modifying the distribution of DINxs in the subtropical
gyre, the two end-member compositions were deter-
mined for rh surfaces 26.0, 26.5 and 27.0. These
potential density surfaces encompass the part of the
water column showing excess nitrate development in
the North Atlantic.
The formation of upper thermocline waters in the
North Atlantic subtropical gyre involve water mass
formation and subduction in the North Atlantic,
then mixing with South Atlantic water advected
across the equator as part of the global thermoha-
line circulation (Stommel, 1965; Schmitz and
Richardson, 1991). The thermocline can be ana-
lyzed using a two component potential temperature
(h)-salinity mixing calculation. The h-salinity dia-
gram from the Reid/Mantalya data set (Reid, 1994)
and the distribution of temperature on density
surfaces from the WOCE data are shown in Fig.
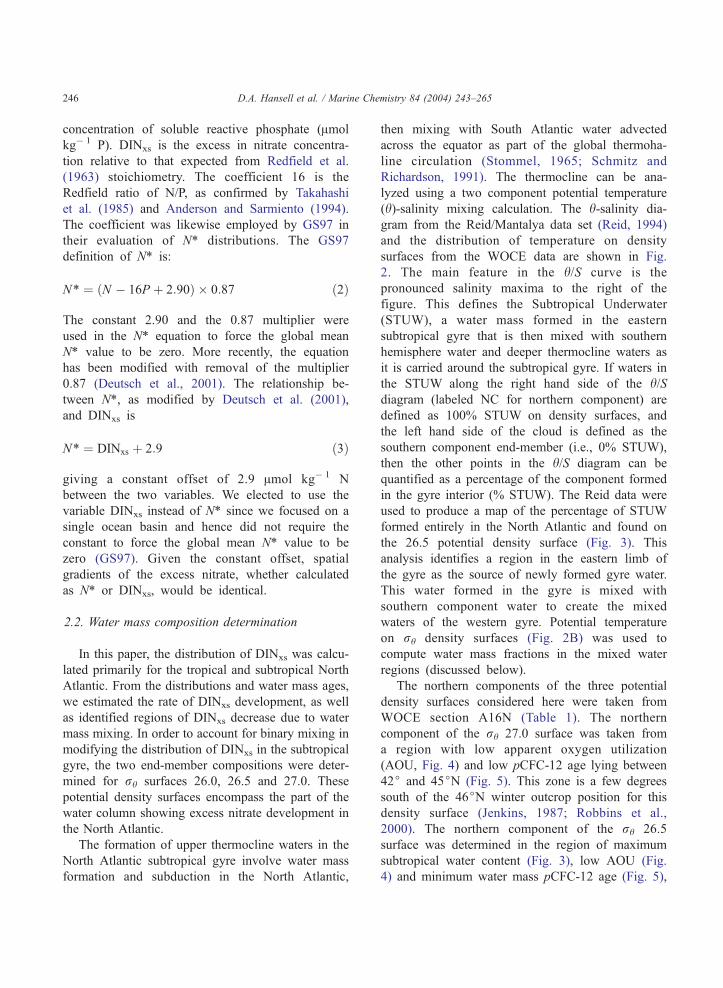
2. The main feature in the h/S curve is the
pronounced salinity maxima to the right of the
figure. This defines the Subtropical Underwater
(STUW), a water mass formed in the eastern
subtropical gyre that is then mixed with southern
hemisphere water and deeper thermocline waters as
it is carried around the subtropical gyre. If waters in
the STUW along the right hand side of the h/Sdiagram (labeled NC for northern component) are
defined as 100% STUW on density surfaces, and
the left hand side of the cloud is defined as the
southern component end-member (i.e., 0% STUW),
then the other points in the h/S diagram can be
quantified as a percentage of the component formed
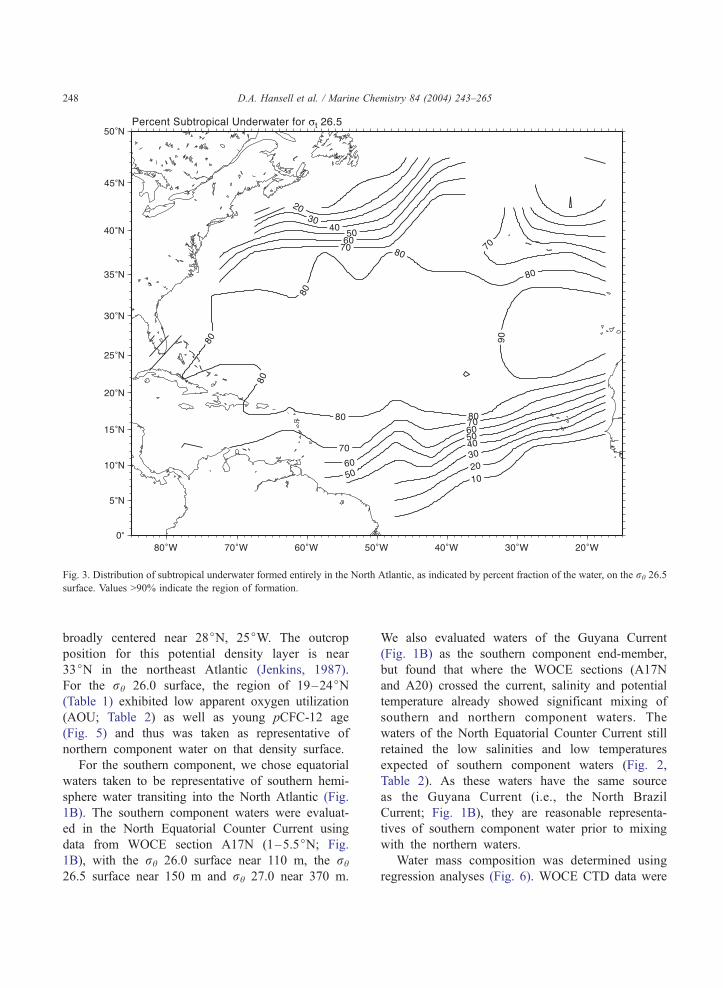
in the gyre interior (% STUW). The Reid data were
used to produce a map of the percentage of STUW
formed entirely in the North Atlantic and found on
the 26.5 potential density surface (Fig. 3). This
analysis identifies a region in the eastern limb of
the gyre as the source of newly formed gyre water.
This water formed in the gyre is mixed with
southern component water to create the mixed
waters of the western gyre. Potential temperature
on rh density surfaces (Fig. 2B) was used to
compute water mass fractions in the mixed water
regions (discussed below).
The northern components of the three potential
density surfaces considered here were taken from
WOCE section A16N (Table 1). The northern
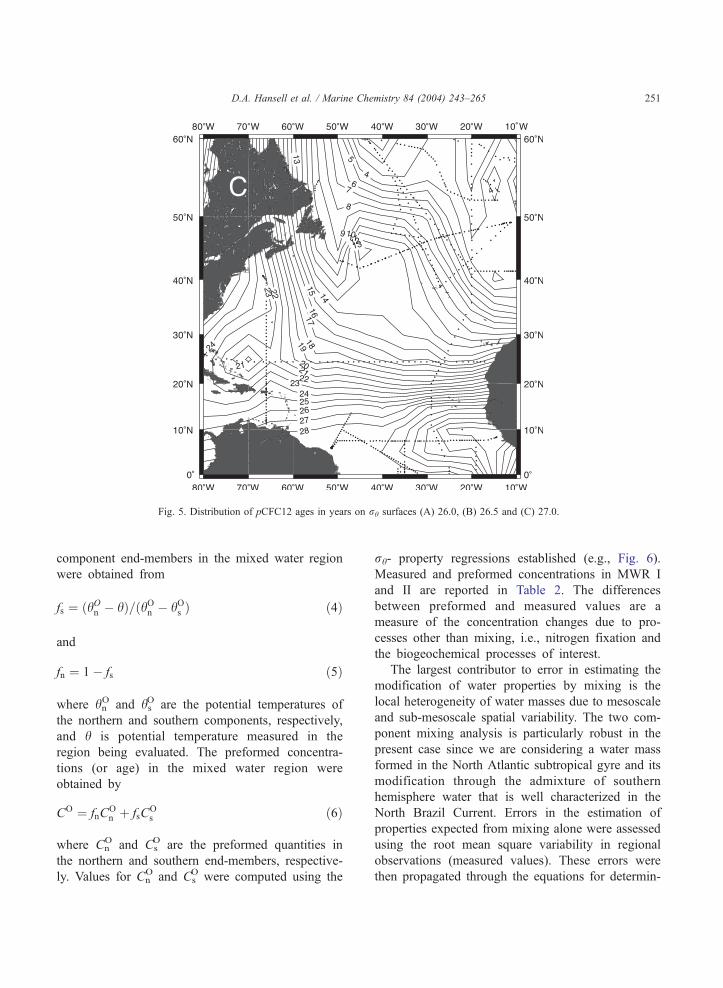
component of the rh 27.0 surface was taken from
a region with low apparent oxygen utilization
(AOU, Fig. 4) and low pCFC-12 age lying between
42j and 45jN (Fig. 5). This zone is a few degrees
south of the 46jN winter outcrop position for this
density surface (Jenkins, 1987; Robbins et al.,
2000). The northern component of the rh 26.5
surface was determined in the region of maximum
subtropical water content (Fig. 3), low AOU (Fig.
4) and minimum water mass pCFC-12 age (Fig. 5),
Page 5
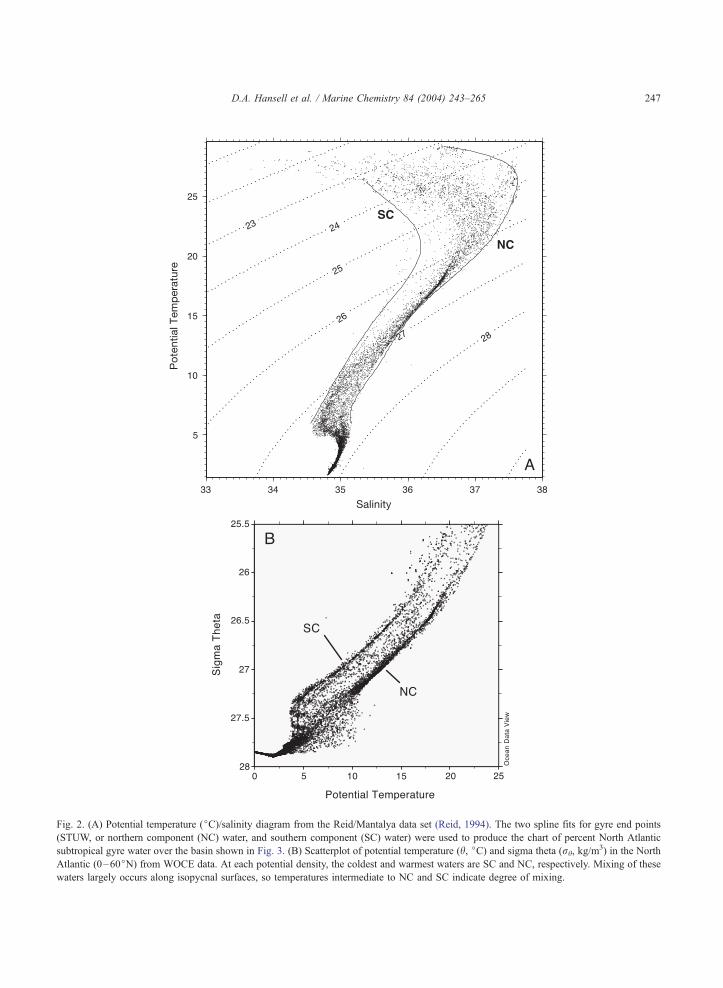
Fig. 2. (A) Potential temperature (jC)/salinity diagram from the Reid/Mantalya data set (Reid, 1994). The two spline fits for gyre end points
(STUW, or northern component (NC) water, and southern component (SC) water) were used to produce the chart of percent North Atlantic
subtropical gyre water over the basin shown in Fig. 3. (B) Scatterplot of potential temperature (h, jC) and sigma theta (rh, kg/m3) in the North
Atlantic (0–60jN) from WOCE data. At each potential density, the coldest and warmest waters are SC and NC, respectively. Mixing of these
waters largely occurs along isopycnal surfaces, so temperatures intermediate to NC and SC indicate degree of mixing.
D.A. Hansell et al. / Marine Chemistry 84 (2004) 243–265 247
Page 6
Fig. 3. Distribution of subtropical underwater formed entirely in the North Atlantic, as indicated by percent fraction of the water, on the rh 26.5
surface. Values >90% indicate the region of formation.
D.A. Hansell et al. / Marine Chemistry 84 (2004) 243–265248
broadly centered near 28jN, 25jW. The outcrop
position for this potential density layer is near
33jN in the northeast Atlantic (Jenkins, 1987).
For the rh 26.0 surface, the region of 19–24jN(Table 1) exhibited low apparent oxygen utilization
(AOU; Table 2) as well as young pCFC-12 age
(Fig. 5) and thus was taken as representative of
northern component water on that density surface.
For the southern component, we chose equatorial
waters taken to be representative of southern hemi-
sphere water transiting into the North Atlantic (Fig.
1B). The southern component waters were evaluat-
ed in the North Equatorial Counter Current using
data from WOCE section A17N (1–5.5jN; Fig.
1B), with the rh 26.0 surface near 110 m, the rh
26.5 surface near 150 m and rh 27.0 near 370 m.
We also evaluated waters of the Guyana Current
(Fig. 1B) as the southern component end-member,
but found that where the WOCE sections (A17N
and A20) crossed the current, salinity and potential
temperature already showed significant mixing of
southern and northern component waters. The
waters of the North Equatorial Counter Current still
retained the low salinities and low temperatures
expected of southern component waters (Fig. 2,
Table 2). As these waters have the same source
as the Guyana Current (i.e., the North Brazil
Current; Fig. 1B), they are reasonable representa-
tives of southern component water prior to mixing
with the northern waters.
Water mass composition was determined using
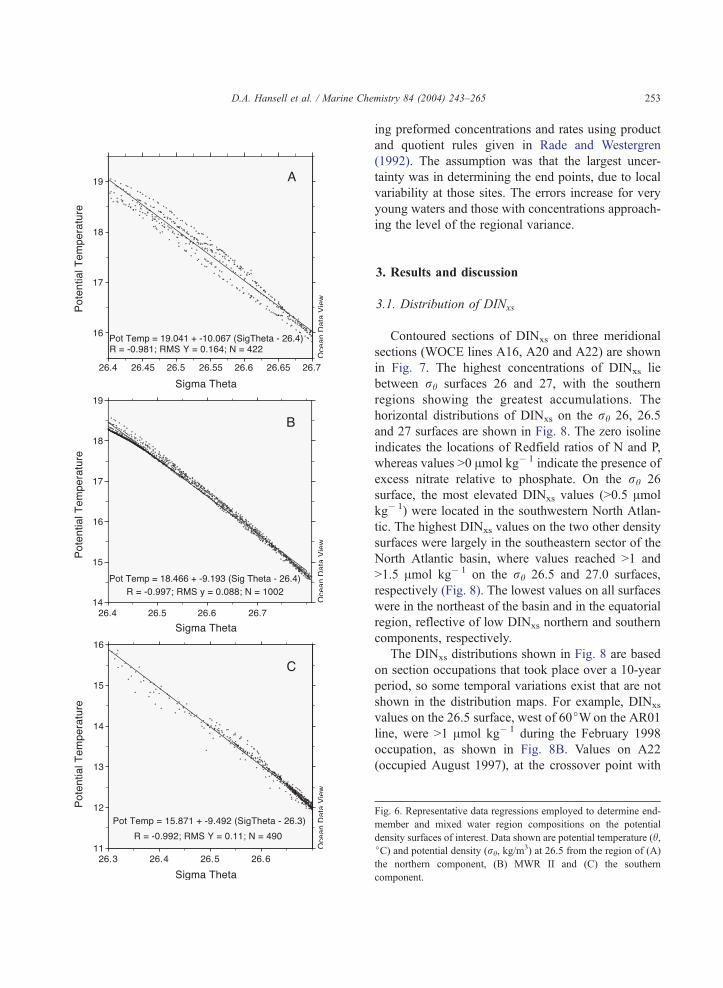
regression analyses (Fig. 6). WOCE CTD data were
Page 7
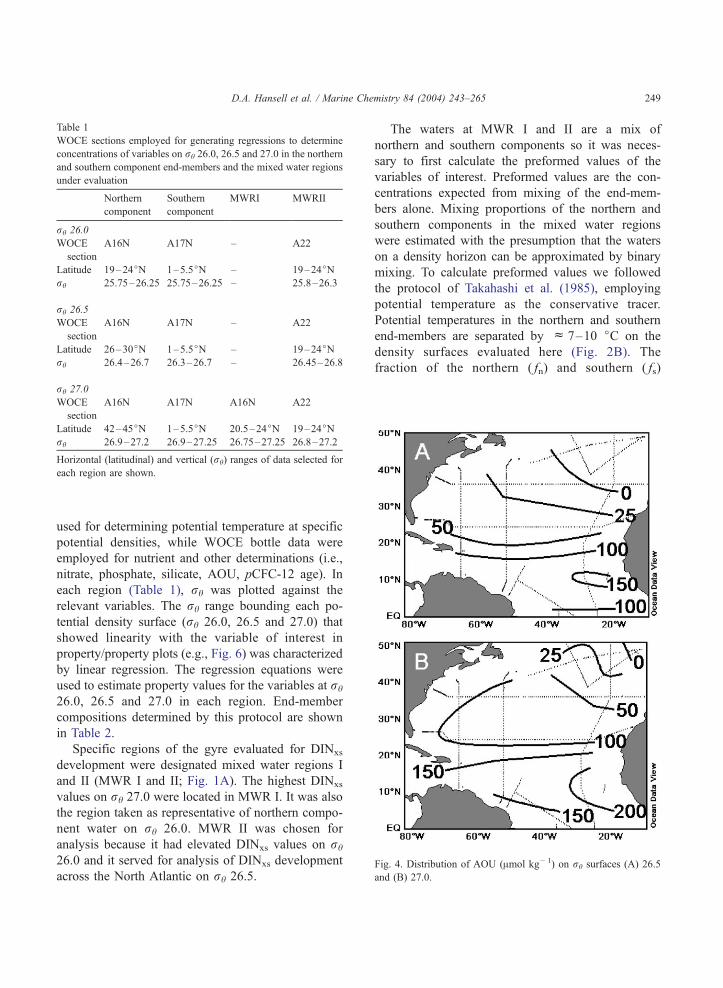
Fig. 4. Distribution of AOU (Amol kg� 1) on rh surfaces (A) 26.5
and (B) 27.0.
Table 1
WOCE sections employed for generating regressions to determine
concentrations of variables on rh 26.0, 26.5 and 27.0 in the northern
and southern component end-members and the mixed water regions
under evaluation
Northern
component
Southern
component
MWRI MWRII
rh 26.0
WOCE
section
A16N A17N – A22
Latitude 19–24jN 1–5.5jN – 19–24jNrh 25.75–26.25 25.75–26.25 – 25.8–26.3
rh 26.5
WOCE
section
A16N A17N – A22
Latitude 26–30jN 1–5.5jN – 19–24jNrh 26.4–26.7 26.3–26.7 – 26.45–26.8
rh 27.0
WOCE
section
A16N A17N A16N A22
Latitude 42–45jN 1–5.5jN 20.5–24jN 19–24jNrh 26.9–27.2 26.9–27.25 26.75–27.25 26.8–27.2
Horizontal (latitudinal) and vertical (rh) ranges of data selected for
each region are shown.
D.A. Hansell et al. / Marine Chemistry 84 (2004) 243–265 249
used for determining potential temperature at specific
potential densities, while WOCE bottle data were
employed for nutrient and other determinations (i.e.,
nitrate, phosphate, silicate, AOU, pCFC-12 age). In
each region (Table 1), rh was plotted against the
relevant variables. The rh range bounding each po-
tential density surface (rh 26.0, 26.5 and 27.0) that
showed linearity with the variable of interest in
property/property plots (e.g., Fig. 6) was characterized
by linear regression. The regression equations were
used to estimate property values for the variables at rh
26.0, 26.5 and 27.0 in each region. End-member
compositions determined by this protocol are shown
in Table 2.
Specific regions of the gyre evaluated for DINxs
development were designated mixed water regions I
and II (MWR I and II; Fig. 1A). The highest DINxs
values on rh 27.0 were located in MWR I. It was also
the region taken as representative of northern compo-
nent water on rh 26.0. MWR II was chosen for
analysis because it had elevated DINxs values on rh
26.0 and it served for analysis of DINxs development
across the North Atlantic on rh 26.5.
The waters at MWR I and II are a mix of
northern and southern components so it was neces-
sary to first calculate the preformed values of the
variables of interest. Preformed values are the con-
centrations expected from mixing of the end-mem-
bers alone. Mixing proportions of the northern and
southern components in the mixed water regions
were estimated with the presumption that the waters
on a density horizon can be approximated by binary
mixing. To calculate preformed values we followed
the protocol of Takahashi et al. (1985), employing
potential temperature as the conservative tracer.
Potential temperatures in the northern and southern
end-members are separated by c 7–10 jC on the
density surfaces evaluated here (Fig. 2B). The
fraction of the northern ( fn) and southern ( fs)
Page 8
D.A. Hansell et al. / Marine Chemistry 84 (2004) 243–265250
Page 9
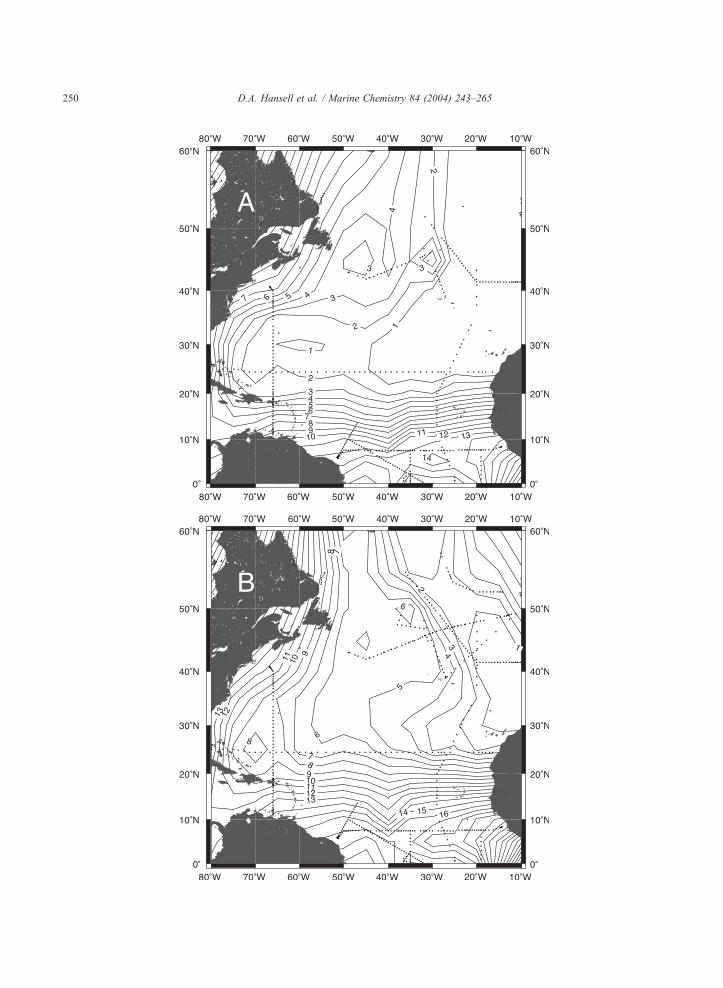
Fig. 5. Distribution of pCFC12 ages in years on rh surfaces (A) 26.0, (B) 26.5 and (C) 27.0.
D.A. Hansell et al. / Marine Chemistry 84 (2004) 243–265 251
component end-members in the mixed water region
were obtained from
fs ¼ ðhOn � hÞ=ðhOn � hOs Þ ð4Þ
and
fn ¼ 1� fs ð5Þ
where hnO and hs
O are the potential temperatures of
the northern and southern components, respectively,
and h is potential temperature measured in the
region being evaluated. The preformed concentra-
tions (or age) in the mixed water region were
obtained by
CO ¼ fnCOn þ fsC
Os ð6Þ
where CnO and Cs
O are the preformed quantities in
the northern and southern end-members, respective-
ly. Values for CnO and Cs
O were computed using the
rh- property regressions established (e.g., Fig. 6).
Measured and preformed concentrations in MWR I
and II are reported in Table 2. The differences
between preformed and measured values are a
measure of the concentration changes due to pro-
cesses other than mixing, i.e., nitrogen fixation and
the biogeochemical processes of interest.
The largest contributor to error in estimating the
modification of water properties by mixing is the
local heterogeneity of water masses due to mesoscale
and sub-mesoscale spatial variability. The two com-
ponent mixing analysis is particularly robust in the
present case since we are considering a water mass
formed in the North Atlantic subtropical gyre and its
modification through the admixture of southern
hemisphere water that is well characterized in the
North Brazil Current. Errors in the estimation of
properties expected from mixing alone were assessed
using the root mean square variability in regional
observations (measured values). These errors were
then propagated through the equations for determin-
Page 10
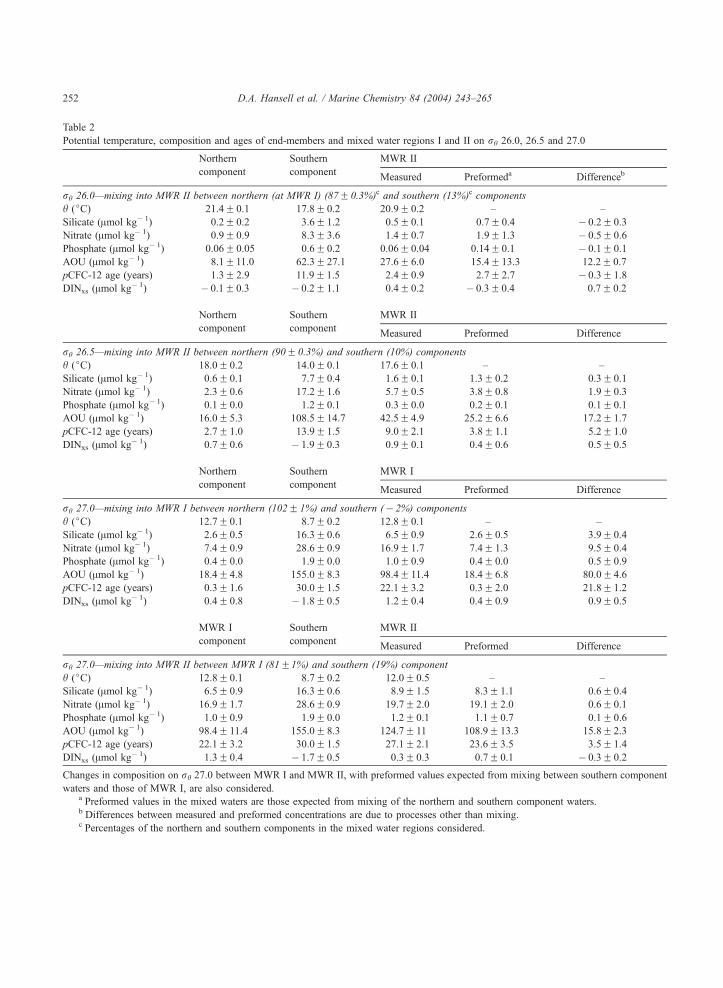
Table 2
Potential temperature, composition and ages of end-members and mixed water regions I and II on rh 26.0, 26.5 and 27.0
Northern Southern MWR II
component componentMeasured Preformeda Differenceb
rh 26.0—mixing into MWR II between northern (at MWR I) (87F 0.3%)c and southern (13%)c components
h (jC) 21.4F 0.1 17.8F 0.2 20.9F 0.2 – –
Silicate (Amol kg� 1) 0.2F 0.2 3.6F 1.2 0.5F 0.1 0.7F 0.4 � 0.2F 0.3
Nitrate (Amol kg� 1) 0.9F 0.9 8.3F 3.6 1.4F 0.7 1.9F 1.3 � 0.5F 0.6
Phosphate (Amol kg� 1) 0.06F 0.05 0.6F 0.2 0.06F 0.04 0.14F 0.1 � 0.1F 0.1
AOU (Amol kg� 1) 8.1F11.0 62.3F 27.1 27.6F 6.0 15.4F 13.3 12.2F 0.7
pCFC-12 age (years) 1.3F 2.9 11.9F 1.5 2.4F 0.9 2.7F 2.7 � 0.3F 1.8
DINxs (Amol kg� 1) � 0.1F 0.3 � 0.2F 1.1 0.4F 0.2 � 0.3F 0.4 0.7F 0.2
Northern Southern MWR II
component componentMeasured Preformed Difference
rh 26.5—mixing into MWR II between northern (90F 0.3%) and southern (10%) components
h (jC) 18.0F 0.2 14.0F 0.1 17.6F 0.1 – –
Silicate (Amol kg� 1) 0.6F 0.1 7.7F 0.4 1.6F 0.1 1.3F 0.2 0.3F 0.1
Nitrate (Amol kg� 1) 2.3F 0.6 17.2F 1.6 5.7F 0.5 3.8F 0.8 1.9F 0.3
Phosphate (Amol kg� 1) 0.1F 0.0 1.2F 0.1 0.3F 0.0 0.2F 0.1 0.1F 0.1
AOU (Amol kg� 1) 16.0F 5.3 108.5F 14.7 42.5F 4.9 25.2F 6.6 17.2F 1.7
pCFC-12 age (years) 2.7F 1.0 13.9F 1.5 9.0F 2.1 3.8F 1.1 5.2F 1.0
DINxs (Amol kg� 1) 0.7F 0.6 � 1.9F 0.3 0.9F 0.1 0.4F 0.6 0.5F 0.5
Northern Southern MWR I
component componentMeasured Preformed Difference
rh 27.0—mixing into MWR I between northern (102F 1%) and southern (� 2%) components
h (jC) 12.7F 0.1 8.7F 0.2 12.8F 0.1 – –
Silicate (Amol kg� 1) 2.6F 0.5 16.3F 0.6 6.5F 0.9 2.6F 0.5 3.9F 0.4
Nitrate (Amol kg� 1) 7.4F 0.9 28.6F 0.9 16.9F 1.7 7.4F 1.3 9.5F 0.4
Phosphate (Amol kg� 1) 0.4F 0.0 1.9F 0.0 1.0F 0.9 0.4F 0.0 0.5F 0.9
AOU (Amol kg� 1) 18.4F 4.8 155.0F 8.3 98.4F 11.4 18.4F 6.8 80.0F 4.6
pCFC-12 age (years) 0.3F 1.6 30.0F 1.5 22.1F 3.2 0.3F 2.0 21.8F 1.2
DINxs (Amol kg� 1) 0.4F 0.8 � 1.8F 0.5 1.2F 0.4 0.4F 0.9 0.9F 0.5
MWR I Southern MWR II
component componentMeasured Preformed Difference
rh 27.0—mixing into MWR II between MWR I (81F1%) and southern (19%) component
h (jC) 12.8F 0.1 8.7F 0.2 12.0F 0.5 – –
Silicate (Amol kg� 1) 6.5F 0.9 16.3F 0.6 8.9F 1.5 8.3F 1.1 0.6F 0.4
Nitrate (Amol kg� 1) 16.9F 1.7 28.6F 0.9 19.7F 2.0 19.1F 2.0 0.6F 0.1
Phosphate (Amol kg� 1) 1.0F 0.9 1.9F 0.0 1.2F 0.1 1.1F 0.7 0.1F 0.6
AOU (Amol kg� 1) 98.4F 11.4 155.0F 8.3 124.7F 11 108.9F 13.3 15.8F 2.3
pCFC-12 age (years) 22.1F 3.2 30.0F 1.5 27.1F 2.1 23.6F 3.5 3.5F 1.4
DINxs (Amol kg� 1) 1.3F 0.4 � 1.7F 0.5 0.3F 0.3 0.7F 0.1 � 0.3F 0.2
Changes in composition on rh 27.0 between MWR I and MWR II, with preformed values expected from mixing between southern component
waters and those of MWR I, are also considered.a Preformed values in the mixed waters are those expected from mixing of the northern and southern component waters.b Differences between measured and preformed concentrations are due to processes other than mixing.c Percentages of the northern and southern components in the mixed water regions considered.
D.A. Hansell et al. / Marine Chemistry 84 (2004) 243–265252
Page 11
D.A. Hansell et al. / Marine Chemistry 84 (2004) 243–265 253
ing preformed concentrations and rates using product
and quotient rules given in Rade and Westergren
(1992). The assumption was that the largest uncer-
tainty was in determining the end points, due to local
variability at those sites. The errors increase for very
young waters and those with concentrations approach-
ing the level of the regional variance.
3. Results and discussion
3.1. Distribution of DINxs
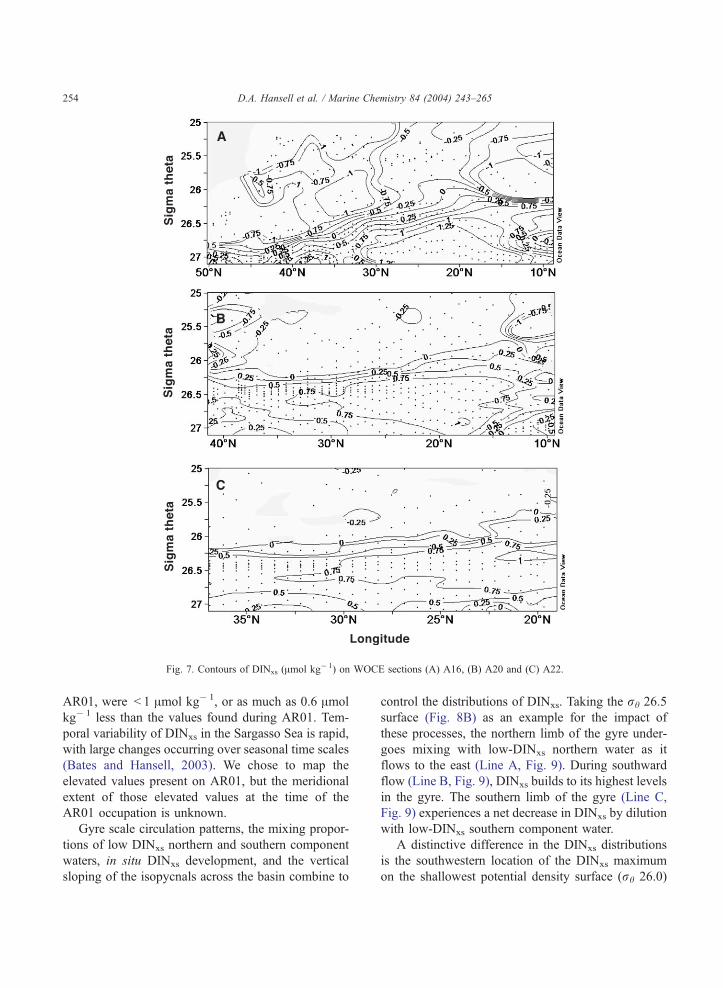
Contoured sections of DINxs on three meridional
sections (WOCE lines A16, A20 and A22) are shown
in Fig. 7. The highest concentrations of DINxs lie
between rh surfaces 26 and 27, with the southern
regions showing the greatest accumulations. The
horizontal distributions of DINxs on the rh 26, 26.5
and 27 surfaces are shown in Fig. 8. The zero isoline
indicates the locations of Redfield ratios of N and P,
whereas values >0 Amol kg� 1 indicate the presence of
excess nitrate relative to phosphate. On the rh 26
surface, the most elevated DINxs values (>0.5 Amol
kg� 1) were located in the southwestern North Atlan-
tic. The highest DINxs values on the two other density
surfaces were largely in the southeastern sector of the
North Atlantic basin, where values reached >1 and
>1.5 Amol kg� 1 on the rh 26.5 and 27.0 surfaces,
respectively (Fig. 8). The lowest values on all surfaces
were in the northeast of the basin and in the equatorial
region, reflective of low DINxs northern and southern
components, respectively.
The DINxs distributions shown in Fig. 8 are based
on section occupations that took place over a 10-year
period, so some temporal variations exist that are not
shown in the distribution maps. For example, DINxs
values on the 26.5 surface, west of 60jWon the AR01
line, were >1 Amol kg� 1 during the February 1998
occupation, as shown in Fig. 8B. Values on A22
(occupied August 1997), at the crossover point with
Fig. 6. Representative data regressions employed to determine end-
member and mixed water region compositions on the potential
density surfaces of interest. Data shown are potential temperature (h,jC) and potential density (rh, kg/m
3) at 26.5 from the region of (A)
the northern component, (B) MWR II and (C) the southern
component.
Page 12
Fig. 7. Contours of DINxs (Amol kg� 1) on WOCE sections (A) A16, (B) A20 and (C) A22.
D.A. Hansell et al. / Marine Chemistry 84 (2004) 243–265254
AR01, were < 1 Amol kg� 1, or as much as 0.6 Amol
kg� 1 less than the values found during AR01. Tem-
poral variability of DINxs in the Sargasso Sea is rapid,
with large changes occurring over seasonal time scales
(Bates and Hansell, 2003). We chose to map the
elevated values present on AR01, but the meridional
extent of those elevated values at the time of the
AR01 occupation is unknown.
Gyre scale circulation patterns, the mixing propor-
tions of low DINxs northern and southern component
waters, in situ DINxs development, and the vertical
sloping of the isopycnals across the basin combine to
control the distributions of DINxs. Taking the rh 26.5
surface (Fig. 8B) as an example for the impact of
these processes, the northern limb of the gyre under-
goes mixing with low-DINxs northern water as it
flows to the east (Line A, Fig. 9). During southward
flow (Line B, Fig. 9), DINxs builds to its highest levels
in the gyre. The southern limb of the gyre (Line C,
Fig. 9) experiences a net decrease in DINxs by dilution
with low-DINxs southern component water.
A distinctive difference in the DINxs distributions
is the southwestern location of the DINxs maximum
on the shallowest potential density surface (rh 26.0)
Page 13
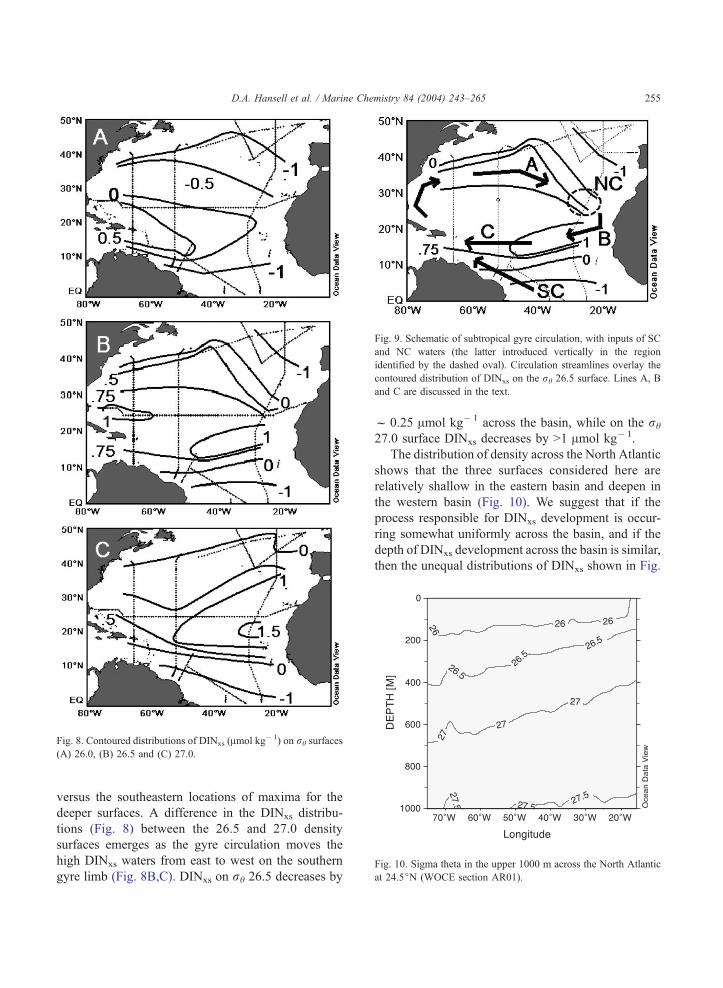
Fig. 8. Contoured distributions of DINxs (Amol kg� 1) on rh surfaces
(A) 26.0, (B) 26.5 and (C) 27.0.
Fig. 9. Schematic of subtropical gyre circulation, with inputs of SC
and NC waters (the latter introduced vertically in the region
identified by the dashed oval). Circulation streamlines overlay the
contoured distribution of DINxs on the rh 26.5 surface. Lines A, B
and C are discussed in the text.
Fig. 10. Sigma theta in the upper 1000 m across the North Atlantic
at 24.5jN (WOCE section AR01).
D.A. Hansell et al. / Marine Chemistry 84 (2004) 243–265 255
versus the southeastern locations of maxima for the
deeper surfaces. A difference in the DINxs distribu-
tions (Fig. 8) between the 26.5 and 27.0 density
surfaces emerges as the gyre circulation moves the
high DINxs waters from east to west on the southern
gyre limb (Fig. 8B,C). DINxs on rh 26.5 decreases by
f 0.25 Amol kg� 1 across the basin, while on the rh
27.0 surface DINxs decreases by >1 Amol kg� 1.
The distribution of density across the North Atlantic
shows that the three surfaces considered here are
relatively shallow in the eastern basin and deepen in
the western basin (Fig. 10). We suggest that if the
process responsible for DINxs development is occur-
ring somewhat uniformly across the basin, and if the
depth of DINxs development across the basin is similar,
then the unequal distributions of DINxs shown in Fig.
Page 14
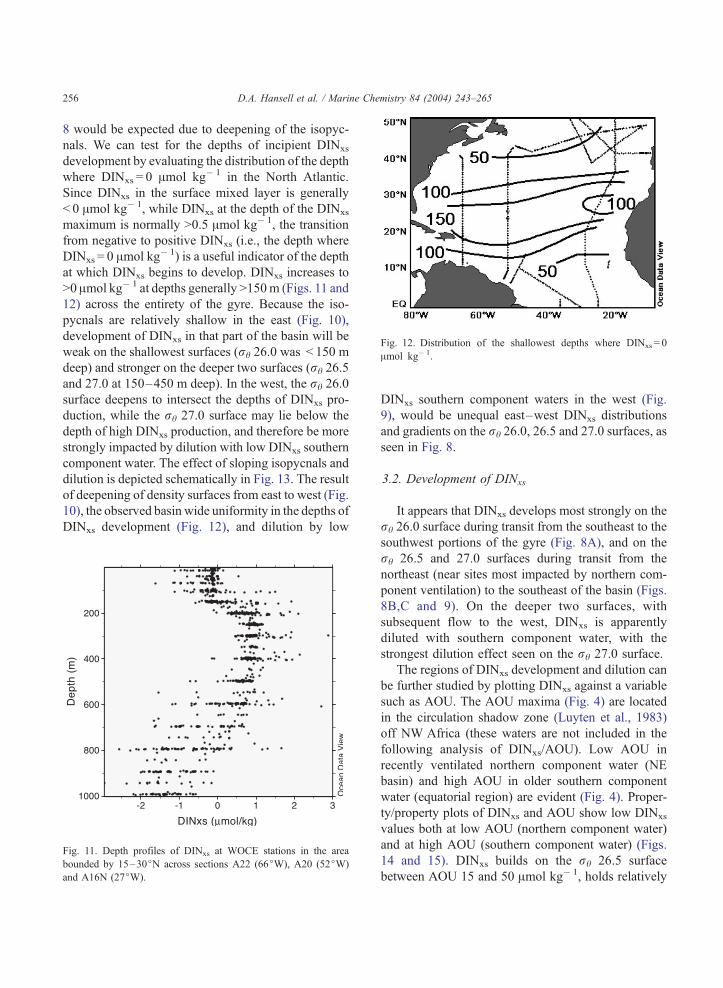
Fig. 12. Distribution of the shallowest depths where DINxs = 0
Amol kg� 1.
D.A. Hansell et al. / Marine Chemistry 84 (2004) 243–265256
8 would be expected due to deepening of the isopyc-
nals. We can test for the depths of incipient DINxs
development by evaluating the distribution of the depth
where DINxs = 0 Amol kg� 1 in the North Atlantic.
Since DINxs in the surface mixed layer is generally
< 0 Amol kg� 1, while DINxs at the depth of the DINxs
maximum is normally >0.5 Amol kg� 1, the transition
from negative to positive DINxs (i.e., the depth where
DINxs = 0 Amol kg� 1) is a useful indicator of the depth
at which DINxs begins to develop. DINxs increases to
>0 Amol kg� 1 at depths generally >150m (Figs. 11 and
12) across the entirety of the gyre. Because the iso-
pycnals are relatively shallow in the east (Fig. 10),
development of DINxs in that part of the basin will be
weak on the shallowest surfaces (rh 26.0 was < 150 m
deep) and stronger on the deeper two surfaces (rh 26.5
and 27.0 at 150–450 m deep). In the west, the rh 26.0
surface deepens to intersect the depths of DINxs pro-
duction, while the rh 27.0 surface may lie below the
depth of high DINxs production, and therefore be more
strongly impacted by dilution with low DINxs southern
component water. The effect of sloping isopycnals and
dilution is depicted schematically in Fig. 13. The result
of deepening of density surfaces from east to west (Fig.
10), the observed basin wide uniformity in the depths of
DINxs development (Fig. 12), and dilution by low
Fig. 11. Depth profiles of DINxs at WOCE stations in the area
bounded by 15–30jN across sections A22 (66jW), A20 (52jW)
and A16N (27jW).
DINxs southern component waters in the west (Fig.
9), would be unequal east–west DINxs distributions
and gradients on the rh 26.0, 26.5 and 27.0 surfaces, as
seen in Fig. 8.
3.2. Development of DINxs
It appears that DINxs develops most strongly on the
rh 26.0 surface during transit from the southeast to the
southwest portions of the gyre (Fig. 8A), and on the
rh 26.5 and 27.0 surfaces during transit from the
northeast (near sites most impacted by northern com-
ponent ventilation) to the southeast of the basin (Figs.
8B,C and 9). On the deeper two surfaces, with
subsequent flow to the west, DINxs is apparently
diluted with southern component water, with the
strongest dilution effect seen on the rh 27.0 surface.
The regions of DINxs development and dilution can
be further studied by plotting DINxs against a variable
such as AOU. The AOU maxima (Fig. 4) are located
in the circulation shadow zone (Luyten et al., 1983)
off NW Africa (these waters are not included in the
following analysis of DINxs/AOU). Low AOU in
recently ventilated northern component water (NE
basin) and high AOU in older southern component
water (equatorial region) are evident (Fig. 4). Proper-
ty/property plots of DINxs and AOU show low DINxs
values both at low AOU (northern component water)
and at high AOU (southern component water) (Figs.
14 and 15). DINxs builds on the rh 26.5 surface
between AOU 15 and 50 Amol kg� 1, holds relatively
Page 15
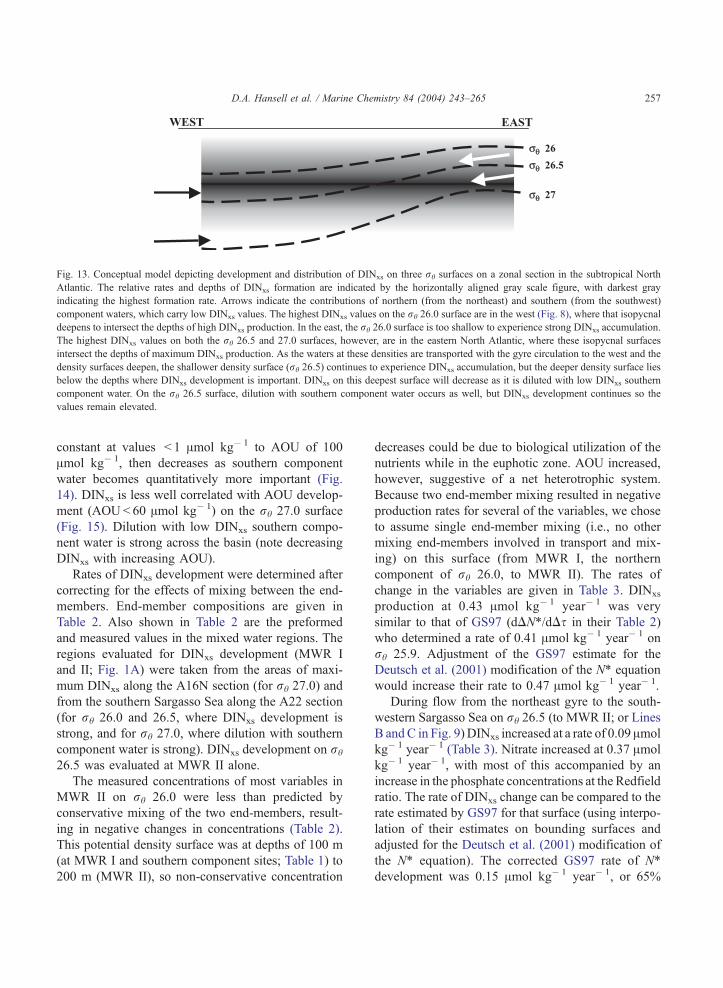
Fig. 13. Conceptual model depicting development and distribution of DINxs on three rh surfaces on a zonal section in the subtropical North
Atlantic. The relative rates and depths of DINxs formation are indicated by the horizontally aligned gray scale figure, with darkest gray
indicating the highest formation rate. Arrows indicate the contributions of northern (from the northeast) and southern (from the southwest)
component waters, which carry low DINxs values. The highest DINxs values on the rh 26.0 surface are in the west (Fig. 8), where that isopycnal
deepens to intersect the depths of high DINxs production. In the east, the rh 26.0 surface is too shallow to experience strong DINxs accumulation.
The highest DINxs values on both the rh 26.5 and 27.0 surfaces, however, are in the eastern North Atlantic, where these isopycnal surfaces
intersect the depths of maximum DINxs production. As the waters at these densities are transported with the gyre circulation to the west and the
density surfaces deepen, the shallower density surface (rh 26.5) continues to experience DINxs accumulation, but the deeper density surface lies
below the depths where DINxs development is important. DINxs on this deepest surface will decrease as it is diluted with low DINxs southern
component water. On the rh 26.5 surface, dilution with southern component water occurs as well, but DINxs development continues so the
values remain elevated.
D.A. Hansell et al. / Marine Chemistry 84 (2004) 243–265 257
constant at values < 1 Amol kg� 1 to AOU of 100
Amol kg� 1, then decreases as southern component
water becomes quantitatively more important (Fig.
14). DINxs is less well correlated with AOU develop-
ment (AOU< 60 Amol kg� 1) on the rh 27.0 surface
(Fig. 15). Dilution with low DINxs southern compo-
nent water is strong across the basin (note decreasing
DINxs with increasing AOU).
Rates of DINxs development were determined after
correcting for the effects of mixing between the end-
members. End-member compositions are given in
Table 2. Also shown in Table 2 are the preformed
and measured values in the mixed water regions. The
regions evaluated for DINxs development (MWR I
and II; Fig. 1A) were taken from the areas of maxi-
mum DINxs along the A16N section (for rh 27.0) and
from the southern Sargasso Sea along the A22 section
(for rh 26.0 and 26.5, where DINxs development is
strong, and for rh 27.0, where dilution with southern
component water is strong). DINxs development on rh
26.5 was evaluated at MWR II alone.
The measured concentrations of most variables in
MWR II on rh 26.0 were less than predicted by
conservative mixing of the two end-members, result-
ing in negative changes in concentrations (Table 2).
This potential density surface was at depths of 100 m
(at MWR I and southern component sites; Table 1) to
200 m (MWR II), so non-conservative concentration
decreases could be due to biological utilization of the
nutrients while in the euphotic zone. AOU increased,
however, suggestive of a net heterotrophic system.
Because two end-member mixing resulted in negative
production rates for several of the variables, we chose
to assume single end-member mixing (i.e., no other
mixing end-members involved in transport and mix-
ing) on this surface (from MWR I, the northern
component of rh 26.0, to MWR II). The rates of
change in the variables are given in Table 3. DINxs
production at 0.43 Amol kg� 1 year� 1 was very
similar to that of GS97 (dDN*/dDs in their Table 2)
who determined a rate of 0.41 Amol kg� 1 year� 1 on
rh 25.9. Adjustment of the GS97 estimate for the
Deutsch et al. (2001) modification of the N* equation
would increase their rate to 0.47 Amol kg� 1 year� 1.
During flow from the northeast gyre to the south-
western Sargasso Sea on rh 26.5 (to MWR II; or Lines
B andC in Fig. 9) DINxs increased at a rate of 0.09 Amol
kg� 1 year� 1 (Table 3). Nitrate increased at 0.37 Amol
kg� 1 year� 1, with most of this accompanied by an
increase in the phosphate concentrations at the Redfield
ratio. The rate of DINxs change can be compared to the
rate estimated by GS97 for that surface (using interpo-
lation of their estimates on bounding surfaces and
adjusted for the Deutsch et al. (2001) modification of
the N* equation). The corrected GS97 rate of N*
development was 0.15 Amol kg� 1 year� 1, or 65%
Page 16
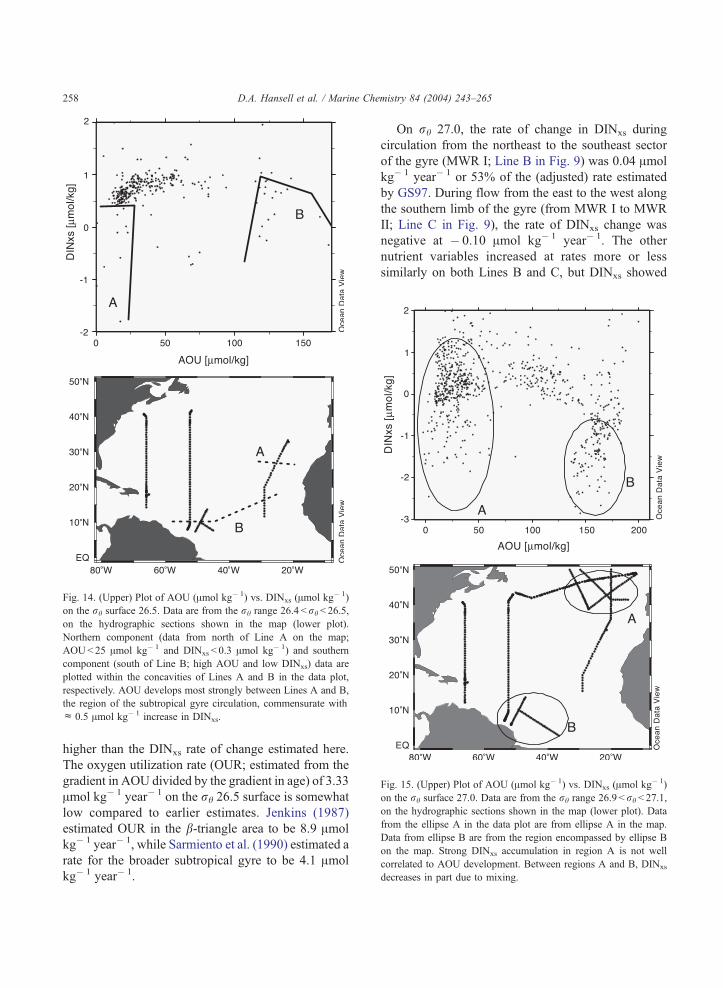
Fig. 14. (Upper) Plot of AOU (Amol kg� 1) vs. DINxs (Amol kg� 1)
on the rh surface 26.5. Data are from the rh range 26.4 <rh< 26.5,
on the hydrographic sections shown in the map (lower plot).
Northern component (data from north of Line A on the map;
AOU< 25 Amol kg� 1 and DINxs < 0.3 Amol kg� 1) and southern
component (south of Line B; high AOU and low DINxs) data are
plotted within the concavities of Lines A and B in the data plot,
respectively. AOU develops most strongly between Lines A and B,
the region of the subtropical gyre circulation, commensurate with
c 0.5 Amol kg� 1 increase in DINxs.
Fig. 15. (Upper) Plot of AOU (Amol kg� 1) vs. DINxs (Amol kg� 1)
on the rh surface 27.0. Data are from the rh range 26.9 < rh < 27.1,
on the hydrographic sections shown in the map (lower plot). Data
from the ellipse A in the data plot are from ellipse A in the map.
Data from ellipse B are from the region encompassed by ellipse B
on the map. Strong DINxs accumulation in region A is not well
correlated to AOU development. Between regions A and B, DINxs
decreases in part due to mixing.
D.A. Hansell et al. / Marine Chemistry 84 (2004) 243–265258
higher than the DINxs rate of change estimated here.
The oxygen utilization rate (OUR; estimated from the
gradient in AOU divided by the gradient in age) of 3.33
Amol kg� 1 year� 1 on the rh 26.5 surface is somewhat
low compared to earlier estimates. Jenkins (1987)
estimated OUR in the b-triangle area to be 8.9 Amol
kg� 1 year� 1, while Sarmiento et al. (1990) estimated a
rate for the broader subtropical gyre to be 4.1 Amol
kg� 1 year� 1.
On rh 27.0, the rate of change in DINxs during
circulation from the northeast to the southeast sector
of the gyre (MWR I; Line B in Fig. 9) was 0.04 Amol
kg� 1 year� 1 or 53% of the (adjusted) rate estimated
by GS97. During flow from the east to the west along
the southern limb of the gyre (from MWR I to MWR
II; Line C in Fig. 9), the rate of DINxs change was
negative at � 0.10 Amol kg� 1 year� 1. The other
nutrient variables increased at rates more or less
similarly on both Lines B and C, but DINxs showed
Page 17
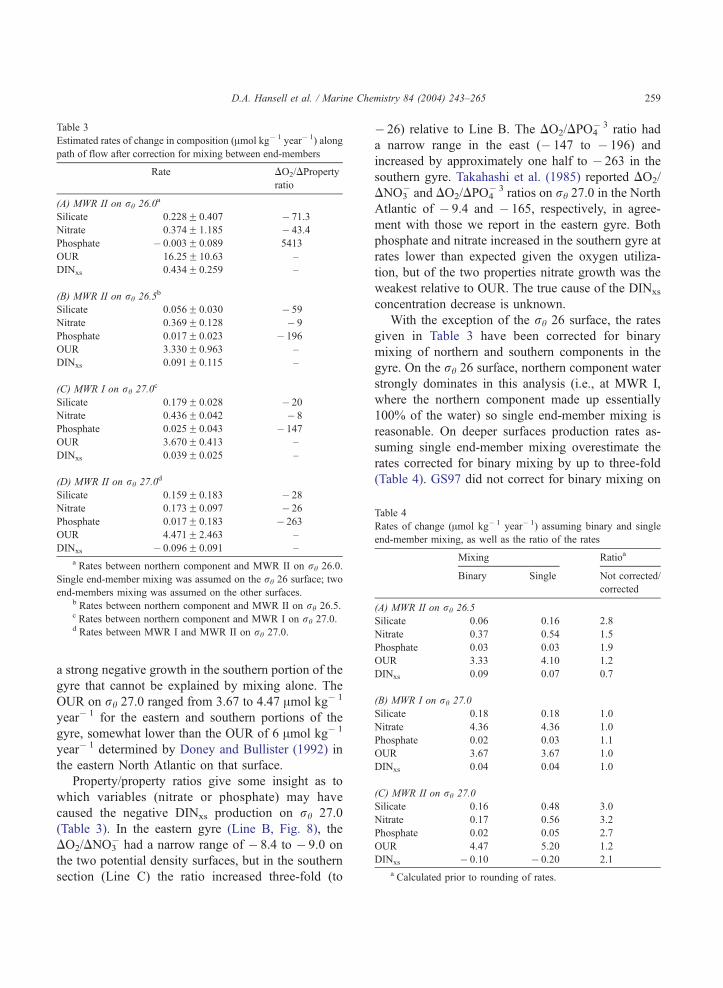
Table 3
Estimated rates of change in composition (Amol kg� 1 year� 1) along
path of flow after correction for mixing between end-members
Rate DO2/DProperty
ratio
(A) MWR II on rh 26.0a
Silicate 0.228F 0.407 � 71.3
Nitrate 0.374F 1.185 � 43.4
Phosphate � 0.003F 0.089 5413
OUR 16.25F 10.63 –
DINxs 0.434F 0.259 –
(B) MWR II on rh 26.5b
Silicate 0.056F 0.030 � 59
Nitrate 0.369F 0.128 � 9
Phosphate 0.017F 0.023 � 196
OUR 3.330F 0.963 –
DINxs 0.091F 0.115 –
(C) MWR I on rh 27.0c
Silicate 0.179F 0.028 � 20
Nitrate 0.436F 0.042 � 8
Phosphate 0.025F 0.043 � 147
OUR 3.670F 0.413 –
DINxs 0.039F 0.025 –
(D) MWR II on rh 27.0d
Silicate 0.159F 0.183 � 28
Nitrate 0.173F 0.097 � 26
Phosphate 0.017F 0.183 � 263
OUR 4.471F 2.463 –
DINxs � 0.096F 0.091 –
a Rates between northern component and MWR II on rh 26.0.
Single end-member mixing was assumed on the rh 26 surface; two
end-members mixing was assumed on the other surfaces.b Rates between northern component and MWR II on rh 26.5.c Rates between northern component and MWR I on rh 27.0.d Rates between MWR I and MWR II on rh 27.0.
Table 4
Rates of change (Amol kg� 1 year� 1) assuming binary and single
end-member mixing, as well as the ratio of the rates
Mixing Ratioa
Binary Single Not corrected/
corrected
(A) MWR II on rh 26.5
Silicate 0.06 0.16 2.8
Nitrate 0.37 0.54 1.5
Phosphate 0.03 0.03 1.9
OUR 3.33 4.10 1.2
DINxs 0.09 0.07 0.7
(B) MWR I on rh 27.0
Silicate 0.18 0.18 1.0
Nitrate 4.36 4.36 1.0
Phosphate 0.02 0.03 1.1
OUR 3.67 3.67 1.0
DINxs 0.04 0.04 1.0
(C) MWR II on rh 27.0
Silicate 0.16 0.48 3.0
Nitrate 0.17 0.56 3.2
Phosphate 0.02 0.05 2.7
OUR 4.47 5.20 1.2
DINxs � 0.10 � 0.20 2.1
a Calculated prior to rounding of rates.
D.A. Hansell et al. / Marine Chemistry 84 (2004) 243–265 259
a strong negative growth in the southern portion of the
gyre that cannot be explained by mixing alone. The
OUR on rh 27.0 ranged from 3.67 to 4.47 Amol kg� 1
year� 1 for the eastern and southern portions of the
gyre, somewhat lower than the OUR of 6 Amol kg� 1
year� 1 determined by Doney and Bullister (1992) in
the eastern North Atlantic on that surface.
Property/property ratios give some insight as to
which variables (nitrate or phosphate) may have
caused the negative DINxs production on rh 27.0
(Table 3). In the eastern gyre (Line B, Fig. 8), the
DO2/DNO3� had a narrow range of � 8.4 to � 9.0 on
the two potential density surfaces, but in the southern
section (Line C) the ratio increased three-fold (to
� 26) relative to Line B. The DO2/DPO4� 3 ratio had
a narrow range in the east (� 147 to � 196) and
increased by approximately one half to � 263 in the
southern gyre. Takahashi et al. (1985) reported DO2/
DNO3� and DO2/DPO4
� 3 ratios on rh 27.0 in the North
Atlantic of � 9.4 and � 165, respectively, in agree-
ment with those we report in the eastern gyre. Both
phosphate and nitrate increased in the southern gyre at
rates lower than expected given the oxygen utiliza-
tion, but of the two properties nitrate growth was the
weakest relative to OUR. The true cause of the DINxs
concentration decrease is unknown.
With the exception of the rh 26 surface, the rates
given in Table 3 have been corrected for binary
mixing of northern and southern components in the
gyre. On the rh 26 surface, northern component water
strongly dominates in this analysis (i.e., at MWR I,
where the northern component made up essentially
100% of the water) so single end-member mixing is
reasonable. On deeper surfaces production rates as-
suming single end-member mixing overestimate the
rates corrected for binary mixing by up to three-fold
(Table 4). GS97 did not correct for binary mixing on
Page 18
D.A. Hansell et al. / Marine Chemistry 84 (2004) 243–265260
the two potential density surfaces we have considered,
and this difference in treatment contributes to the
differences in the rates estimated.
A second difference between the calculations here
and by GS97 is the choice of age tracers. There exists
an offset between water mass ages estimated by
pCFC-12 age (used here) and the 3H/3He used by
GS97. Doney et al. (1997) reported a relatively
constant, positive offset in the CFC ages in the
thermocline (older CFC age compared to the 3H/3He
age), and a non-linear offset at 3H/3He ages >12.5
years, with much younger 3H/3He ages relative to
CFC ages. The rates of DINxs development on the rh
26.0 and 26.5 surfaces are unaffected by the offset
because the ages in MWR II are < 9 years (Table 2),
so both tracers should give similar age gradients. On
the deeper isopycnal, however, the offset is significant
and nonlinear, thus affecting calculated rates. In
MWR I on the rh 27.0 surface, the pCFC-12 age of
22 years (Table 2) is approximately equal to a 3H/3He
age of 15 years, estimated from the age offset in Fig.
8A of Doney et al. (1997). Using the younger 3H/3He
age on the rh 27.0 surface rather than the pCFC-12
age would raise the DINxs production rate by f 50%.
This difference can account for the discrepancy in
rates on the rh 27.0 surface estimated here with that
by GS97. van Aken (2001) suggests that the main
cause for the offset in age between the two tracers is
that the surface layer water can remain undersaturated
with respect to the atmospheric CFC concentrations,
causing an underestimate in the OUR. He recommen-
ded an upward revision of CFC-derived estimates of
OUR in the main thermocline by a factor of 1.3.
Applying this factor to the DINxs production rates on
rh 27.0 in Table 3 would reduce the difference with
the estimates of GS97.
Finally, variability in the strength, timing and
location of nitrogen fixation in the North Atlantic is
likely reflected by interannual or decadal changes in
the location and gradients of excess nitrate. Bates and
Hansell (2003) have demonstrated strong temporal
variability in DINxs in the Sargasso Sea, which
correlates well with the North Atlantic Oscillation
(NAO). Likewise, as indicated above, DINxs values
at the cross over point of AR01 and A22 varied by as
much as 0.6 Amol kg� 1, suggesting temporal vari-
ability in that region. GS97 employed data collected
from several oceanographic programs (such as the
Geochemical Sections [GEOSECS] program and
Transient Tracers in the Ocean [TTO]) taking place
over the course of c 2 earlier decades. The WOCE
program data employed in this analysis were collected
later, between 1988 and 1998, so the offset in time of
collections may be important.
3.3. Regional rates of nitrogen fixation
GS97 calculated the rate of nitrogen fixation in the
North Atlantic by applying their rates of N* produc-
tion to the volumes of the isopycnal layers of interest.
The rates of N* development were adjusted for the
effect of elevated N/P ratios in the nitrogen-rich
organic matter produced by diazotrophic organisms
(taken to be 125), thus providing estimates of regional
N2 fixation (with application of Eq. (14) from GS97).
We used the GS97 equations for calculating rates, so
if there is an error in the assumption about the ratio,
then our rates are likewise affected. Analyses are
required to accurately confirm the appropriate ratios
to be used in the rate calculations.
The region over which GS97 applied their volumet-
ric rates was 10–50jN and 10–90jW, an area bound-
ing the subtropical gyre and a portion of the Gulf of
Mexico. We also estimated the volumes bounding the
rh 26.0, 26.5 and 27.0 surfaces where DINxs develop-
ment was evident (Table 5). We caution that WOCE
coverage of the North Atlantic is inadequate to provide
high confidence in the actual areas over which the rates
should be applied, particularly for the rh 27.0 surface.
Our findings, however, do not support the application
of the DINxs development rates to the entirety of the
subtropical gyre as was done in GS97; we found that
the areas where DINxs development takes place were
regional and not gyre wide (Fig. 8). This difference in
regional distribution of excess nitrate development
results in a large difference in estimated regional rates
of nitrogen fixation.
Volumes of the 26.0, 26.5 and 27.0 potential
density intervals were calculated from the areas
bounded by 10–25jN, 25–75jW; 15–25jN, 25–
75jW; and, 15–40jN, 20–40jW, respectively. Se-
lection of the regions over which excess nitrate
develops on density surfaces is of central importance
to the resulting regional estimates of nitrogen fixation.
We used the distributions depicted in Figs. 8, 14 and
15) to guide the selections. Fig. 8A provided the
Page 19
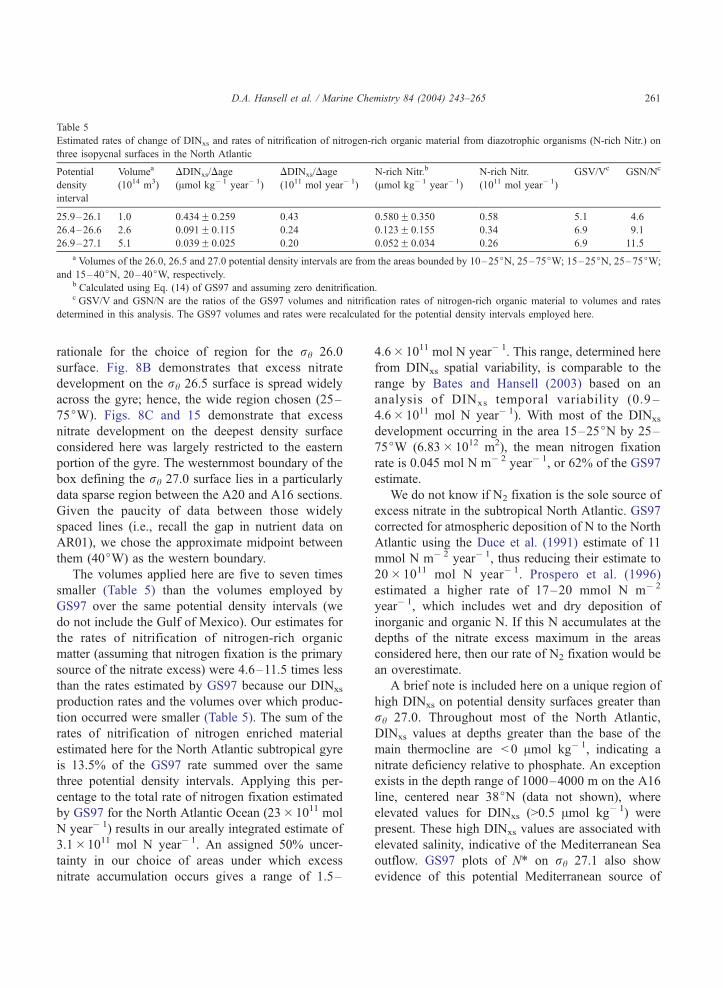
Table 5
Estimated rates of change of DINxs and rates of nitrification of nitrogen-rich organic material from diazotrophic organisms (N-rich Nitr.) on
three isopycnal surfaces in the North Atlantic
Potential
density
interval
Volumea
(1014 m3)
DDINxs/Dage
(Amol kg� 1 year� 1)
DDINxs/Dage
(1011 mol year� 1)
N-rich Nitr.b
(Amol kg� 1 year� 1)
N-rich Nitr.
(1011 mol year� 1)
GSV/Vc GSN/Nc
25.9–26.1 1.0 0.434F 0.259 0.43 0.580F 0.350 0.58 5.1 4.6
26.4–26.6 2.6 0.091F 0.115 0.24 0.123F 0.155 0.34 6.9 9.1
26.9–27.1 5.1 0.039F 0.025 0.20 0.052F 0.034 0.26 6.9 11.5
a Volumes of the 26.0, 26.5 and 27.0 potential density intervals are from the areas bounded by 10–25jN, 25–75jW; 15–25jN, 25–75jW;
and 15–40jN, 20–40jW, respectively.b Calculated using Eq. (14) of GS97 and assuming zero denitrification.c GSV/V and GSN/N are the ratios of the GS97 volumes and nitrification rates of nitrogen-rich organic material to volumes and rates
determined in this analysis. The GS97 volumes and rates were recalculated for the potential density intervals employed here.
D.A. Hansell et al. / Marine Chemistry 84 (2004) 243–265 261
rationale for the choice of region for the rh 26.0
surface. Fig. 8B demonstrates that excess nitrate
development on the rh 26.5 surface is spread widely
across the gyre; hence, the wide region chosen (25–
75jW). Figs. 8C and 15 demonstrate that excess
nitrate development on the deepest density surface
considered here was largely restricted to the eastern
portion of the gyre. The westernmost boundary of the
box defining the rh 27.0 surface lies in a particularly
data sparse region between the A20 and A16 sections.
Given the paucity of data between those widely
spaced lines (i.e., recall the gap in nutrient data on
AR01), we chose the approximate midpoint between
them (40jW) as the western boundary.
The volumes applied here are five to seven times
smaller (Table 5) than the volumes employed by
GS97 over the same potential density intervals (we
do not include the Gulf of Mexico). Our estimates for
the rates of nitrification of nitrogen-rich organic
matter (assuming that nitrogen fixation is the primary
source of the nitrate excess) were 4.6–11.5 times less
than the rates estimated by GS97 because our DINxs
production rates and the volumes over which produc-
tion occurred were smaller (Table 5). The sum of the
rates of nitrification of nitrogen enriched material
estimated here for the North Atlantic subtropical gyre
is 13.5% of the GS97 rate summed over the same
three potential density intervals. Applying this per-
centage to the total rate of nitrogen fixation estimated
by GS97 for the North Atlantic Ocean (23� 1011 mol
N year� 1) results in our areally integrated estimate of
3.1�1011 mol N year� 1. An assigned 50% uncer-
tainty in our choice of areas under which excess
nitrate accumulation occurs gives a range of 1.5–
4.6� 1011 mol N year� 1. This range, determined here
from DINxs spatial variability, is comparable to the
range by Bates and Hansell (2003) based on an
analysis of DINxs temporal variability (0.9 –
4.6� 1011 mol N year� 1). With most of the DINxs
development occurring in the area 15–25jN by 25–
75jW (6.83� 1012 m2), the mean nitrogen fixation
rate is 0.045 mol N m� 2 year� 1, or 62% of the GS97
estimate.
We do not know if N2 fixation is the sole source of
excess nitrate in the subtropical North Atlantic. GS97
corrected for atmospheric deposition of N to the North
Atlantic using the Duce et al. (1991) estimate of 11
mmol N m� 2 year� 1, thus reducing their estimate to
20� 1011 mol N year� 1. Prospero et al. (1996)
estimated a higher rate of 17–20 mmol N m� 2
year� 1, which includes wet and dry deposition of
inorganic and organic N. If this N accumulates at the
depths of the nitrate excess maximum in the areas
considered here, then our rate of N2 fixation would be
an overestimate.
A brief note is included here on a unique region of
high DINxs on potential density surfaces greater than
rh 27.0. Throughout most of the North Atlantic,
DINxs values at depths greater than the base of the
main thermocline are < 0 Amol kg� 1, indicating a
nitrate deficiency relative to phosphate. An exception
exists in the depth range of 1000–4000 m on the A16
line, centered near 38jN (data not shown), where
elevated values for DINxs (>0.5 Amol kg� 1) were
present. These high DINxs values are associated with
elevated salinity, indicative of the Mediterranean Sea
outflow. GS97 plots of N* on rh 27.1 also show
evidence of this potential Mediterranean source of
Page 20
D.A. Hansell et al. / Marine Chemistry 84 (2004) 243–265262
excess N. Kress and Herut (2001) reported N/P ratios
in the deep water and the Levantine Intermediate
Water of the eastern Mediterranean Sea to be >24
and >18, respectively. Outflow of similarly high N/P
water from the Mediterranean Sea would result in the
DINxs distribution found at >1000 m on section A16.
4. Concluding statements
Geochemical and direct biological estimates of
nitrogen fixation in the tropical and subtropical North
Atlantic converge in this analysis. Our areal rate (0.045
mol N m� 2 year� 1) is three times the mean rate of
nitrogen fixation measured by Orcutt et al. (2001) at
31jN in the western Sargasso Sea near Bermuda,
supporting the finding that most of the N2 fixation
occurs at latitudes south of Bermuda. Our rate is
consistent with the global mean rate of N2 fixation
for the tropical ocean of 0.039 mol m� 2 year� 1 and
twice the rate of 0.026 mol m� 2 year� 1 measured
between 14jN and 22jN in the SW North Atlantic
(Capone et al., 1997). The Capone et al. (1997) global
mean rate of tropical nitrogen fixation, applied over the
area in which we found excess nitrate in the North
Atlantic (6.83� 1012 m2), gives a nitrogen fixation rate
of 2.7� 1011 mol N year� 1. Given the uncertainties in
both estimates, our rate based on geochemical methods
(3.1�1011mol N year� 1) is indistinguishable from the
rate derived from biological measurements.
The distributions of N* in GS97 suggested that
most of the N2 fixation in the Sargasso Sea was in the
west, including the waters around Bermuda. The low
rates measured at the BATS site by Orcutt et al.
(2001), as well as the absence of seasonal variability
in the isotopic composition of DON there (Knapp and
Sigman, 2003), challenge those findings. Lipschultz
and Owens (1996) listed several inconsistencies be-
tween observations of excess nitrate at the BATS site
and measured rates of nitrogen fixation, all suggesting
a weak linkage between N* and nitrogen fixation at
the site. Hansell and Carlson (2001) reported summer
time TON concentrations of 4–5 Amol kg� 1 at BATS,
values that are both relatively low and static. Such
characteristics are not expected if N2 fixation is a
dominant process there. Karl et al. (1992), for exam-
ple, reported a 3.1-fold increase in DON in the
presence of a Trichodesmium spp. bloom near Station
ALOHA in the North Pacific. Because Hansell and
Carlson (2001) found no substantive summer time
increases in TON, they suggested that N2 fixation
rates were unlikely to be as high at the BATS site as
indicated by the GS97 findings. Instead, if N2 fixation
was responsible for elevated N/P ratios in the main
thermocline of the Sargasso Sea, then the process
must take place south of Bermuda and the excess
nitrate transported with the gyre circulation. The
results presented here support that hypothesis.
Here, we showed particularly high excess nitrate
concentrations to the south of Bermuda and in the
eastern portion of the gyre. If the high excess nitrate
signals are truly indicative of high nitrogen fixation
rates in those locales, then it is intriguing to consider
that the regional imprint of nitrogen fixation is largely
aligned with the track of dust transport and deposition
in the North Atlantic (Ginoux et al, 2001). Bates and
Hansell (2003) proposed a link between the temporal
variability of DINxs in the western Sargasso Sea and
variations in dust inputs that were tied to the North
Atlantic Oscillation. Mahaffey et al. (2003) likewise
suggested that biogeochemical proxies for nitrogen
fixation (i.e., high excess nitrate in the thermocline,
cyanobacterial phytopigments and stable isotope sig-
natures), particularly high between 26jN and 32jNon 20jW, are coincident with enhanced atmospheric
dust deposition. Their findings, like those reported
here, indicate that nitrogen fixation may occur at high
rates at mid latitudes in the eastern basin where dust
inputs are high. Support for this comes from Kahler et
al. (personal communication) who measured both
high N2 fixation rates (up to 4.5 mmol N m� 2 day� 1)
) and high rates of DINxs accumulation (0.5 mmol N
m� 2 day� 1) in the thermocline along 30jW (15–
35jN). Tyrrell et al. (2003) reported that high Tricho-
desmium spp. abundance in the eastern North Atlantic
was correlated with shallow mixed layer depths and
high iron deposition. Interestingly, they also found
the highest abundances between 0jN and 15jN in
late summer and more moderate abundances to 30jN.The distributions of the diazotrophs were spatially
offset from the distribution of the excess nitrate
shown here.
Our findings for the distribution and production of
excess nitrate in the North Atlantic have similarities
and dissimilarities to the GS97 results. We concur that
the northern and southern components contribute
Page 21
D.A. Hansell et al. / Marine Chemistry 84 (2004) 243–265 263
water with low excess nitrate, and that nitrate excess
develops below the mixed layer in the subtropical
North Atlantic. The GS97 findings suggest, though,
that N* develops uniformly on the isopycnal surfaces,
regardless of location or depth in the gyre. Our
contrasting findings indicate that excess nitrate devel-
ops at depths of 150–400 m, and so it is only when an
isopycnal lies at those depths will it gain excess nitrate
(Fig. 10). Where an isopycnal such as rh 27.0 is
deeper than 400 m, the surface does not gain addi-
tional excess nitrate, thus restricting the areas in which
that surface should be included for estimating the
regional rate of N2 fixation. Finally, we cannot explain
the differences in the distributions of excess nitrate as
shown by GS97 and in this analysis. It may be that
data quality was different, with GS97 using data sets
from the 1970s, the 1980s and the early 1990s, and
having to apply corrections to some of the data.
Themost important cause for the difference between
our estimate of areally integrated nitrogen fixation in
the North Atlantic and that of GS97 is the area over
which the process is thought to occur. Our regional
estimates for N2 fixation retain uncertainty because the
WOCE sections we used, while providing coverage
adequate to roughly outline the regions of DINxs
development, were inadequate to closely define the
spatial boundaries for estimating volumes of the po-
tential density intervals. The DINxs distributions shown
in Fig. 8 are consistent with gyre circulation (e.g., Fig.
9), accounting for the inflow of DINxs depleted north-
ern and southern components and the accumulation of
DINxs signal over similar depth ranges, as expected for
remineralization of common sinking particles. Not
quantified are processes other than N2 fixation, and
listed by Fanning (1992) andGS97, that may contribute
to the development of excess nitrate in the subtropical
Sargasso Sea. We have reduced the differences be-
tween biological and geochemical estimates of N2
fixation. If additional processes contribute to the geo-
chemical signal, the gap may be reduced further. We
conclude that N2 fixation is an important part of the
nitrogen cycle in the subtropical North Atlantic, but it
occurs at considerably lower rates than reported in
some of the recent literature where it was evaluated
using geochemical data.
If the rate of nitrogen fixation in the North Atlantic
is indeed considerably lower than estimated by GS97,
then recently considered global marine nitrogen budg-
ets are impacted. Gruber and Sarmiento (2002) esti-
mated that present day sources of new nitrogen to the
global ocean (nitrogen fixation, riverine and atmo-
spheric inputs), summing to 17�1012 mol N year� 1,
are in approximate balance with the global marine rate
of denitrification (the sink term for fixed nitrogen).
Codispoti et al. (2001), however, reports a very large
imbalance between fixed nitrogen sources and sinks in
the ocean, with sinks (i.e., denitrification) exceeding
sources by a factor of two. Both the Gruber and
Sarmiento (2002) and the Codispoti et al. (2001)
budgets rely on the GS97 global estimate of nitrogen
fixation, and that estimate is highly reliant on the rates
GS97 reported for the North Atlantic. If the global
marine nitrogen fixation rate is less than suggested by
GS97, then the imbalance reported by Codispoti et al.
(2001) increases and the balanced budget suggested
by Gruber and Sarmiento (2002) is challenged.
Acknowledgements
Our deepest appreciation goes to the numerous
P.I.’s, scientists, technicians and ship’s officers and
crews who completed the enormous task of occupying
and analyzing the WOCE sections and samples. The
products of their efforts will resound through our
science for many years to come. Rana Fine and Debra
Willey calculated water ages and provided plots from
the North Atlantic, and we thank them for this help.
Geoff Daniels is thanked for calculating volume data
for water masses of interest in the Atlantic. Mick
Follows joined our early discussions on the Sargasso
Sea and participated in our seagoing activities. Niki
Gruber, Fred Lipschultz and Associate Editor Mark
Altabet suggested several improvements on the
manuscript. We thank an anonymous reviewer for
extensive comments as well. This work was supported
by the National Science Foundation. DAH and NRB
were supported by NSF OCE-0196143. DBO was
supported by NSF OCE-9981500.
Associate editor: Dr. Mark Altabet.
References
Anderson, L.A., Sarmiento, J.L., 1994. Redfield ratios of reminer-
alization determined by nutrient data analysis. Global Biogeo-
chemical Cycles 8, 65–80.
Page 22
D.A. Hansell et al. / Marine Chemistry 84 (2004) 243–265264
Bates, N.R., Hansell, D.A., 2003. Temporal variability of excess
nitrate in the subtropical mode water of the North Atlantic
Ocean. Marine Chemistry 84, 225–241.
Capone, D.G., Zehr, J.P., Paerl, H.W., Bergman, B., Carpenter, E.J.,
1997. Trichodesmium, a globally significant marine cyanobac-
terium. Science 276, 1221–1229.
Carpenter, E.J., 1983. Nitrogen fixation by marine Oscillatoria
(Trichodesmium) in the world’s oceans. In: Carpenter, E.J., Ca-
pone, D.G. (Eds.), Nitrogen in the Marine Environment. Aca-
demic Press, New York, pp. 65–104.
Carpenter, E.J., Montoya, J.P., Burns, J., Mulholland, M.R., Sub-
ramaniam, A., Capone, D.G., 1999. Extensive bloom of a N2-
fixing diatom/cyanobacterial association in the tropical Atlantic
Ocean. Marine Ecology Progress Series 185, 273–283.
Chavez, F.P., Toggweiler, J.R., 1995. Physical estimates of global
new production: the upwelling contribution. In: Summerhayes,
C.P., Emeis, K.-C., Angel, M.V., Smith, R.L., Zeitschel, B.
(Eds.), Upwelling in the Ocean: Modern Processes and An-
cient Records. Wiley, New York, pp. 313–320.
Codispoti, L.A., 1989. Phosphorus vs. nitrogen limitation of new
and export production. In: Berger, W.H., Smetacek, V.S., Wefer,
G. (Eds.), Productivity of the Ocean: Present and Past. Wiley,
NY, pp. 377–394.
Codispoti, L.A., Brandes, J.A., Christensen, J.P., Devol, A.H.,
Naqvi, S.W.A., Paerl, H.W., Yoshinari, T., 2001. The oceanic
fixed nitrogen and nitrous oxide budgets: moving targets as
we enter the Anthropocene? Scientia Marina 65 (Suppl. 2),
85–105.
Deutsch, C., Gruber, N., Key, R.M., Sarmiento, J.L., Ganachaud,
A., 2001. Denitrification and N2 fixation in the Pacific Ocean.
Global Biogeochemical Cycles 15, 483–506.
Doney, S.C., Bullister, J.L., 1992. A chlorofluorocarbon section in
the eastern North Atlantic. Deep-Sea Research I 39, 1857–1883.
Doney, S.C., Jenkins, W.J., Bullister, J.L., 1997. A comparison of
ocean tracer dating techniques on a meridional section in the
eastern North Atlantic. Deep-Sea Research I 44, 603–626.
Duce, R.A., Merrill, J.T., Atlas, E.L., Buat-Menard, P., Hicks, B.B.,
Miller, J.M., Prospero, J.M., Arimoto, R., Church, T.M., Ellis,
W., Galloway, J.N., Hansen, L., Jickells, T.D., Knap, A.H.,
Reinhardt, K.H., Schneider, B., Soudine, A., Tokos, J.J., Tsu-
nogai, S., Wollast, R., Zhou, M., 1991. The atmospheric input
of trace species to the world ocean. Global Biogeochemical
Cycles 5, 193–259.
Fanning, K., 1987. Anomalous NO3/PO4 ratios in the west central
North Atlantic Ocean (abstract). Eos Transactions AGU 68,
1754.
Fanning, K., 1992. Nutrient provinces in the sea: concentration
ratios, reaction rate ratios, and ideal covariation. Journal of Geo-
physical Research 97, 5693–5712.
Ginoux, P., Chin, M., Tegen, I., Prospero, J.M., Holben, B., Du-
bovic, O., Lin, S.-J., 2001. Sources and distributions of dust
aerosols simulated with the GOCART model. Journal of Geo-
physical Research 106, 20255–20273.
Gruber, N., Sarmiento, J.L., 1997. Global patterns of marine nitro-
gen fixation and denitrification. Global Biogeochemical Cycles
11, 235–266.
Gruber, N., Sarmiento, J.L., 2002. Large scale biogeochemical-
physical interactions in elemental cycles. In: Robinson, A.R.,
McCarthy, J.J., Rothschild, B.J. (Eds.), The Sea, vol. 12. Wiley,
New York, pp. 337–399.
Hansell, D.A., Carlson, C.A., 2001. Biogeochemistry of total or-
ganic carbon and nitrogen in the Sargasso Sea: control by con-
vective overturn. Deep-Sea Research II 48, 1649–1667.
Jenkins, W.J., 1987. 3H and 3He in the beta triangle: observations of
gyre ventilation and oxygen utilization rates. Journal of Physical
Oceanography 17, 763–783.
Karl, D.M., Letelier, R., Hebel, D., Bird, D.V., Winn, C.D.,
1992. Trichodesmium blooms and new production in the
North Pacific gyre. In: Carpenter, E.J., Capone, D.G., Rueter,
J.G. (Eds.), Marine Pelagic Cyanobacteria: Trichodesmium
and other Diazotrophs. Kluwer Academic Publishers, Nether-
lands, pp. 219–237.
Knapp, A.N., Sigman, D.M., 2003. Stable isotopic composition
of dissolved organic nitrogen from the surface waters of
BATS. 2003 Abstract Book ASLO Aquatic Sciences Meeting,
p. 78.
Kress, N., Herut, B., 2001. Spatial and seasonal evolution of dis-
solved oxygen and nutrients in the Southern Levantine Basin
(Eastern Mediterranean Sea): chemical characterization of the
water masses and inferences on the N:P ratios. Deep-Sea Re-
search I 48, 2347–2372.
Lee, K., Karl, D.M., Waninkhof, R., Zhang, J.-Z., 2002. Global
estimates of net carbon production in the nitrate-depleted trop-
ical and subtropical oceans. Geophysical Research Letters 29,
1907 (dio: 10.1029/2001GL014198, 2002).
Lipschultz, F., Owens, N., 1996. An assessment of nitrogen fixation
as a source of nitrogen to the North Atlantic Ocean. In: Ho-
warth, R.W. (Ed.), Nitrogen Cycling in the North Atlantic Ocean
and Its Watersheds. Kluwer Academic Publishers, Boston, MA,
pp. 261–274.
Luyten, J.R., Pedlosky, J., Stommel, H., 1983. The ventilated ther-
mocline. Journal of Physical Oceanography 13, 292–309.
Mahaffey, C., Williams, R.G., Wolff, G.A., Mahowald, N., Ander-
son, W., Woodward, M., 2003. Biogeochemical signatures of
nitrogen fixation over the eastern North Atlantic. Geophys.
Res. Letters 30 (6), doi:10.1029/2002GL016542.
Michaels, A.F., Olson, D., Sarmiento, J.L, Ammerman, J.W.,
Fanning, K., Jahnke, R., Knap, A.H., Lipschultz, F., Pros-
pero, J.M., 1996. Inputs, losses and transformations of nitro-
gen and phosphorus in the pelagic North Atlantic. In:
Howarth, R.W. (Ed.), Nitrogen Cycling in the North Atlantic
Ocean and Its Watersheds. Kluwer Academic Publishers, Bos-
ton, MA, pp. 181–226.
Orcutt, K.M., Lipschultz, F., Gundersen, K., Arimoto, R., Michaels,
A.F., Knap, A.H., Gallon, J.R., 2001. Seasonal pattern and sig-
nificance of N2 fixation by Trichodesmium spp. at the Bermuda
Atlantic Time-Series Study (BATS) site. Deep-Sea Research II
48, 1583–1608.
Prospero, J.M., Barrett, K., Church, T., Dentener, F., Duce, R.A.,
Galloway, J.N., Levy II, H., Moody, J., Quinn, P. 1996. Atmos-
pheric deposition of nutrients to the North Atlantic basin. Bio-
geochemistry 35, 27–73.
Rade, L., Westergren, B., 1992. Beta Mathematics Handbook, 2nd
ed. CRC Press, Boca Raton, p. 329.
Page 23
D.A. Hansell et al. / Marine Chemistry 84 (2004) 243–265 265
Redfield, A.C., Ketchum, B.H., Richards, F.A., 1963. The influence
of organisms on the composition of seawater. In: Hill, M.N.
(Ed.), The Sea, Ideas and Observations on Progress in the Study
of the Seas, vol. 2. Interscience, New York, pp. 26–77.
Reid, J.L., 1994. On the total geostrophic circulation of the North
Atlantic Ocean: flow patterns, tracers, and transports. Progress
in Oceanography 33, 1–92.
Robbins, P.E., Price, J.F., Owens, W.B., Jenkins, W.J., 2000. The
importance of lateral diffusion for the ventilation of the lower
thermocline in the subtropical North Atlantic. Journal of Phys-
ical Oceanography 30, 67–89.
Sarmiento, J.L., Thiele, G., Key, R.M., Moore, W.S., 1990. Oxygen
and nitrate new production and remineralization in the North
Atlantic subtropical gyre. Journal of Geophysical Research 95,
18303–18315.
Schlitzer, R., 2002. Ocean Data View, WWW page, http://www.
awi-bremerhaven.de/GEO/ODV (version 1.1a).
Schmitz Jr., W.J., Richardson, P.L., 1991. On the sources of the
Florida Current. Deep-Sea Research 38 (Suppl. 1), S389–S409.
Stommel, H., 1965. The Gulf Stream: A Physical and Dynamical
Description, 2nd ed. Univ. of California Press, Berkeley and Los
Angeles, California. 248 pp.
Takahashi, T., Broecker, W.S., Langer, S., 1985. Redfield ratio
based on chemical data from isopycnal surfaces. Journal of Geo-
physical Research 90, 6907–6924.
Tyrrell, T., Maranon, E., Poulton, A.J., Bowie, A.R., Harbour, D.S.,
Woodward, E.M.S., 2003. Large-scale latitudinal distribution of
Trichodesmium spp. in the Atlantic Ocean. Journal of Plankton
Research 25, 405–416.
van Aken, H.M., 2001. The hydrography of the mid-latitude North-
east Atlantic Ocean: Part III. The subducted thermocline water
mass. Deep-Sea Research I 48, 237–267.
Walker, S.J., Weiss, R.F., Salameh, P.K., 2000. Reconstructed his-
tories of the annual mean atmospheric mole fractions for the
halocarbons CFC-11, CFC-12, CFC-113, and carbon tetrachlo-
ride. Journal of Geophysical Research 105, 14285–14296.
Warner, M.J., Weiss, R.F., 1985. Solubilities of chlorofluorocar-
bons 11 and 12 in water and seawater. Deep-Sea Research 32,
1485–1497.
Zehr, J.P., Waterbury, J.B., Turner, P.J., Montoya, J.P., Omoregie,
G.F., Steward, G.F., Hansen, A., Karl, D.M., 2001. Unicellular
cyanobacteria fix N2 in the subtropical North Pacific Ocean.
Nature 412, 635–638.