Economic Research Southern Africa (ERSA) is a research programme funded by the National Treasury of South Africa. The views expressed are those of the author(s) and do not necessarily represent those of the funder, ERSA or the author’s affiliated institution(s). ERSA shall not be liable to any person for inaccurate information or opinions contained herein. Exchange Rate Policy and Export Performance in Efficiency-Driven Economies Nicola Kim Rowbotham, Adrian Saville & Douglas Mbululu ERSA working paper 469 October 2014
Transcript
Economic Research Southern Africa (ERSA) is a research programme funded by the National
Treasury of South Africa. The views expressed are those of the author(s) and do not necessarily represent those of the funder, ERSA or the author’s affiliated
institution(s). ERSA shall not be liable to any person for inaccurate information or opinions contained herein.
Exchange Rate Policy and Export
Performance in Efficiency-Driven
Economies
Nicola Kim Rowbotham, Adrian Saville & Douglas Mbululu
ERSA working paper 469
October 2014
Exchange Rate Policy and Export Performancein E¢ciency-Driven Economies
Nicola Kim Rowbotham, Adrian Saville & Douglas Mbululu
October 6, 2014
Abstract
Increased globalisation, coupled with rising domestic competition, hasled a growing number of …rms to search beyond their traditional do-mestic markets for business opportunities in recent years. As a result,export-led economic growth has gained renewed attention amongst policymakers, particularly amongst those in industrialising nations, or so-callede¢ciency-driven economies. This search for drivers of economic growthhas gained further impetus from the economic pressures brought about bythe fall in growth in advanced markets following the global …nancial crisiscoupled with the rising competitiveness of other industrialising emergingeconomies. A common policy proposal amongst countries trying to im-prove their competitiveness is to weaken the domestic exchange rate asa means to stimulate exports. However, depreciation also increases ex-change rate risk. Given the renewed emphasis on this policy lever, thisresearch examines the impact of exchange rate on export performancein a sample of nine e¢ciency-driven economies over the period 1990 to2009. These economies that we survey include Brazil, the Dominican Re-public, Malaysia, Mauritius, Mexico, Peru, South Africa, Thailand andTurkey, which all have ‡oating exchange rate arrangements during thesurvey period. Panel data models using a …xed-e¤ects method were used,and it was found that a weakening of the exchange rate does not necessar-ily improve export performance. To the contrary, for the nine countriessurveyed, export growth seems to be associated with stronger exchangerates. Whilst our results suggest that the lag e¤ect of exchange rate move-ment on export performance is slightly more pronounced, the relationshipnevertheless remains statistically insigni…cant.
1 INTRODUCTIONCurrent global market conditions, where many economies are undergoing …-nancial strain or economic restructuring and realignment, have brought to thefore the concept of a ‘currency war’ or, less dramatically, competition based onexchange rate weakness (Ahamed, 2011). According to Dolan (2010), certainworld economies are investigating pegging or weakening their exchange rates to
1
gain global export market share through price competitiveness. This policy pro-posal has gained support by virtue of the fact that the last two decades has seenmany economies become more dependent on exports, an attribute compoundedby recent bouts of slower domestic economic growth and hence lower domesticdemand. Thus, it is argued, a relatively weaker exchange rate would help coun-tries’ exported goods to become more competitive (Kaiser & Wroughton, 2010),thereby helping these countries achieve higher economic prosperity.
Despite recent attention, the concept of a ‘currency war’ is not a new phe-nomenon. Prebisch (1950, 1964) demonstrates this in a shift in early thinking oneconomic growth and development. Initially, inward-looking strategies (Preb-sich, 1950), where reliance was placed on a home market for manufactured goodsin a process of import substitution, were preferred by countries in Latin Americaand sub-Saharan Africa (Keesing, 1967). Outward-looking strategies were latergiven preference by many developing economies, in particular those in Asia,as manufactured export industries were seen as a key component of industrialdevelopment and economic success (Keesing, 1967).
Prebisch (1964) further developed the argument in support of export-orientedindustrialisation as a key component for economic growth. Such economicgrowth could be achieved through an expanded export market share achievedvia comparative cost advantages, such as cheap labour or exchange rate weak-ness (Prebisch, 1964; Keesing, 1967). In time, most economies have shifted tooutward-looking strategies of export promotion (Dollar, 1992).
Thus, policies that promote currency weakness may be viewed as favourableby countries in pursuit of export-led growth (Owen, 2005). This follows fromthe argument that a weaker home currency would reduce the price of exportsby making them cheaper in comparison to other competitors within the exportmarket (Mussa & Rosen, 1978; Auer & Chaney, 2009). Economic growth follows,as a greater demand for exports would encourage higher domestic productionand in so doing, boost employment and adjust the trade balance in favour of the‘weakening’ currency. According to this argument, the net e¤ect would be toboost gross domestic product (GDP) and raise domestic income and incomes perperson (Owen, 2005). Such a proposal, in isolation, appears plausible. In reality,however, there are a number of other factors which impact any competitiveadvantages as a result of currency weakness in developing nations, as well as indeveloped nations (Boltho, 1996).
Arguably, the proposal to weaken a currency to gain global export marketshare through price competitiveness is most relevant for developing countrieswhich experience, or aim to achieve, substantial industrial growth that is fu-elled by exports (Clark, 1996). The so called e¢ciency-driven economies, asde…ned by Porter (1998) and described in the World Economic Forum GlobalCompetitiveness Report (Schwab, 2013), are developing, industrialising nationsfor whom export sectors are a key contributor to economic growth.
Previous studies on the relationship between currency weakness and exportperformance fail to clearly isolate the relationship between currency movementsand export performance by providing inconclusive, and sometimes contradictory,evidence. By way of example, Bautista (1982), Abeysinghe and Yeok (1998),
2
Musila and Newark (2003) and Auer and Chaney (2009) found that currencyweakness improves export performance. To the contrary, Lizondo and Montiel(1989), Calvo and Reinhart (2002), Musila (2002), Frankel (2005) and Bermanand Berthou (2009), amongst others, found currency weakness either to have anegative e¤ect on export performance or to have little e¤ect. However, many ofthese studies reviewed a small sample of developing or developed countries with aparticular focus on …xed exchange rate regimes due to the historical prevalence of…xed exchange rates under the Bretton Woods system (Dooley, Folkerts-Landau,& Garber, 2004). Furthermore, many of these studies focussed on short-runanalysis and did not emphasise the e¤ects of currency movement in the longerrun. While there is a general agreement in the literature that currency weakness– or depreciation and devaluation in the case of ‡exible and …xed exchange rateregimes, respectively – impacts export performance via the mechanism of price,there is still much debate on the direction, extent and duration of the impactof currency movements on export performance. In sum, previous research failsto provide conclusive evidence indicating causality between currency movementand export performance – and in particular improved export performance thatis expected to follow from a weaker exchange rate.
It is against this backdrop that the current study examines the relation-ship between currency weakness in ‡oating rate e¢ciency-driven economies andexport performance across a relatively large sample of countries over a longertime frame than previous related studies. Speci…cally, the study seeks to assesswhether export performance is improved by currency depreciation in e¢ciency-driven economies and evaluate the extent to which – if at all – export growth lagscurrency depreciation in e¢ciency-driven economies. This study contributes toexisting literature on exchange rate and economic growth in many ways. First,an improved understanding of this relationship may provide policymakers andeconomic advisors with a greater depth of knowledge upon which to make de-cisions to ‘restore economic equilibrium to a nation’ (Owen, 2005: 99). Givenrecent attention paid to the issue of ‘currency wars’, this relationship requiresfurther exploration. Second, contrary to most studies, this study focuses on‡oating exchange rate regimes across a relatively large sample of countries overa longer time frame and a more relevant population. Third, e¢ciency-driveneconomies are considered more relevant subjects when it comes to the questionof exchange rate movements and export sector performance because they tendto be developing economies which explicitly aim to achieve substantial indus-trial growth fuelled by exports (Clark, 1996). Finally, most studies conductedin this …eld have tended to refer to a number of independent variables and failedto isolate the relationship between currency weakness and export performanceclearly. This study di¤erentiates itself by focussing explicitly on the relation-ship between currency weakness in ‡oating rate e¢ciency-driven economies andexport performance.
The remainder of the paper is structured as follows: the next section dis-cusses the literature, focusing speci…cally on currency weakness, export perfor-mance and e¢ciency-driven economies. The analytical framework employed inthis study is discussed in Section 3. Results are presented and discussed in
3
Section 4. Section 5 concludes the study.
2 LITERATURE REVIEW
2.1 Introduction
In this section, currency weakness and its impact on export performance, as wellas the concept of e¢ciency-driven economies, is explained. Hence, three primaryconcepts and their relationships with each other are explored within this section:currency weakness; export performance; and e¢ciency-driven economies.
2.2 Currency Weakness
(i) Nominal and Real Exchange Rates The nominal exchange rate is the o¢ciallyquoted exchange rate. However, this nominal rate does not account for e¤ectivepurchasing power of a currency (Colander, 2010). The real exchange rate, bycontrast, accounts for purchasing power, as it is adjusted for di¤erences in pricelevels and rates of price in‡ation (Colander, 2010).
Where depreciation in the nominal exchange rate is o¤set by increased do-mestic price in‡ation, the real exchange rate may remain unchanged (Bird,1983). In such instances, the potential export price competitiveness advantagesof currency weakness would be o¤set by domestic price in‡ation (Bird, 1983).Burstein, Eichenbaum, and Rebelo (2004) and Owen (2005) argue that the realexchange rate provides a more accurate representation of the e¤ective exchangerate, as it accounts for changes in purchasing power.
(ii) Exchange Rate Arrangements The International Monetary Fund (IMF)de…nes an exchange rate arrangement as the manner in which a country’s cur-rency operates (IMF, 2008). Exchange rate arrangements may di¤er accordingto the degree of control a country has over its currency and whether a formalor informal commitment to the exchange rate path has been made (Calvo &Reinhart, 2002). Using the IMF (2008) classi…cation scheme, exchange ratesmay be broadly classi…ed into two types of exchange rate arrangements, namely…xed exchange rates and ‡oating exchange rates.
A ‡oating exchange rate is determined by free market forces of demand andsupply (Owen, 2005). By contrast, a …xed or pegged exchange rate is one set bythe government or by central bank policy (Bautista, 1982). A …xed exchangerate may be associated with a basket of currencies or a single currency, suchas the United States (US) dollar; or maintained by the central bank within aparticular price range relative to another currency or currency basket (Owen,2005).
Since the 1970s, many developing economies have been encouraged by theIMF and the World Bank to adopt policies of ‡oating exchange rates to facilitateprice corrections and promote export-led growth through e¢cient price discovery(Musila & Newark, 2003). Historically, however, with the legacy of the …xed-rateBretton Woods system (Dooley et al., 2004), some reluctance amongst policy
4
makers to relinquish control over the exchange rate has been experienced. This‘fear of ‡oating’ (Reinhart, 2000:65) may emanate from uncontrollable changesto the exchange rate due to market forces, to which a ‡oating exchange rateexposes an economy (Millman, 1990).
Reinhart (2000:65) argues that the ‘o¢cial labels’ of a country’s exchangerate arrangement do not always provide an adequate representation of actualcountry practice. Hence, a country may o¢cially commit to an exchange ratearrangement, but this does not preclude practice from deviating from the arrange-ment to which a country’s policy makers have committed. Regardless of whetheran exchange rate path has been committed to by a country, the de facto ex-change rate arrangement provides a more realistic representation thereof. In asimilar approach to several authors cited by Edwards (2011), the de facto ex-change rate is used for purposes of this study (IMF, 2008). Based on the de factoexchange rate arrangement in evidence, the mechanics by which a currency mayweaken di¤er, namely devaluation or depreciation.
(iii) Devaluation versus Depreciation Owen (2005:1) states that ‘the relativevalue of a currency can be reduced through either depreciation or devaluation’.Currency depreciation is usually the result of market operations to achieve areduction in currency value, consistent with the concept of a ‡oating exchangerate (Krugman & Obstveld, 1997). Currency devaluation is a more consciousevent. It is normally the result of a policy decision, whereby a country’s o¢cialexchange rate is reduced relative to all other currencies (Todaro & Smith, 2009).
A weakening exchange rate, in the absence of price in‡ation, decreases ex-port prices measured in home currency relative to other currencies (Junz &Rhomberg, 1973). This decrease in export prices renders goods more a¤ord-able and thus, arguably, more competitive from a price perspective (Junz &Rhomberg, 1973). Such price competiveness is viewed by some to be a favourablee¤ect of currency weakness (Owen, 2005). However, a reduction or weakeningin an exchange rate may have other unanticipated consequences, such as pricein‡ation caused by the rising demand for exports as well as higher import prices(Todaro & Smith, 2009). For example, if the economy is at full employment,prices are pulled upwards as consumers buy fewer imports and foreigners in-crease their demand for the home country’s cheaper exports (Mussa & Rosen,1978; Bautista, 1982; Todaro & Smith, 2009). Thus, Kamin and Rogers (2000)argue that price in‡ation is a material risk should the real exchange rate beweakened or targeted on a sustained basis. Reinhart (2000) argues that suchnegative e¤ects might be compounded further in the case of emerging marketsby virtue of the fact that the bulk of public and private sector debt often isdenominated in foreign currency. A home currency that is worth less relativeto the foreign currency in which the debt is denominated makes it far moreexpensive to service the debt. In addition, Boltho (1996) claims that the ef-fects of a weakened currency on price elasticities and the real exchange rate arenot perfectly predictable for policy makers. Further, wage in‡ation may alsobe imported with a weakened home currency because workers may seek wageincreases to protect the real purchasing power of their incomes in the face ofprice in‡ation (Owen, 2005).
5
To boot, Liaquat (2011) holds that any competitive advantage conferred bycurrency weakness may be further eroded in the instance that economies ex-perience currency weakness simultaneously. To this end, Liaquat (2011) exam-ines evidence from the 1930s where many countries pursued export-led growthvia price competitiveness by weakening their currencies. The results suggestthat such simultaneous devaluations (or depreciations) created turmoil in for-eign exchange markets and rendered the entire exercise ‘self-defeating’ (Liaquat,2011:97).
Boltho (1996), however, also o¤ers the view that, under a ‡oating exchangerate regime, currency depreciation may result in a temporary increase in sales,thereby conferring only a temporary competitive advantage. All else equal,this increase in sales will elevate cumulative hours of experience and acceleratelearning by doing (Arrow, 1963; Keesing, 1967), thereby taking e¢ciency-driven…rms down their long-run cost curves. In this way, a currency depreciationwould transform a temporary competitive advantage into a sustained advan-tage (Boltho, 1996; Clark, 1996). Berman and Berthou (2009:103) re…ne thisargument in stating that whilst ‘a real depreciation of the exchange rate wouldincrease the volume of exports’, the extent and duration of such an increase isindeterminate.
Junz and Rhomberg (1973) show that the e¤ects of price competitiveness,achieved through a depreciated currency, may take as long as one year to eigh-teen months to present themselves. This is because of a number of lag e¤ects,including recognition lags, whereby it takes buyers time to recognise price com-petitiveness; decision lags, as it takes time for new orders to be placed; deliverylags, as trade ‡ows are recorded upon receipt of payment which may be delayeddue to credit terms of trade; replacement lags, as buyers may need to use upexisting inventories before ordering replacement stock; and production lags, asexport manufacturers take time to increase production to meet enhanced de-mand (Junz & Rhomberg, 1973). Against this backdrop, this paper reportsour …ndings in seeking to understand better the long-run e¤ects of currencydepreciation on exports to ascertain whether signi…cant competitive advantageis inferred in the short run and sustained in the long term.
2.3 Export performance
Export performance has demand- and supply-side e¤ects which may result fromcurrency weakness (Owen, 2005). From a demand perspective, in many in-stances competition is based on price (Razmi, 2007). Currency depreciation in-volves a ‘positive competitiveness e¤ect’ as it may ‘induce an increase in worlddemand for domestic goods, following a decrease in domestic relative prices’(Berman & Berthou, 2009:107). However, Razmi (2007:462) states that in in-stances where developing countries target high-income markets, increased pricecompetition due to a weakening currency may ‘lead to high-income countryprotectionism’ which may include pressure to re-align exchange rates.
The price elasticity of export demand will also in‡uence the impact of cur-rency weakness on the price competitiveness of exports (Bird, 1983). Elasticity
6
of demand for an export product will be greater where export product prices arequoted in domestic currency and hence the e¤ect that currency weakness is ex-pected to have on export demand will be greater (Bird, 1983). Where the priceof export products is quoted in foreign currency, export elasticity of demand islargely irrelevant as depreciation does not e¤ectively reduce the product priceand enhance price competitiveness (Bird, 1983). However, the invoicing cur-rency may determine ‘whether exchange rate ‡uctuations lead to a switching ofdemand between goods produced in di¤erent countries’ because of preferencesfor exchange rate risk (Goldberg & Tille, 2010). Generally, the US dollar hasbeen extensively used as the invoicing currency for global transactions (Gold-berg & Tille, 2010). Thus, the relative strength or weakness of a home currencyto the US dollar speci…cally may further impact the e¤ect of a depreciated homecurrency on export growth.
Currency depreciation may also lead to detrimental supply-side e¤ects re-lating to an economy’s ability to produce and supply exports (Owen, 2005).These factors include labour, infrastructure, technological capability and busi-ness funding. Moreover, at the …rm level currency weakness may induce abalance-sheet e¤ect where …rm’s production capability and ability to competein the export market is reduced. As noted by Berman and Berthou (2009),because the home currency is worth less, a …rm’s ability to fund inputs intoproduction may be reduced as a result.
(i) Export growth Kamin and Rogers (2000) show that a real exchange ratedepreciation boosts aggregate demand across an economy via export growth anda substitution from imports to domestic goods. Bird (1983:474) argues furtherthat currency depreciation induces relative price changes at an aggregate leveland is insu¢ciently selective in its e¤ects as it ‘fails to discriminate betweenindividual sectors or industries’. Prebisch (1964) proposes outward-lookingstrategies to support economic growth, primarily in developing economies. Suchstrategies seek to overcome the constraints of a home economy in the develop-ment of export-oriented industrialization. Thus, improved export performance,or growth in export market share, is supportive of economic growth (Keesing,1967; Svedberg, 1991). Bautista (1982:354) supports this argument and claimsthat ‘superior export performance’ is empirically associated with ‘superior eco-nomic performance’, particularly amongst developing, industrial economies.
However, export performance is a complex variable to de…ne and measure(Lages, 2011), as it has …nancial and non-…nancial measures and may be oper-ationalised and conceptualised in many di¤erent ways. There are internal andexternal factors that may impact on export performance (Lages, 2011). Inter-nal factors include …rm characteristics and competencies, product characteris-tics and management characteristics (Donthu & Kim, 1993); whereas externalfactors comprise industry, foreign market characteristics and domestic marketcharacteristics (Diamantopoulos & Inglis, 1988). Arguably, it is a combinationof these factors that leverage o¤ fundamental productivity, factor endowmentsand demand from abroad which leads to increased export performance.
Notably, an increase in export performance could be seen as an increase inexport market share (Durand & Giorno, 1987); export growth (Sousa, 2004) or
7
an improved balance of trade (Santos-Paulino, 2002) which refers to net exports(Musila & Newark, 2003). Sousa (2004) shows that export growth is one of themost prevalent indicators of export performance in the review of 43 empiricalstudies on export performance published between 1998 and 2004. In this veinexport growth, measured by market-clearing quantity exported, is treated inthis study as indicative of increased market share and is used as the measure ofexport performance in this study.
2.4 E¢ciency-driven economies
Using the de…nition of Schwab (2010), e¢ciency-driven economies are developingeconomies which experience industrial growth, fuelled by exports. E¢ciency-driven economies have an upper GDP limit of $9 000 per capita (Schwab, 2010)and thus fall into the broad classi…cation of developing economies (Clark, 1996).However, there are certain traits that set e¢ciency-driven economies apart fromdeveloping economies.
Tan and Phang (2005:3), state that e¢ciency-driven economies are but-tressed by ‘e¢cient infrastructure’ that facilitates the e¢cient operation of aneconomy and further supports the economy’s export orientation, for example,transportation and telecommunications infrastructure. Supported by an openmarket economy, e¢ciency-driven economies seek to overcome the constraintof a limited domestic market by participating in the export market (Baldauf,Cravens, & Wagner, 2000). Such an outward-looking strategy is intended tosupport export-oriented industrialisation and economic growth (Prebisch, 1964).Acs, Desai, and Hessels (2008) state that e¢ciency-driven economies are char-acterised by large markets which exhibit e¢cient production practices whichallow for economies of scale. Porter (1998) argues that such economies havea strong export orientation to support such economies of scale. In addition,large …rms and multinationals are the primary drivers of these exports that arederived mainly from manufacturing industries (Porter, 1998). The emergence ofsubstantial manufacturing export industries in such developing countries, how-ever, has been a recent development. The Prebisch-Singer hypothesis (Bloch& Sapsford, 2000), based on a historical predominance in the 1950s of primarygood exports from developing countries and industrial imports from developedcountries, showed a deterioration in the terms of trade for developing countriesin their dealings with developed countries. Recent developments in trading pat-terns show dramatic increases in exports of industrial goods from developingcountries (Bloch & Sapsford, 2000), such as the e¢ciency-driven economies,which allow for an improvement in the terms of trade and enhanced price com-petitiveness.
Balassa (1978) argues that an export-oriented growth is preferable for de-veloping economies in a phase of industrialization, because such a focus leadsto more e¢cient resource allocation, greater capacity utilisation, increased em-ployment and technological enhancements. These improvements and advancesare thus in the category of e¢ciency enhancers, which is de…ned as an importantarea of development for e¢ciency-driven economies (Schwab, 2010). E¢ciency
8
enhancers include improvements in goods and labour market e¢ciency; gains inmarket size; …nancial market development; technological readiness; and highereducation and training.
2.5 Empirical …ndings on currency weakness and exportperformance
An examination of the literature on the relationship between currency weak-ness and export performance provides mixed evidence. As early as the 1960s,Prebsich (1964) held that currency depreciation was a means to boost exportperformance through price competitiveness. More recently, Todaro and Smith(2009) also …nd that a nation can improve the competitive position of its ex-ports by reducing the price of its home currency. However, the e¤ects of currencyweakness on export performance are not always found to be positive. For in-stance, Musila (2002) …nds that currency weakness in the case of a small openeconomy worsened export performance in the short run and only marginallyimproved performance in the long run. Calvo and Reinhart (2002) …nd corrob-orating evidence that exports do not initially increase after the weakening of aneconomy’s currency. Rather, they …nd exports initially decline for the …rst eightmonths after a home currency devaluation. This decline is caused by a varietyof factors, including corporate …nancial stress, the drying up of trade credit andincreased costs of imported inputs into export production (Calvo & Reinhart,2002). Frankel (2005), Berman and Berthou (2009) and Lizondo and Montiel(1989) agree with the …nding that exports rebound only moderately and tendonly to reclaim initial levels in the long run rather than achieve higher marketshare.
In this vein, Berman and Berthou (2009) …nd the impact of currency depre-ciation on exports to be negative in 27 developed and developing countries overthe period 1990 to 2005. This negative relationship was particularly prevalentwhen the magnitude of the currency devaluation or depreciation was large; and…nancial market imperfections, such as foreign currency denominated borrow-ings and credit constraints, were present (Berman & Berthou, 2009).
Bautista (1982) found in a study of 23 developing countries between 1973and 1979 that currency depreciation, regardless of magnitude, did not lead to apermanent improvement in export competitiveness for the majority of the sam-ple reviewed. However, small, incremental exchange rate changes were foundto improve export performance more than ‘large, once-and-for-all devaluationsand those under a crawling peg regime’ (Bautista, 1982:372). Even so, improve-ments resulting from the small incremental changes were found to be marginal(Bautista, 1982).
Contrary to earlier …ndings, a simulation analysis performed by Musila andNewark (2003) found that ‘devaluation may help improve export performanceand curtail the growth of imports in the long run in the case of a small, openeconomy. In line with this, Auer and Chaney (2009) found a positive associationbetween depreciation of the real exchange rate and exporting …rms’ volumes.In this vein, Edwards (2011:1) argues that a ‘relatively stable real exchange
9
rate, that does not become overvalued, is a key component of outward-oriented,export based development strategies’. According to Edwards (2011), this isseen in the case of China, which he argues has e¤ectively promoted exports bydeliberately maintaining an undervalued exchange rate.
Regardless of whether improvements in export performance are experiencedas a result of currency weakness, certain unintended consequences may occur.Abeysinghe and Yeok (1998) argue that the greater the proportion of importedinputs into export production, the lesser the impact of currency weakness onexport performance. Pro…t margins e¤ectively narrow to maintain price com-petitiveness in such instances (Abeysinghe & Yeok, 1998). Reduced pro…tabilitymay then negate the bene…ts of export market share growth.
Fears also exist that any increase in export performance may not cover theadditional costs incurred due to the e¤ect of currency depreciation on importcosts (Musila & Newark, 2003). Further, Clark (1996) found that, in the caseof sensitive export products, an importing country may consider the erection ofprotectionist barriers to counteract the e¤ects of signi…cant currency devaluationand apply pressure for a revaluation.
3 DATA AND METHOD
3.1 Research Design
To estimate the impact of currency depreciation on export growth we employa quantitative causal method (Blumberg, Cooper, & Schindler, 2008). Theexplanatory variables in our model are currency and world income to indicatethe purchasing capacity of the international community (Blumberg et al., 2008).Annual changes in global gross domestic product (GDP) are used as a proxyfor growth in world income, similar to the approach used by Owen (2005). Therequired variables for analysis include annual percentage growth in exports ofgoods and services, GDP and annual average real exchange rate (XRAT) againstthe US dollar from 1990 to 2009. Such data was obtained from macroeconomicdatabases, which include the Penn World Table (Heston, Summers, & Aten,2011) and the World Bank (2010b, 2011).
All other economic factors that may impact export performance have beenheld constant in an attempt to isolate the impact and in‡uence of currencyweakness on export performance (the dependent variable) (Blumberg et al.,2008). Such an approach is in line with existing frameworks utilised by sev-eral researchers testing the e¤ects of currency weakness on export or tradebalance performance. These studies have largely adopted either panel datamodels (Berman & Berthou, 2009; Santos-Paulino, 2002); or time series analy-sis (Owen, 2005). Musila and Newark (2003) examine four empirical approachesto such research. Such approaches include a ‘before-and-after’ approach, whichexamines changes in the trade balance at the time of devaluation; a controlgroup approach, where a sample of devaluing countries are compared to a con-trol group of non-devaluing countries; a time series approach; and a macro-
10
simulation model (Musila & Newark, 2003). Several authors are cited regardingall four approaches. However, predominant support is in favour of time seriesand simulation models.
Time series models for individual countries tend to portray a more accuraterepresentation of the relationship, yet have di¢culties in representing the lagstructure between exports and currency weakness (Poon, 1994). In contrast,cross-sectional analysis assumes similar structural and behavioural relationshipsfor all countries within the sample and o¤ers a high level generalisation of therelationship (Poon, 1994). Panel data models comprise cross-sectional and timeseries dimensions and, as such, they allow for a larger number of observationsto be considered whilst providing for country-speci…c and time-speci…c e¤ectsas well as a more accurate representation of lag structures (Dougherty, 2006;Santos-Paulino, 2002). Given the hypotheses formulated, a panel data model isconsidered to be most appropriate for purposes of this study.
There are three models that can be used for analysing panel data. The…rst model, referred to as pooled least squares, combines time-series and cross-sectional data, assuming a common intercept (Mohamad, 2008). The underlyingmodel is then estimated using ordinary least squares which allows for the es-timation of parameters. This model assumes a constant intercept and slope,which Mohamad (2008) argues is unreasonable for such research as interceptsand slope may vary. The second model recognises that omitted variables maylead to changes in the time-series and cross-sectional intercepts (Bond, 2002).This …xed-e¤ects model allows for intercepts to be di¤erent for di¤erent cross-sections (Santos-Paulino, 2002). The third, random-e¤ects model, allows forvariation in cross-sections as well as the periods (Mohamad, 2008). Use of the…xed-e¤ects model is preferred by Santos-Paulino (2002) and Mohamad (2008),and we adopt a similar approach as it allows for cross-sectional variation, whilsta …xed time period is maintained. Drawing on Owen (2005) and Mohamad(2008), we express the export function as:
yit = αit + βiXit + εit (1)
where i(i= 1, . . .n) is the cross-section units (countries) and t(t= 1, . . .T)is the periods. The dependent variable measures the export performance; thevector β is the parameter of interest; and the residual is denoted by ε. Thedesign matrix (x) for the model is as follows:
x = [XRAT,GDP ] (2)
where XRAT is the country’s annual average exchange rate to the US dollar,de…ned such that an increase in XRAT represents a depreciation of the exchangerate against the US dollar. An increasing value for XRAT means that more ofthe country’s home currency is required to purchase one US dollar (Colander,2010). GDP is the annual change in global gross domestic product (Owen,2005; Mohamad, 2008). From this speci…cation, …ve di¤erent models are run,…rst with XRAT; second with XRAT and GDP; third with GDP; fourth withXRAT, GDP and a dummy variable for each country; and last with XRAT, GDP
11
and all countries (composite model). Based on …ndings in earlier research, wealso included a one-year lag e¤ect for each of XRAT and GDP in all of themodel speci…cations.
Given the speci…ed model, measures for the variables in this study, namelyexport performance and currency, require further explanation. Considering ex-port performance, Blades (2000) propose two methods of measuring export per-formance. The …rst measure considers the value of exports as a ratio of grossoutput of domestic producers. The second measure considers the real growthrates of GDP of each export partner country compared with the real growthrate of exports to these countries. In the case of the latter, export market shareis said to be increasing if export growth exceeds real GDP growth (Blades,2000). Gertner, Gertner and Guthery (2007) present an operational de…nitionof export performance, which considers export sales volume, export pro…tabilityand changes in export sales or pro…tability. By contrast, Berman and Berthou(2009), in their study of 27 developed and developing countries, utilise simpleexport volume as a measure of export performance. Building on Berman &Berthou (2009), Sousa (2004) shows that export growth measured in real termsis one of the most prevalent indicators of export performance in a review of43 empirical studies on export performance published between 1998 and 2004.Drawing on this …nding, this study adopts the convention of annual percentagegrowth in exports of goods and services as a measure of export performance,similar to that used by Blades (2000). Exports of goods and services, as an an-nual percentage growth rate is based on constant home currency and representsthe value of all goods and other market services provided to the rest of the world(World Bank, 2010b). These exported goods and services include merchandise,freight, insurance, transport, travel, royalties, license fees, communication, con-struction, …nancial, information, business, personal and government servicesbut exclude compensation of employees and investment income and transferpayments (World Bank, 2010b).
Currency depreciation, as an independent variable, is a reduction in therelative value of the exchange rate (Owen, 2005). Exchange rates, however,have numerous measures (Bautista, 1982). Burstein et al. (2004) and Owen(2005) use the real exchange rate, which is the nominal exchange rate adjustedfor changes in purchasing power. Mohamad (2008) utilises an annual averageexchange rate to the US dollar. Berman and Berthou (2009) use domesticcurrency in terms of special drawing rights (SDR) to account for competitivenessgains. Whilst arguments can be made in favour of each measure, because ofdata limitations; relative data granularity; the makeup of our sample countries’export functions; the prevalence of invoicing in US dollar amongst our samplecountries; and the di¤ering policy implications of targeting a single, predominantcurrency – such as the US dollar – versus a weighted basket of currencies, weemploy the annual average exchange rate to the US dollar (XRAT), in line withMohamad (2008) and as supported by Goldberg and Tille (2010).
12
3.2 Sample Selection
This study focuses on e¢ciency-driven economies, which are global, industrialis-ing economies that have experienced meaningful industrial growth that has beenfuelled by exports (Clark, 1996). As export growth is the dependent variable inthis study, such a measure is most relevant to economies that seek export-ledgrowth (Schwab, 2010). Schwab (2013) de…nes e¢ciency-driven economies as‘Stage Two’ economies with a GDP per capita (in US$) of between $3 000 and$9 000. GDP per capita at market rates is a widely available measure, whichhas been used here as a proxy for wages, as internationally comparable data onwages are not available for all countries covered (Schwab, 2010).
Another criterion used to determine the stage of development is the extentto which a country is driven by basic factors, e¢ciency enhancer or innovation,as shown in Panel A of Table 1. Schwab (2013, 46) notes that the stage ofdevelopment has direct implications for the nature of exports. For instance, inthe case of factor-driven economies, mineral goods typically make up more than70 percent of exports, whereas in e¢ciency-driven economies this number fallsto an average of 40 percent.
The criteria used in the selection of the sample for this study include the spe-ci…c, de facto exchange rate arrangements broadly classi…ed as ‡oating exchangerate arrangements, as denoted in Panel B of Table 1 (IMF, 2008); percentageof GDP derived from manufacturing value-added in order to approximate thepercentage of the economy that is manufacturing based (World Bank, 2009);and the human population number to control for scale and size e¤ects, as ex-plained below (United Nations, 2010). Manufacturing value-added is the netoutput of a sector after adding up all outputs and subtracting intermediate in-puts (World Bank, 2009). This …gure is calculated without making deductionsfor depreciation or depletion of natural resources to denote gross manufacturingvalue-added (World Bank, 2009).
Thresholds have been applied to each criterion for the purposes of sam-ple selection. First, only economies with the de facto ‡oating exchange ratearrangements have been selected. This is done to isolate the e¤ect of marketforces to depreciate or weaken the currency value (Owen, 2005), as opposed to apolicy decision. In addition, under IMF rules, large devaluations are no longernecessary as corrective measures as small, gradual exchange rate adjustmentsare deemed more e¤ective (Bautista, 1982). Second, economies with greaterthan ten percent manufacturing value added as a percentage of GDP have beenincluded in the sample. This is because industrialising nations should havesubstantial manufacturing sectors to support export-oriented economic growth(Chow, 1987). Third, populations greater than one million people were required.Whilst this is a …gure subjectively selected, we deliberately chose a meaningfulpopulation size to exclude “…nancial” economies, such as those in the ChannelIslands or small island economies.
Based on the applied thresholds, we arrived at a list of 12 economies. Fromthis set of 12 we deleted Albania and Romania because of poor data availabil-ity. Data for the remaining ten economies were then gathered for the twenty
13
years from 1990 to 2009. As an aside, given the limitations of such a samplingapproach, it was not anticipated that the sample would be representative of theentire population (Blumberg et al., 2008). However, the sample represents acollective population of more than 600 million people, which we consider to bea good representation of e¢ciency-driven economies with ‡oating rate exchangerate arrangements.
3.3 Speci…cation tests
With the …xed-e¤ects method con…rmed in section 3.1, a number of additionaltests were performed to ascertain the existence of certain e¤ects within the datamodel. Baltagi (2005) notes that cross-sectional dependence may be problem-atic in macro-level panels with long time-series data. This may arise from thepresence of common shocks and unobserved components within the data due toeconomic and …nancial integration of countries, which may imply strong interde-pendencies within the cross-sectional units in the panel (Baltagi, 2005). For thisreason the Breusch-Pagan LM test and the Pesaran CD test for cross-sectionaldependence in panels were run, where the results indicated that cross-sectionaldependence does not exist.
Serial correlation tests were also applied, as macro-level panels with longtime-series data may display correlation over time (Baltagi, 2005). The Breusch-Godfrey/ Wooldridge test was run for serial correlation in panel models, and itwas found that serial correlation is absent in the data.
The Augmented Dickey-Fuller test was used to test for stationarity, and itwas found that the data are stationary at the one percent signi…cance level,hence data transformation was not required (Baltagi, 2005).
Heteroskedascity was the …nal test applied to ascertain the existence of dif-fering variance within the data (Torres-Reyna, 2010). The p-value of 0.07 forthe Breusch-Pagan test suggests the data are homoscedastic. For brevity, thedetailed results of these tests are not provided in this study.
4 ANALYSIS OF RESULTS
4.1 Descriptive statistics
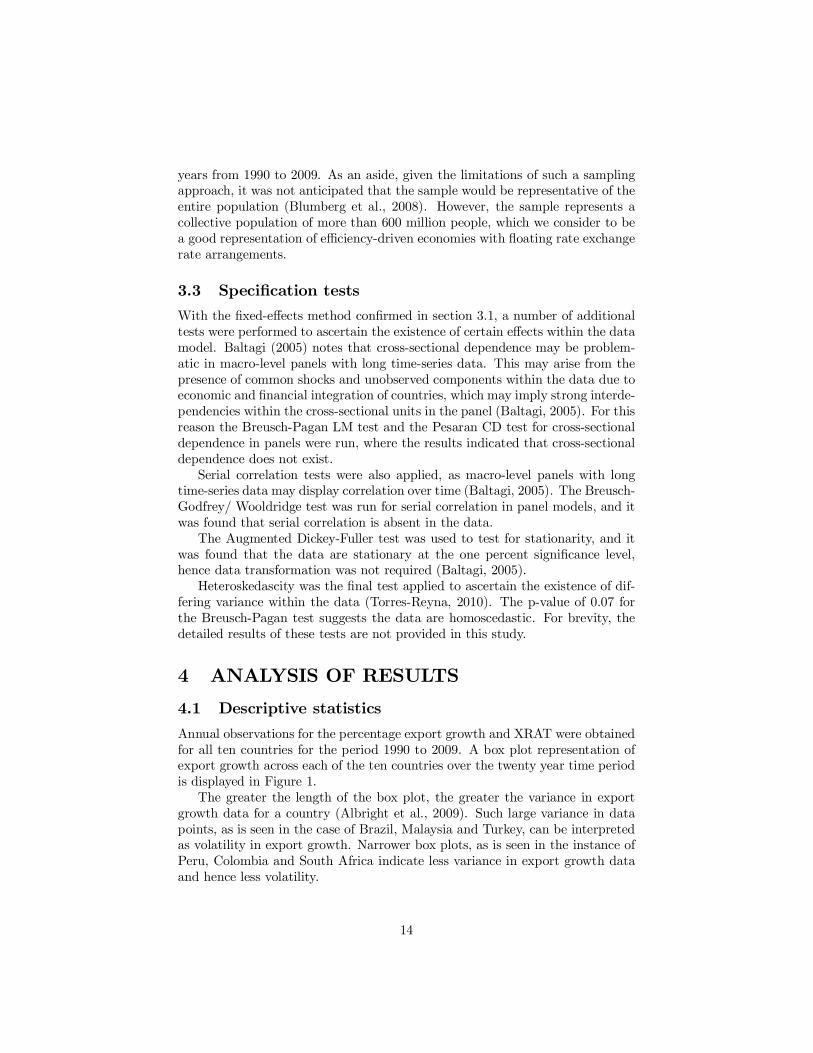
Annual observations for the percentage export growth and XRAT were obtainedfor all ten countries for the period 1990 to 2009. A box plot representation ofexport growth across each of the ten countries over the twenty year time periodis displayed in Figure 1.
The greater the length of the box plot, the greater the variance in exportgrowth data for a country (Albright et al., 2009). Such large variance in datapoints, as is seen in the case of Brazil, Malaysia and Turkey, can be interpretedas volatility in export growth. Narrower box plots, as is seen in the instance ofPeru, Colombia and South Africa indicate less variance in export growth dataand hence less volatility.
14
Table 2 illustrates the mean or average annual export growth values over thetwenty year period. The mean values of export growth per country show that,on average, Brazil, Colombia, Malaysia, Mexico, Peru Thailand and Turkeyhave higher export growth rates than the Dominican Republic, Mauritius andSouth Africa
Relatively poor export market performance is observed for 2001 and 2009which coincide with the bursting of the technology bubble and global economicslowdown and the depths of the global …nancial crisis, respectively. More speci…-cally, data for 2009 shows a signi…cant decline in annual export growth for all tencountries, with all countries experiencing export market contraction or negativegrowth.
XRAT by country for the period 1990 to 2009 is shown in Figure 2. As notedbefore, the longer the box plot, the more variance or volatility the exchangerate displays against the US dollar. Anomalies in the underlying data are seenfor Malaysia for the period 1999 to 2004, when the Malaysian Ringgit wastemporarily …xed at 3.8 to the US dollar (Talib, 2005), before reverting back toa ‡oating exchange rate arrangement. Notably, this does not have a distortinge¤ect on the data.
Data for Colombia reveled that its exchange rate was extremely weak againstthe US dollar, an e¤ect that was worsened by in‡ationary pressures. This outliercreates a signi…cant distortion in the overall data and hence is excluded infurther tests. The sample size is therefore reduced to nine countries, with 180data points which remain available for observation.
A view of the combined XRAT for all nine countries over the twenty yearperiod (not reported in the study for brevity), displays an overall trend of de-preciation or weakening against the US dollar. Thailand, Mauritius and theDominican Republic’s currencies consistently weaken against the US dollar overthe twenty year period, whilst the Brazilian Real, Turkish Lira and PeruvianSol show a more signi…cant depreciation than the previously mentioned threecurrencies.
In the case of Turkey and Brazil the e¤ect is particularly noticeable. Thelow base …gures for 1990 for Turkey and Brazil, however, may distort theseresults somewhat. Turkey experienced signi…cant intervention with regards tothe Lira during the 1990s, as the currency was arti…cially appreciated in ane¤ort to counteract signi…cant in‡ationary pressures (Akyüz & Boratav, 2003).For these reasons the ten year period from 1990 to 1999 has been excluded fromthe data to prevent distortions. In the case of Brazil, the Real was only adoptedin 1994. Prior to that, Brazil had the Cruzeiro from 1990 to 1993 and theCruzeiro Real from 1993 to 1994 (Garcia & Valpassos, 1998). The conversion tothe Real was part of a deliberate policy e¤ort to redress signi…cant in‡ationarypressures experienced in Brazil during this period. This …ve year period upuntil 1994, before adoption of the Real, has therefore been excluded due to thepotential distorting e¤ects on the data. The removal of these …fteen data pointseliminates these distortions, leaving 165 data points used in subsequent testing.
15
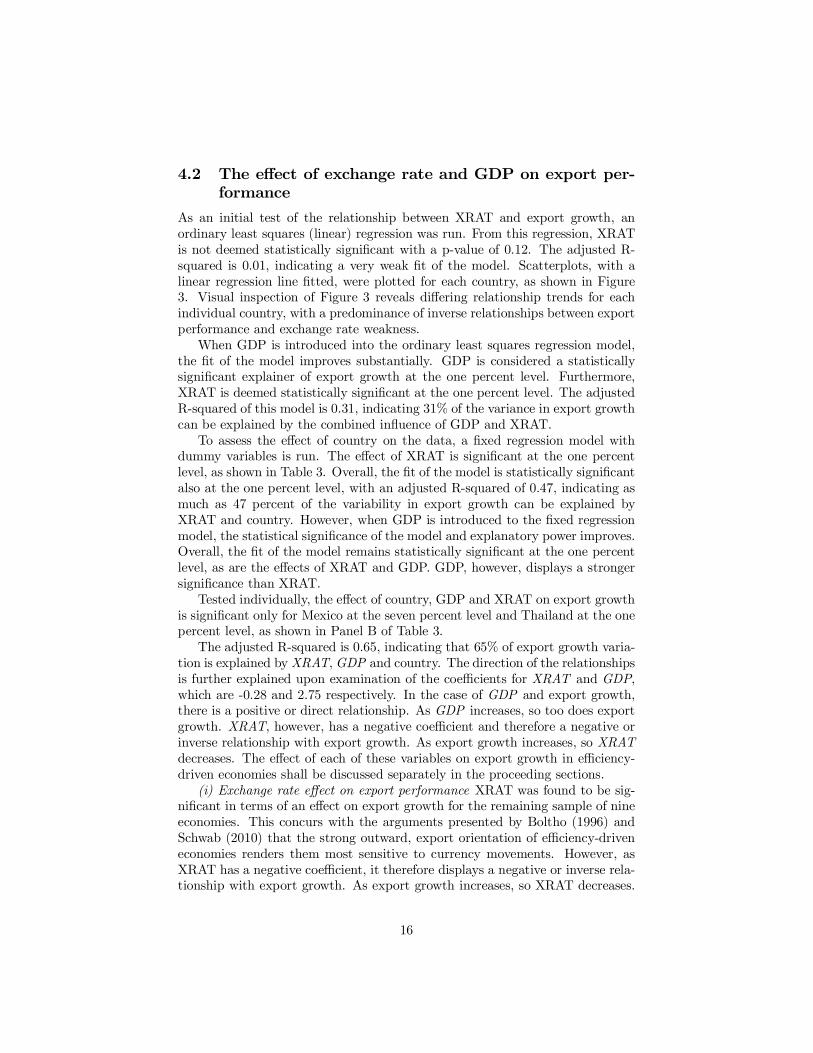
4.2 The e¤ect of exchange rate and GDP on export per-formance
As an initial test of the relationship between XRAT and export growth, anordinary least squares (linear) regression was run. From this regression, XRATis not deemed statistically signi…cant with a p-value of 0.12. The adjusted R-squared is 0.01, indicating a very weak …t of the model. Scatterplots, with alinear regression line …tted, were plotted for each country, as shown in Figure3. Visual inspection of Figure 3 reveals di¤ering relationship trends for eachindividual country, with a predominance of inverse relationships between exportperformance and exchange rate weakness.
When GDP is introduced into the ordinary least squares regression model,the …t of the model improves substantially. GDP is considered a statisticallysigni…cant explainer of export growth at the one percent level. Furthermore,XRAT is deemed statistically signi…cant at the one percent level. The adjustedR-squared of this model is 0.31, indicating 31% of the variance in export growthcan be explained by the combined in‡uence of GDP and XRAT.
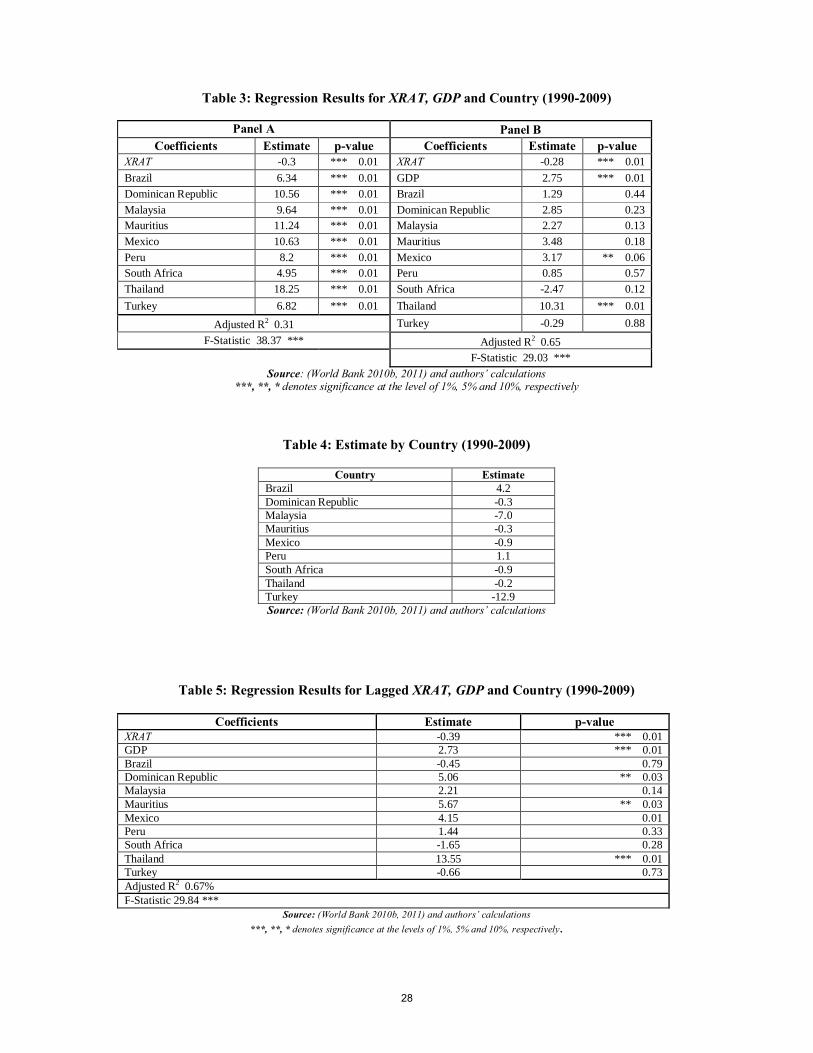
To assess the e¤ect of country on the data, a …xed regression model withdummy variables is run. The e¤ect of XRAT is signi…cant at the one percentlevel, as shown in Table 3. Overall, the …t of the model is statistically signi…cantalso at the one percent level, with an adjusted R-squared of 0.47, indicating asmuch as 47 percent of the variability in export growth can be explained byXRAT and country. However, when GDP is introduced to the …xed regressionmodel, the statistical signi…cance of the model and explanatory power improves.Overall, the …t of the model remains statistically signi…cant at the one percentlevel, as are the e¤ects of XRAT and GDP. GDP, however, displays a strongersigni…cance than XRAT.
Tested individually, the e¤ect of country, GDP and XRAT on export growthis signi…cant only for Mexico at the seven percent level and Thailand at the onepercent level, as shown in Panel B of Table 3.
The adjusted R-squared is 0.65, indicating that 65% of export growth varia-tion is explained by XRAT, GDP and country. The direction of the relationshipsis further explained upon examination of the coe¢cients for XRAT and GDP,which are -0.28 and 2.75 respectively. In the case of GDP and export growth,there is a positive or direct relationship. As GDP increases, so too does exportgrowth. XRAT, however, has a negative coe¢cient and therefore a negative orinverse relationship with export growth. As export growth increases, so XRATdecreases. The e¤ect of each of these variables on export growth in e¢ciency-driven economies shall be discussed separately in the proceeding sections.
(i) Exchange rate e¤ect on export performance XRAT was found to be sig-ni…cant in terms of an e¤ect on export growth for the remaining sample of nineeconomies. This concurs with the arguments presented by Boltho (1996) andSchwab (2010) that the strong outward, export orientation of e¢ciency-driveneconomies renders them most sensitive to currency movements. However, asXRAT has a negative coe¢cient, it therefore displays a negative or inverse rela-tionship with export growth. As export growth increases, so XRAT decreases.
16
These …ndings were consistent at the sample and individual country level. Sevenout of the nine e¢ciency-driven economies displayed the inverse relationship be-tween XRAT and export growth as shown in Table 4.
Brazil and Peru were the two countries that displayed a contrary, direct re-lationship between XRAT and export growth. This may be as a result of thepredominance of commodity-based exports for these countries. However, thisis not observed in the case of South Africa which displays a similar weightingof commodity exports to Brazil and Peru over the survey period. Regardless,the anomalies noted with these two countries do not impact the overall …ndings,given that it is a sample of e¢ciency-driven economies under review, rather thanindividual countries. The resultant relationship indicates a decrease in XRAT –e¤ectively a relative appreciation in the home countries’ currency – correspondswith an improvement in export growth. This allows us to accept the alter-nate hypothesis that export growth is not improved by currency depreciation ine¢ciency-driven economies.
This overall …nding aligns with the results of Lizondo and Montiel (1989),Calvo and Reinhart (2002), Musila (2002), Frankel (2005) and Berman andBerthou (2009), where a weakening currency was found to have a negative ef-fect on export performance. Berman and Berthou (2009:104) reviewed 27 de-veloped and developing countries using a similar method over a shorter timeperiod and found that …nancial market imperfections have a negative impact onthe reaction of countries’ exports to currency depreciation. This negative e¤ectwas particularly prevalent in developing countries with medium to high levelsof foreign currency borrowing and low or intermediate levels of …nancial devel-opment. E¢ciency-driven economies, being a sub-set of developing economiestypically would fall within this categorisation (Schwab, 2010). Financial marketimperfections have not been included in this study, yet the …ndings are con-sistent in terms of the direction of the relationship between export growth andcurrency depreciation. However, quantifying the extent of the e¤ects of currencydepreciation on export growth is problematic. Many studies are silent on thisissue and, at best, refer to the e¤ects as marginal (Bautista, 1982), moderate(Berman & Berthou, 2009) or insigni…cant (Santos-Paulino, 2002) in nature.
In addition, there are a number of ancillary e¤ects that could result fromcurrency weakness, which may negate any improvement in export performanceand thus help explain the …ndings in this research. Kamin and Rogers (2000)found that price in‡ation is a real risk should the real exchange rate be weak-ened on a sustained basis. Signi…cant price in‡ation may therefore result innegative export growth, or negate any improvements, as the price of exportgoods e¤ectively rises (Todaro & Smith, 2009). Further, if workers seek wageincreases to protect the real purchasing power of their incomes in the face ofprice in‡ation then it follows that wage in‡ation would also be imported witha weakened home currency (Owen, 2005).
Boltho (1996) argues further that the e¤ect of currency depreciation on priceelasticities is not always perfectly predictable. A weaker currency, and there-fore cheaper export prices relative to the currency of the purchaser, may notalways result in increased export sales or market growth where export goods
17
display low price elasticity (Boltho, 1996). That said, it is unlikely that this ar-gument applied to a country’s full export basket, but rather to speci…c productsor product sets. In either event, competing on the basis of a relative, weak-ening currency to achieve price competitiveness has been held out as a viablepolicy since the work of Prebisch (1964). This prospect encouraged Prebisch(1964) to regard price-led, export-oriented industrialisation as a driver of eco-nomic growth. Whilst this policy argument remains evident today it must berecognised that the initial argument by Prebisch (1964) was established in aneconomic era where …xed exchange rate arrangements were predominant (Doo-ley et al., 2004). In the current global economic landscape, ‡oating exchangerate arrangements are more prevalent (World Bank, 2010a). This regime switchmeans that the basis for much of this early work on currency weakness maynot apply to the current economic context, and in particular to e¢ciency-driveneconomies with ‡oating exchange arrangements.
All of this said, and as noted, research by Bautista (1982), Abeysinghe andYeok (1998), Musila and Newark (2003) and Auer and Chaney (2009) main-tains that currency weakness improves export performance. However, theseresults are generated on individual countries and on relatively small sample pe-riods. Moreover, these …ndings are challenged by the results of Lizondo andMontiel (1989), Calvo and Reinhart (2002), Musila (2002), Frankel (2005) andBerman and Berthou (2009), who found that currency weakness has no im-pact or a negative impact on export performance. Drawn together, the mixed…ndings in previous research on this topic points to the need for more detailedresearch spanning longer survey periods and embracing more complete countrysets, which is the aim of this study. As such, the …ndings presented in this re-search adds weight to those studies which …nd that currency weakness is not avalid means to improve export growth, and therefore economic growth, throughprice competitiveness. Competing on the basis of currency may further be seenas ‘self-defeating’ (Liaquat, 2011:97) due to the ancillary e¤ects that are asso-ciated with it, as well as the negligible longer-term e¤ects, although we do notdelve into this aspect of the literature in this paper. Nevertheless, our …ndingssuggest that competitive advantage to improve export performance should besought in places other than price competition through currency weakness, suchas fundamental productivity within a country (Econometrix, 2011).
(ii) GDP e¤ect on export performance GDP was found to be a signi…cantvariable in the determinant of export growth, and was noted to be a more sig-ni…cant coe¢cient of determination when compared to XRAT. GDP and exportgrowth display a positive or direct relationship, therefore, as GDP increases sotoo does export growth. GDP may be seen as proxy for income (Owen, 2005);whereas XRAT could be seen as a measure of price from an export perspective(Todaro & Smith, 2009). It therefore follows that, as GDP displays a greatersigni…cance than XRAT, export growth may be impacted to a greater extentby income than price. Anecdotal evidence of this is provided by the signi…cantcontraction in export growth experienced during the global …nancial crisis.
Whilst the two variables each have a signi…cant e¤ect on the variance ofexport growth, the combined e¤ect estimated by our model is even more signif-
18
icant. Speci…cally, the adjusted R-squared value of 0.35 indicates that as muchas one-third of the variance in export growth of e¢ciency-driven economies isexplained by XRAT and GDP. Together, XRAT and GDP provide a measureof purchasing capacity (Mohamad, 2008) and the combined e¤ect is thereforemore signi…cant than price (XRAT) or income (GDP) in isolation.
4.3 Improvements in export growth lag currency depreci-ation
The coe¢cient on XRAT displayed in Table 5 remains negative when a lag ef-fect is applied to our model and therefore underscores the observed negativerelationship between export growth and currency weakness in our simple modelwithout lags. However, a slightly higher absolute value of the coe¢cient ofXRAT is noted in the lagged e¤ects model, indicating that the negative rela-tionship is slightly more pronounced when our model allows for lagged currencyweakness as an explanatory factor. That said, the explanatory power attributedto the lag e¤ects is statistically insigni…cant. Based upon this …nding, the nullhypothesis which
proposed that a currency weakness in e¢ciency-driven economies leads to ex-port growth is therefore, rejected. In passing, we note that Junz and Rhomberg(1973) found that the lag e¤ects of price competitiveness, achieved through aweaker currency, may take as long as one year to 18 months to present them-selves. However, these …ndings apply to a period of …xed exchange rates. Still,a case can be made to extend our models to allow for lag e¤ects of longer than12 months.
5 CONCLUSIONS
The purpose of the research was to assess whether e¢ciency-driven economies,developing could achieve export growth through the price competitiveness e¤ectthat is brought about by currency depreciation. In this regard, Prebisch (1964)developed the early arguments that currency weakness was a means to boostexport performance through price competitiveness. Subsequent research hasproduced mixed results and has tended to be limited in terms of sample sizeand survey period. Hence, further research in this …eld is justi…ed.
Our principal …nding in this regard, which extends to a sample of nineeconomies over a period of twenty years, is that a weakened currency does notimprove export performance. Contrary to popular thinking, our …ndings showthat export growth is associated with currency strength in the case of e¢ciency-driven economies with ‡exible exchange rate regimes. Moreover, when we allowfor lag e¤ects of exchange rate movement, we …nd that the impact on exportperformance is slightly more pronounced – although the explanatory power ofcurrency moved is statistically insigni…cant in the lagged speci…cations of ourmodel. Moreover, we …nd that any explanatory power a¤orded by currency is
19
superseded by the explanatory power of GDP growth. This suggests that exportgrowth may be impacted to a greater extent by income than price.
5.1 Recommendations
The research has policy implications concerning exchange rate as a tool to pro-mote export-led growth. Current global conditions, where many economies arecompeting in a somewhat stressed economic environment have bought to preva-lence the concept of competition based on currency weakness (Ahamed, 2011).Given our …nding that a weakened currency does not improve export growthin e¢ciency-driven economies, we infer that such policy action would invoke a“race to the bottom” (Liaquat, 2011).
If anything, the declining purchasing power and weaker country balancesheet that follow from currency weakness would ensure that countries, …rmsand individuals are worse o¤. Further, whilst we do not evidence this, it maywell be the case that the desired price competitiveness may instead manifestin price in‡ation and wage in‡ation because of imported in‡ation pass-throughmechanism. Resources spent in attempting to weaken or manipulate the ex-change rate would be wasted and attention diverted from where it is needed.Further, whilst we do not show this, our …ndings suggest that policies thatfocus on improvements in fundamental productivity, e¢cient use of factor en-dowments, generating demand from abroad and providing a stable investmentenvironment would be considerably more e¤ective in boosting export perfor-mance than policies that imagine prosperity gains can be “bought” through aweaker currency.
5.2 Areas for further research
These recommendations suggest future research using, as a basis, the theorycovered and observations made as part of this study. Future research couldfocus on the e¤ect of exchange rate movements on export growth in factor-or innovation-driven economies. Sector based analysis could also be performedwithin the population of e¢ciency-driven economies to take account of priceelasticity of demand and industry-level e¤ects. Firm-level data could also beinvestigated to understand the supply-side e¤ects and variation in margins oftrade associated with a relative, weakening exchange rate (Berman & Berthou,2009). A greater consideration of lag e¤ects could also cast di¤erent light onthe …ndings of our study, as well as a consideration of real e¤ective exchangerates in place of a single currency model.
The inclusion of further explanatory variables, such as …nancial market im-perfections and other country-speci…c variables would lead to a more re…nedmodel, and potentially more signi…cant results. We did not consider this in ane¤ort to isolate the relationship between currency and export performance. Avolatile exchange rate may also create an environment in which it is di¢cult topredict costs and prices, which may be highly disruptive to trade ‡ows. Suchan e¤ect has not been considered here and would bene…t from further study.
20
More importantly, the social costs of currency depreciation, such as diminishednational wealth or an increased cost of living, need to be better understood andresearched (Owen, 2005).
References
[1] ABEYSINGHE, T. and YEOK, T. (1998). Exchange rate appreciation andxxport competitiveness: The case of Singapore. Journal of Applied Eco-nomics, 30 (1): 51-55.
[2] ACS, Z. J., DESAI, S. and HESSELS, J. (2008). Entrepreneurship, eco-nomic development and institutions. Small Business Economics, 31 (3):219-234.
[3] ACS, Z. and AUTIO, E. (2011). The global entrepreneurship and develop-ment Index: A brief explanation. London. UK.
[4] AHAMED, L. (2011). Currency wars, then and now. Foreign a¤airs, 90 (2):92-103.
[5] AKYÜZ, Y. and BORATAV, K. (2003). The making of the Turkish Finan-cial Crisis. World Development, 31(9): 1549 - 1566.
[6] ALBRIGHT, S. C., WINSTON, W. L. and ZAPPE, C. J. (2009). Dataanalysis and decision making. Mason, Ohio, United States of America:South-Western Cengage Learning.
[7] ARROW, K. J. (1963). The economic implications of learning by doing.The Review of Economic Studies, 29(3): 155-173.
[8] AUER, R. and CHANEY, T. (2009). Exchange rate pass-through in a com-petitive model of pricing-to-market. Journal of Money, Credit and Banking,41 (1): 151-175.
[9] BALASSA, B. (1978). Exports and economic growth: Further evidence.Journal of Development Economics, 5 (2): 181-189.
[10] BALDAUF, A., CRAVENS, D. W. and WAGNER, U. (2000). Examiningdeterminants of export perfromance in small open economies. Journal ofWorld Business, 35 (1): 61-79.
[11] BALTAGI, B. H. (2005). Econometric analysis of panel data (3rd ed.).Chichester, West Sussex, England: John Wiley & Sons Ltd.
[12] BAUTISTA, R. M. (1982). Exchange rate variances and export competi-tiveness in less developed countries under generalised ‡oating. The Journalof Development Studies, 18 (3): 354-378.
21
[13] BERMAN, N. and BERTHOU, A. (2009). Financial market imperfectionsand the impact of exchange rate movements on exports. International Re-view of Economics, 17 (1): 103-120.
[14] BIRD, G. (1983). Should developing countries use currency depreciationas a tool of Balance of Payments adjustment? A review of the theory andevidence, and a guide for the policy maker. The Journal of DevelopmentStudies, 19 (3): 461-484.
[15] BLADES, D. (2000). Foreign trade statistics: Workshop on economic sta-tistics. Organisation for Economic Co-operation and Development.
[16] BLOCH, H. and SAPSFORD, D. (2000). Whither the terms of trade: Anelaboration of the Prebisch-Singer Hypothesis. Cambridge Journal of Eco-nomics, 24 (4): 461-481.
[17] BLUMBERG, B., COOPER, D. and SCHINDLER, P. (2008). Businessresearch methods (2nd Edition ed.). London: McGrawHill.
[18] BOLTHO, A. (1996). The assessment: International competitiveness. Ox-ford Review of Economic Policy, 12(3): 1-15.
[19] BOND, S. (2002). Dynamic panel data models: A guide to micro data meth-ods and practice. Centre for Microdata Methods and Practice.
[20] BURSTEIN, A., EICHENBAUM, M. and REBELO, S. (2004). Large deval-uations and the real exchange rate. National Bureau of Economic ResearchWorking Paper No. w10986
[21] CALVO, G. A. and REINHART, C. M. (2002). Fear of ‡oating. The Quar-terly Journal of Economics, 117 (2): 379-408.
[22] CHOW, P. C. (1987). Causality between export growth and industrial de-velopment: Empirial evidence from the NICs. Journal of Development Eco-nomics, 26 (1): 55-63.
[23] CLARK, M. A. (1996). Non-traditional export promotion in Costa Rica:Sustaining export-led growth. Journal of Interamerican Studies & WorldA¤airs, 37 (2): 181-223.
[24] COLANDER, D. C. (2010). Macroeconomics. New York, USA: McGraw-Hill.
[25] DIAMANTOPOULOS, A. and INGLIS, K. (1988). Identifying di¤erencesbetween high- and low-involvement exporters. International Marketing Re-view, 5 (25): 52-60.
[26] DOLAN, M. (2010). Global currency war: G20 talks needed to avert forexwar. Reuters: Retrieved December 9, 2010.
22
[27] DOLLAR, D. (1992). Outward-oriented developing economies really dogrow more rapidly: Evidence from 95 LDCs. Economic Development andCultural Change, 40 (3): 523-544.
[28] DONTHU, N. and KIM, S. H. (1993). Implications of …rm controllablefactors on export growth. Journal of Global Marketing, 7 (1): 47-64.
[29] DOOLEY, M. P., FOLKERTS-LANDAU, D. and GARBER, P. (2004).The revived Bretton Woods System. International Journal of Finance andEconomics, 9 (4): 307-313.
[30] DOUGHERTY, C. (2006). Introduction to Econometrics (3rd ed.). Oxford:Oxford University Press.
[31] DURAND, M. and GIORNO, C. (1987). Indicators of international com-petitiveness: Conceptual aspects and evaluation. OECD economic studies,9 (2): 147-97.
[32] ECONOMETRIX. (2011). Further evidence why Rand devaluation is a mis-placed policy: Analysis of the e¤ect of exchange rate volatility on the tradebalance. Econometrix.
[33] EDWARDS, S. (2011). Exchange rates in emerging countries: Eleven em-pirical regularities from Latin America and East Asia. National Bureau ofEconomic Research Working Paper No. w17074.
[34] FRANKEL, J. A. (2005). Contractionary currency crashes in develop-ing countries. National Bureau of Economic Research Working Paper No.w11508.
[35] GARCIA, M. G. and VALPASSOS, M. V. (1998). Capital ‡ows, capitalcontrols and currency crisis: The case of Brazil in the nineties. Brasil:Ponti…cal Catholic University of Rio de Janeiro - Department of Economics.
[36] GERTNER, R. K., GERTNER, D. and GUTHERY, D. (2007). The im-plications of export performance measurement for the signi…cance of thedeterminants of export performance. Journal of Global Marketing, 20 (1):21-38.
[37] GOLDBERG, L. S. and TILLE, C. (2010). Micro, macro, and strategicforces in international trade invoicing. National Bureau of Economic Re-search Working Paper No. w15470.
[38] HESTON, A., SUMMERS, R. and ATEN, B. (2011). Penn World TableVersion 7.0. Center for International Comparisons of Production, Incomeand Prices, University of Pennsylvania.
[39] IMF. (2009). World Economic Outlook.
[40] IMF. (n.d.). Special Drawing Rights. International Monetary Fund
23
[41] JUNZ, H. B. and RHOMBERG, R. R. (1973). Price competitiveness inexport trade among industrial countries. The American Economic Review,63 (2): 412-418.
[42] KAISER, E. and WROUGHTON, L. (2010). Global currency war: Cur-rency war fears tinge IMF meetings. Reuters: Retrieved December 9, 2010.
[43] KAMIN, S. B. and ROGERS, J. H. (2000). Output and the real Exchangerate in developing countries: An application to Mexico. Journal of Devel-opment Economics, 61 (1): 85-109.
[44] KEESING, D. B. (1967). Outward-looking policies and economic develop-ment. The Economic Journal, 77 (306): 303-320.
[45] KRUGMAN, P. R. and OBSTVELD, M. (1997). International economics:Theory and policy. Reading, MA: Addison-Wesley.
[46] LAGES, L. F. (2011). A conceptual framework of the determinants of ex-port performance. Journal of Global Marketing, 13 (3): 29-51.
[47] LIAQUAT, A. (2011). Currency wars, then and now. Foreign A¤airs,90 (2): 92-103.
[48] LIZONDO, J. S. and MONTIEL, P. J. (1989). Contractionary devaluationin developing countries: An analytical overview. Sta¤ papers - InternationalMonetary Fund, 36(1): 182-227.
[49] MILLMAN, G. J. (1990). The ‡oating battle…eld: Corporate strategies incurrency wars. AMACOM.
[50] MOHAMAD, S. (2008). Exchange rates and export growth in Asianeconomies. Asian Social Science, 4 (11): 30-36.
[51] MUSILA, J. W. (2002). Exchange rate changes and trade balance adjust-ments in Malawi. Canadian Journal of Development Studies, 23 (1): 69-85.
[52] MUSILA, J. W. and NEWARK, J. (2003). Does currency devaluation im-prove trade balance in the long run? Evidence from Malawi. African De-velopment Review, 15 (2): 339-352.
[53] MUSSA, M. and ROSEN, S. (1978). Monopoly and product quality. Journalof Economic Theory, 18 (2): 301-317.
[54] OWEN, J. R. (2005). Currency devaluation and emerging economy exportdemand. London, England: Ashgate Publishing.
[55] POON, J. (1994). E¤ects of World demand and competitivesness on exportsand economic growth. Growth and Change, 25 (1): 3-24.
[56] PORTER, M. E. (1998). The competitive advantage of nations. New York:The Free Press.
24
[57] PREBISCH, R. (1964). Towards a new trade policy for development. NewYork: United Nations.
[58] PREBSICH, R. (1950). The economic development of Latin America andits principal problems. Lake Success: The United Nations Department ofEconomic A¤airs.
[59] RAZMI, A. (2007). Pursuing manufacturing-based export-led growth: Aredeveloping countries increasingly crowding each other out? StructuralChange and Economic Dynamics, 18 (4): 460-482.
[60] REINHART, C. M. (2000). The mirage of ‡oating exchange rates. TheAmerican Economic Review, 90 (2): 65-70.
[61] ROSTOW, W. W. (1960). The stages of economic growth, a Non-Communist Manifesto. Cambridge: University Press.
[62] SANTOS-PAULINO, A. (2002). Trade Liberalization and Export Perfor-mance in Selected Developing Countries. Journal of Development Studies,39 (1): 140-158.
[63] SCHWAB, K. (2010). The Global Competitiveness Report 2010-2011. WorldEconomic Forum: Geneva, Switzerland.
[64] SCHWAB, K. (2013). The Global Competitiveness Report 2013-2014. WorldEconomic Forum: Geneva, Switzerland.
[65] SOUSA, C. M. (2004). Export performance measurement: An evaluationof the empirical research in the literature. Academy of Marketing ScienceReview, 9 (12): 1-23.
[66] SVEDBERG, P. (1991). The Export Performance of Sub-Saharan Africa.Economic Development and Cultural Change, 39 (3): 549-566.
[67] TALIB, A. L. (2005). Pegging The Ringgit against The US Dollar: Anevaluation.
[68] TAN, K. and PHANG, S. (2005). From e¢ciency-driven to innovation-driven economic growth: Perspectives from Singapore. World Bank Publi-cations, 3569.
[69] TODARO, M. and SMITH, S. (2009). Economic Development (6th ed.).London: Addison-Wesley.
[70] TORRES-REYNA, O. (2010). Panel data analysis: Fixed and RandomE¤ects (using Stata 10. x)(Ver. 4.1). Panel 101, Princeton University.
[71] UNITED NATIONS DEPARTMENT OF ECONOMIC. (2010). World pop-ulation prospects. United Nations Publications.
25
[72] WORLD BANK. (2009). World Development Indicators online: Manu-facturing, Value-Added (% GDP). The World Bank: Development DataGroup.
[73] WORLD BANK. (2010a). Data: How we classify countries. The WorldBank.
[74] WORLD BANK. (2010b). Data: Exports of Goods and Services (annual %growth). The World Bank.
[75] WORLD BANK. (2011). World Data Bank. World Development Indicators(WDI) and Global Development Finance (GDF).
26
Table 1, Panel A: Weights of the Three Main Sub-Indexes at Each Stage of Development Sub-index Factor-driven stage (%) Efficiency-driven stage (%) Innovation-driven stage (%)
Table 1, Panel B: Sample of Efficiency-Driven Economies Stage 2 economies Floating Exchange rate arrangement Manufacturing, value added, as % GDP Population
('000) Thailand Managed Float with no pre-determined path 34% 68139 Malaysia Managed Float with no pre-determined path 25% 27914 Dominican Republic Managed Float with no pre-determined path 24% 10225 Mauritius Managed Float with no pre-determined path 19% 1297 Mexico Independently floating 17% 110645 Turkey Independently floating 17% 75705 Brazil Independently floating 15% 195423 South Africa Independently floating 15% 50492 Colombia Managed Float with no pre-determined path 14% 46300 Peru Managed Float with no pre-determined path 14% 29496
Source: IMF, 2008; World Bank, 2009; Schwab, 2010; United Nations, 2010
Table 2: Average Annual Export Growth (1990 to 2009)
Country Average Annual Export Growth (%) Brazil 6.0% Colombia 5.6% Dominican Republic 4.1% Malaysia 8.7% Mauritius 3.9% Mexico 8.1% Peru 7.4% South Africa 3.2% Thailand 7.9% Turkey 7.7%
Source: World Bank (2010b) and authors’ calculations
27
Table 3: Regression Results for XRAT, GDP and Country (1990-2009)
Panel A Panel B Coefficients Estimate p-value Coefficients Estimate p-value
XRAT -0.3 *** 0.01 XRAT -0.28 *** 0.01 Brazil 6.34 *** 0.01 GDP 2.75 *** 0.01 Dominican Republic 10.56 *** 0.01 Brazil 1.29 0.44 Malaysia 9.64 *** 0.01 Dominican Republic 2.85 0.23 Mauritius 11.24 *** 0.01 Malaysia 2.27 0.13 Mexico 10.63 *** 0.01 Mauritius 3.48 0.18 Peru 8.2 *** 0.01 Mexico 3.17 ** 0.06 South Africa 4.95 *** 0.01 Peru 0.85 0.57 Thailand 18.25 *** 0.01 South Africa -2.47 0.12 Turkey 6.82 *** 0.01 Thailand 10.31 *** 0.01
F-Statistic 29.03 *** Source: (World Bank 2010b, 2011) and authors’ calculations
***, **, * denotes significance at the level of 1%, 5% and 10%, respectively
Table 4: Estimate by Country (1990-2009)
Country Estimate Brazil 4.2 Dominican Republic -0.3 Malaysia -7.0 Mauritius -0.3 Mexico -0.9 Peru 1.1 South Africa -0.9 Thailand -0.2 Turkey -12.9 Source: (World Bank 2010b, 2011) and authors’ calculations
Table 5: Regression Results for Lagged XRAT, GDP and Country (1990-2009)
Coefficients Estimate p-value XRAT -0.39 *** 0.01 GDP 2.73 *** 0.01 Brazil -0.45 0.79 Dominican Republic 5.06 ** 0.03 Malaysia 2.21 0.14 Mauritius 5.67 ** 0.03 Mexico 4.15 0.01 Peru 1.44 0.33 South Africa -1.65 0.28 Thailand 13.55 *** 0.01 Turkey -0.66 0.73 Adjusted R2 0.67% F-Statistic 29.84 ***
Source: (World Bank 2010b, 2011) and authors’ calculations ***, **, * denotes significance at the levels of 1%, 5% and 10%, respectively.
28
Figure 1: Export Growth by Country (1990-2009)
Source: World Bank (2010b, 2011) and authors’ calculations
Figure 2: XRAT by Country (1990-2009)
Source: World Bank (2010b, 2011) and authors’ calculations
0
1
2
3
4
Brazil
0
500
1,000
1,500
2,000
2,500
3,000
Colombia
0
10
20
30
40
50
Dominican Republic
2.4
2.8
3.2
3.6
4.0
Malaysia
12
16
20
24
28
32
Mauritius
2
4
6
8
10
12
14
Mexico
0
1
2
3
4
Peru
2
4
6
8
10
12
South Africa
20
25
30
35
40
45
Thailand
0.0
0.4
0.8
1.2
1.6
Turkey
Exch
ange
Rate
-20
-10
0
10
20
30
40
Expo
rt G
row
th
B o xp lo t C o u n t ry
29
Figure 3: Scatterplot of Country Export Growth and XRAT (1990-2009)
Source: World Bank (2010b, 2011) and authors’ calculations