Nagla Harb., (JAAUTH), Vol. 17 No. 2, 2019, pp. 55-68.
55
Exchange Rate Volatility and Tourism Stock Prices: Evidence from Egypt
Nagla Harb Sayed Ahmed AbdAllah1
Alexandria University
ARTICLE INFO Abstract Tourism is a key stimulator of economic growth and foreign currency
in Egypt. As an export sector, it could affect and be affected by
changes in exchange rate. This paper investigates the dynamic
relationship between exchange rate and tourism stock prices and
examines the effect of exchange rate volatility on tourism stock prices
in the Egyptian Exchange (EGX). Exchange rate is proxied by the
USD/EGP official values. Granger causality test and ARCH/GARCH
models are employed. Results provide an evidence of a unidirectional
causal relationship between the tested variables from exchange rate to
tourism stock price. The estimations of the GARCH model reveal that
exchange rate variance accelerates stock price variance, and
depreciation in the EGP against USD enhances tourism stock
performance. Findings provide decision-makers, financial managers,
and investors with a better understanding of how exchange rate
volatility affects the stock performance of tourism companies in the
EGX, and offer researchers new directions for future research.
Introduction
With the development of the tourism industry and its increasing contribution to the national
economy of Egypt, it is manifesting itself as a sun rise industry. Its role as a locomotive for
economic development and a main source of foreign currency has become increasingly
prominent. According to the World Travel & Tourism Council (WTTC) (2019), in 2018 the
Egyptian tourism industry grew by 16.5%. A rate that is significantly higher than the Egyptian
GDP growth rate (5.6%) (cbe.org.eg), and the global travel and tourism industry growth rate
(3.9%) (WTTC, 2019). It contributed to the GDP by 11.9% and added $12.2 billion to the
foreign revenues (WTTC, 2019). Such figures show that tourism can provide massive business
opportunities to Egypt and accelerate its economic growth.
In 2016, due to the foreign currency shortage, the Central Bank of Egypt (CBE) decided to
abandon the managed float and allow the Egyptian currency to float freely. Following this
decision, the value of the Egyptian currency plummeted. The Egyptian pound (EGP) devalued by
32.3% and continued to lose value. As an illustration of the continued depreciation of the EGP's
value, before the float decision, in October 2016 a U.S. dollar (USD) was worth 8.8 EGP, as per
May 2017, the exchange rate was 18.1 USD/EGP (cbe.org.eg). Egyptian authorities argued that
the devaluation of the EGP would lead to improvements in the balance of trade, a positive effect
on the tourism sector in terms of inbound arrivals and receipts, as well as a positive impact on
foreign direct investment, and that stocks would become cheaper to foreign investors.
Keywords: Exchange rate; Tourism
companies; Stock price;
GARCH; Egypt.
(JAAUTH) Vol. 17, No. 2,
(2019),
pp.55 -68.
Nagla Harb., (JAAUTH), Vol. 17 No. 2, 2019, pp. 55-68.
56
Exchange rate has been demonstrated in literature as a major determinant of performance
of the tourism industry in a destination, mainly in terms of foreign tourist arrivals, travel costs,
tourism competitiveness, and corporate profits (e.g. Agiomirgianakis et al., 2014; Ruane and
Claret, 2014; De Vita and Kyaw, 2013; Alalaya, 2010; Webber, 2001; Crouch, 1993). Obi et
al., (2015) state that the exchange rate is a key risk factor found to particularly impact inbound
tourism. Chang et al., (2013) affirm that exchange rate fluctuations present a risk to firms in the
tourism industry. Greenwood (2007) presents evidence of the direct influence of exchange rate
on the spending behavior of inbound tourists during their visit, as they spend less when the value
of the domestic currency appreciates. Several empirical studies attempt to examine the impact of
exchange rate on the tourism industry in different destinations in terms of tourism flows and
revenues (See for example: Sharma and Pal., 2019; Karimi et al., 2018; Falk, 2015;
Agiomirgianakis et al., 2014; Saayman and Saayman, 2013; Tang, 2013; Alalaya, 2010; Quadri
and Zheng, 2010). The relation between the exchange rate and the performance of firms in the
tourism sector has not been grossly examined yet. Scarce research attempt to examine the
relation between exchange rate and stock performance of tourism companies at various
destinations. However, to the best knowledge of the researcher, no study could yet be found to
look into this interaction in Egypt. This study is therefore the pioneer in this field of research. It
is motivated by the important role played by the tourism industry in enhancing economic growth
and its contribution to foreign earnings in Egypt, the significance of capital markets in
transferring financial resources to the tourism sector and securing its sustainable growth and
development, and finally the gap in tourism literature on the macroeconomic variables and their
impact on the equity market.
By using econometric methodology, this research aims at investigating the dynamic
relation between exchange rate and tourism stock prices and identifying the impact of exchange
rate volatility on tourism stock prices in the EGX. Identifying factors that influence tourism
stock performance in the equity market is very important and of major interest to decision-
makers, financial executives, and investors.
1- Literature Review
There is a consensus in literature that exchange rate is a major determinant of tourism industry in
destinations. It has been suggested that destination choice, expenditure behavior and length of
stay are more likely to be influenced by fluctuations in foreign exchange rates for international
tourists (Akar, 2012; Webber, 2001). Theoretically, an appreciation in a destination’s currency
implies that inbound tourists need to spend more and weakens the competitiveness of the
destination. While with the domestic currency depreciation, more potential inbound visitors are
willing to visit the destination and can extend stay period and increase expenditure (Crouch,
1993).
Several empirical researches attempt to investigate the relation between exchange rate
and tourism demand and revenues. For example, Gan, (2015) applied four models to explore the
relationship between various economic variables, including exchange rate, and the tourism
demand, measured by tourist arrivals and expenditure, in 218 countries panel, between 1995-
2012. Results reported that a depreciation of national currency helps boosting the arrivals and the
spending level. Saayman and Saayman (2013) employed Generalized Autoregressive
Conditional Heteroscedasticity (GARCH) and Autoregressive Distributed Lag (ADL) models to
examine the impact of exchange rate volatility on tourism in South Africa between 2003 and
Nagla Harb., (JAAUTH), Vol. 17 No. 2, 2019, pp. 55-68.
57
2010. Results specified that when volatility raises tourists seems to be taking lower risks and
spending less, also increased currency volatility leads to arrivals decrease. Similarly, De Vita and
Kyaw (2013) used (GARCH) model to examine the relationship between exchange rate volatility
and German tourists in Turkey from 1996 to 2009. Results recognized exchange rate as a
significant determinant of tourism demand in Turkey. Several studies have shown that the
exchange rate has no significant effect on tourism demand. For example, Quadri and Zheng
(2010) studied the relation between exchange rates and international arrivals in Italy and found
that the exchange rates have no impact on 11 out of the 19 countries under review. Similarly,
Vanegas and Croes (2000) found that the exchange rate has no significant impact on the tourism
demand from the USA to Aruba.
Moving from establishing the relation between exchange rate and tourism demand and
expenditure, to focusing on investigating the relationship between exchange rate and the
performance of tourism companies, and more precisely stock prices, theoretically, explaining the
relation between exchange rate and stock prices in general could be built on various
macroeconomic approaches including the Dividend Discount Model (DDM), and the Portfolio
Balance Approach (PBA).
The Dividend Discount Model (DDM) assumes that a firm’s intrinsic value is equivalent
to the present value of all anticipated future dividends (Corelli, 2017). Building on this theory
export-based firms that receive their revenues in foreign currencies and pay their costs in
domestic currency would be affected by the fluctuations of the domestic currency against foreign
currencies from the side of revenues. The depreciation of domestic currency would increase
revenues. As a result, the profit would increase leading to higher earnings and return on
investment (ROE) and hence higher stock price for the firm (Muzindutsi, 2011). Muzindutsi
(2011) asserts that the impact of exchange rate on the value of a firm will depend upon its
exposure to exchange rate. Similarly, Abdalla and Murinde (1997) and Soenen and Hennigar
(1988) affirm that the response of domestic firms to real exchange fluctuations tends to differ
from the response of multinational corporations.
The Portfolio Balance Approach (PBA) assumes that investors and companies hold their
financial assets in combination of domestic bonds and foreign bonds. Exchange rate fluctuations
affect the wealth of investors and companies that hold assets denominated in foreign currency.
Thus, changes in currency risks (as a result of exchange rate fluctuations) may lead to the
adjustment of the portfolio. The adjustment directly impacts the demand and supply for the
domestic and the foreign stocks. This shift in the demand/supply for stocks may in turn influence
the exchange rate (Stavárek, 2005; Moffett et al., 2003; Granger et al., 2000). In developing
countries, where exchange rates are volatile, “Capital Flight” may also elucidate the relation
between exchange rate and stock prices. It demonstrates that foreign currency devaluation is
often the trigger for large-scale capital flight, as investors flow from the country before their
assets lose too much value (Yalta, 2010; Suarez, 1990).
Stepping to empirical studies that test the link between exchange rate and stock
performance in general, although the topic has been widely examined, there is no agreement
regarding the interaction between stock prices and exchange rates. Empirical studies have
produced mixed results, and it seems to be a market structure case. (See for example Mechri et
al., 2019 in two countries from MENA zone; Sani and Hassan, 2018 in Nigeria; Walid et al.,
2011 in emerging countries; Aydemir and Demirhan 2009 in Turkey; Azar, 2013 and Kim,
Nagla Harb., (JAAUTH), Vol. 17 No. 2, 2019, pp. 55-68.
58
2003 in USA; Anshul and Biswal, 2016 and Singh, 2015 in India ; Nieh and Lee 2001, in G7
countries; Suriani et al., 2015 in Pakistan; Zhao, 2010 in China; Wu 2000 in Singapore )
In Egypt, Parsva and Lean (2011) examined the macroeconomic determinants of stock
prices in 6 Middle Eastern countries including Egypt, using monthly data from 2004 to 2010.
They applied Johansen cointegration model and the Granger causality test to their research.
Egypt’s findings proved the existence of two-way causality between stock price and exchange
rate. Micheal (2018) analyzed the dynamic relation between stock market and exchange rate in
Egypt using Engle-Granger cointegration method from January 2009 to December 2017. Results
reported a unidirectional causality relationship between the tested variables specifying that
exchange rate has a causal impact on stock prices in the Egypt.
Focusing on the tourism industry, studies that investigate the interaction between the two
variables are very rare. Bogdan (2019) investigated the impact of four macro-variables, including
exchange rate, on the stock returns of the hospitality companies in Croatia for July 2008- July
2018, using Vector autoregression (VAR) model. Results suggested that the exchange rate
doesn’t Granger-cause the stock returns in the hospitality industry.
Demir et al., (2017) used VAR methodology to examine the impact of eight macro-
economic variables, including exchange rate, on returns of tourism stock in Turkey, over the
period 2005-2013, taking the systemic break that took place in 2007 into consideration. The pre-
break findings indicated that the exchange rate does Granger cause stock returns of tourism
companies. However, the results in the post-structural break period revealed that the exchange
rate is not significant.
Chang et al., (2013) examined the size impacts of volatility spillovers for performance of
firms and exchange rates with asymmetry tourism industry in Taiwan using two conditional
multivariate models, BEKK-AGARCH and VARMA-AGARCH. Data were proxied by returns
on tourism stock and returns on exchange rates of the three main markets (USD/NTD,
JNY/NTD, and CNY/NTD). The empirical findings indicated that there are size impacts on
volatility spillovers from the exchange rate to the performance of firms. Results also showed a
negative cointegration between exchange rate returns and stock returns.
Finally, Chan and Lim (2011) explored the relation between hospitality and tourism stock
prices and macroeconomic factors on a selected sample of hospitality and tourism companies in
New Zealand for the period 1998-2009 using cointegration analysis and Vector Error Correction
Model (VECM). The results proved the presence of a cointegration vector between the stock
returns of tourism companies and exchange rate.
2- Data and Methodology
The data set consists of monthly data over the period from June 2010 to December 2019 on
exchange rate and tourism stock prices. The reason for selecting this period is that exchange rate
regime is determined as freely floating in 2016. Sources include ‘Monthly Economic Trends’
published by the CBE website (cbe.org.eg), and Egyptian Exchange (EGX).
Exchange rate is proxied by the USD/EGP official daily value published by the CBE. In
this research nominal exchange rate, which measures the relative price of two currencies is used
in order to take into account inflationary effects, as used by Bahmani-Oskooee and Saha (2016)
Nagla Harb., (JAAUTH), Vol. 17 No. 2, 2019, pp. 55-68.
59
and Anshul and Biswal (2016). The increase in value means appreciation of USD and
depreciation of EGP.
As per December 2019, 18 tourism and hospitality companies are listed and active in the EGX. Measure of stock market price captures the monthly prices of 14 firms of publicly- listed hospitality and tourism companies (Remco Tourism Villages Construction Company RTVC; Orascom Development Egypt ORHD; El Wadi for Touristic Investment ELWA; Marsa Alam for Tourism Development MMAT; Egyptian Resorts EGTS; Egyptian Company for International Touristc Projects EITP; Golden Pyramids Plaza GPPL; Misr Hotels MHOT; Pyramisa Hotels and Resorts PHTV; Al Rowad ROTO; Trans Oceans Tours TRTO; Sharm Dreams SDTI; Golden Coast Elsokhna for Touristic Investment GOCO and Genial Tours GETO). 4 companies were excluded, 3 companies due to insufficient data (Rowad Misr RMTV; El Shams Pyramids SPHT and Sky Light Touristic Development SLTD), 1 company due to interference with the real-estate index (Mena Touristic and Real-estate Investment MENA).
According to the objectives of this research, different econometric-based models are applied.
-Granger causality test: used to investigate the possible causal relationship between exchange rate and stock prices of tourism companies. It is a commonly used technique based on time-series regressions (Engle and Granger, 1987).
-ARCH/GARCH models: applied in modeling the exchange rate volatility in relation to tourism stock returns. GARCH is a Generalized Autoregressive Conditional Heteroscedasticity ARCH model developed by Bollerslev (l986) and Taylor (1986). The ARCH models are widely used to investigate the effects of financial volatility in literature (Engle, 1982; Mechri et al., 2019). The predictive power of the simple and most robust GARCH (1,1) model challenges others (Hansen and Lunde, 2005).
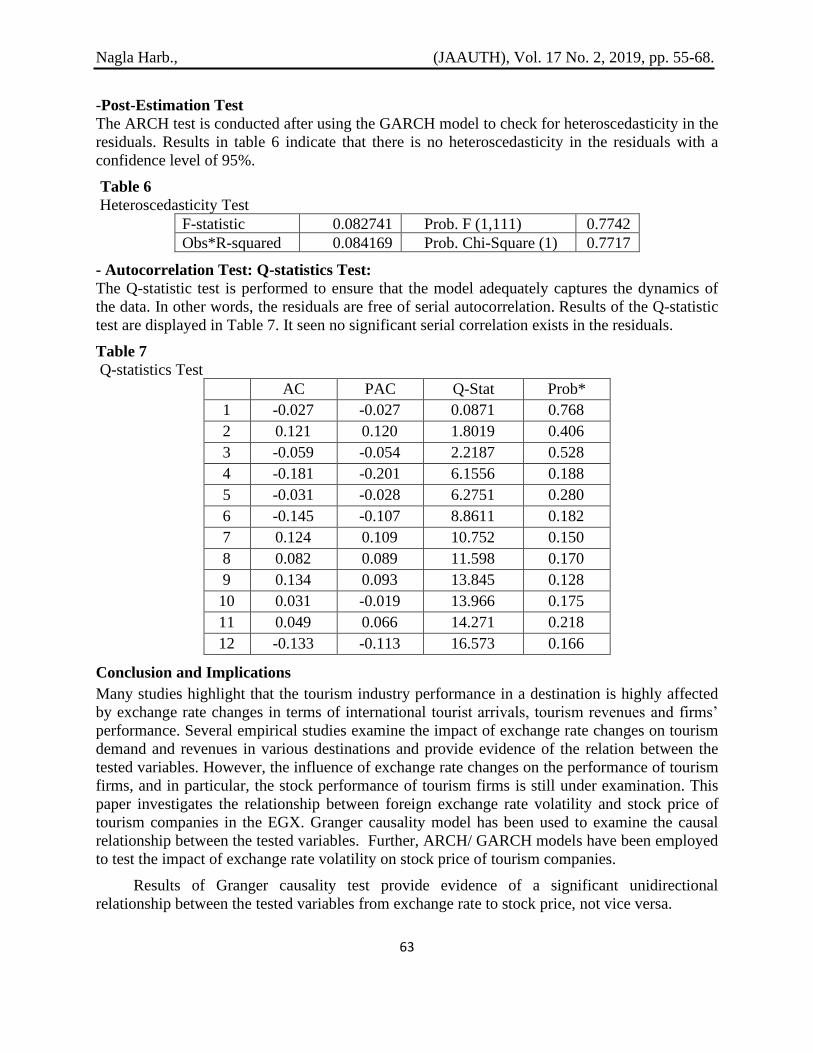
3- Analysis and Findings
(3-1) Descriptive Statistics:
Descriptive statistics are presented in table 1. As shown the mean and median of exchange rate
are 10.33 and 7.52 respectively. The minimum value of exchange rate equals 5.52 and the
maximum value is 18.7. For all the companies in the sample during the study period the mean
and the median of stock price are 8.2, 7.8 respectively, with a minimum value of 5.66 and a
maximum value of 11.6.
Table 1
Descriptive Statistics of Variables Exchange Rate Stock Price
Mean 10.33956 8.203698 Median 7.525123 7.800123 Maximum 18.73594 11.62989 Minimum 5.520487 5.664903 Std. Dev. 5.108841 1.640220 Skewness 0.698131 0.385434 Kurtosis 1.597130 1.904978 Jarque-Bera 18.60855 8.518220 Probability 0.000091 0.014135 Observations 115 115
Nagla Harb., (JAAUTH), Vol. 17 No. 2, 2019, pp. 55-68.
60
Figure 1 represents the line plot for stock prices, and figure 2 represents line plot for exchange
rate.
5
6
7
8
9
10
11
12
2010 2011 2012 2013 2014 2015 2016 2017 2018 2019
Stock price
Figure 1. Line Plot for Stock Prices
4
6
8
10
12
14
16
18
20
2010 2011 2012 2013 2014 2015 2016 2017 2018 2019
Exchange rate
Figure 2. Line Plot for Exchange Rate
(3-2) Unit Root Test
Analysis requires that the variables should be stationary throughout the investigated period.
Augmented Dickey-Fuller (ADF) is applied to determine whether the data series is stationary
(has no unit root) or not, by calculating the respective statistics and p-values in the main level
(Dickey & Fuller, 1981).
Table 2 provides the ADF test results. As seen both of the variables under consideration are
non-stationary in their levels and become stationary when they are first differenced at the 1%
significance level, implying that the variables are first order integrated I (1).
Table 2
Unit Root Test ADF
Variable ADF p-value
Exchange rate -0.9358 0.7735
First difference of exchange rate -8.143 0.0000***
Tourism stock price -2.216 0.2016
First difference of stock price -10.909 0.0000*** ***1% significance.
Note: Lags are determined using the Schwartz Bayesian criterion.
Nagla Harb., (JAAUTH), Vol. 17 No. 2, 2019, pp. 55-68.
61
(3-3) Linear Granger Causality Test
Linear Granger causality test is employed to investigate the causal relationship between the
measured variables. The test estimates the following regression model;
Where is the stock price at time t, exchange rate at time t and , and are
regression parameters. The error term is assumed to be normally distributed and independent.
F-statistics for the Granger causality test the null hypotheses which are “ does not Granger-
cause ”: and “ does not Granger-cause ".
The results are reported in Table 3. As shown the null hypothesis that “ER does not
Granger-cause SP” is rejected at the 5% significance level, while the null hypothesis that “SP
does not Granger-cause ER” is not rejected at all significance levels. This means that there is a
unidirectional causality running from the exchange rate to the stock price of tourism companies
in the EGX.
Table 3
Granger Causality Test Results
Null Hypothesis F-Statistic Prob.
“ER does not Granger cause SP” 3.07155 0.0382**
“SP does not Granger cause ER” 1.00305 0.318
**5%, significance.
Note: Lags are determined based on the Schwartz Bayesian criterion.
(3-4) GARCH Model
To estimate the volatility of returns of tourism stocks in relation to exchange rate volatility
GARCH Model is employed. Past square measurement values and past variances are used for
modeling the variance at time t. By definition, the GARCH model (1.1) is depicted in two
equations:
A- Mean equation:
C1 is the sensitivity of stock price return related to first lag of stock price; C2 is the sensitivity
of the stock price return related to the first difference of exchange rate.
B- Variance equation (GARCH model):
C3 is the intercept term for variance equation; C4 is the coefficient first lag of ARCH parameter;
C5 is the coefficient first lag of GARCH parameter; C6 is the effect of exchange rate volatility
on stock return.
- Heteroscedasticity Test ARCH
A first step is to determine the best-fitting autoregressive model for the analysis. The ARCH test
is performed to check for ARCH effects in the residuals. The results are presented in table 4.
Nagla Harb., (JAAUTH), Vol. 17 No. 2, 2019, pp. 55-68.
62
Table 4
Heteroscedasticity Test: ARCH
F-statistic 1.998062 Prob. F(9,95) 0.0478
Obs*R-squared 16.71204 Prob. Chi-Square(9) 0.0434
Results in table 4 indicate that the null hypothesis “no heteroscedasticity in the residuals” is
rejected, then the GARCH (1,1) model is appropriate for the test. Accordingly, GARCH (1,1)
model is applied to our test. Results of the mean and variance equations are displayed in table 5.
Table 5
GARCH (1,1) Results
A Coefficient Std. Error z-Statistic Prob.
AVERAGE_OF_EXCHANGE_RATE 0.199424 0.020196 9.874659 0.0000
C 6.050895 0.194269 31.14705 0.0000
Variance Equation
C 0.274272 0.762407 2.779751 0.0056
RESID (-1)^2 0.896812 0.445340 2.013768 0.0440
GARCH (-1) 0.056355 0.125943 2.237012 0.0257
AVERAGE_OF_EXCHANGE_RATE 0.071577 0.168190 2.349786 0.0188
R-squared 0.122552 Mean dependent var 8.203698
Adjusted R-squared 0.114718 S.D. dependent var 1.640220
S.E. of regression 1.543274 Akaike info criterion 3.207052
Sum squared residuals 266.7498 Schwarz criterion 3.351062
Log likelihood -176.8020 Hannan-Quinn criter. 3.265498
Durbin-Watson stat 0.191847
In table5 the upper part represents the mean equation; coefficients are positive and statistically
significant at the 1% level, indicating that a positive relationship exists between stock return and
exchange rate return. The mean of stock return is 6.050895, and the exchange rate can
significantly predict its current series by 0.199%, which represents a weak exchange rate effect.
The estimations of the variance equation (GARCH) in table 5 show that the coefficient of
the constant term, ARCH term and GARCH term are positive and statistically significant at the
5% level indicating that volatility clustering exists during the study period. The sum of the two
estimated ARCH and GARCH coefficients (persistence coefficient) is approximately 0.9 which
is close to unity suggesting that volatility shocks are highly persistent, and the effect of current
shock remains in the forecasts of stock return variance for many periods in the future.
Moreover, exchange rate coefficient is positive and statistically significant. This implies that
exchange rate variance accelerates stock price variance. So, we can infer that the depreciation in
the EGP against USD enhances tourism stock performance. The value of the adjusted R-square
indicates that exchange rate can explain 12% from the variations in the tourism stock return.
Nagla Harb., (JAAUTH), Vol. 17 No. 2, 2019, pp. 55-68.
63
-Post-Estimation Test
The ARCH test is conducted after using the GARCH model to check for heteroscedasticity in the
residuals. Results in table 6 indicate that there is no heteroscedasticity in the residuals with a
confidence level of 95%.
Table 6
Heteroscedasticity Test
F-statistic 0.082741 Prob. F (1,111) 0.7742
Obs*R-squared 0.084169 Prob. Chi-Square (1) 0.7717
- Autocorrelation Test: Q-statistics Test:
The Q-statistic test is performed to ensure that the model adequately captures the dynamics of
the data. In other words, the residuals are free of serial autocorrelation. Results of the Q-statistic
test are displayed in Table 7. It seen no significant serial correlation exists in the residuals.
Table 7
Q-statistics Test
AC PAC Q-Stat Prob*
1 -0.027 -0.027 0.0871 0.768
2 0.121 0.120 1.8019 0.406
3 -0.059 -0.054 2.2187 0.528
4 -0.181 -0.201 6.1556 0.188
5 -0.031 -0.028 6.2751 0.280
6 -0.145 -0.107 8.8611 0.182
7 0.124 0.109 10.752 0.150
8 0.082 0.089 11.598 0.170
9 0.134 0.093 13.845 0.128
10 0.031 -0.019 13.966 0.175
11 0.049 0.066 14.271 0.218
12 -0.133 -0.113 16.573 0.166
Conclusion and Implications
Many studies highlight that the tourism industry performance in a destination is highly affected
by exchange rate changes in terms of international tourist arrivals, tourism revenues and firms’
performance. Several empirical studies examine the impact of exchange rate changes on tourism
demand and revenues in various destinations and provide evidence of the relation between the
tested variables. However, the influence of exchange rate changes on the performance of tourism
firms, and in particular, the stock performance of tourism firms is still under examination. This
paper investigates the relationship between foreign exchange rate volatility and stock price of
tourism companies in the EGX. Granger causality model has been used to examine the causal
relationship between the tested variables. Further, ARCH/ GARCH models have been employed
to test the impact of exchange rate volatility on stock price of tourism companies.
Results of Granger causality test provide evidence of a significant unidirectional
relationship between the tested variables from exchange rate to stock price, not vice versa.
Nagla Harb., (JAAUTH), Vol. 17 No. 2, 2019, pp. 55-68.
64
The results from the mean equation reveal that a positive significant relationship exists
between the tested variables and the exchange rate can significantly predict current series of
stock return by 0.199%, a value that reflects a weak exchange rate effect. The estimated normal
GARCH (1.1) model also indicates that volatility shocks are highly persistent, and the effect of
current shock remains in the forecasts of stock return variance for many periods in the future.
Moreover, exchange rate variance accelerates stock return variance.
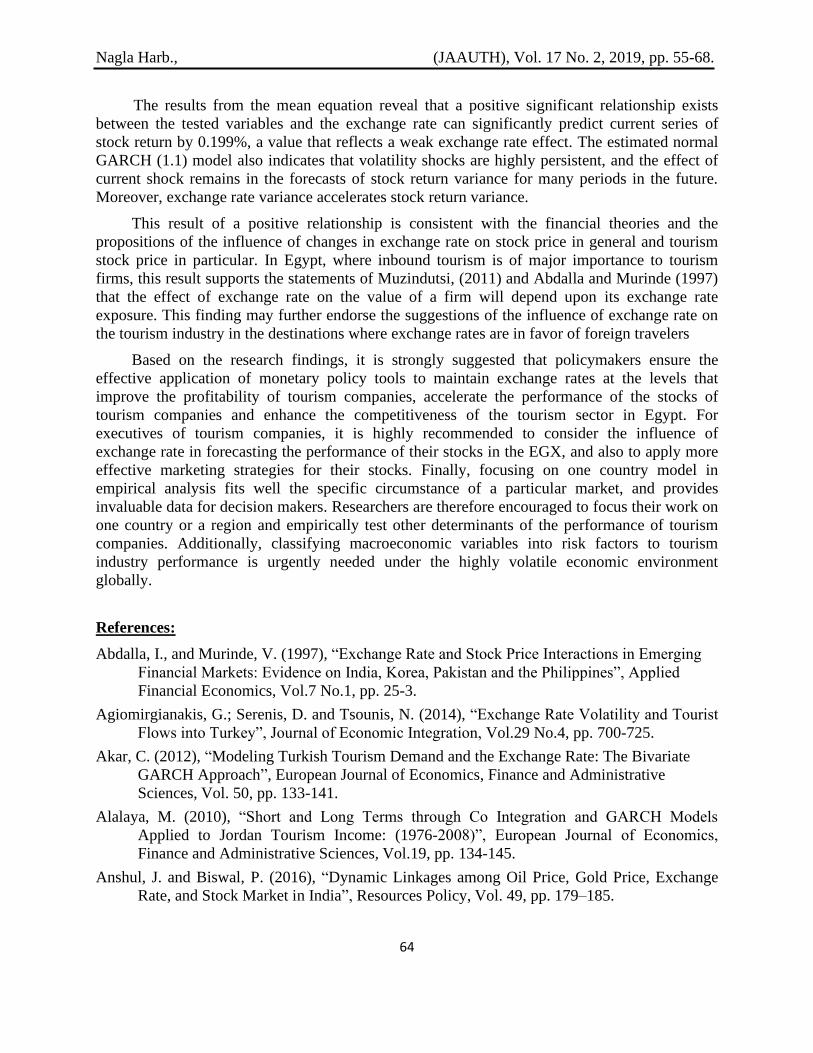
This result of a positive relationship is consistent with the financial theories and the
propositions of the influence of changes in exchange rate on stock price in general and tourism
stock price in particular. In Egypt, where inbound tourism is of major importance to tourism
firms, this result supports the statements of Muzindutsi, (2011) and Abdalla and Murinde (1997)
that the effect of exchange rate on the value of a firm will depend upon its exchange rate exposure. This finding may further endorse the suggestions of the influence of exchange rate on
the tourism industry in the destinations where exchange rates are in favor of foreign travelers
Based on the research findings, it is strongly suggested that policymakers ensure the
effective application of monetary policy tools to maintain exchange rates at the levels that
improve the profitability of tourism companies, accelerate the performance of the stocks of
tourism companies and enhance the competitiveness of the tourism sector in Egypt. For
executives of tourism companies, it is highly recommended to consider the influence of
exchange rate in forecasting the performance of their stocks in the EGX, and also to apply more
effective marketing strategies for their stocks. Finally, focusing on one country model in
empirical analysis fits well the specific circumstance of a particular market, and provides
invaluable data for decision makers. Researchers are therefore encouraged to focus their work on
one country or a region and empirically test other determinants of the performance of tourism
companies. Additionally, classifying macroeconomic variables into risk factors to tourism
industry performance is urgently needed under the highly volatile economic environment
globally.
References:
Abdalla, I., and Murinde, V. (1997), “Exchange Rate and Stock Price Interactions in Emerging
Financial Markets: Evidence on India, Korea, Pakistan and the Philippines”, Applied
Financial Economics, Vol.7 No.1, pp. 25-3.
Agiomirgianakis, G.; Serenis, D. and Tsounis, N. (2014), “Exchange Rate Volatility and Tourist
Flows into Turkey”, Journal of Economic Integration, Vol.29 No.4, pp. 700-725.
Akar, C. (2012), “Modeling Turkish Tourism Demand and the Exchange Rate: The Bivariate
GARCH Approach”, European Journal of Economics, Finance and Administrative
Sciences, Vol. 50, pp. 133-141.
Alalaya, M. (2010), “Short and Long Terms through Co Integration and GARCH Models
Applied to Jordan Tourism Income: (1976-2008)”, European Journal of Economics,
Finance and Administrative Sciences, Vol.19, pp. 134-145.
Anshul, J. and Biswal, P. (2016), “Dynamic Linkages among Oil Price, Gold Price, Exchange
Rate, and Stock Market in India”, Resources Policy, Vol. 49, pp. 179–185.
Nagla Harb., (JAAUTH), Vol. 17 No. 2, 2019, pp. 55-68.
65
Aydemir, O. and Demirhan, E. (2009),”The Relationship between Stock Prices and Exchange
Rates Evidence from Turkey”, International Research Journal of Finance and Economics,
Vol. 1 No.23, pp. 207-215.
Azar, S. (2013), “US Stocks and the US Dollar”, International Journal of Financial Research,
Vol.4 No.4, pp. 91-106.
Bahmani-Oskooee, M. and Saha, S. (2016),“Asymmetry Cointegration between the Value of the
Dollar and Sectoral Stock Indices in the U.S”, International Review of Economics &
Finance, Vol. 46 No. C, pp. 78-86.
Bogdan, S. (2019), “Macroeconomic Impact on Stock Returns in the Croatian Hospitality
Industry”, Zbornik Veleučilištau Rijeci, 7(1), pp. 53-68.
Bollerslev, T. (1986), “Generalized Autoregressive Conditional Heteroskedasticity”, Journal of
Econometrics, Vol.31 No.3, pp. 307-327.
Central Bank of Egypt CBE, cbe.org.eg
https://www.cbe.org.eg/en/EconomicResearch/Statistics
Chan, F. and Lim, C. (2011), “Tourism Stock Performance and Macro Factors”,19th
International Congress on Modeling and Simulation, Australia, 12–16 December 2011
Chang, C.; Hsu, H. and Mc Aleer, M. (2013), “Volatility Spillovers for Stock Returns and
Exchange Rates of Tourism Firms in Taiwan”, 20th International Congress on Modeling
and Simulation, Adelaide, Australia, 1–6 December 2013
Corelli, A. (2017) Inside Company Valuation, Springer, Switzerland, pp. 15-27
Crouch, G. (1993), “Currency Exchange Rates and the Demand for International Tourism”, The
Journal of Tourism Studies, Vol. 4 No.2, pp. 45-53.
Demir, E.; Alici, A. and Lau, C. (2017), “Macro Explanatory Factors of Turkish Tourism
Companies’ Stock Returns”, Asia Pacific Journal of Tourism Research, Vol. 22 No.4, pp.
1-11.
De Vita, G. and Kyaw, K. (2013), “Role of the Exchange Rate in Tourism Demand”, Annals of
Tourism Research, Vol. 43 No.4, pp. 624–27.
Dickey, D. and Fuller, W. (1981), “Likelihood Ratio Statistics for Autoregressive Time Series
with a Unit Root”, Econometrica, Vol. 49 No.4, pp. 1057-1072.
Engle, R. (1982), “Autoregressive Conditional Heteroskedasticity with Estimates of the Variance
of U.K. Inflation”, Econometrica, Vol. 50 No.4, pp. 987-1008.
Engle, R. and Granger, C. (1987), “Co-Integration and Error-Correction: Representation,
Estimation and Testing”, Journal of Econometrics, Vol. 55 No. 2, pp. 251-276.
Falk, M. (2015), “The Sensitivity of Tourism Demand to Exchange Rate Changes: An
Application to Swiss Overnight Stays in Austrian Mountain Villages during the Winter
Season”, Current Issues in Tourism, Vol. 18, pp. 465–76.
Gan, Yi (2015), “An Empirical Analysis of the Influence of Exchange Rate and Prices on
Tourism Demand”, Project Submitted as Partial Requirement for the Conferral of a M.Sc.
in Business Administration, ISCTE-IUL, Business School, and Department of Economics
Nagla Harb., (JAAUTH), Vol. 17 No. 2, 2019, pp. 55-68.
66
Granger, C.; Huang, B-N. and Yang C. (2000), “A Bivariate Causality between Stock Prices and
Exchange Rates: Evidence from Recent Asian Flu”, The quarterly review of economics
and finance : Journal of the Midwest Economics Association ; Journal of the Midwest
Finance Association, Vol.40, pp. 337-354.
Greenwood, C. (2007), “How Do Currency Exchange Rate Influence the Price of Holidays?”,
Journal of Revenue and Pricing Management, Vol. 6 No. 4, pp. 272-273.
Hansen, P. and Lunde, A. (2001), “A Comparison of Volatility Models: Does Anything Beata
GARCH (1,1)?”, Working Paper, Center for Analytical Finance, pp. 1-51.
Kim, K. (2003), “Dollar Exchange Rate and Stock Price: Evidence from Multivariate
Cointegration and Error Correction Model”, Review of Financial Economics, Vol. 12
No.3, pp. 301-313.
Karimi, M.; Khan, A. and Karamelikli, H. (2018), “Asymmetric Effects of Real Exchange Rate
on Inbound Tourist Arrivals in Malaysia: An Analysis of Price Rigidity”, International
Journal of Tourism Research, Vol. 21, pp. 156-164.
Mechri, N.; Ben Hamad S.; Peretti, C. and Charfi, S. (2019), “The Impact of the Exchange Rate
Volatilities on Stock Market Returns Dynamic: Evidence from Tunisia and Turkey”, hal
01766742v2f. https://hal.archives-ouvertes.fr/hal-01766742v2/document (accessed on
20/9/2019)
Micheal, J. (2018), “The Dynamic Relationship between Stock Prices and Exchange Rate- An
Egyptian Experience”, International Journal of Research in Economic and Social
Sciences, Vol. 8 No.2, pp. 1-7.
Moffett, M.; Stonehill, A.; and Eiteman, D. (2003) “Fundamentals of Multinational Finance”,
Addison Wesley, Boston.
Muzindutsi, P.(2011), “Exchange Rate Shocks and the Stock Market Index: Evidence From the
Johanseburg Stock Exchange”, A dissertation submitted in fulfillment of the requirements
for the degree of Master of Commerce School of Economics and Finance Faculty of
Management Studies University of KwaZulu-Natal.
Nieh, C. and Lee, C. (2001), “Dynamic Relationship Between Stock Prices and Exchange Rates
for G-7 Countries”, The Quarterly Review of Economics and Finance, Vol. 41 No.4, pp.
477-490.
Obi, P.; Sil, S. and Abuizam R. (2015), “Tourism Stocks, Implied Volatility and Hedging:
A Vector Error Correction Study”, Journal of Accounting and Finance, Vol.15 No.8, pp. 30-39.
Parsva, P. and Lean, H.H. (2011), “The Analysis of Relationship between Stock Prices and
Exchange Rates: Evidence from Six Middle Eastern Financial Markets”, International
Research Journal of Finance and Economics, Vol. 66, pp. 157-171.
Quadri, D. and Zheng, T. (2010), “A Revisit to the Impact of Exchange Rates on Tourism
Demand: The Case of Italy”, Journal of Hospitality Financial Management, Vol.18, pp.
47–60.
Ruane, M.and Claret, M. (2014), “Exchange Rates and Tourism: Evidence from the Island of
Guam”, Journal of Economics and Economic Education Research, Vol.15 No.2, pp. 165-
185.
Nagla Harb., (JAAUTH), Vol. 17 No. 2, 2019, pp. 55-68.
67
Saayman, A. and Saayman, M. (2013), “Exchange Rate Volatility and Tourism - Revisiting the
Nature of The Relationship”, European Journal of Tourism Research, Vol. 6 No.2, pp.
104-121.
Sani, B. and Hassan, A. (2018), “Exchange Rate and Stock Market Interactions: Evidence from
Nigeria”, Arabian Journal of Business and Management Review, Vol. 8 No.1, pp. 1-5.
Sharma D. and Pal, D. (2019), “Exchange Rate Volatility and Tourism Demand in India:
Unraveling the Asymmetric Relationship”, Journal of Travel Research, First
https://doi.org/10.1177/0047287519878516 (accessed on 9/9/2019)
Singh, G. (2015), “Relationship between Exchange Rate and Stock Price in India: An Empirical
Study”, The IUP Journal of Financial Risk Management, Vol. XII No. 2, pp. 18-29.
Soenen, L. and Hennigar, E. (1988), “An Analysis of Exchange Rates and Stock Prices- The US
Experience Between 1980 and 1986”, Akron Business and Economic Review, Vol. 19
No.4, pp. 7-16.
Stavárek, D. (2005), “Stock Prices and Exchange Rates in the EU and the USA: Evidence of
their Mutual Interactions”, Journal of Economics and Finance, Vol. 55, pp. 141-161.
Suarez, L. (1990), Risk and Capital Flight in Developing Countries, IMF Working Paper.
International Monetary Fund, USA.
Suriani, S.; Kumar, D.; Jami, F. and Muneer, S. (2015), “Impact of Exchange Rate on Stock
Market”, International Journal of Economics and Financial Issues, Vol. 5, pp. 385-388.
Taylor, S. (1986), “Modeling Financial Time Series”, Wiley and Sons: New York.
Tang, C. (2013), “Temporal Granger Causality and the Dynamic Relationship between Real
Tourism Receipts, Real Income and Real Exchange Rates in Malaysia”, International
Journal of Tourism Research, Vol. 15 No.3, pp. 272–84.
Vanegas, M. Sr. and Croes, R.R. (2000), “Evaluation of demand US Tourists to Aruba”. Annals
of Tourism Research, Vol. 27 No.4, pp. 946-963.
Walid, C.; Chaker, A.; Masood, O. and Fry, J. (2011), “Stock Market Volatility and Exchange
Rates in Emerging Countries: A Markov-State Switching Approach”, Emerging Markets
Review, Vol. 12, pp. 272–292.
Webber, A. (2001), “Exchange Rate Volatility and Co-integration in Tourism Demand”, Journal
of Travel Research, Vol. 39, pp. 398-405.
World Travel and Tourism Council WTTC (2019), Egypt 2019 Annual Research: Key
Highlights. https://www.wttc.org/economic-impact/country-analysis/country-data/#un
defined (accessed on 12/9/2019)
Wu, Y. (2000), “Stock Prices and Exchange Rates in VEC Model—The Case of Singapore in the
1990s”, Journal of Economics and Finance, Vol. 24 No.3, pp. 260-274.
Yalta, Y. (2010), “Effect of Capital Flight on Investment: Evidence from Emerging Markets,
Emerging Markets”, Finance & Trade, Vol. 46 No.6, pp. 40-54.
Zhao, H. (2010), “Dynamic Relationship between Exchange Rate and Stock Price: Evidence
from China”, Research in International Business and Finance, Vol. 24 No.2, pp.103-112.
Nagla Harb., (JAAUTH), Vol. 17 No. 2, 2019, pp. 55-68.
68
مصر دراسة تطبيقية علىأثر تقلبات أسعار الصرف على أسعار الأسهم السياحية: نجلاء حرب
جامعة الإسكندرية
الملخص معلومات المقالة
للعملات أحد المحفزات الرئيسية للنمو الاقتصادي ومصدرا ك هاما يلعب القطاع السياحي دوراأن يؤثر ويتأثر لقطاع السياحيلد قطاعات الصادرات يمكن الأجنبية في مصر. وكأح
العلاقة الديناميكية بين لتحليل وقياس بالتغيرات في أسعار الصرف. وتسعى هذه الورقة البحثية(، كما تختبر EGXأسعار الصرف وأداء الشركات السياحية المقيدة في البورصة المصرية )
وتستند الدراسة ،سهم السياحية في البورصة المصريةأسعار الأ علىتقلبات أسعار الصرف أثر إلى مجموعة من أساليب الإقتصاد القياسي لتحقيق أهدافها من بينها اختبار السببية
Granger ونماذجARCH / GARCH وجود علاقة سببية إلى . وقد توصلت الدراسةضحت تقديرات أحادية الاتجاه من سعر الصرف إلى أسعار الأسهم السياحية. كما أو
أن تباين أسعار الصرف يؤدي إلى تباين أسعار الأسهم، وبمعنى آخر GARCHنموذجيؤدى انخفاض قيمة الجنيه مقابل الدولار الأمريكي إلى تعزيز أداء الأسهم السياحية في
راء رية. وتمثل نتائج هذه الورقة البحثية أهمية خاصة لصانعي القرار والمدالبورصة المصى أداء فحيث تؤدي إلى فهم أفضل لمدى تأثير تقلبات أسعار الصرف ،والمستثمرين الماليين
.كما تقدم اتجاهات جديدة للباحثين في القطاع السياحيأسهم شركات السياحة والضيافة في مصر،
الكلمات المفتاحية
شركات ؛سعر الصرف؛ سعر السهم ؛لسياحةا
؛GARCHنموذج .مصر
(JAAUTH) ،2، العدد 71المجلد (2019) ،
. 68-55ص