98
GS BeES Exchange Traded Funds September 2012
GS BeES
Exchange Traded Funds
September 2012
Presentation flow
Indexing as a strategy
GS BeES – advantages & buy/ sell mechanism
ETF growth – international & India
GS BeES – product details
GS BeES – performance
About us
1

Index tracking – a long term winner for investments
It has been proved that it is not possible to consistently outperform the overall stock market
Index tracking is a relatively cost effective strategy to implement
Indices are dynamic, transparent and have high investor recall
Eliminates the risk of individual stocks, sectors, individual fund manager etc. i.e. all ‘unsystemic risks’ only
the ‘systemic’ or market risk remains which is common to all equity investments
2
This information discusses general market activity, industry or sector trends, or other broad-based economic, market or political conditions and should not be construed as research or
investment advice. Please see additional disclosures.
Index funds in India
At present, there are 41 index funds, of which 191 are based on the S&P CNX Nifty Index
Total recurring expenses2 vary from 0.50% to 1.50% p.a.
Investment management fees range from 0.35% to 0.75% p.a.
Tracking error3 ranges between 0.08% to 4.67%
3
1 & 2 -Source: MFI explorer
3 – Internal calculation done on the basis of NAV data sourced from AMFI
This information discusses general market activity, industry or sector trends, or other broad-based economic, market or political conditions and should not be construed as research or
investment advice. Please see additional disclosures.
Features of GS BeES
Simple – can be bought/ sold on the NSE like a share… in real-time
Buy/ sell the broad Indian market in one ETF unit
Can be used to equitise cash
Economical – the annual expense ratio for Index funds is low compared to equity or debt fund.
No rebalancing issue for the investor due to corporate action or index changes
Full replication strategy
4

How GS BeES work?
5
Primary market Secondary market
Seller
Cash GS BeES1
NSE
Cash GS BeES1
Buyer
Authorised
participants/
Financial
institutions
Buy/ Sell
Market making/
arbitrage
Creation
in-kind
Redemption
in-kind
Fund
1- GS BeES = Goldman Sachs Exchange Traded Funds
GS BeES Vs Open Ended Index Funds
6
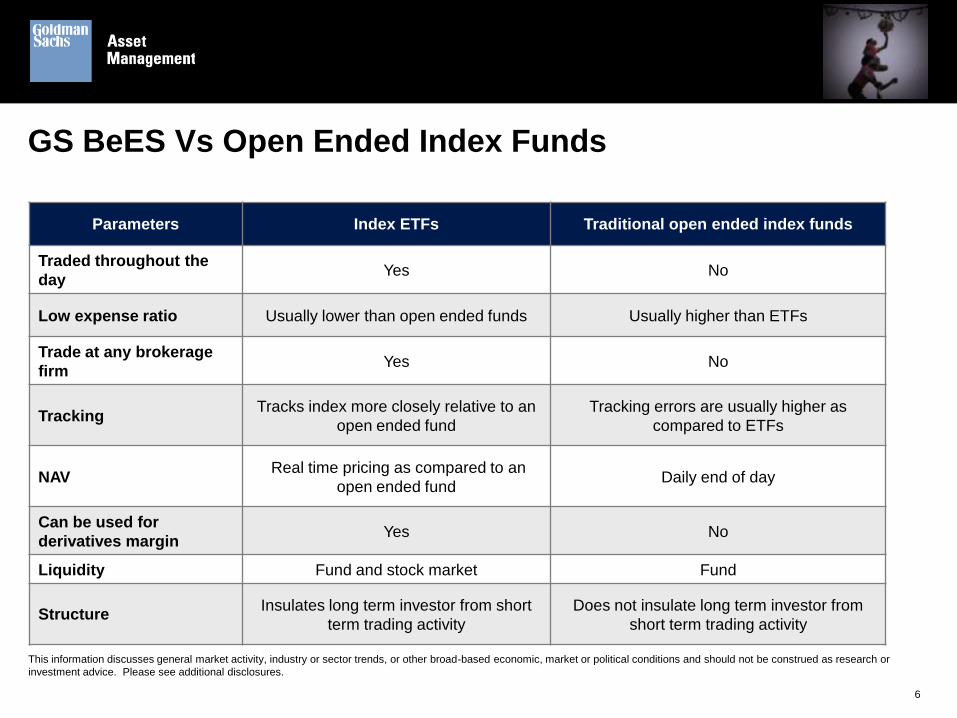
Parameters Index ETFs Traditional open ended index funds
Traded throughout the
day Yes No
Low expense ratio Usually lower than open ended funds Usually higher than ETFs
Trade at any brokerage
firm Yes No
Tracking Tracks index more closely relative to an
open ended fund
Tracking errors are usually higher as
compared to ETFs
NAV Real time pricing as compared to an
open ended fund Daily end of day
Can be used for
derivatives margin Yes No
Liquidity Fund and stock market Fund
Structure Insulates long term investor from short
term trading activity
Does not insulate long term investor from
short term trading activity
This information discusses general market activity, industry or sector trends, or other broad-based economic, market or political conditions and should not be construed as research or
investment advice. Please see additional disclosures.

ETF – Exchange Traded Fund
7

Growth of International ETFs
8
AUM in USD Billion. Source: Blackrock ETF Landscape Q2 End 2012
This information discusses general market activity, industry or sector trends, or other broad-based economic, market or political conditions and should not be construed as research or
investment advice. Please see additional disclosures.
1993
1994
1995
1996
1997
1998
1999
2000
2001
2002
2003
2004
2005
2006
2007
2008
2009
2010
2011
Jun-12
AUM 1 1 2 5 8 18 40 74 105 142 212 310 417 574 797 711 103 131 135 149
No. of ETFs 1 1 2 19 19 29 30 92 202 280 282 336 453 732 117 159 193 245 301 325
0
400
800
1200
1600
2000
2400
2800
3200
3600
0
200
400
600
800
1000
1200
1400
1600
No
. of E
TF
s A
UM
$ B
illio
n
9
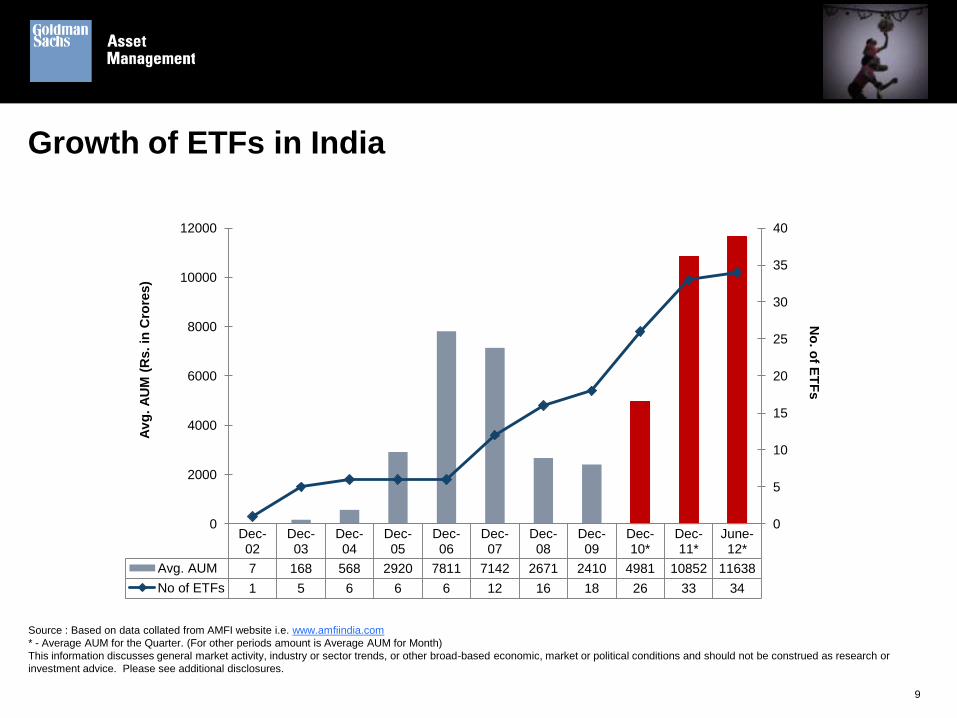
Growth of ETFs in India
Source : Based on data collated from AMFI website i.e. www.amfiindia.com
* - Average AUM for the Quarter. (For other periods amount is Average AUM for Month)
This information discusses general market activity, industry or sector trends, or other broad-based economic, market or political conditions and should not be construed as research or
investment advice. Please see additional disclosures.
Dec-02
Dec-03
Dec-04
Dec-05
Dec-06
Dec-07
Dec-08
Dec-09
Dec-10*
Dec-11*
June-12*
Avg. AUM 7 168 568 2920 7811 7142 2671 2410 4981 10852 11638
No of ETFs 1 5 6 6 6 12 16 18 26 33 34
0
5
10
15
20
25
30
35
40
0
2000
4000
6000
8000
10000
12000
No
. of E
TF
s
Av
g.
AU
M (
Rs. in
Cro
res)
Domestic Equity ETFs
10
S&P CNX Nifty Index
India’s premier benchmark index introduced in November 1995 and was developed as a basis for
introducing index based derivatives
S&P CNX Nifty is calculated using the free float methodology1
Only companies having a high degree of liquidity defined in terms of low impact cost are included as
constituents of the index
Impact cost of the S&P CNX Nifty for June 2012 is 0.07% for a portfolio size of Rs. 50 Lakhs1
Represents about 58.74%2 of the total market capitalization of NSE as on 29th June 2012
11
1 - For criteria of S&P CNX Nifty Index and Impact cost, kindly refer the indices section of NSE website i.e. www.nseindia.com
2 - Source: www.nseindia.com / India Index Services & Products Ltd. (IISL)/ Internal

Goldman Sachs Nifty Exchange Traded Scheme (GS Nifty BeES)
12
Investment objective
The investment objective of GS Nifty BeES is to provide investment returns that, before expenses, closely
correspond to the total returns of the securities as represented by the S&P CNX Nifty Index. However, the
performance of scheme may differ from that of the underlying index due to tracking error.
Investment pattern
The above stated percentages are indicative and not absolute.
Type of scheme
Open ended index scheme, listed on the exchange in the form of an Exchange Traded Fund (ETF)
Instruments Indicative allocation %
Securities covered by S&P CNX Nifty Index Up to 100%
Money market instruments, convertible bonds & other securities
including cash at call but excluding subscription & redemption cash flow
Up to 10%
There is no guarantee that these objectives will be met.
GS Nifty BeES
Combination of a share and a mutual fund unit
Listed and traded on the capital market segment of the NSE
Tracks the S&P CNX Nifty Index and priced at 1/10th of the S&P CNX Nifty Index
Minimum lot-size for real-time in-kind creation/ redemption with the fund is 10,000 units and in multiples
thereof
Minimum lot-size to buy/ sell on NSE is 1 unit and in multiples thereof
Options: the scheme offers only growth option
Units of the scheme will be issued/ repurchased and traded compulsorily in Demat form
13

GS Nifty BeES - top 10 holdings
14
Data as on 29th June 2012
Portfolio holdings may not be representative of current or future investments. The securities discussed do not represent all of the portfolio's holdings and may represent only a small
percentage of the strategy’s portfolio holdings. Future portfolio holdings may not be profitable. Holdings and/ or Allocations are subject to change and should not be construed as research or
investment advice.
Company Industry Weightage (%)
ITC Ltd Consumer Non Durables 8.45
Reliance Industries Ltd Petroleum Products 7.50
Infosys Ltd Software 7.31
ICICI Bank Ltd Banks 6.26
HDFC Bank Ltd Banks 6.15
Housing Development Finance Corporation Ltd Finance 5.83
Larsen & Toubro Ltd Construction Project 4.55
Tata Consultancy Services Ltd Software 3.93
State Bank of India Banks 3.36
Oil & Natural Gas Corporation Ltd Oil 3.04
Total 56.38
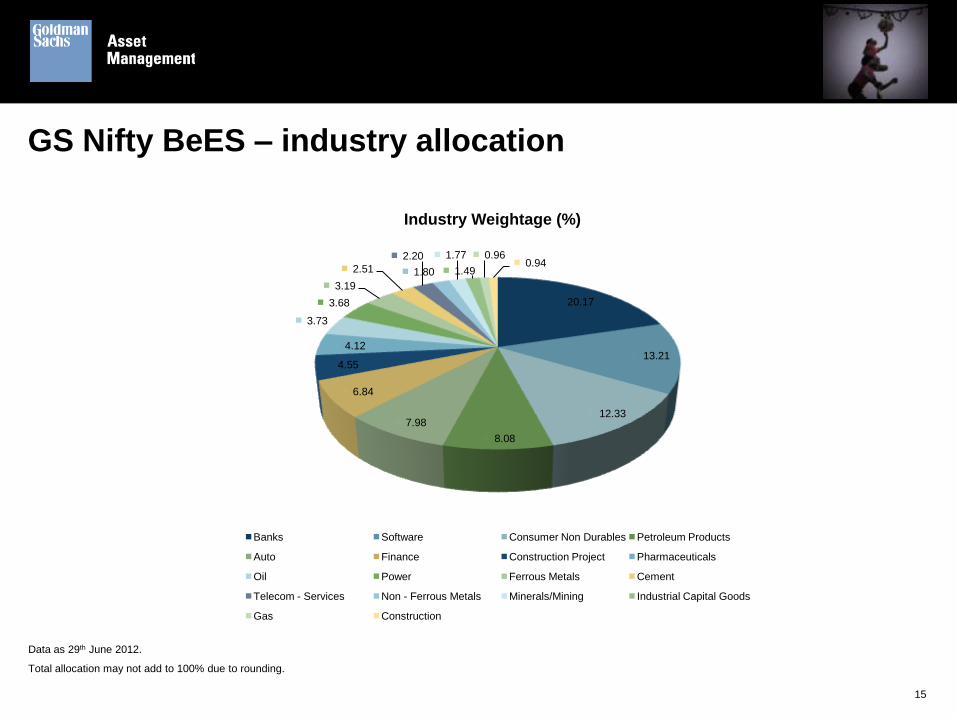
GS Nifty BeES – industry allocation
15
Data as 29th June 2012.
Total allocation may not add to 100% due to rounding.
20.17
13.21
12.33
8.08
7.98
6.84
4.55
4.12
3.73
3.68
3.19
2.51
2.20
1.80
1.77
1.49
0.96 0.94
Banks Software Consumer Non Durables Petroleum Products
Auto Finance Construction Project Pharmaceuticals
Oil Power Ferrous Metals Cement
Telecom - Services Non - Ferrous Metals Minerals/Mining Industrial Capital Goods
Gas Construction
Industry Weightage (%)

GS Nifty BeES – scheme details
16
NSE Symbol : NIFTYBEES
BSE Code : 590103
ISIN : INF732E01011
Reuters : NBES.NS
Bloomberg : NBEES.IN
Total Expense Ratio : 0.50% p.a.1
Tracking Error : 0.11% Annualised2
Impact Cost : 0.113
Entry/ Exit Load : Nil
Data as on 29th Jun 2012
1 - Financial year to date expense ratio to average AUM
2- Tracking error calculated based on monthly rolling returns for last 12 months.
3 - Impact cost calculated for period of 6 months ending on 15th Jun 2012, Source: NSE Market Tracker, www.nseindia.com

17
GS Nifty BeES - performance
Returns for one year are absolute. Returns for more than one year are compounded annualized. Dividends are assumed to be reinvested at the prevailing
NAV. Distribution taxes are excluded while calculating the returns. Bonus declared has been adjusted. In case, the start/end date of the concerned period
is non business date (NBD), the NAV of the previous date is considered for computation of returns. Point to Point (PTP) returns in INR is based on
standard investment of INR 10,000 made at the beginning of 12 month period as at the end of that period scheme performance. Past performance may or
may not be sustained in future and should not be used as a basis for comparison with other investments. Additional benchmark for equity schemes -
source : National Stock Exchange of India. Past performance does not guarantee future results, which may vary. Inception date is the allotment date
which is December 28, 2001.
Fund manager: Vishal Jain
17
Scheme Name
June 30, 2011 to
June 30, 2012
June 30, 2010 to
June 30, 2011
June 30, 2009 to
June 30, 2010 Since Inception
Absolute PTP Returns Absolute PTP Absolute PTP CAGR PTP
Returns (%) (INR) Returns
(%)
Returns
(INR)
Returns
(%)
Returns
(INR)
Returns
(%)
Returns
(INR)
GS Nifty BeES -5.36 9464 7.21 10721 24.50 12450 18.31 58514
S&P CNX Nifty Index (Benchmark)1 -6.53 9347 6.30 10630 23.80 12380 16.78 51063
S&P CNX Nifty Total Returns Index -5.34 9466 7.48 10748 25.31 12531 18.61 60140
Data as on 29th Jun 2012
1- Also represents additional benchmark

CNX Nifty Junior Index
The next rung of liquid securities after S&P CNX Nifty is the CNX Nifty Junior
S&P CNX Nifty and the CNX Nifty Junior make up the 100 most liquid stocks in India
Only companies having a high degree of liquidity defined in terms Impact Cost are included as
Constituents of the Index1
CNX Nifty Junior is calculated using the free float methodology
Impact cost of the CNX Nifty Junior Index for Jun 2012 is 0.1% for a portfolio size of Rs. 25 Lakhs1
Represents about 11.90%2 of the total market capitalization of NSE as on 29th June 2012
18
1 - For criteria of CNX Nifty Junior Index and Impact cost, kindly refer the indices section of NSE website i.e. www.nseindia.com
2 - Source: www.nseindia.com / India Index Services & Products Ltd. (IISL)/ Internal

Goldman Sachs Nifty Junior Exchange Traded Scheme (GS Junior BeES)
19
Investment objective
The investment objective of GS Junior BeES is to provide returns that, before expenses, closely
correspond to the returns of securities as represented by CNX Nifty Junior Index. However, the
performance of scheme may differ from that of underlying index due to tracking error.
Investment pattern
The above stated percentages are indicative and not absolute
Type of scheme
Open ended index scheme, listed on the exchange in the form of an Exchange Traded Fund (ETF)
Instruments Indicative allocation %
Securities covered by CNX Nifty Junior Index 90% - 100%
Money market instruments, convertible bonds & other
securities including cash at call but excluding subscription
& redemption cash flow
0% - 10%
There is no guarantee that these objectives will be met.

GS Junior BeES
Tracks the CNX Nifty Junior Index and priced at 1/100th of the CNX Nifty Junior Index
Combination of a share and a mutual fund unit
Listed and traded on the capital market segment of NSE
Minimum lot-size for real-time in-kind creation/ redemption with the fund is 16,000 units and in multiples
thereof
Minimum lot-size to buy/ sell on NSE is 1 unit and in multiples thereof
Options: the scheme offers only growth option
Units of the scheme will be issued/ repurchased and traded compulsorily in demat form
20
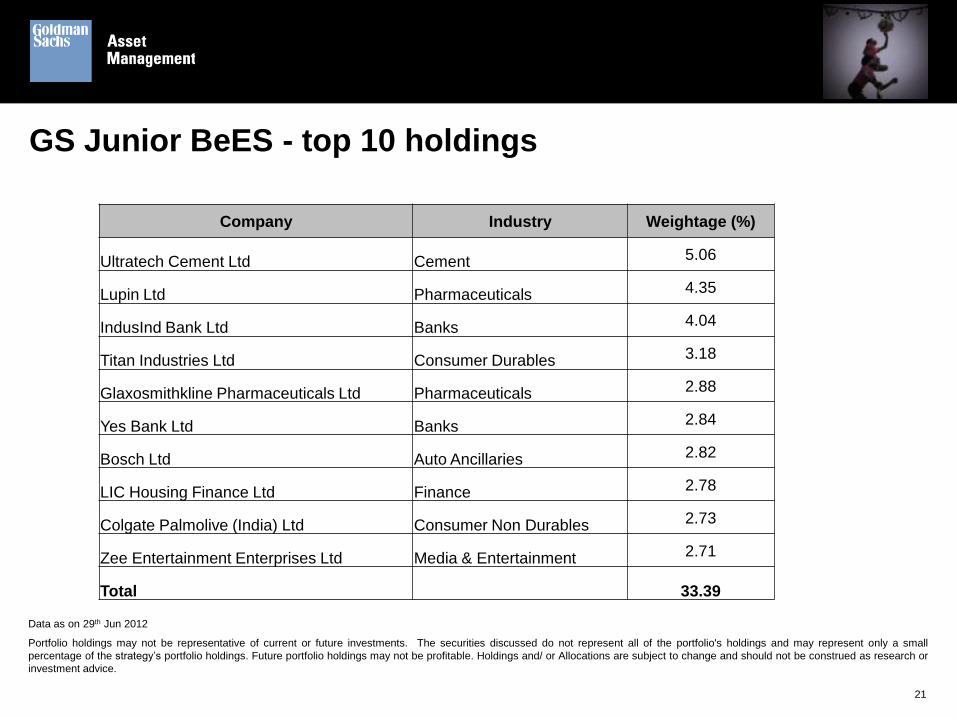
GS Junior BeES - top 10 holdings
21
Data as on 29th Jun 2012
Portfolio holdings may not be representative of current or future investments. The securities discussed do not represent all of the portfolio's holdings and may represent only a small
percentage of the strategy’s portfolio holdings. Future portfolio holdings may not be profitable. Holdings and/ or Allocations are subject to change and should not be construed as research or
investment advice.
Company Industry Weightage (%)
Ultratech Cement Ltd Cement 5.06
Lupin Ltd Pharmaceuticals 4.35
IndusInd Bank Ltd Banks 4.04
Titan Industries Ltd Consumer Durables 3.18
Glaxosmithkline Pharmaceuticals Ltd Pharmaceuticals 2.88
Yes Bank Ltd Banks 2.84
Bosch Ltd Auto Ancillaries 2.82
LIC Housing Finance Ltd Finance 2.78
Colgate Palmolive (India) Ltd Consumer Non Durables 2.73
Zee Entertainment Enterprises Ltd Media & Entertainment 2.71
Total 33.39
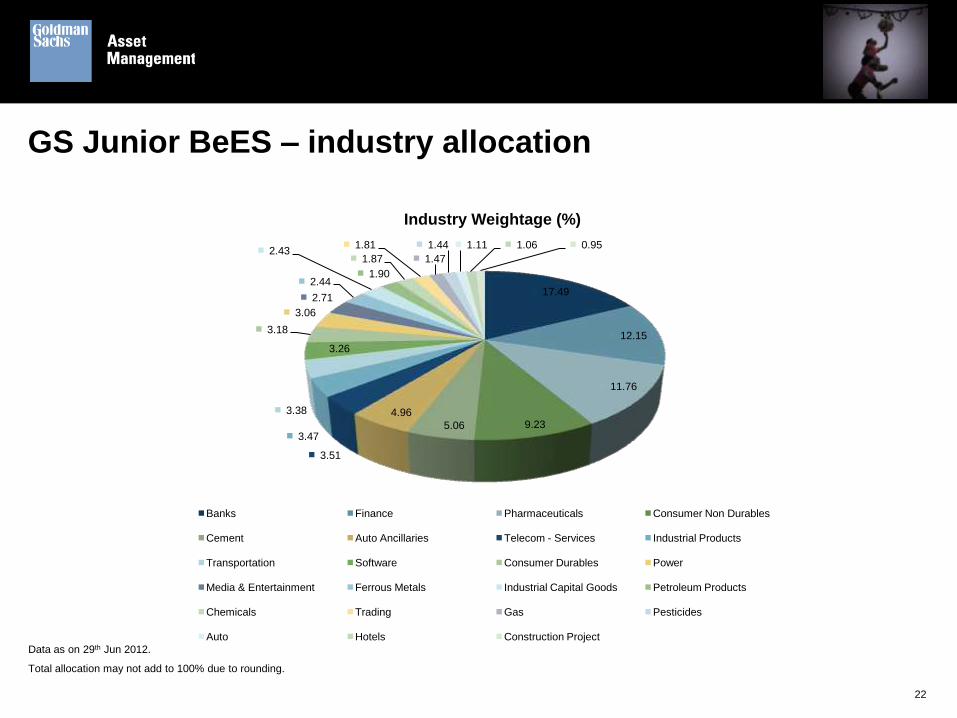
GS Junior BeES – industry allocation
22
Data as on 29th Jun 2012.
Total allocation may not add to 100% due to rounding.
17.49
12.15
11.76
9.23 5.06
4.96
3.51
3.47
3.38
3.26
3.18
3.06
2.71
2.44
2.43
1.90
1.87
1.81
1.47
1.44 1.11 1.06 0.95
Banks Finance Pharmaceuticals Consumer Non Durables
Cement Auto Ancillaries Telecom - Services Industrial Products
Transportation Software Consumer Durables Power
Media & Entertainment Ferrous Metals Industrial Capital Goods Petroleum Products
Chemicals Trading Gas Pesticides
Auto Hotels Construction Project
Industry Weightage (%)
23
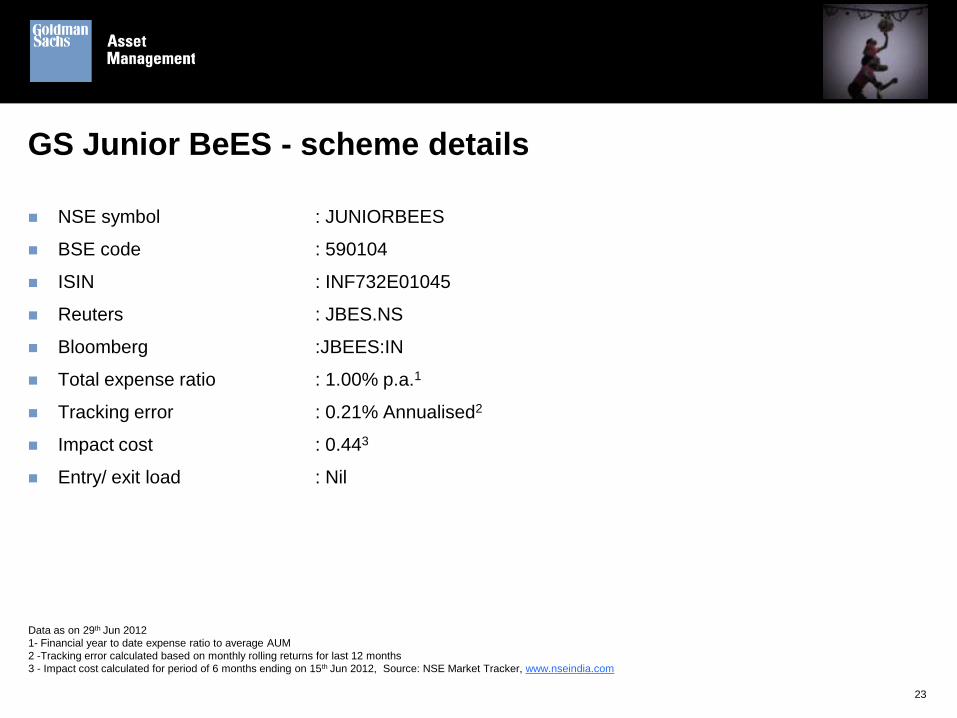
GS Junior BeES - scheme details
NSE symbol : JUNIORBEES
BSE code : 590104
ISIN : INF732E01045
Reuters : JBES.NS
Bloomberg :JBEES:IN
Total expense ratio : 1.00% p.a.1
Tracking error : 0.21% Annualised2
Impact cost : 0.443
Entry/ exit load : Nil
Data as on 29th Jun 2012
1- Financial year to date expense ratio to average AUM
2 -Tracking error calculated based on monthly rolling returns for last 12 months
3 - Impact cost calculated for period of 6 months ending on 15th Jun 2012, Source: NSE Market Tracker, www.nseindia.com

24
GS Junior BeES - performance
Returns for one year are absolute. Returns for more than one year are compounded annualized. Dividends are assumed to be reinvested at the prevailing
NAV. Distribution taxes are excluded while calculating the returns. Bonus declared has been adjusted. In case, the start/end date of the concerned period
is non business date (NBD), the NAV of the previous date is considered for computation of returns. Point to Point (PTP) returns in INR is based on
standard investment of INR 10,000 made at the beginning of 12 month period as at the end of that period scheme performance. Additional benchmark for
equity scheme - source : National Stock Exchange of India. Past performance may or may not be sustained in future and should not be used as a basis
for comparison with other investments. Past performance does not guarantee future results, which may vary. Inception date is the allotment date which is
February 21, 2003.
Fund manager: Payal Kaipunjal
Scheme Name
June 30, 2011 to
June 30, 2012
June 30, 2010 to
June 30, 2011
June 30, 2009 to
June 30, 2010 Since Inception
Absolute PTP Returns Absolute PTP Absolute PTP CAGR PTP
Returns (%) (INR) Returns (%) Returns
(INR) Returns (%)
Returns
(INR) Returns (%)
Returns
(INR)
GS Junior BeES -9.60 9040 -0.56 9944 44.15 14415 23.65 72908
CNX Nifty Junior Index (Benchmark) -10.11 8989 -0.62 9938 45.03 14503 23.51 72155
CNX Nifty Junior Total Returns Index -9.06 9094 0.37 10037 46.47 14647 25.26 82315
S&P CNX Nifty Index (Addl. Benchmark) -6.53 9347 6.30 10630 23.80 12380 18.64 49514
Data as on 29th Jun 2012
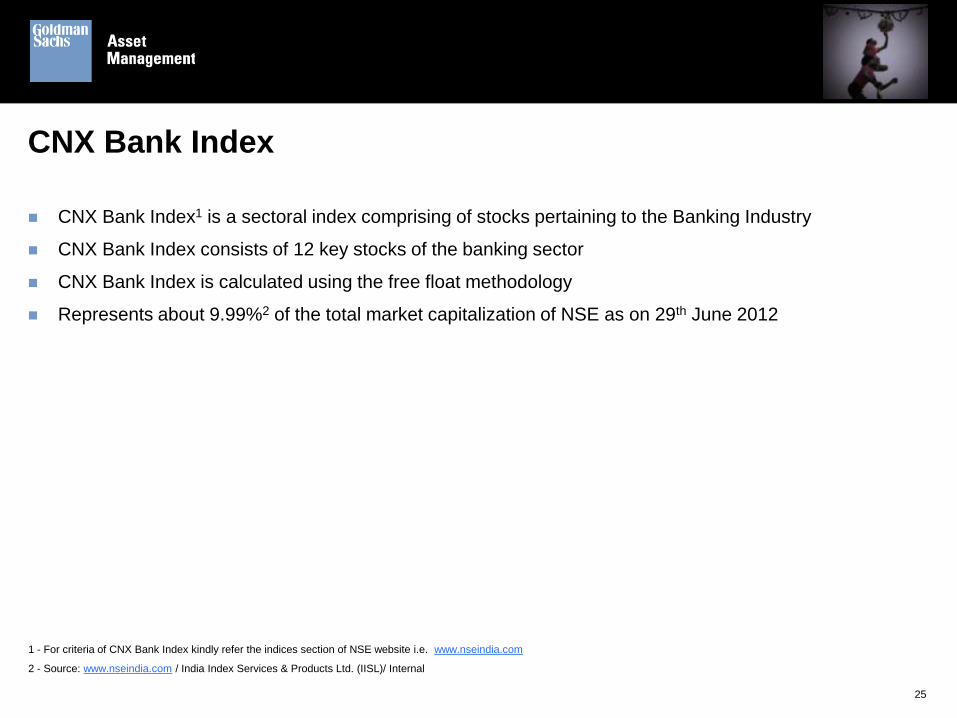
CNX Bank Index
CNX Bank Index1 is a sectoral index comprising of stocks pertaining to the Banking Industry
CNX Bank Index consists of 12 key stocks of the banking sector
CNX Bank Index is calculated using the free float methodology
Represents about 9.99%2 of the total market capitalization of NSE as on 29th June 2012
25
1 - For criteria of CNX Bank Index kindly refer the indices section of NSE website i.e. www.nseindia.com
2 - Source: www.nseindia.com / India Index Services & Products Ltd. (IISL)/ Internal
Goldman Sachs Banking Index Exchange Traded Scheme (GS Bank BeES)
26
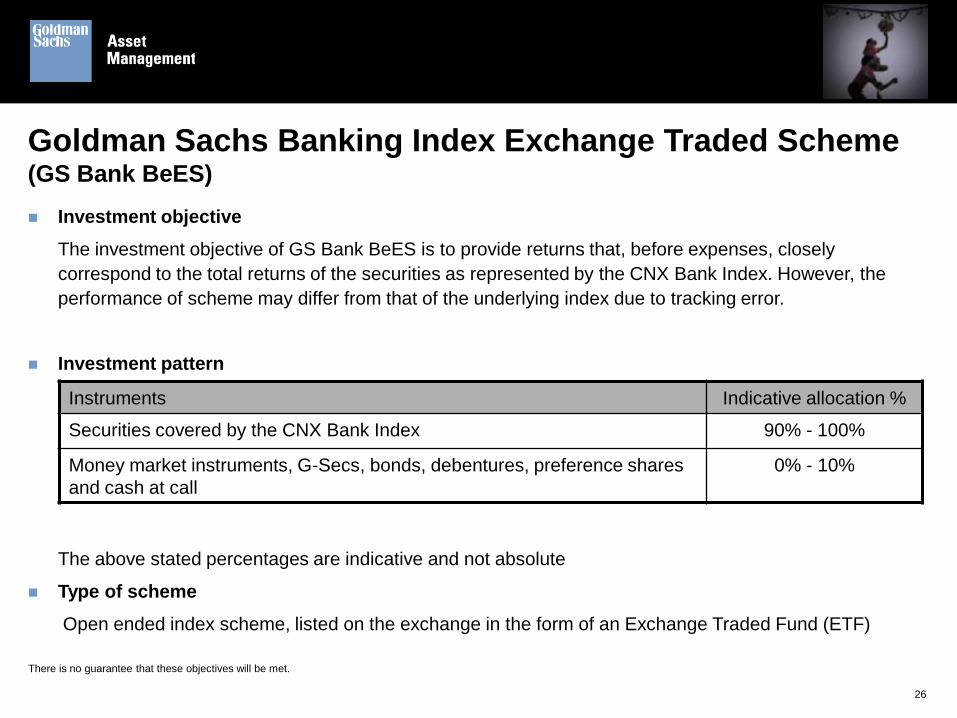
Investment objective
The investment objective of GS Bank BeES is to provide returns that, before expenses, closely
correspond to the total returns of the securities as represented by the CNX Bank Index. However, the
performance of scheme may differ from that of the underlying index due to tracking error.
Investment pattern
The above stated percentages are indicative and not absolute
Type of scheme
Open ended index scheme, listed on the exchange in the form of an Exchange Traded Fund (ETF)
There is no guarantee that these objectives will be met.
Instruments Indicative allocation %
Securities covered by the CNX Bank Index 90% - 100%
Money market instruments, G-Secs, bonds, debentures, preference shares
and cash at call
0% - 10%
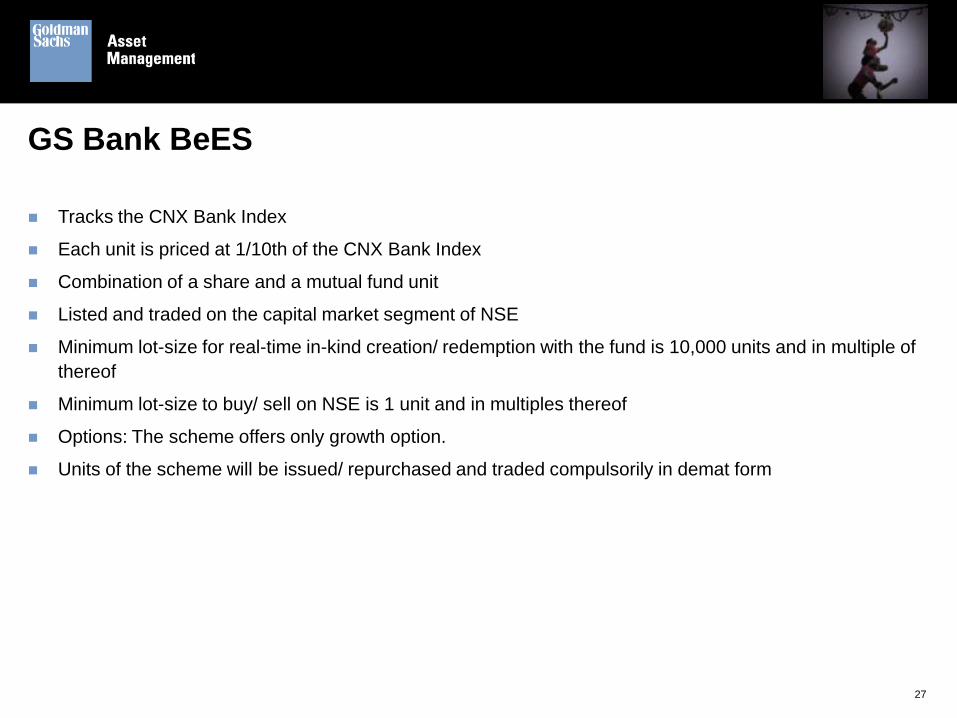
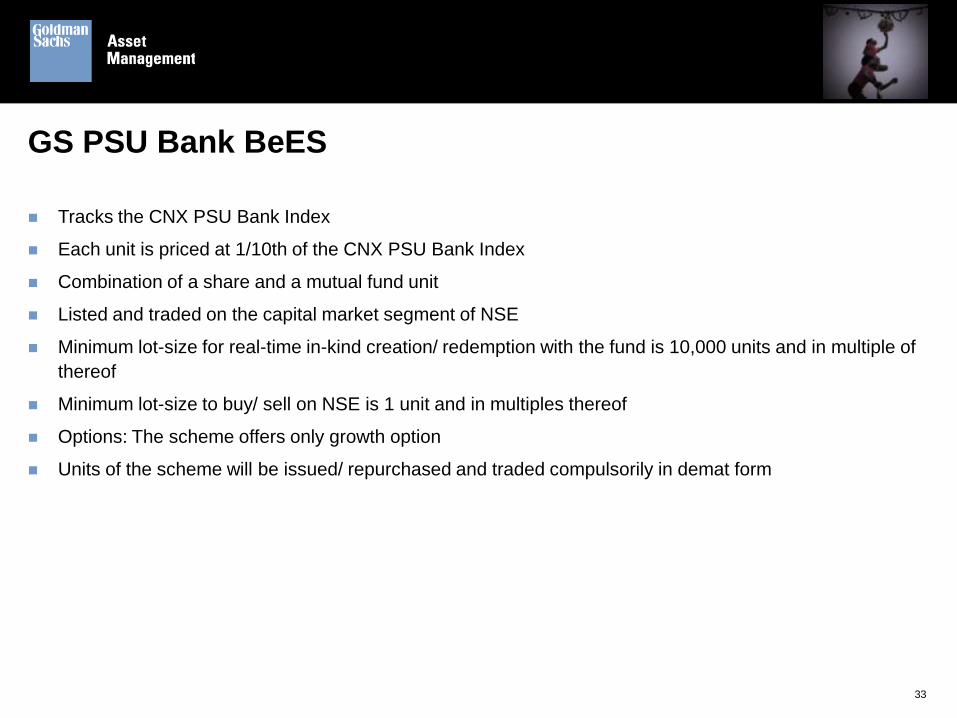
GS Bank BeES
Tracks the CNX Bank Index
Each unit is priced at 1/10th of the CNX Bank Index
Combination of a share and a mutual fund unit
Listed and traded on the capital market segment of NSE
Minimum lot-size for real-time in-kind creation/ redemption with the fund is 10,000 units and in multiple of
thereof
Minimum lot-size to buy/ sell on NSE is 1 unit and in multiples thereof
Options: The scheme offers only growth option.
Units of the scheme will be issued/ repurchased and traded compulsorily in demat form
27
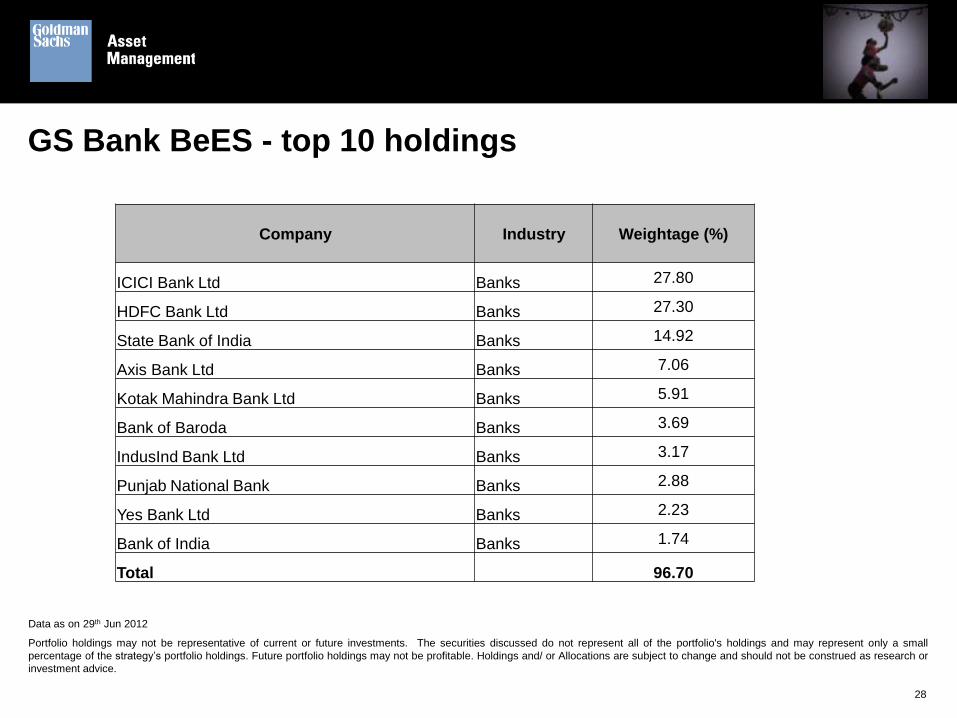
GS Bank BeES - top 10 holdings
28
Data as on 29th Jun 2012
Portfolio holdings may not be representative of current or future investments. The securities discussed do not represent all of the portfolio's holdings and may represent only a small
percentage of the strategy’s portfolio holdings. Future portfolio holdings may not be profitable. Holdings and/ or Allocations are subject to change and should not be construed as research or
investment advice.
Company Industry Weightage (%)
ICICI Bank Ltd Banks 27.80
HDFC Bank Ltd Banks 27.30
State Bank of India Banks 14.92
Axis Bank Ltd Banks 7.06
Kotak Mahindra Bank Ltd Banks 5.91
Bank of Baroda Banks 3.69
IndusInd Bank Ltd Banks 3.17
Punjab National Bank Banks 2.88
Yes Bank Ltd Banks 2.23
Bank of India Banks 1.74
Total 96.70

GS Bank BeES - scheme details
NSE symbol : BANKBEES
BSE code : 590106
ISIN : INF732E01078
Reuters : BBES.NS
Bloomberg :BBEES:IN
Total expense ratio : 0.50% p.a.1
Tracking error : 0.20% Annualised2
Impact cost : 0.503
Entry/ exit load : Nil
29
Data as on 29th Jun 2012
1 - Financial Year to date Expense Ratio to average AUM
2- Tracking Error calculated based on monthly Rolling Returns for last 12 months.
3 - Impact cost calculated for period of 6 months ending on 15th Jun 2012, Source: NSE Market Tracker, www.nseindia.com

GS Bank BeES - performance
Returns for one year are absolute. Returns for more than one year are compounded annualized. Dividends are assumed to be reinvested at the prevailing
NAV. Distribution taxes are excluded while calculating the returns. In case, the start/end date of the concerned period is non business date (NBD), the
NAV of the previous date is considered for computation of returns. Point to Point (PTP) returns in INR is based on standard investment of INR 10,000
made at the beginning of 12 month period as at the end of that period scheme performance. Additional benchmark for equity scheme - source : National
Stock Exchange of India. Past performance may or may not be sustained in future and should not be used as a basis for comparison with other
investments. Past performance does not guarantee future results, which may vary. Inception date is the allotment date which is May 27, 2004.
Fund manager: Vishal Jain
30
Data as on 29th Jun 2012
Scheme Name
June 30, 2011 to
June 30, 2012
June 30, 2010 to
June 30, 2011
June 30, 2009 to
June 30, 2010 Since Inception
Absolute PTP Returns Absolute PTP Absolute PTP CAGR PTP
Returns
(%) (INR)
Returns
(%)
Returns
(INR)
Returns
(%)
Returns
(INR)
Returns
(%)
Returns
(INR)
GS Bank BeES -7.06 9294 19.53 11953 29.37 12937 20.46 45139
CNX Bank Index (Benchmark) -8.04 9196 18.81 11881 28.97 12897 19.00 40879
CNX Bank Total Returns Index -6.87 9313 20.00 12000 30.52 13052 20.95 46653
S&P CNX Nifty Index (Addl. Benchmark) -6.53 9347 6.30 10630 23.80 12380 16.01 33276

CNX PSU Bank Index
CNX PSU Bank Index1 is a sectoral index comprising of stocks pertaining to the PSU Bank Sector
CNX PSU Bank Index consists of 12 key PSU Banking Stocks
CNX PSU Bank Index is a free float methodology based weighted index
CNX PSU Bank Index Constituents represent about 4.96%2 of the total market capitalization of NSE as
on 29th Jun 2012
31
1 - For criteria of CNX PSU Bank Index kindly refer the indices section of NSE website i.e. www.nseindia.com
2 - Source: www.nseindia.com / India Index Services & Products Ltd. (IISL)/ Internal

Goldman Sachs PSU Bank Exchange Traded Scheme (GS PSU Bank BeES)
32
Investment objective
The investment objective of GS PSU Bank BeES is to provide returns that, before expenses, closely
correspond to the total returns of the securities as represented by the CNX PSU Bank Index. However,
the performance of scheme may differ from that of the underlying index due to tracking error.
Investment pattern
The above stated percentages are indicative and not absolute
Type of scheme
Open ended index scheme, listed on the exchange in the form of an Exchange Traded Fund (ETF)
Instruments Indicative allocation %
Securities covered by the CNX PSU Bank Index 90% - 100%
Money market instruments, G-Secs, bonds, debentures
and cash at call
0% - 10%
There is no guarantee that these objectives will be met.
GS PSU Bank BeES
Tracks the CNX PSU Bank Index
Each unit is priced at 1/10th of the CNX PSU Bank Index
Combination of a share and a mutual fund unit
Listed and traded on the capital market segment of NSE
Minimum lot-size for real-time in-kind creation/ redemption with the fund is 10,000 units and in multiple of
thereof
Minimum lot-size to buy/ sell on NSE is 1 unit and in multiples thereof
Options: The scheme offers only growth option
Units of the scheme will be issued/ repurchased and traded compulsorily in demat form
33
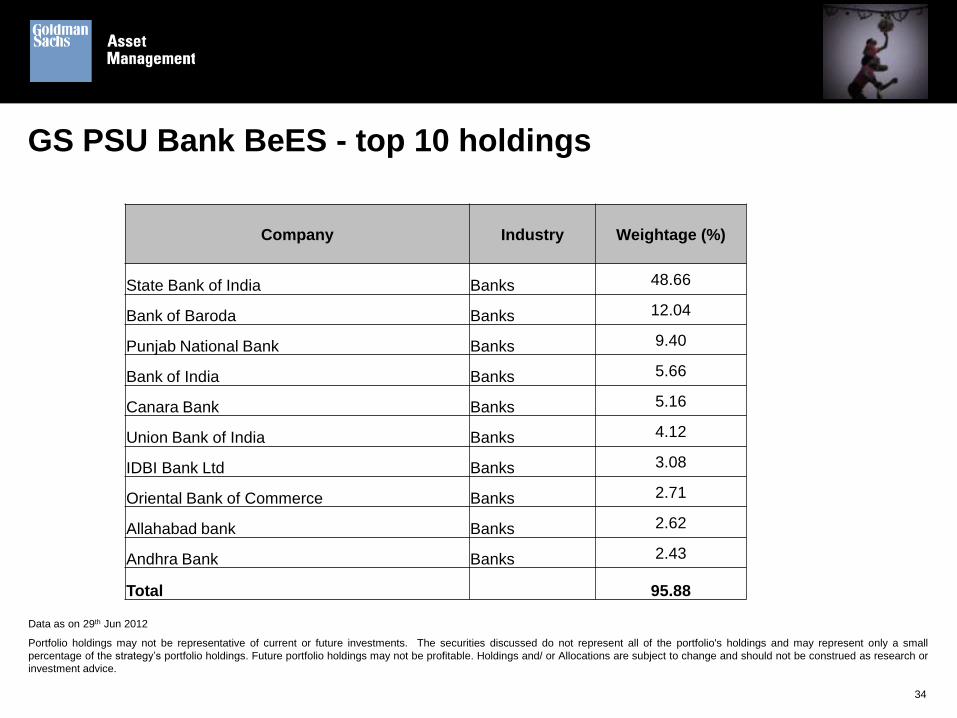
GS PSU Bank BeES - top 10 holdings
34
Data as on 29th Jun 2012
Portfolio holdings may not be representative of current or future investments. The securities discussed do not represent all of the portfolio's holdings and may represent only a small
percentage of the strategy’s portfolio holdings. Future portfolio holdings may not be profitable. Holdings and/ or Allocations are subject to change and should not be construed as research or
investment advice.
Company Industry Weightage (%)
State Bank of India Banks 48.66
Bank of Baroda Banks 12.04
Punjab National Bank Banks 9.40
Bank of India Banks 5.66
Canara Bank Banks 5.16
Union Bank of India Banks 4.12
IDBI Bank Ltd Banks 3.08
Oriental Bank of Commerce Banks 2.71
Allahabad bank Banks 2.62
Andhra Bank Banks 2.43
Total 95.88
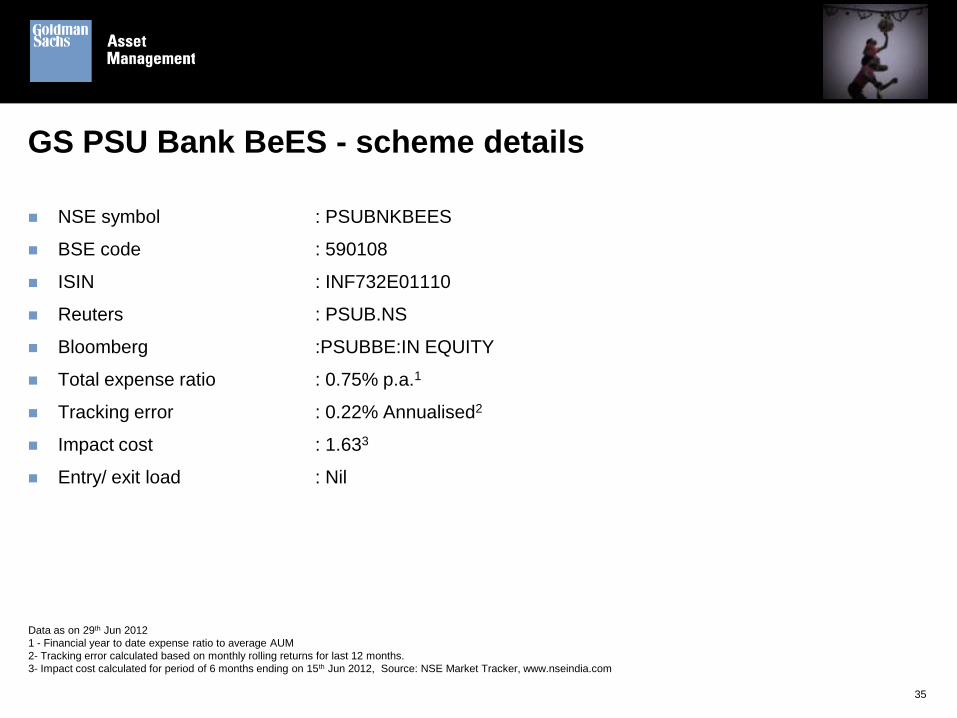
GS PSU Bank BeES - scheme details
NSE symbol : PSUBNKBEES
BSE code : 590108
ISIN : INF732E01110
Reuters : PSUB.NS
Bloomberg :PSUBBE:IN EQUITY
Total expense ratio : 0.75% p.a.1
Tracking error : 0.22% Annualised2
Impact cost : 1.633
Entry/ exit load : Nil
35
Data as on 29th Jun 2012
1 - Financial year to date expense ratio to average AUM
2- Tracking error calculated based on monthly rolling returns for last 12 months.
3- Impact cost calculated for period of 6 months ending on 15th Jun 2012, Source: NSE Market Tracker, www.nseindia.com
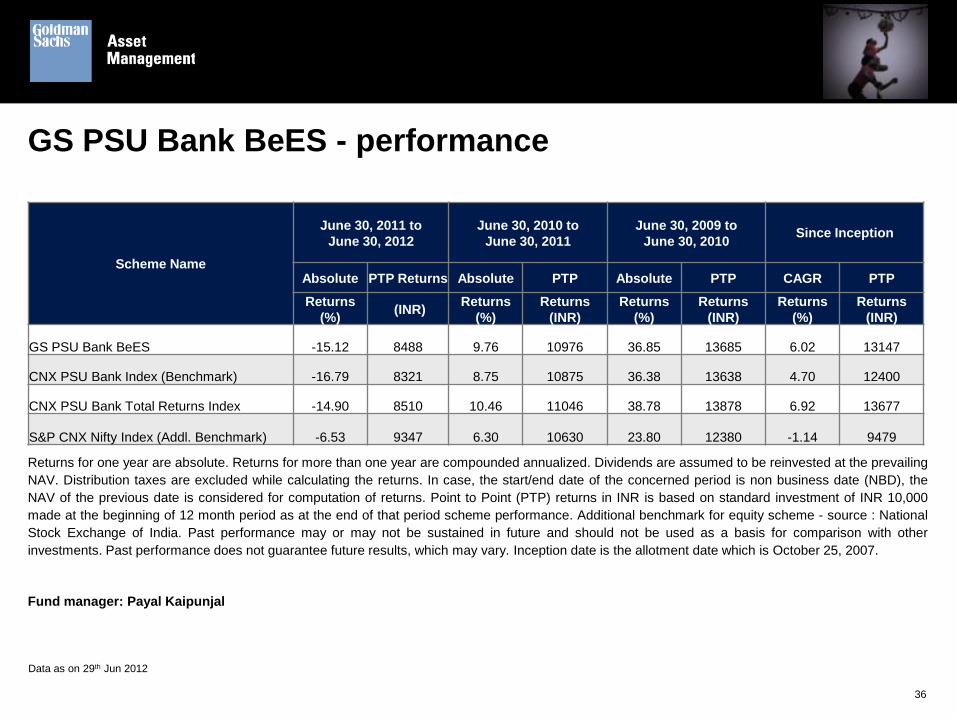
GS PSU Bank BeES - performance
Returns for one year are absolute. Returns for more than one year are compounded annualized. Dividends are assumed to be reinvested at the prevailing
NAV. Distribution taxes are excluded while calculating the returns. In case, the start/end date of the concerned period is non business date (NBD), the
NAV of the previous date is considered for computation of returns. Point to Point (PTP) returns in INR is based on standard investment of INR 10,000
made at the beginning of 12 month period as at the end of that period scheme performance. Additional benchmark for equity scheme - source : National
Stock Exchange of India. Past performance may or may not be sustained in future and should not be used as a basis for comparison with other
investments. Past performance does not guarantee future results, which may vary. Inception date is the allotment date which is October 25, 2007.
Fund manager: Payal Kaipunjal
36
Scheme Name
June 30, 2011 to
June 30, 2012
June 30, 2010 to
June 30, 2011
June 30, 2009 to
June 30, 2010 Since Inception
Absolute PTP Returns Absolute PTP Absolute PTP CAGR PTP
Returns
(%) (INR)
Returns
(%)
Returns
(INR)
Returns
(%)
Returns
(INR)
Returns
(%)
Returns
(INR)
GS PSU Bank BeES -15.12 8488 9.76 10976 36.85 13685 6.02 13147
CNX PSU Bank Index (Benchmark) -16.79 8321 8.75 10875 36.38 13638 4.70 12400
CNX PSU Bank Total Returns Index -14.90 8510 10.46 11046 38.78 13878 6.92 13677
S&P CNX Nifty Index (Addl. Benchmark) -6.53 9347 6.30 10630 23.80 12380 -1.14 9479
Data as on 29th Jun 2012

S&P CNX Nifty Shariah Index
Constituents of the S&P CNX Nifty index are screened for Shariah compliance
Companies that are Shariah compliant form the S&P CNX Nifty Shariah Index1
The index is calculated using a base-weighted aggregate methodology
At present the S&P CNX Nifty Shariah Index comprises of 26 constituents2 as at 29th Jun 2012
S&P CNX Nifty Shariah Index constituents represent about 32.94%3 of the total market capitalisation of
the NSE as at 29th Jun 2012
37
1 - For criteria of S&P CNX Nifty Shariah Index kindly refer the indices section of NSE website i.e. www.nseindia.com
2 - Source: India Index Services & Products Ltd. (IISL)
3 - Source: www.nseindia.com / India Index Services & Products Ltd. (IISL)/ Internal
Shariah Index – framework providers
Index constituents of the underlying index are screened for Shariah compliance and then included in the
index
Standard & Poor’s has contracted with Ratings Intelligence Partners (RI) to provide the Shariah screens
to filter the stocks based on these screens
Ratings Intelligence Partners is a London/Kuwait based consulting company specializing in solutions for
the global Islamic investment market
RI’s team consists of qualified Islamic researchers who work directly with a Shariah Supervisory Board
The Shariah Supervisory Board is a board of Islamic scholars serving to interpret business issues and
recommend actions related to business decisions for the indices.
38

Shariah screening process
Two main criteria based on which the stocks are screened include:
Sector based screens
Accounting based screens
39

Shariah screening process
Sector based screens
Business activities related to the following are excluded-:
Pork
Alcohol
Gambling
Financials
Advertising and Media (newspapers are allowed, sub-industries are analyzed individually)
Pornography
Tobacco
Trading of gold and silver as cash on deferred basis
During the selection process, each company’s audited annual report is reviewed to ensure that the
company is not involved in any non-Shariah compliant activities
Companies that are found to be non-compliant are screened out
40
Shariah screening process
Accounting based screens
Companies left after passing through sector based screen are then examined for compliance in financial
ratios as certain ratios may violate compliance measurements
The three areas of focus are : leverage, cash and the share of revenues derived from non-compliant
activities. All of these are subject to evaluation on an ongoing basis
Leverage compliance
For inclusion in the S&P CNX Nifty Shariah Index compliance is measured as: :
Debt / Market value of equity (12 month average) < 33 %;
Cash compliance
For inclusion in the S&P CNX Nifty Shariah Index compliances with reference to cash holdings.
These are :
Accounts receivables / Market value of equity (12 month average) < 49 %;
(Cash + Interest bearing securities) / Market value of equity (12 month average) <33%;
41

Shariah screening process
Accounting based screens
Revenue share from non-compliant activities
For inclusion in the S&P CNX Nifty Shariah Index, in certain cases, revenues from non-compliant activities
are permissible, if they comply with the following threshold:
(Non-permissible income other than interest income) / revenue < 5%
42
Goldman Sachs S&P CNX Nifty Shariah Index
Exchange Traded Scheme (GS S&P Shariah BeES)
43
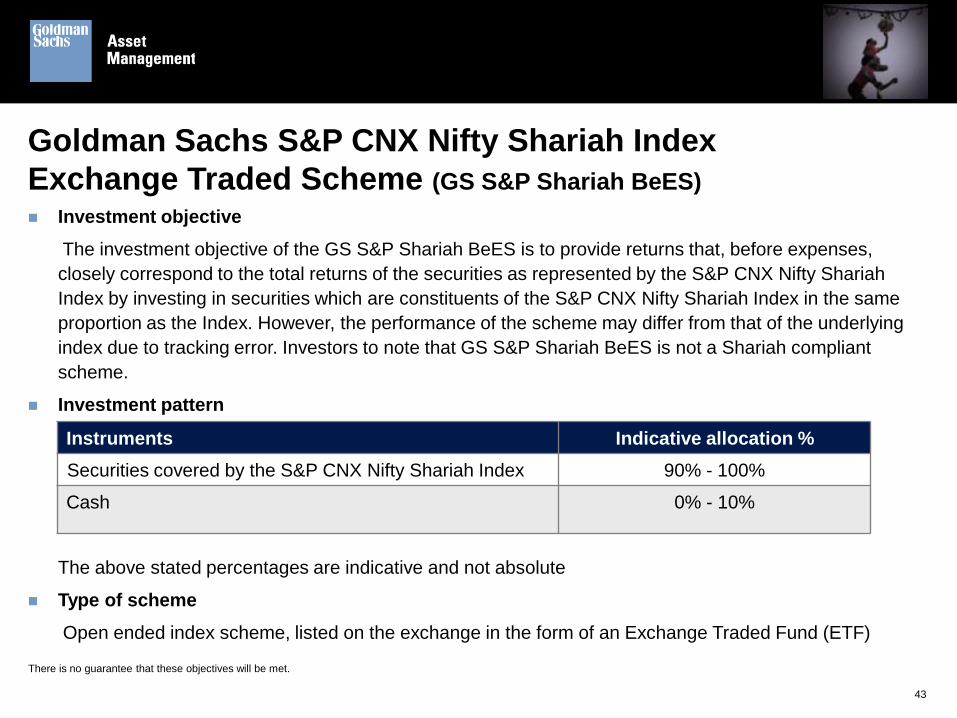
Investment objective
The investment objective of the GS S&P Shariah BeES is to provide returns that, before expenses,
closely correspond to the total returns of the securities as represented by the S&P CNX Nifty Shariah
Index by investing in securities which are constituents of the S&P CNX Nifty Shariah Index in the same
proportion as the Index. However, the performance of the scheme may differ from that of the underlying
index due to tracking error. Investors to note that GS S&P Shariah BeES is not a Shariah compliant
scheme.
Investment pattern
The above stated percentages are indicative and not absolute
Type of scheme
Open ended index scheme, listed on the exchange in the form of an Exchange Traded Fund (ETF)
Instruments Indicative allocation %
Securities covered by the S&P CNX Nifty Shariah Index 90% - 100%
Cash 0% - 10%
There is no guarantee that these objectives will be met.

GS S&P Shariah BeES
Each unit is priced at 1/10th of S&P CNX Nifty Shariah Index
Combination of a share and a mutual fund unit
Listed and traded on the capital market segment of the NSE
Minimum lot-size for real-time in kind creation/ redemption with the fund is 10,000 units and in multiple of
thereof
Minimum lot-size to buy/ sell on the NSE is 1 unit and in multiples thereof
Options: The scheme offers only growth option.
Units of the scheme will be issued/repurchased and traded compulsorily in demat form
44
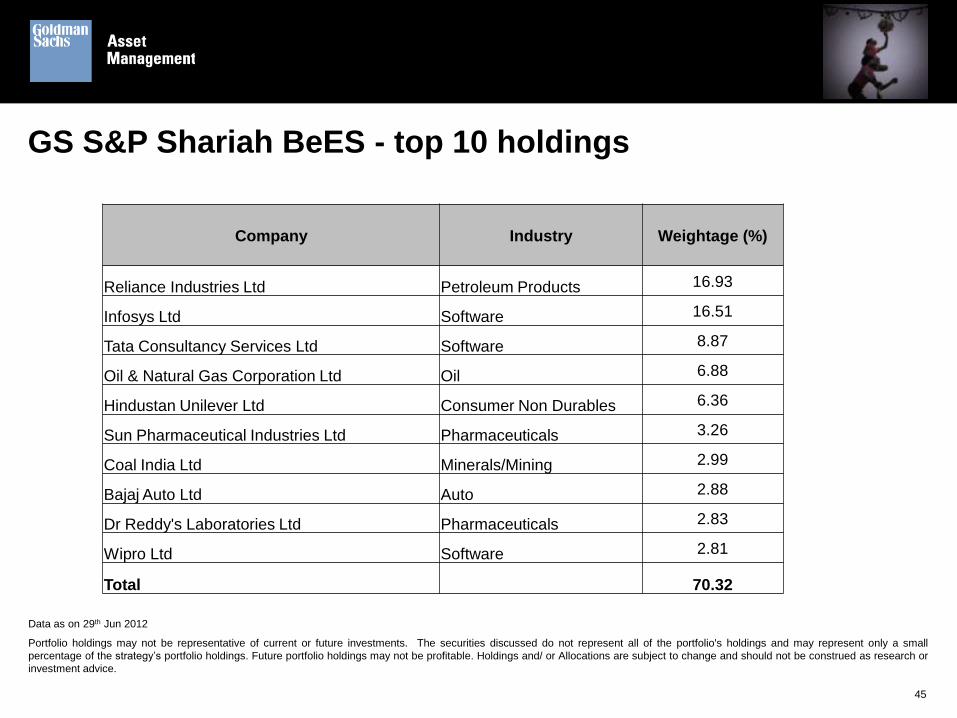
GS S&P Shariah BeES - top 10 holdings
45
Data as on 29th Jun 2012
Portfolio holdings may not be representative of current or future investments. The securities discussed do not represent all of the portfolio's holdings and may represent only a small
percentage of the strategy’s portfolio holdings. Future portfolio holdings may not be profitable. Holdings and/ or Allocations are subject to change and should not be construed as research or
investment advice.
Company Industry Weightage (%)
Reliance Industries Ltd Petroleum Products 16.93
Infosys Ltd Software 16.51
Tata Consultancy Services Ltd Software 8.87
Oil & Natural Gas Corporation Ltd Oil 6.88
Hindustan Unilever Ltd Consumer Non Durables 6.36
Sun Pharmaceutical Industries Ltd Pharmaceuticals 3.26
Coal India Ltd Minerals/Mining 2.99
Bajaj Auto Ltd Auto 2.88
Dr Reddy's Laboratories Ltd Pharmaceuticals 2.83
Wipro Ltd Software 2.81
Total 70.32

GS S&P Shariah BeES – industry allocation
46
Data as on 29th Jun 2012.
Total allocation may not add to 100% due to rounding.
29.82
16.93
9.31
8.78
8.43
7.80
5.70
4.01
3.35 3.19 2.16
Software Petroleum Products Pharmaceuticals Consumer Non Durables
Oil Auto Cement Minerals/Mining
Industrial Capital Goods Ferrous Metals Gas
Industry Weightage (%)
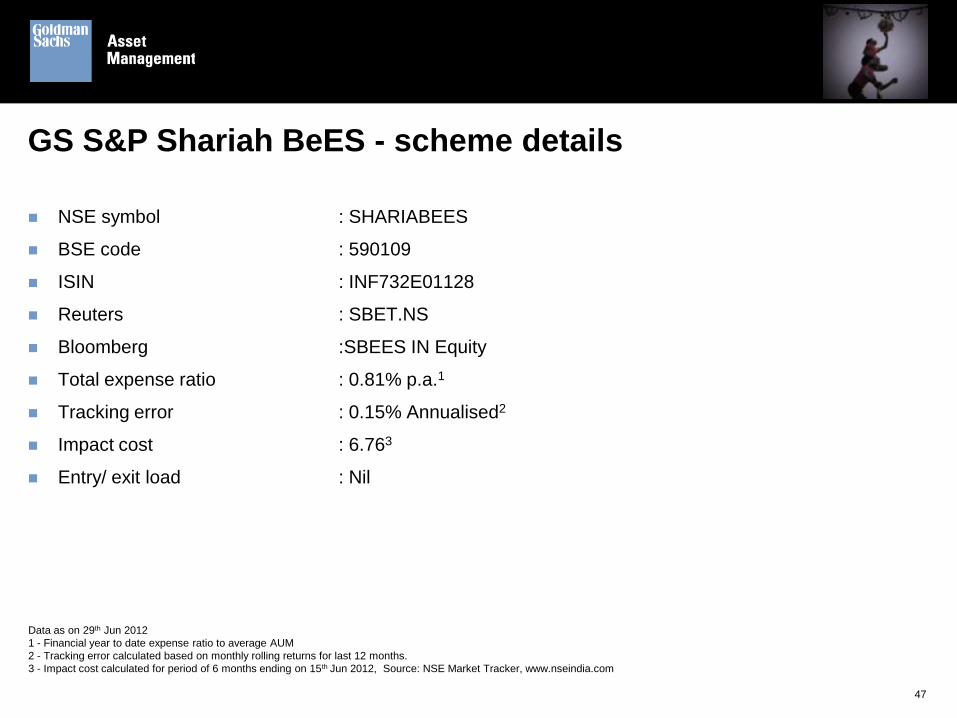
GS S&P Shariah BeES - scheme details
NSE symbol : SHARIABEES
BSE code : 590109
ISIN : INF732E01128
Reuters : SBET.NS
Bloomberg :SBEES IN Equity
Total expense ratio : 0.81% p.a.1
Tracking error : 0.15% Annualised2
Impact cost : 6.763
Entry/ exit load : Nil
47
Data as on 29th Jun 2012
1 - Financial year to date expense ratio to average AUM
2 - Tracking error calculated based on monthly rolling returns for last 12 months.
3 - Impact cost calculated for period of 6 months ending on 15th Jun 2012, Source: NSE Market Tracker, www.nseindia.com
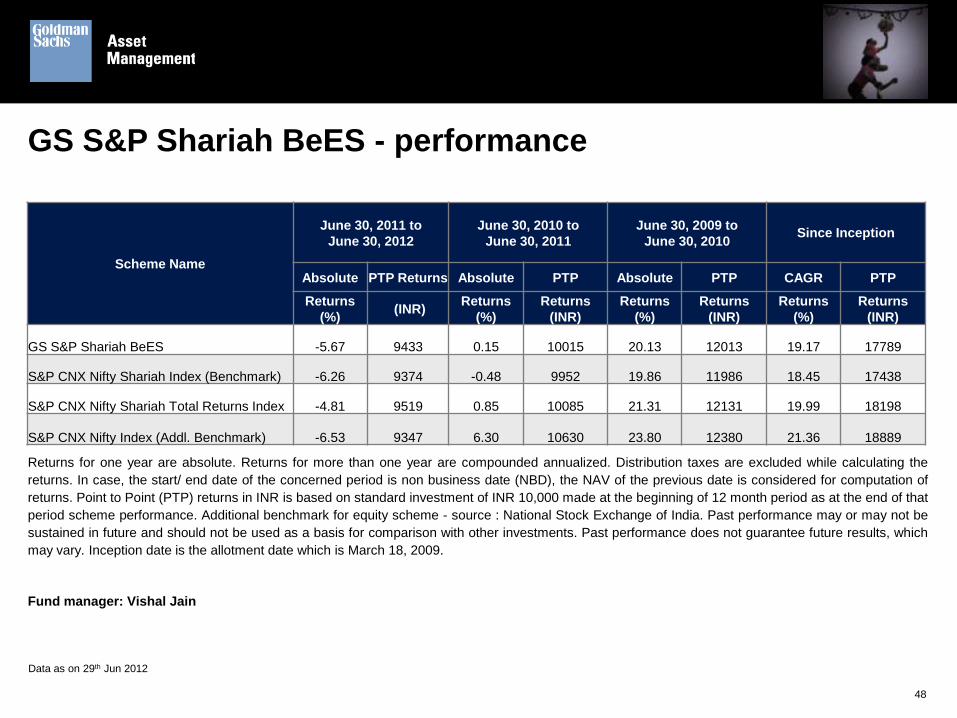
GS S&P Shariah BeES - performance
Returns for one year are absolute. Returns for more than one year are compounded annualized. Distribution taxes are excluded while calculating the
returns. In case, the start/ end date of the concerned period is non business date (NBD), the NAV of the previous date is considered for computation of
returns. Point to Point (PTP) returns in INR is based on standard investment of INR 10,000 made at the beginning of 12 month period as at the end of that
period scheme performance. Additional benchmark for equity scheme - source : National Stock Exchange of India. Past performance may or may not be
sustained in future and should not be used as a basis for comparison with other investments. Past performance does not guarantee future results, which
may vary. Inception date is the allotment date which is March 18, 2009.
Fund manager: Vishal Jain
48
Scheme Name
June 30, 2011 to
June 30, 2012
June 30, 2010 to
June 30, 2011
June 30, 2009 to
June 30, 2010 Since Inception
Absolute PTP Returns Absolute PTP Absolute PTP CAGR PTP
Returns
(%) (INR)
Returns
(%)
Returns
(INR)
Returns
(%)
Returns
(INR)
Returns
(%)
Returns
(INR)
GS S&P Shariah BeES -5.67 9433 0.15 10015 20.13 12013 19.17 17789
S&P CNX Nifty Shariah Index (Benchmark) -6.26 9374 -0.48 9952 19.86 11986 18.45 17438
S&P CNX Nifty Shariah Total Returns Index -4.81 9519 0.85 10085 21.31 12131 19.99 18198
S&P CNX Nifty Index (Addl. Benchmark) -6.53 9347 6.30 10630 23.80 12380 21.36 18889
Data as on 29th Jun 2012
CNX Infrastructure Index
Includes companies belonging to telecom, power, port, air, roads, railways, shipping and other utility
service providers
CNX Infrastructure Index1 is calculated using the free float methodology
Base value and base date of index are 1000 and Jan 01, 2004 respectively
49
1 - For criteria of CNX Infrastructure Index kindly refer the indices section of NSE website i.e. www.nseindia.com
Goldman Sachs Infrastructure Exchange Traded Scheme (GS Infra BeES)
50
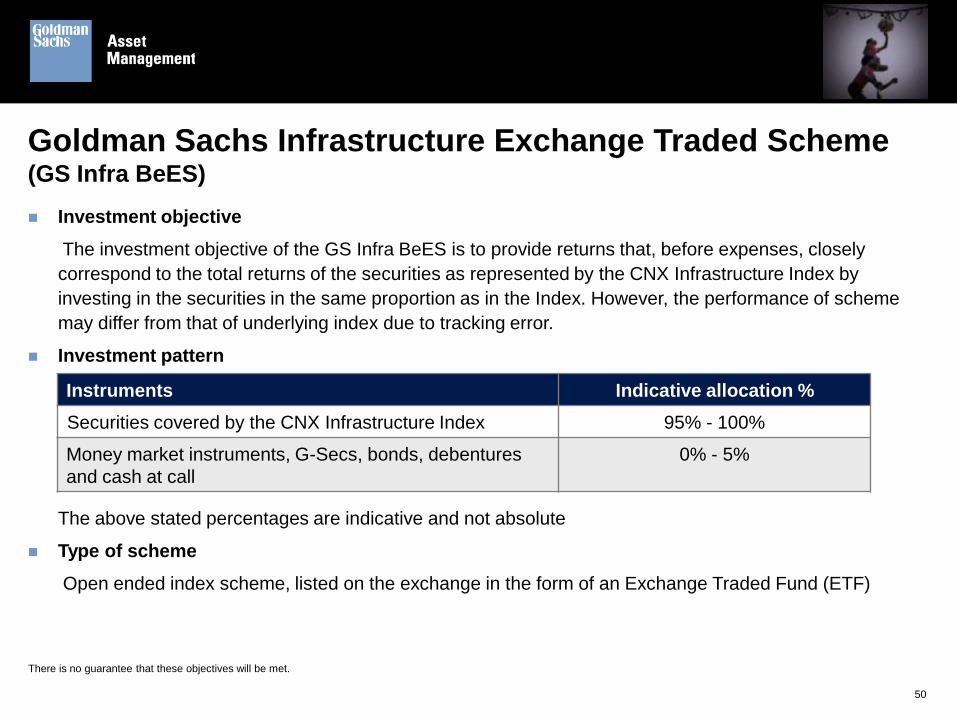
Investment objective
The investment objective of the GS Infra BeES is to provide returns that, before expenses, closely
correspond to the total returns of the securities as represented by the CNX Infrastructure Index by
investing in the securities in the same proportion as in the Index. However, the performance of scheme
may differ from that of underlying index due to tracking error.
Investment pattern
The above stated percentages are indicative and not absolute
Type of scheme
Open ended index scheme, listed on the exchange in the form of an Exchange Traded Fund (ETF)
Instruments Indicative allocation %
Securities covered by the CNX Infrastructure Index 95% - 100%
Money market instruments, G-Secs, bonds, debentures
and cash at call
0% - 5%
There is no guarantee that these objectives will be met.
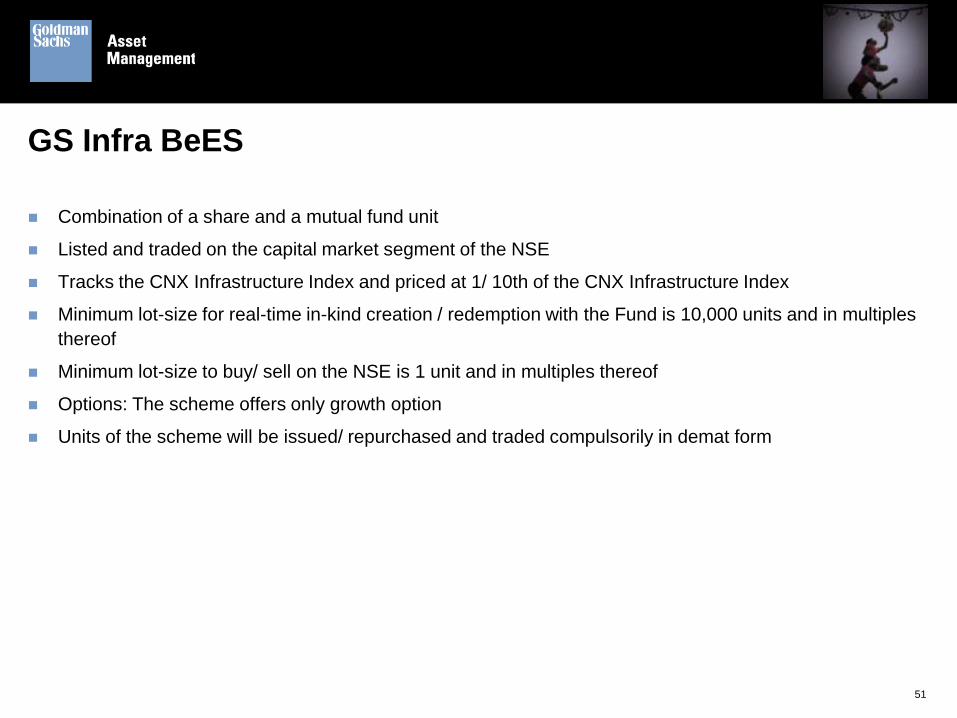
GS Infra BeES
Combination of a share and a mutual fund unit
Listed and traded on the capital market segment of the NSE
Tracks the CNX Infrastructure Index and priced at 1/ 10th of the CNX Infrastructure Index
Minimum lot-size for real-time in-kind creation / redemption with the Fund is 10,000 units and in multiples
thereof
Minimum lot-size to buy/ sell on the NSE is 1 unit and in multiples thereof
Options: The scheme offers only growth option
Units of the scheme will be issued/ repurchased and traded compulsorily in demat form
51
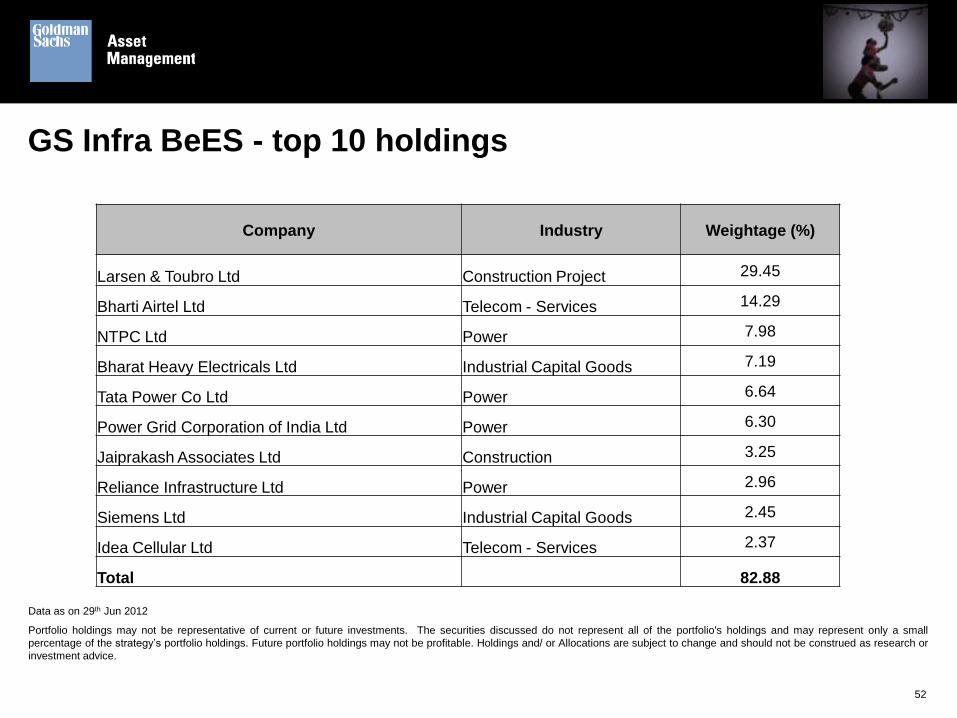
GS Infra BeES - top 10 holdings
52
Data as on 29th Jun 2012
Portfolio holdings may not be representative of current or future investments. The securities discussed do not represent all of the portfolio's holdings and may represent only a small
percentage of the strategy’s portfolio holdings. Future portfolio holdings may not be profitable. Holdings and/ or Allocations are subject to change and should not be construed as research or
investment advice.
Company Industry Weightage (%)
Larsen & Toubro Ltd Construction Project 29.45
Bharti Airtel Ltd Telecom - Services 14.29
NTPC Ltd Power 7.98
Bharat Heavy Electricals Ltd Industrial Capital Goods 7.19
Tata Power Co Ltd Power 6.64
Power Grid Corporation of India Ltd Power 6.30
Jaiprakash Associates Ltd Construction 3.25
Reliance Infrastructure Ltd Power 2.96
Siemens Ltd Industrial Capital Goods 2.45
Idea Cellular Ltd Telecom - Services 2.37
Total 82.88

GS Infra BeES – industry allocation
53
Data as on 29th Jun 2012.
Total allocation may not add to 100% due to rounding.
32.28
28.20
18.93
13.69
3.56 3.25
Construction Project Power Telecom - Services Industrial Capital Goods Transportation Construction
Industry Weightage (%)

GS Infra BeES - scheme details
NSE symbol : INFRABEES
ISIN : INF732E01268
Reuters : IFRB.NS
Bloomberg :IBEES IN Equity
Total expense ratio : 1.00% p.a.1
Tracking error : 0.11% Annualised2
Impact cost : 2.753
Entry / exit Load : Nil
54
Data as on 29th Jun 2012
1 - Financial Year to date Expense Ratio to average AUM
2 - Tracking Error calculated based on monthly Rolling Returns for last 12 months.
3 - Impact cost calculated for period of 6 months ending on 15th Jun 2012, Source: NSE Market Tracker, www.nseindia.com

GS Infra BeES - performance
Returns for one year are absolute. Returns for more than one year are compounded annualized. Distribution taxes are excluded while calculating the
returns. In case, the start/ end date of the concerned period is non business date (NBD), the NAV of the previous date is considered for computation of
returns. Point to Point (PTP) returns in INR is based on standard investment of INR 10,000 made at the beginning of 12 month period as at the end of that
period scheme performance. Additional benchmark for equity scheme - source : National Stock Exchange of India. Past performance may or may not be
sustained in future and should not be used as a basis for comparison with other investments. Past performance does not guarantee future results, which
may vary. Inception date is the allotment date which is September 29, 2010.
Fund manager: Vishal Jain
55
Scheme Name
June 30, 2011 to
June 30, 2012
June 30, 2010 to
June 30, 2011
June 30, 2009 to
June 30, 2010 Since Inception
Absolute PTP Returns Absolute PTP Absolute PTP CAGR PTP
Returns
(%) (INR)
Returns
(%)
Returns
(INR)
Returns
(%)
Returns
(INR)
Returns
(%)
Returns
(INR)
GS Infra BeES -22.49 7751 -- -- -- -- -22.19 6445
CNX Infrastructure Index (Benchmark) -22.50 7750 -- -- -- -- -21.83 6497
CNX Infrastructure Total Returns Index -21.76 7824 -- -- -- -- -21.28 6578
S&P CNX Nifty Index (Addl. Benchmark) -6.53 9347 -- -- -- -- -6.98 8811
Data as on 29th Jun 2012
ETF investing in Overseas Securities
56

Hang Seng Index
The Hang Seng Index (“HSI”) was launched on Nov 24, 1969 and is one of the earliest stock market
indices in Hong Kong
The Hang Seng Indexes Company Ltd. compiles and publishes the HSI
The index is widely recognized as the barometer of the Hong Kong Stock market
The HSI measures the performance of the largest and most liquid companies listed in Hong Kong
The HSI adopts free float-adjusted market capitalization weighted methodology with a 15% cap on each
constituent weightage
The HSI currently comprises of 49 stocks1 which are representative of the Hong Kong stock market
The index represents about 62.40% of the total market capitalization of Hong Kong’s stock exchange2 as
on 29th June 2012
57
1 - As on 29th June 2012. For criteria of Hang Seng Index kindly visit http://www.hsi.com.hk
2 - The universe comprises all main board primary listings.
Goldman Sachs Hang Seng Exchange Traded Scheme (GS Hang Seng BeES)
58
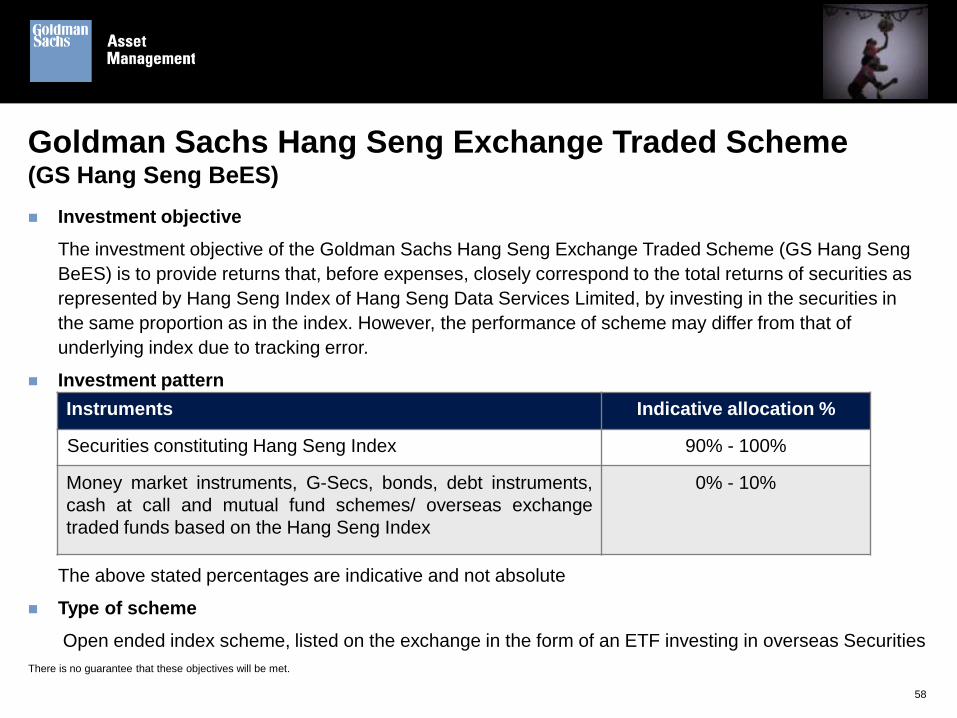
Investment objective
The investment objective of the Goldman Sachs Hang Seng Exchange Traded Scheme (GS Hang Seng
BeES) is to provide returns that, before expenses, closely correspond to the total returns of securities as
represented by Hang Seng Index of Hang Seng Data Services Limited, by investing in the securities in
the same proportion as in the index. However, the performance of scheme may differ from that of
underlying index due to tracking error.
Investment pattern
The above stated percentages are indicative and not absolute
Type of scheme
Open ended index scheme, listed on the exchange in the form of an ETF investing in overseas Securities
Instruments Indicative allocation %
Securities constituting Hang Seng Index 90% - 100%
Money market instruments, G-Secs, bonds, debt instruments,
cash at call and mutual fund schemes/ overseas exchange
traded funds based on the Hang Seng Index
0% - 10%
There is no guarantee that these objectives will be met.

GS Hang Seng BeES
Combination of a share and a mutual fund unit
Listed and traded on the capital market segment of the NSE
Tracks Hang Seng Index and each unit is priced at 1/ 100th of the value of the Hang Seng Index on a
currency adjusted basis
Minimum lot-size for real-time in-kind creation / redemption with the Fund is 10,000 units and in multiples
thereof
Minimum lot-size to buy/ sell on the NSE is 1 unit and in multiples thereof
Options: The scheme offers only growth option
Units of the scheme will be issued/ repurchased and traded compulsorily in demat form
59
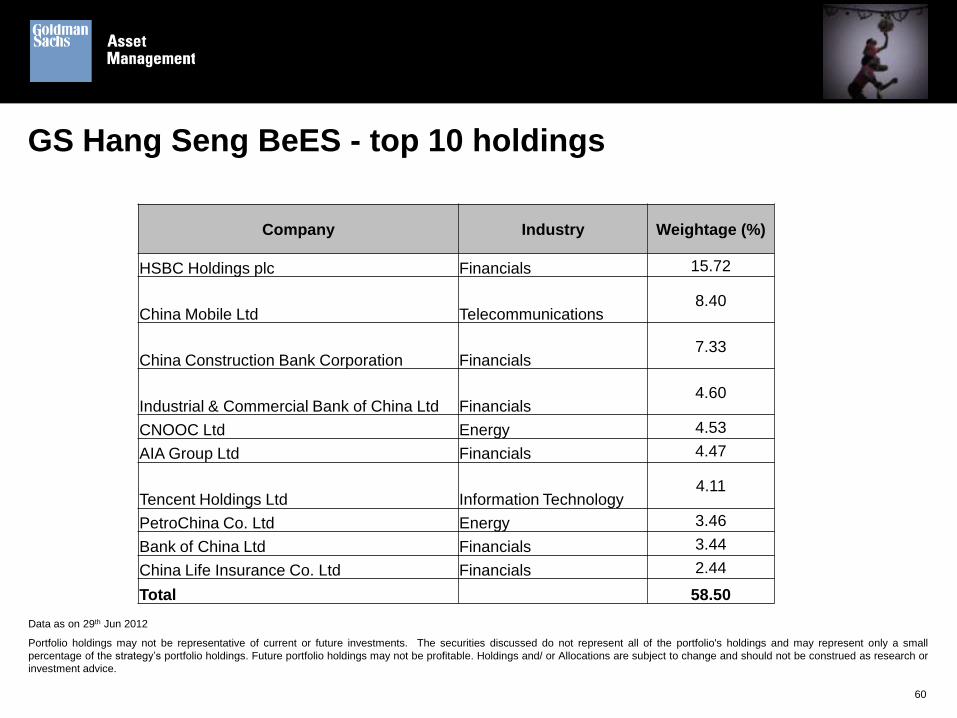
GS Hang Seng BeES - top 10 holdings
60
Data as on 29th Jun 2012
Portfolio holdings may not be representative of current or future investments. The securities discussed do not represent all of the portfolio's holdings and may represent only a small
percentage of the strategy’s portfolio holdings. Future portfolio holdings may not be profitable. Holdings and/ or Allocations are subject to change and should not be construed as research or
investment advice.
Company Industry Weightage (%)
HSBC Holdings plc Financials 15.72
China Mobile Ltd Telecommunications 8.40
China Construction Bank Corporation Financials 7.33
Industrial & Commercial Bank of China Ltd Financials 4.60
CNOOC Ltd Energy 4.53
AIA Group Ltd Financials 4.47
Tencent Holdings Ltd Information Technology 4.11
PetroChina Co. Ltd Energy 3.46
Bank of China Ltd Financials 3.44
China Life Insurance Co. Ltd Financials 2.44
Total 58.50
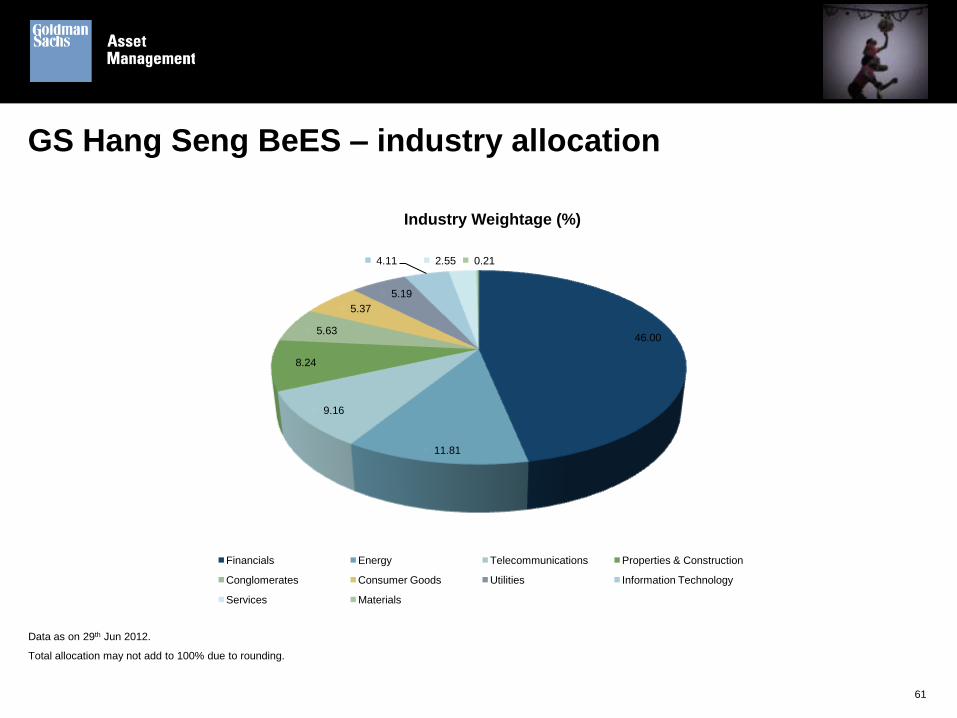
GS Hang Seng BeES – industry allocation
61
Data as on 29th Jun 2012.
Total allocation may not add to 100% due to rounding.
46.00
11.81
9.16
8.24
5.63
5.37
5.19
4.11 2.55 0.21
Financials Energy Telecommunications Properties & Construction
Conglomerates Consumer Goods Utilities Information Technology
Services Materials
Industry Weightage (%)
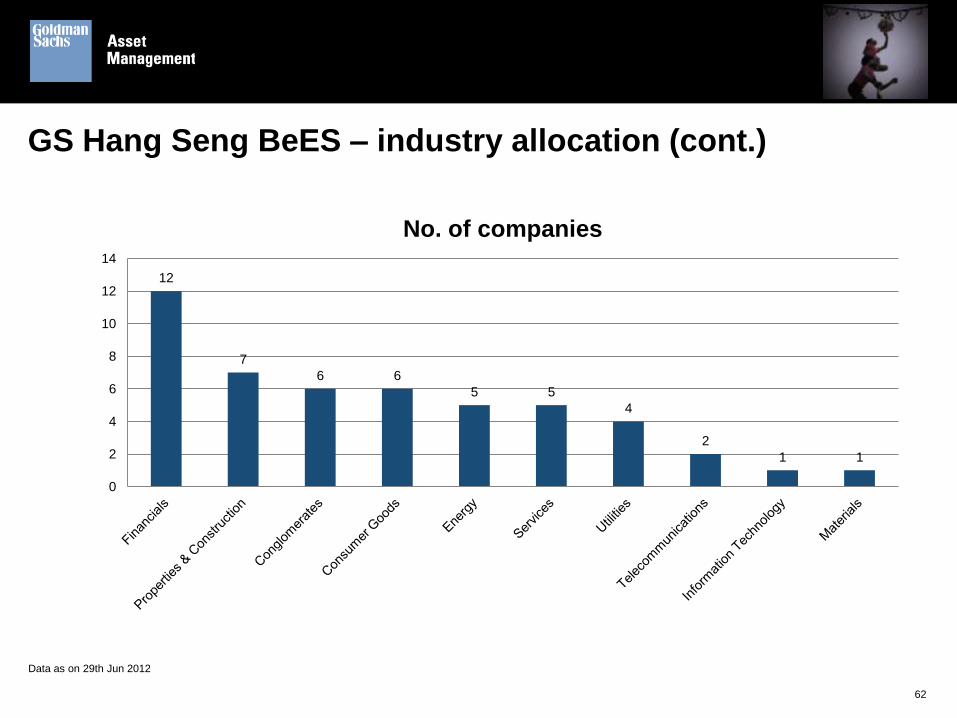
GS Hang Seng BeES – industry allocation (cont.)
62
Data as on 29th Jun 2012
12
7
6 6
5 5
4
2
1 1
0
2
4
6
8
10
12
14
No. of companies

GS Hang Seng BeES - scheme details
NSE symbol : HNGSNGBEES
BSE code : 590113
ISIN : INF732E01227
Reuters : HNGS.NS
Bloomberg :HSBEES IN Equity
Total expense ratio : 1.00 % p.a.1
Tracking error : 0.27% Annualised2
Impact cost : 1.563
Entry / exit load : Nil
63
Data as on 29th Jun 2012
1 - Financial Year to date Expense Ratio to average AUM months.
2 - Tracking Error calculated based on monthly Rolling Returns for last 12 months.
3 - Impact cost calculated for period of 6 months ending on 15th Jun 2012, Source: NSE Market Tracker, www.nseindia.com

GS Hang Seng BeES - performance
Returns for one year are absolute. Returns for more than one year are compounded annualized. Distribution taxes are excluded while calculating the
returns. In case, the start/ end date of the concerned period is non business date (NBD), the NAV of the previous date is considered for computation of
returns. Point to Point (PTP) returns in INR is based on standard investment of INR 10,000 made at the beginning of 12 month period as at the end of that
period scheme performance. Additional benchmark for equity scheme - source : National Stock Exchange of India. Past performance may or may not be
sustained in future and should not be used as a basis for comparison with other investments. Past performance does not guarantee future results, which
may vary. Inception date is the allotment date which is March 09, 2010.
Fund managers: Vishal Jain (For foreign securities) and Payal Kaipunjal (For debt securities)
64
Scheme Name
June 30, 2011 to
June 30, 2012
June 30, 2010 to
June 30, 2011
June 30, 2009 to
June 30, 2010 Since Inception
Absolute PTP Returns Absolute PTP Absolute PTP CAGR PTP
Returns
(%) (INR)
Returns
(%)
Returns
(INR)
Returns
(%)
Returns
(INR)
Returns
(%)
Returns
(INR)
GS Hang Seng BeES 11.56 11156 8.98 10898 -- -- 8.18 11992
Hang Seng Index (Benchmark) -13.20 8680 11.27 11127 -- -- -3.69 9167
Hang Seng Total Returns Index 12.61 11261 10.18 11018 -- -- 8.92 12181
S&P CNX Nifty Index (Addl. Benchmark) -6.53 9347 6.30 10630 -- -- 1.49 10348
Data as on 29th Jun 2012

Indices – facts
65
Index Full Market Cap. (Rs. Crs.) P/E P/B Dividend Yield (%)
S&P CNX Nifty 3,539,863.32 17.51 3.02 1.51
CNX Nifty Junior 717,361.42 15.50 2.19 1.46
CNX Bank Index 602,144.89 14.13 2.43 1.24
CNX PSU Bank Index 298,640.56 7.85 1.51 2.15
S&P CNX Nifty Shariah Index 1,985,071.52 17.52 3.38 1.68
CNX Infrastructure Index 707,954.78 18.32 2.03 1.21
Source: www.nseindia.com
Index Full Market Cap. (Rs. Crs.) P/E Dividend Yield (%)
Hang Seng Index 8,090,933.38 9.30 3.72
Source: Hang Seng Indexes Company Limited
P/E – Price to Earning ratio
P/B – Price to Book ratio
Data as on 29th Jun 2012

Gold ETF
66

67
Goldman Sachs Gold Exchange Traded Scheme (GS Gold
BeES)
Investment objective
The investment objective of GS Gold BeES is to provide returns that, before expenses, closely
correspond to the returns provided by the domestic price of gold through physical gold.
Investment pattern
1- Investments in securitized debts can be made by the scheme up to 5% of the net assets.
Type of scheme
An open ended scheme, listed on the exchange in the form of an ETF investing in physical gold
Instruments Indicative allocation %
Physical gold 90% to 100%
Money market instruments, securitized debts1, bonds including
cash at call
0% to 10%
There is no guarantee that these objectives will be met.

GS Gold BeES
One unit represents approximately one gram of gold
Listed and traded on the capital market segment of NSE
Quotes on the NSE would vary, taking into consideration various aspects such as international market
movements, demand, supply, exchange rate fluctuations, etc
No securities transaction tax
68

GS Gold BeES
Minimum lot-size for real-time in kind creation/ redemption with the fund is 1000 units and in multiples
thereof
Minimum lot-size to buy/ sell on NSE is one unit and in multiples thereof
Options: The scheme offers only growth option
Units of the scheme will be issued/ repurchased and traded compulsorily in demat form
Benchmark for the scheme: Domestic price of gold
69

GS Gold BeES - scheme details
NSE symbol : GOLDBEES
BSE code : 590095
ISIN : INF732E01102
Reuters : GBES.NS
Bloomberg :GBEES IN EQUITY
Total expense ratio : 1.00% p.a.1
Tracking error : 0.47% annualised2
Impact cost : 0.033
Entry / exit load : Nil
70
Data as on 29th Jun 2012
1 - Financial Year to date Expense Ratio to average AUM
2 - Tracking Error calculated based on monthly Rolling Returns for last 12 months.
3 - Impact cost calculated for period of 6 months ending on 15th Jun 2012, Source: NSE Market Tracker, www.nseindia.com.

GS Gold BeES - performance
Returns for one year are absolute. Returns for more than one year are compounded annualized. Distribution taxes are excluded while calculating the
returns. In case, the start/end date of the concerned period is non business date (NBD), the NAV of the previous date is considered for computation of
returns. Point to Point (PTP) returns in INR is based on standard investment of INR 10,000 made at the beginning of 12 month period as at the end of that
period scheme performance. Past performance may or may not be sustained in future and should not be used as a basis for comparison with other
investments. Past performance does not guarantee future results, which may vary. Inception date is the allotment date which is March 08, 2007.
Fund manager: Vishal Jain
71
Scheme Name
June 30, 2011 to
June 30, 2012
June 30, 2010 to
June 30, 2011
June 30, 2009 to
June 30, 2010 Since Inception
Absolute PTP Returns Absolute PTP Absolute PTP CAGR PTP
Returns
(%) (INR)
Returns
(%)
Returns
(INR)
Returns
(%)
Returns
(INR)
Returns
(%)
Returns
(INR)
GS Gold BeES 32.84 13284 15.18 11518 28.61 12861 22.91 29934
Domestic Price of Gold (Benchmark) 34.83 13483 16.36 11636 29.49 12949 24.16 31585
Data as on 29th Jun 2012
Money Market ETF
72

Goldman Sachs Liquid Exchange Traded Scheme (GS Liquid BeES)
73
Investment objective
The investment objective of the GS Liquid BeES is to seek to provide current income, commensurate
with relatively low risk while providing a high level of liquidity, primarily through a portfolio of treasury bills,
government securities, call money, collateralised lending and borrowing obligation (CBLO)/ similar
instruments, repos and reverse repos and other money market Instruments.
Investment pattern
Type of scheme
An open ended liquid scheme, listed on the exchange in the form of an ETF, with daily Dividend and
compulsory reinvestment of Dividend
There is no guarantee that these objectives will be met.
Instruments Indicative allocation (% of Net Assets)
Maximum Minimum
Treasury bills and government securities Up to 100% 65%
Call money, CBLOs, repos and reverse repos
Other money market instruments Up to 35% 0%

What is GS Liquid BeES?
Mainly suited for capital market investors who wish to park idle cash in most convenient way
The face value of each unit of GS Liquid BeES is Rs. 1000 and the fund endeavors to keep the daily NAV
at Rs. 1000
The returns accrue to the investors in the form of a daily dividend, which is compulsorily reinvested into
the scheme
The units arising out of a dividend reinvestment are credited to the beneficiary (demat) account of the
investor at least once in 30 days
Units of GS Liquid BeES are uploaded up to 4 decimal points
74

GS Liquid BeES – an ideal investment tool
GS Liquid BeES is an extremely efficient and convenient solution for utilizing the cash balance between
trades in the equity market (NSE)
When an investor sells his shares on NSE, he can instruct the broker to purchase GS Liquid BeES of
equal amount
This will ensure that from the date of settlement (T+2) the investor will start earning dividends
Investors do not have to go through the inconvenience of receiving and depositing a cheque into their
bank account, and then waiting for the cheque to clear before they can invest in a liquid fund
75
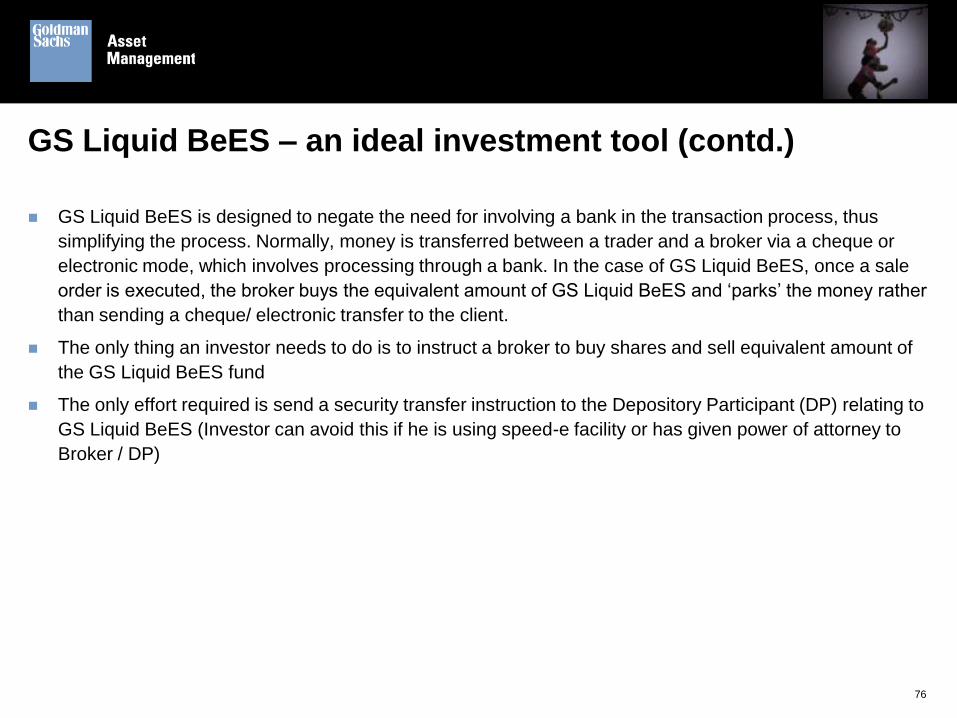
GS Liquid BeES – an ideal investment tool (contd.)
GS Liquid BeES is designed to negate the need for involving a bank in the transaction process, thus
simplifying the process. Normally, money is transferred between a trader and a broker via a cheque or
electronic mode, which involves processing through a bank. In the case of GS Liquid BeES, once a sale
order is executed, the broker buys the equivalent amount of GS Liquid BeES and ‘parks’ the money rather
than sending a cheque/ electronic transfer to the client.
The only thing an investor needs to do is to instruct a broker to buy shares and sell equivalent amount of
the GS Liquid BeES fund
The only effort required is send a security transfer instruction to the Depository Participant (DP) relating to
GS Liquid BeES (Investor can avoid this if he is using speed-e facility or has given power of attorney to
Broker / DP)
76

GS Liquid BeES
Listed and traded on the capital market segment of the NSE
Constant quotes for any size at 999.99 to INR 1000.01on the NSE
No Securities Transaction Tax (STT)
Can be used as cash equivalent margin for derivatives segment with a 10% hair cut
Minimum creation size (directly with the Fund) of 2500 units and in multiple of 1 unit thereafter
Minimum lot-size to buy/ sell on the NSE is 1 unit and in multiples thereof
Custodian & transaction charges have been waived by NSDL & CDSL
Units of the scheme will be issued/ repurchased and traded compulsorily in demat form
Investors can subscribe/ redeem through the mutual fund trading platform viz. BSE StAR MF of BSE and
the Mutual Fund Service System (MFSS) of the NSE. For subscriptions, the minimum amount of Rs.1 and
in multiples thereof. For redemption, the minimum is of 0.001 units and in multiples thereof
Benchmark for the scheme: CRISIL Liquid Fund Index
77

GS Liquid BeES – scheme details
NSE symbol : LIQUIDBEES
BSE code : 590096
ISIN : INF732E01037
Reuters : LBES.NS
Bloomberg :LBEES IN
Total expense ratio : 0.60% p.a.1
Impact cost : 0.012
Entry / exit load : Nil
78
Data as on 29th Jun 2012
1 - Financial Year to date Expense Ratio to average AUM
2- Impact cost calculated for period of 6 months ending on 15th Jun 2012, Source: NSE Market Tracker, www.nseindia.com.
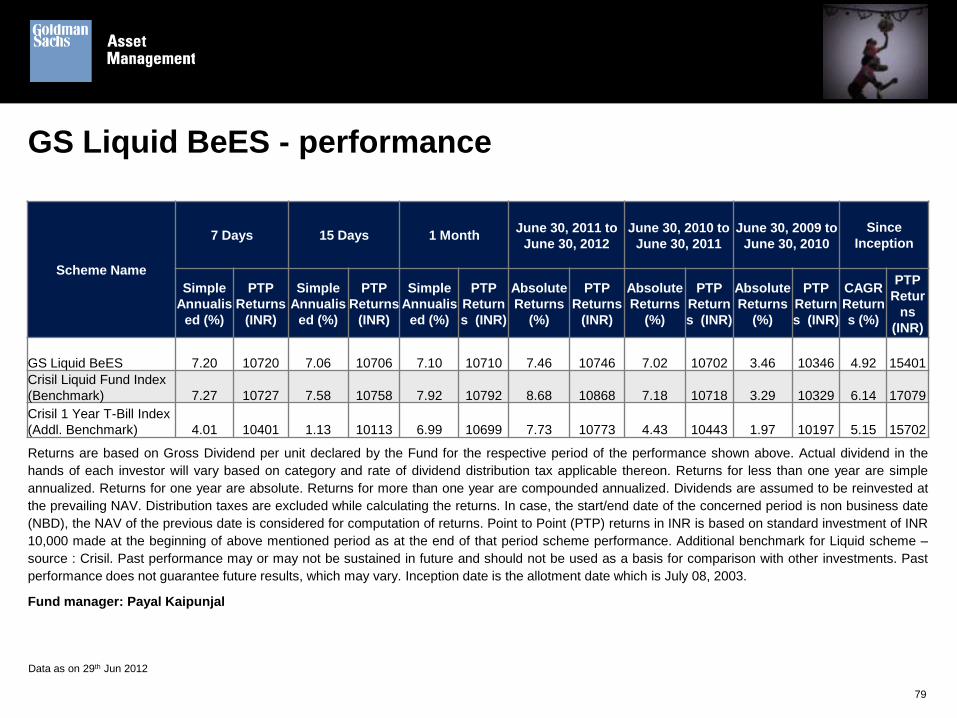
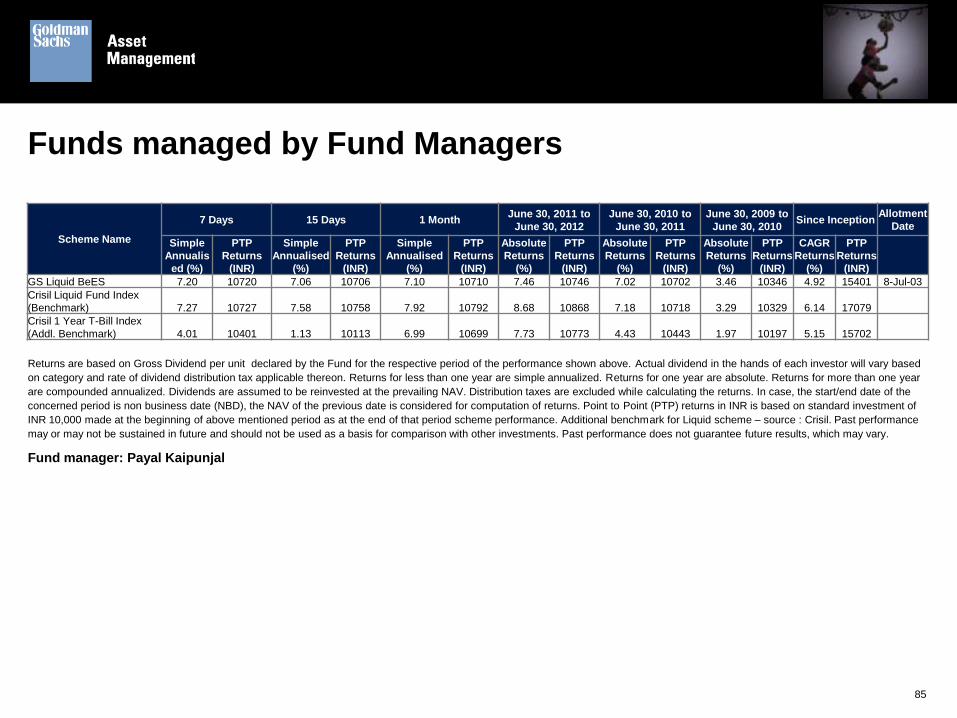
GS Liquid BeES - performance
Returns are based on Gross Dividend per unit declared by the Fund for the respective period of the performance shown above. Actual dividend in the
hands of each investor will vary based on category and rate of dividend distribution tax applicable thereon. Returns for less than one year are simple
annualized. Returns for one year are absolute. Returns for more than one year are compounded annualized. Dividends are assumed to be reinvested at
the prevailing NAV. Distribution taxes are excluded while calculating the returns. In case, the start/end date of the concerned period is non business date
(NBD), the NAV of the previous date is considered for computation of returns. Point to Point (PTP) returns in INR is based on standard investment of INR
10,000 made at the beginning of above mentioned period as at the end of that period scheme performance. Additional benchmark for Liquid scheme –
source : Crisil. Past performance may or may not be sustained in future and should not be used as a basis for comparison with other investments. Past
performance does not guarantee future results, which may vary. Inception date is the allotment date which is July 08, 2003.
Fund manager: Payal Kaipunjal
79
Data as on 29th Jun 2012
Scheme Name
7 Days 15 Days 1 Month June 30, 2011 to
June 30, 2012
June 30, 2010 to
June 30, 2011
June 30, 2009 to
June 30, 2010
Since
Inception
Simple
Annualis
ed (%)
PTP
Returns
(INR)
Simple
Annualis
ed (%)
PTP
Returns
(INR)
Simple
Annualis
ed (%)
PTP
Return
s (INR)
Absolute
Returns
(%)
PTP
Returns
(INR)
Absolute
Returns
(%)
PTP
Return
s (INR)
Absolute
Returns
(%)
PTP
Return
s (INR)
CAGR
Return
s (%)
PTP
Retur
ns
(INR)
GS Liquid BeES 7.20 10720 7.06 10706 7.10 10710 7.46 10746 7.02 10702 3.46 10346 4.92 15401
Crisil Liquid Fund Index
(Benchmark) 7.27 10727 7.58 10758 7.92 10792 8.68 10868 7.18 10718 3.29 10329 6.14 17079
Crisil 1 Year T-Bill Index
(Addl. Benchmark) 4.01 10401 1.13 10113 6.99 10699 7.73 10773 4.43 10443 1.97 10197 5.15 15702

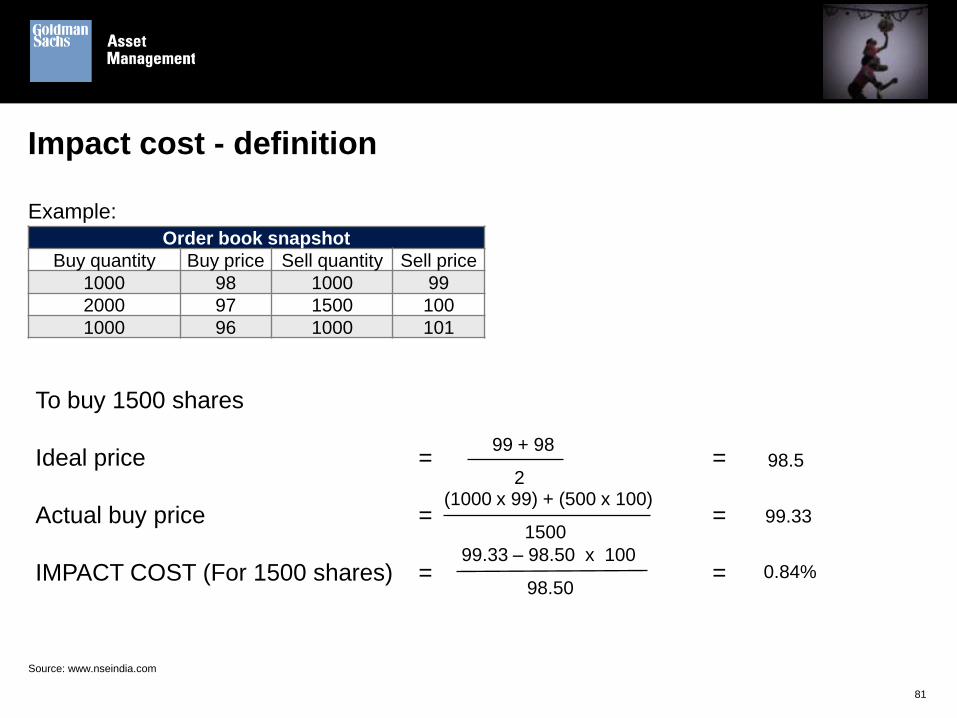
Impact cost represents the cost of executing a transaction in a given stock, for a specific predefined order size, at
any given point of time.
Impact cost is a practical and realistic measure of market liquidity; it is closer to the true cost of execution faced by
a trader in comparison to the bid-ask spread.
It should however be emphasised that :
(a) impact cost is separately computed for buy and sell
(b) impact cost may vary for different transaction sizes
(c) impact cost is dynamic and depends on the outstanding orders
(d) where a stock is not sufficiently liquid, a penal impact cost is applied
In mathematical terms it is the percentage mark up observed while buying/ selling the desired quantity of a stock
with reference to its ideal price (best buy + best sell)/ 2.
8
1
Impact cost - definition
Source: www.nseindia.com
81
Impact cost - definition
Example:
Order book snapshot
Buy quantity Buy price Sell quantity Sell price
1000 98 1000 99
2000 97 1500 100
1000 96 1000 101
To buy 1500 shares
Ideal price = =
Actual buy price = =
IMPACT COST (For 1500 shares) = =
99 + 98
2 98.5
(1000 x 99) + (500 x 100)
1500 99.33
99.33 – 98.50 x 100
98.50 0.84%
Source: www.nseindia.com
82
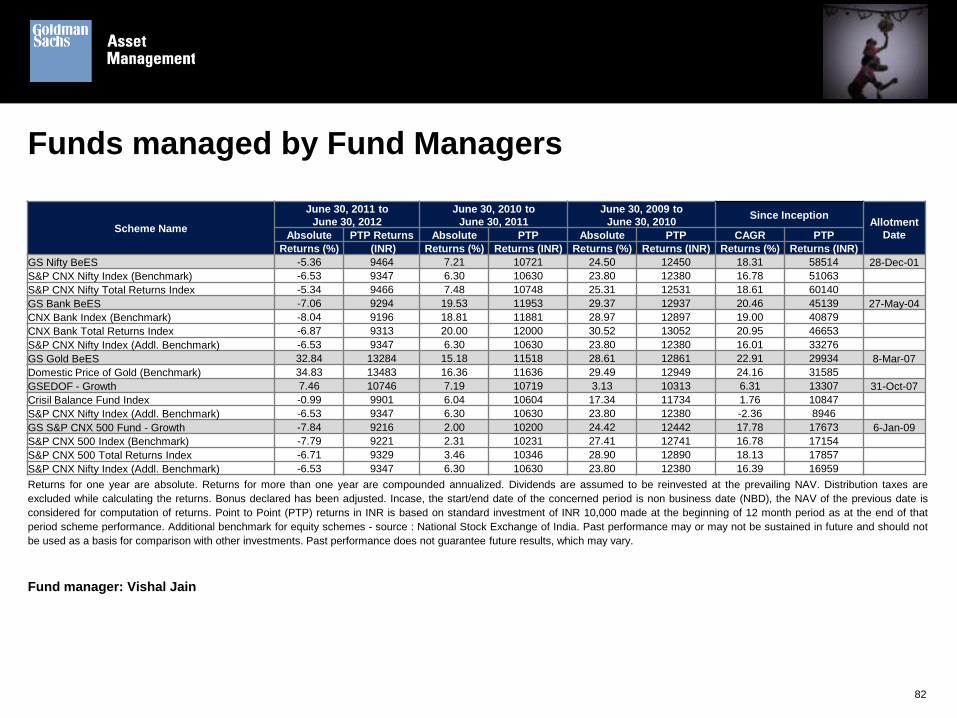
Funds managed by Fund Managers
Returns for one year are absolute. Returns for more than one year are compounded annualized. Dividends are assumed to be reinvested at the prevailing NAV. Distribution taxes are
excluded while calculating the returns. Bonus declared has been adjusted. Incase, the start/end date of the concerned period is non business date (NBD), the NAV of the previous date is
considered for computation of returns. Point to Point (PTP) returns in INR is based on standard investment of INR 10,000 made at the beginning of 12 month period as at the end of that
period scheme performance. Additional benchmark for equity schemes - source : National Stock Exchange of India. Past performance may or may not be sustained in future and should not
be used as a basis for comparison with other investments. Past performance does not guarantee future results, which may vary.
Fund manager: Vishal Jain
Scheme Name
June 30, 2011 to
June 30, 2012
June 30, 2010 to
June 30, 2011
June 30, 2009 to
June 30, 2010 Since Inception
Allotment
Date Absolute PTP Returns Absolute PTP Absolute PTP CAGR PTP
Returns (%) (INR) Returns (%) Returns (INR) Returns (%) Returns (INR) Returns (%) Returns (INR)
GS Nifty BeES -5.36 9464 7.21 10721 24.50 12450 18.31 58514 28-Dec-01
S&P CNX Nifty Index (Benchmark) -6.53 9347 6.30 10630 23.80 12380 16.78 51063
S&P CNX Nifty Total Returns Index -5.34 9466 7.48 10748 25.31 12531 18.61 60140
GS Bank BeES -7.06 9294 19.53 11953 29.37 12937 20.46 45139 27-May-04
CNX Bank Index (Benchmark) -8.04 9196 18.81 11881 28.97 12897 19.00 40879
CNX Bank Total Returns Index -6.87 9313 20.00 12000 30.52 13052 20.95 46653
S&P CNX Nifty Index (Addl. Benchmark) -6.53 9347 6.30 10630 23.80 12380 16.01 33276
GS Gold BeES 32.84 13284 15.18 11518 28.61 12861 22.91 29934 8-Mar-07
Domestic Price of Gold (Benchmark) 34.83 13483 16.36 11636 29.49 12949 24.16 31585
GSEDOF - Growth 7.46 10746 7.19 10719 3.13 10313 6.31 13307 31-Oct-07
Crisil Balance Fund Index -0.99 9901 6.04 10604 17.34 11734 1.76 10847
S&P CNX Nifty Index (Addl. Benchmark) -6.53 9347 6.30 10630 23.80 12380 -2.36 8946
GS S&P CNX 500 Fund - Growth -7.84 9216 2.00 10200 24.42 12442 17.78 17673 6-Jan-09
S&P CNX 500 Index (Benchmark) -7.79 9221 2.31 10231 27.41 12741 16.78 17154
S&P CNX 500 Total Returns Index -6.71 9329 3.46 10346 28.90 12890 18.13 17857
S&P CNX Nifty Index (Addl. Benchmark) -6.53 9347 6.30 10630 23.80 12380 16.39 16959

83
Funds managed by Fund Managers
Returns for one year are absolute. Returns for more than one year are compounded annualized. Dividends are assumed to be reinvested at the prevailing NAV. Distribution taxes are
excluded while calculating the returns. Bonus declared has been adjusted. Incase, the start/end date of the concerned period is non business date (NBD), the NAV of the previous date is
considered for computation of returns. Point to Point (PTP) returns in INR is based on standard investment of INR 10,000 made at the beginning of 12 month period as at the end of that
period scheme performance. Additional benchmark for equity schemes - source : National Stock Exchange of India. Past performance may or may not be sustained in future and should not
be used as a basis for comparison with other investments. Past performance does not guarantee future results, which may vary.
Fund manager: Vishal Jain
Scheme Name
June 30, 2011 to
June 30, 2012
June 30, 2010 to
June 30, 2011
June 30, 2009 to
June 30, 2010 Since Inception
Allotment
Date Absolute PTP Returns Absolute PTP Absolute PTP CAGR PTP
Returns (%) (INR) Returns (%) Returns (INR) Returns (%) Returns (INR) Returns (%) Returns (INR)
GS S&P Shariah BeES -5.67 9433 0.15 10015 20.13 12013 19.17 17789 18-Mar-09
S&P CNX Nifty Shariah Index -6.26 9374 -0.48 9952 19.86 11986 18.45 17438
(Benchmark)
S&P CNX Nifty Shariah -4.81 9519 0.85 10085 21.31 12131 19.99 18198
Total Returns Index
S&P CNX Nifty Index (Addl. Benchmark) -6.53 9347 6.30 10630 23.80 12380 21.36 18889
GS Hang Seng BeES 11.56 11156 8.98 10898 -- -- 8.18 11992 9-Mar-10
Hang Seng Index (Benchmark) -13.20 8680 11.27 11127 -- -- -3.69 9167
Hang Seng Total Returns Index 12.61 11261 10.18 11018 -- -- 8.92 12181
S&P CNX Nifty Index (Addl. Benchmark) -6.53 9347 6.30 10630 -- -- 1.49 10348
GS Infra BeES -22.49 7751 -- -- -- -- -22.19 6445 29-Sep-10
CNX Infrastructure Index (Benchmark) -22.50 7750 -- -- -- -- -21.83 6497
CNX Infrastructure Total Returns Index -21.76 7824 -- -- -- -- -21.28 6578
S&P CNX Nifty Index (Addl. Benchmark) -6.53 9347 -- -- -- -- -6.98 8811

84
Funds managed by Fund Managers
Returns for one year and less than one year are absolute. Returns for more than one year are compounded annualized. Dividends are assumed to be reinvested at the prevailing NAV.
Distribution taxes are excluded while calculating the returns. Bonus declared has been adjusted. Incase, the start/end date of the concerned period is non business date (NBD), the NAV of
the previous date is considered for computation of returns. Point to Point (PTP) returns in INR is based on standard investment of INR 10,000 made at the beginning of 12 month period as at
the end of that period scheme performance. Additional benchmark for equity schemes - source : National Stock Exchange of India. Additional benchmark for Debt scheme - source : Crisil.
Past performance may or may not be sustained in future and should not be used as a basis for comparison with other investments. Past performance does not guarantee future results, which
may vary.
Fund manager: Payal Kaipunjal
Scheme Name
June 30, 2011 to
June 30, 2012
June 30, 2010 to
June 30, 2011
June 30, 2009 to
June 30, 2010 Since Inception
Allotment
Date Absolute PTP Returns Absolute PTP Absolute PTP CAGR PTP
Returns (%) (INR) Returns (%) Returns (INR) Returns (%) Returns (INR) Returns (%) Returns (INR)
GS Junior BeES -9.60 9040 -0.56 9944 44.15 14415 23.65 72908 21-Feb-03
CNX Nifty Junior Index (Benchmark) -10.11 8989 -0.62 9938 45.03 14503 23.51 72155
CNX Nifty Junior Total Returns Index -9.06 9094 0.37 10037 46.47 14647 25.26 82315
S&P CNX Nifty Index (Addl. Benchmark) -6.53 9347 6.30 10630 23.80 12380 18.64 49514
GS PSU Bank BeES -15.12 8488 9.76 10976 36.85 13685 6.02 13147 25-Oct-07
CNX PSU Bank Index (Benchmark) -16.79 8321 8.75 10875 36.38 13638 4.70 12400
CNX PSU Bank Total Returns Index -14.90 8510 10.46 11046 38.78 13878 6.92 13677
S&P CNX Nifty Index (Addl. Benchmark) -6.53 9347 6.30 10630 23.80 12380 -1.14 9479
GS Hang Seng BeES 11.56 11156 8.98 10898 -- -- 8.18 11992 9-Mar-10
Hang Seng Index (Benchmark) -13.20 8680 11.27 11127 -- -- -3.69 9167
Hang Seng Total Returns Index 12.61 11261 10.18 11018 -- -- 8.92 12181
S&P CNX Nifty Index (Addl. Benchmark) -6.53 9347 6.30 10630 -- -- 1.49 10348
GSSTF - Growth 7.56 10756 -- -- -- -- 6.63 11301 4-Aug-10
Crisil Liquid Fund Index 8.68 10868 -- -- -- -- 8.06 11590
Crisil 10 Year Gilt Index (Addl. Benchmark) 7.10 10710 -- -- -- -- 5.32 11037
85
Scheme Name
7 Days 15 Days 1 Month June 30, 2011 to
June 30, 2012
June 30, 2010 to
June 30, 2011
June 30, 2009 to
June 30, 2010 Since Inception
Allotment
Date
Simple
Annualis
ed (%)
PTP
Returns
(INR)
Simple
Annualised
(%)
PTP
Returns
(INR)
Simple
Annualised
(%)
PTP
Returns
(INR)
Absolute
Returns
(%)
PTP
Returns
(INR)
Absolute
Returns
(%)
PTP
Returns
(INR)
Absolute
Returns
(%)
PTP
Returns
(INR)
CAGR
Returns
(%)
PTP
Returns
(INR)
GS Liquid BeES 7.20 10720 7.06 10706 7.10 10710 7.46 10746 7.02 10702 3.46 10346 4.92 15401 8-Jul-03
Crisil Liquid Fund Index
(Benchmark) 7.27 10727 7.58 10758 7.92 10792 8.68 10868 7.18 10718 3.29 10329 6.14 17079
Crisil 1 Year T-Bill Index
(Addl. Benchmark) 4.01 10401 1.13 10113 6.99 10699 7.73 10773 4.43 10443 1.97 10197 5.15 15702
Funds managed by Fund Managers
Returns are based on Gross Dividend per unit declared by the Fund for the respective period of the performance shown above. Actual dividend in the hands of each investor will vary based
on category and rate of dividend distribution tax applicable thereon. Returns for less than one year are simple annualized. Returns for one year are absolute. Returns for more than one year
are compounded annualized. Dividends are assumed to be reinvested at the prevailing NAV. Distribution taxes are excluded while calculating the returns. In case, the start/end date of the
concerned period is non business date (NBD), the NAV of the previous date is considered for computation of returns. Point to Point (PTP) returns in INR is based on standard investment of
INR 10,000 made at the beginning of above mentioned period as at the end of that period scheme performance. Additional benchmark for Liquid scheme – source : Crisil. Past performance
may or may not be sustained in future and should not be used as a basis for comparison with other investments. Past performance does not guarantee future results, which may vary.
Fund manager: Payal Kaipunjal

Scheme details
Goldman Sachs S&P CNX 500 Fund
Fund name and classification: Goldman Sachs S&P CNX 500 Fund, an open ended index scheme. Investment objective: The investment objective of the scheme is
to generate capital appreciation through equity investments by investing in securities which are constituents of S&P CNX 500 Index in the same proportion as in the index.
Benchmark index: S&P CNX 500 Index. Investment pattern: Type of instruments – A) Securities constituting S&P CNX 500, Derivatives on the Securities constituting
S&P CNX 500, 90 – 100%. B) Money Market Instruments, Government Securities, bonds, debentures and cash at call, 0-10%. (The notional exposure of scheme in
derivative instruments shall be restricted to 10% of the net assets of the scheme). Option: A) Growth B) Dividend (1.Dividend Payout 2. Dividend Reinvestment) Load:
Entry Load- Nil, Exit Load: Nil if redeemed after 1 year from date of allotment and 1.50% if redeemed within 1 year from date of allotment. Minimum application amount:
For initial purchase: Rs. 10,000/- (Rupees ten thousands) and in multiple of Re. 1/- thereafter and for subsequent Purchase: Rs. 1,000/- (Rupees One Thousand only) and
in multiples of Re. 1/- thereafter. Systematic investment plan (SIP) in an option of the scheme: The minimum amount for each installment is Rs. 1,000/- and in
multiple of Re. 1/- thereafter and minimum number of installment for SIP will be 12. When the SIP is started, the date of the first cheque shall be the same as the date of
the application while the remaining payment instructions (minimum 11 additional payment instructions mentioned in the application form) shall be either for the 1st or 15th
of a month provided there is a minimum period of 30 days after the first payment instruction. Please refer to SIP enrolment form for term & conditions before enrolment.
For Value Averaging Investment Plan (VIP) in an option of the scheme : Nominal investment amount - This is the amount which the investor will invest at the time of
enrolment for a VIP. The nominal amount is used to calculate the target portfolio amount. In the circumstances when the market rises in a straight line, giving the target
return, this amount would be the actual amount to be invested. The minimum nominal amount is Rs. 2,000/- and in multiples of Re.1/- thereafter and there is no maximum
cap on this amount. Minimum investment amount per month - 0 (Zero). Maximum monthly debit amount - This amount is the maximum amount which the investor would
allow the fund to debit from their account. There is no upper limit for this amount but the amount shall be higher than the nominal amount. The rate of return to be
considered for a VIP is 15% per annum based on which the monthly installments of investments to be invested by the Investor would be calculated. Investor benefits
and general services: Investors can also subscribe to the units through the mutual fund trading platforms viz. BSE StAR MF of Bombay Stock Exchange Limited (BSE)
and Mutual Fund Service System (MFSS) of NSE. Investors can subscribe units either in physical or demat form. The asset management company will calculate and
disclose the NAV of the scheme at the close of every business day.
86

Goldman Sachs Equity & Derivatives Opportunities Fund (GSEDOF)
Fund name and classification: Goldman Sachs Equity & Derivatives Opportunities Fund, an open ended equity scheme. Investment objective: The investment
objective of the scheme is to provide absolute returns by taking advantage of opportunities in the underlying cash and Derivative markets, and through deployment of
surplus cash in fixed income Securities. The Scheme is designed for Investors seeking long term capital appreciation primarily through investment in a diversified portfolio
of strategies. Benchmark index: CRISIL Balanced Fund Index. Investment pattern: Type of instruments – A) Equities & equity related Derivative instruments (The
exposure to Derivatives shown is the exposure taken against the underlying equity investments and should not be considered for calculating the total asset allocation. The
idea is not to take additional asset allocation with the use of Derivatives), 65% – 100% B) Money Market Instruments, Debt Instruments and cash at call, 0% - 35%
Option: A) Growth B) Dividend (1.Dividend Payout 2. Dividend Reinvestment). Load: Entry Load- Nil, Exit Load: Nil if redeemed after 1 year from date of allotment and
1.50% if redeemed within 1 year from date of allotment. Minimum application amount: For initial purchase: Rs. 10,000/- (Rupees Ten Thousand only) and in multiples of
Re. 1/- thereafter and for subsequent Purchase: Rs. 1,000/- (Rupees One Thousand only) and in multiples of Re. 1/- thereafter. Systematic Investment Plan (SIP) in an
option of the scheme: The minimum amount for every installment is Rs. 1,000/- and in multiple of Re. 1/- thereafter and minimum number of installment for SIP will be
12. When the SIP is started, the date of the first cheque shall be the same as the date of the application while the remaining payment instructions (minimum 11 additional
payment instructions mentioned in the application form) shall be either for the 1st or 15th of a month provided there is a minimum period of 30 days after the first payment
instruction. Please refer to SIP Enrolment Form for term & conditions before enrolment. Systematic Transfer Plan (STP) in an option of the scheme: The minimum
amount for each transfer shall be Rs. 1,000/- and in multiples of Re. 1/- thereafter and minimum number of installment for STP will be 12. Unit holder can transfer the
amount on a monthly basis on 1st or 15th of each month. In case the STP date specified is a non-business day, the transaction will be processed on the immediately
succeeding business day. Please refer to STP/VTP Enrolment Form for term & conditions before enrolment. Value Averaging Transfer Plan (VTP) in an option of the
scheme: The minimum nominal amount of Rs. 2,000/- for monthly frequency and in multiples of Re.1/- with a minimum of 12 installments in an option of the scheme with
no maximum cap on this amount. The amount for this VTP would be calculated as per the formula of value averaging investment plan of Goldman Sachs S&P CNX 500
Fund. Unit holder can transfer the amount on a monthly basis on 1st or 15th of each month. In case the VTP date specified is a non-business day, the transaction will be
processed on the immediately succeeding business day. Please refer to STP/VTP Enrolment Form for term & conditions before enrolment. Investor benefits and
general services: Investors can also subscribe to the units through the mutual fund trading platforms viz. BSE StAR MF of Bombay Stock Exchange Limited (BSE) and
Mutual Fund Service System (MFSS) of NSE. Investors can subscribe units either in physical or demat form. The asset management company will calculate and disclose
the NAV of the scheme at the close of every business day.
87
Scheme details

Goldman Sachs Short Term Fund (GSSTF)
Fund name and classification: Goldman Sachs Short Term Fund, an open ended debt scheme. Investment Objective: The investment objective of the scheme is to
enhance returns with minimum risk by investing in a portfolio of money market and debt instruments while maintaining the safety and liquidity. Benchmark Index: Crisil
Liquid Fund Index Investment Pattern: Type of instruments – A) Debt Instruments having residual maturity up to 1 year, 0%-100% B) Debt Instruments having a residual
maturity between 1 year and 3 years, 0%-50% (Debt instruments may include securitised debts up to 50% of the net assets.) The combined exposure of debt and money
market instruments (excluding CBLO/Repo) and gross notional exposure of derivative instruments shall not exceed 100% of the net assets of the scheme. Option: A)
Growth B) Dividend ( Dividend reinvestment with daily and weekly frequency). Load: Entry Load – Nil; Exit Load – Nil. Minimum Application Amount: Rs. 10,000/-
(Rupees Ten Thousand only) and in multiples of Re.1/- thereafter in an Option of the Scheme. Additional investment would be Rs. 1000 (One Thousand Only) and in
multiples of Re. 1/- thereafter. Systematic Investment Plan (SIP) in an option of the scheme: The minimum amount for every installment is Rs. 1,000/- and in multiple
of Re. 1/- thereafter and minimum number of installment for SIP will be 12. When the SIP is started, the date of the first cheque shall be the same as the date of the
application while the remaining payment instructions (minimum 11 additional payment instructions mentioned in the application form) shall be either for the 1st or 15th of a
month provided there is a minimum period of 30 days after the first payment instruction. Please refer to SIP Enrolment Form for term & conditions before enrolment.
Systematic Transfer Plan (STP) in an option of the scheme: The minimum amount for each transfer shall be Rs. 1,000/- and in multiples of Re. 1/- thereafter. There is
no upper limit for individual Installments/ aggregate investments made under STP. The fund offers transfer under STP facility on a monthly basis on 1st or 15th of each
month. In case the STP date specified is a non-business day, the transaction will be processed on the immediately succeeding business day. Please refer to STP/ VTP
Enrolment Form for term & conditions before enrolment. Value Averaging Transfer Plan (VTP) in an option of the scheme: The minimum nominal amount of Rs.
2,000/- for monthly frequency and in multiples of Re.1/- with a minimum of 12 installments in an option of the scheme with no maximum cap on this amount. The amount
for this VTP would be calculated as per the formula of value averaging investment plan of Goldman Sachs S&P CNX 500 Fund. Unit holder can transfer the amount on a
monthly basis on 1st or 15th of each month. In case the VTP date specified is a non-business day, the transaction will be processed on the immediately succeeding
business day. Please refer to STP/VTP Enrolment Form for term & conditions before enrolment.
88
Scheme details
About Goldman Sachs Asset Management (India) Pvt. Ltd.
89

About us
Goldman Sachs Asset Management has a history of providing investment solutions to diverse set of
investors. We pride ourselves on having pioneered many practices and techniques that have since become
standard in the industry.
Our in-depth understanding of local economies, industries and cultures helps us provide a wide range of
investment opportunities with rigorous risk management practices.
Our culture emphasises the value of teamwork while encouraging individual creativity and our professionals
have a clear and unwavering commitment to leadership in asset management.
Average Assets under Management 1of Goldman Sachs Mutual Fund for the month of June 2012 is
approximately Rs. 4312.67 crores
90
1 – Source: AMFI

Contact us
Customer Care:
Toll free number: 1800-266-1220
E mail id: [email protected]
Mumbai (Corporate Office):
951-A, Rational House, Appasaheb Marathe Marg, Prabhadevi, Mumbai 400 025
Tel No. : 91 22 6616 9000(B)
Fax No : 91 22 6627 9245
91
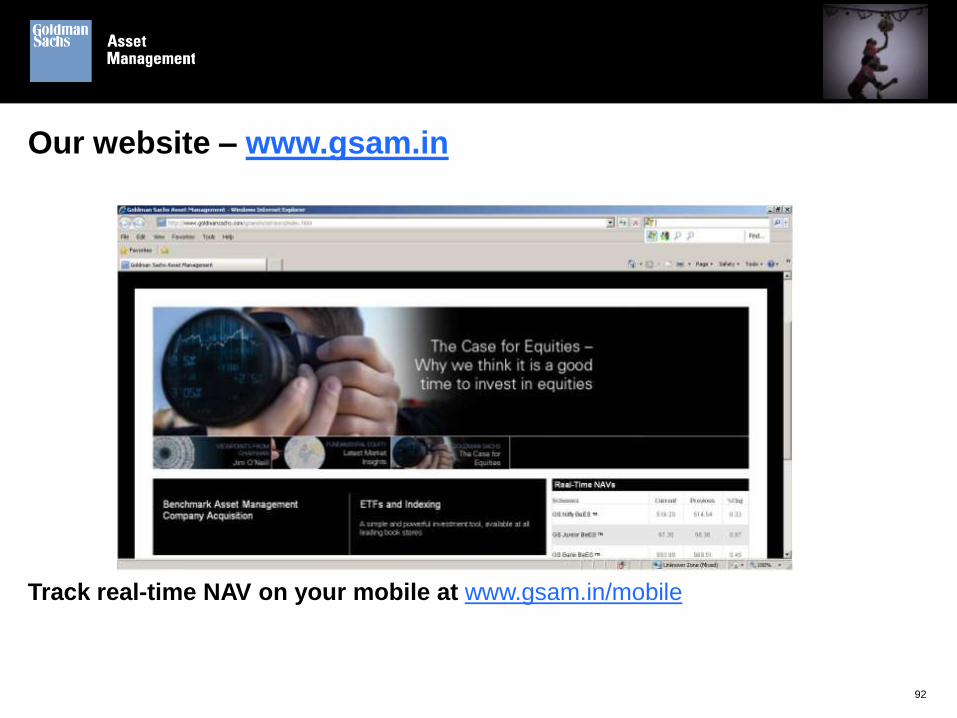
92
Our website – www.gsam.in
Track real-time NAV on your mobile at www.gsam.in/mobile

Disclaimers
RISK FACTORS
• “S&P®” and “Standard and Poor’s®” are trademarks of the McGraw-hill Companies, Inc. (“S&P”), and have been licensed for use by India Index Services &
Products Limited in connection with the S&P CNX Nifty and S&P CNX Nifty Shariah Index. GS Nifty BeES and GS S&P Shariah BeES are not sponsored,
endorsed, sold or promoted by India Index Services & Products Limited ("IISL") or Standard & Poor's, a division of The McGraw-Hill Companies, Inc. ("S&P").
Neither IISL nor S&P makes any representation or warranty, express or implied, to the owners of GS Nifty BeES and GS S&P Shariah BeES or any member of
the public regarding the advisability of investing in securities generally or in GS Nifty BeES and GS S&P Shariah BeES. Please read the full Disclaimers in
relation to the S&P CNX Nifty Index and S&P CNX Nifty Shariah Index in the Scheme Information Document before investing. • The Products on CNX Nifty
Junior Index, CNX Bank Index, CNX PSU Bank Index and CNX Infrastructure Index are not sponsored, endorsed, sold or promoted by India Index Services &
Products Limited (IISL). IISL does not make and expressly disclaims any representation or warranty, express or implied (including warranties of
merchantability or fitness for particular purpose or use) regarding the advisability of investing in the products linked to CNX Nifty Junior Index, CNX Bank
Index, CNX PSU Bank Index and CNX Infrastructure Index or particularly in the ability of the CNX Nifty Junior Index, CNX Bank Index, CNX PSU Bank Index
and CNX Infrastructure Index to track general stock market performance in India.
The Hang Seng Index (the “Index”) is published and compiled by Hang Seng Indexes Company Limited pursuant to a license from Hang Seng Data Services
Limited. The mark and name Hang Seng Index are proprietary to Hang Seng Data Services Limited. Hang Seng Indexes Company Limited and Hang Seng
Data Services Limited have agreed to the use of, and reference to, the index by Goldman Sachs Asset Management (India) Pvt. Ltd. in connection with
Goldman Sachs Hang Seng Exchange Traded Scheme (GS Hang Seng BeES) (the “Product”), but neither Hang Seng Indexes Company Limited nor Hang
Seng Data Services Limited warrants or represents or guarantees to any broker or holder of the product or any other person (i) the accuracy or completeness
of the index and its computation or any information related thereto; or (ii) the fitness or suitability for any purpose of the index or any component or data
comprised in it; or (iii) the results which may be obtained by any person from the use of the index or any component or data comprised in it for any purpose,
and no warranty or representation or guarantee of any kind whatsoever relating to the index is given or may be implied. The process and basis of
computation and compilation of the index and any of the related formula or formulae, constituent stocks and factors may at any time be changed or altered by
Hang Seng Indexes Company Limited without notice. To the extent permitted by applicable law, no responsibility or liability is accepted by Hang Seng
Indexes Company Limited or Hang Seng Data Services Limited (i) In respect of the use of and/ or reference to the index by Goldman Sachs Asset
Management (India) Pvt. Ltd. in connection with the product; or (ii) for any inaccuracies, omissions, mistakes or errors of Hang Seng Indexes Company
Limited in the computation of the index; or (iii) for any inaccuracies, omissions, mistakes, errors or incompleteness of any information used in connection
with the computation of the index which is supplied by any other person; or (iv) for any economic or other loss which may be directly or indirectly sustained
by any broker or holder of the product or any other person dealing with the product as a result of any of the aforesaid, and no claims, actions or legal
proceedings may be brought against Hang Seng Indexes Company Limited and/ or Hang Seng Data Services Limited in connection with the product in any
manner whatsoever by any broker, holder or other person dealing with the product. Any broker, holder or other person dealing with the product does so
therefore in full knowledge of this disclaimer and can place no reliance whatsoever on Hang Seng Indexes Company Limited and Hang Seng Data Services
Limited.
93
For the avoidance of doubt, this disclaimer does not create any contractual or quasi-contractual relationship between any broker, holder or other person and
Hang Seng Indexes Company Limited and/ or Hang Seng Data Services Limited and must not be construed to have created such relationship. • Please read
the Scheme Information Documents (SID) and Statement of Additional Information (SAI) carefully before investing. • For schemes specific risk factors, please
refer SID.
Risk factors pertaining to VIP (This is applicable only for Goldman Sachs S&P CNX 500 Fund):
• As the monthly investment amount is variable, it would be difficult for the investors to manage their cash flows. • If the market moves in one direction i.e.
either up or down, VIP may generate less return compared to SIP. • If the NAV of the Goldman Sachs S&P CNX 500 Fund continuously decreases, the absolute
loss to the investor would be more than what the investor would have incurred by investing in SIP.
For more details please refer the SID, SAI, Key Information Memorandum and Application Form which are available at the office of the AMC or can be
downloaded from www.gsam.in
NSE Disclaimer : It is to be distinctly understood that the permission given by NSE should not in any way be deemed or construed that the Scheme
Information Document has been cleared or approved by NSE nor does it certify the correctness or completeness of any of the contents of the Draft Scheme
Information Document . The investors are advised to refer to the Scheme Information Document for the full text of the Disclaimer Clause of NSE
Information gathered & material used in this document is believed to be from reliable sources. However, Goldman Sachs Asset Management (India) Private
Limited does not warrant the accuracy, reasonableness and/or completeness of any information.
Confidentiality
No part of this material may, without GSAM’s prior written consent, be (i) copied, photocopied or duplicated in any form, by any means, or (ii) distributed to any person
that is not an employee, officer, director, or authorized agent of the recipient.
94
Disclaimers (contd.)
Mutual Fund Investments are subject to market risks,
read all scheme related documents carefully.
Appendix
THIS MATERIAL DOES NOT CONSTITUTE AN OFFER OR SOLICITATION IN ANY JURISDICTION WHERE OR TO ANY PERSON TO WHOM IT WOULD BE
UNAUTHORIZED OR UNLAWFUL TO DO SO.
Although certain information has been obtained from sources believed to be reliable, we do not guarantee its accuracy, completeness or fairness. We have relied upon
and assumed without independent verification, the accuracy and completeness of all information available from public sources.
Views and opinions expressed are for informational purposes only and do not constitute a recommendation by GSAM to buy, sell, or hold any security. Views and
opinions are current as of the date of this presentation and may be subject to change, they should not be construed as investment advice.
The website links provided are for your convenience only and are not an endorsement or recommendation by GSAM of any of these websites or the products or services
offered. GSAM is not responsible for the accuracy and validity of the content of these websites.
Index Benchmarks
Indices are unmanaged. The figures for the index reflect the reinvestment of all income or dividends, as applicable, but do not reflect the deduction of any fees or
expenses which would reduce returns. Investors cannot invest directly in indices.
The indices referenced herein have been selected because they are well known, easily recognized by investors, and reflect those indices that the Investment Manager
believes, in part based on industry practice, provide a suitable benchmark against which to evaluate the investment or broader market described herein. The exclusion of
“failed” or closed hedge funds may mean that each index overstates the performance of hedge funds generally.
This material is issued in or from India by Goldman Sachs Asset Management (India) Private Limited (GSAM India)
95
References to indices, benchmarks or other measures of relative market performance over a specified period of time are provided for your information only and do not
imply that the portfolio will achieve similar results. The index composition may not reflect the manner in which a portfolio is constructed. While an adviser seeks to design
a portfolio which reflects appropriate risk and return features, portfolio characteristics may deviate from those of the benchmark.
Past performance does not guarantee future results, which may vary. The value of investments and the income derived from investments will fluctuate and can go down
as well as up. A loss of principal may occur.
This material has been prepared by GSAM and is not a product of Goldman Sachs Global Investment Research. The views and opinions expressed may differ from
those of Goldman Sachs Global Investment Research or other departments or divisions of Goldman Sachs and its affiliates. Investors are urged to consult with their
financial advisors before buying or selling any securities. This information may not be current and GSAM has no obligation to provide any updates or changes.
© 2012 Goldman Sachs. All rights reserved.
81435.OSF.TMPL/9/2012
96
Appendix

Thank you
97


