30
June 2015 Executive Branch Retirement Statistics: Fiscal Years 2005 - 2014
| Date post: | 14-Feb-2017 |
| Category: |
Documents |
| Upload: | hoangthuan |
| View: | 214 times |
| Download: | 1 times |

June 2015
Executive Branch Retirement Statistics:
Fiscal Years 2005 - 2014
Summary This report examines the patterns and trends of retirement in the federal executive branch, during fiscal years 2005 - 2014. The summary analysis of the retirement data from the Office of Personnel Management’s federal employee database shows – in recent 10 fiscal years, 609,584 employees retired from federal service. Their average retirement age was 60.2 years and average length of service was 27.8 years; 53.7 percent of those were 60 or older; and half of retirees had 30 or more years of service. Overall, January was the most popular month for retiring during the last ten fiscal years and accounted for 14,588 retirees in fiscal year 2014. From fiscal years 2005 to 2014, retirement increased by 10.9 percent. Over the same time period, the average retirement age rose from 58.9 to 61.4 years and the average length of service at retirement went down from 27.9 to 26.9 years.

Table of Contents Introduction ..................................................................................................................................... 1
Data ................................................................................................................................................. 1
Statistical Analysis .......................................................................................................................... 1
Frequently Asked Questions and Answers ..................................................................................... 2
Highlights and Trends ..................................................................................................................... 5
Conclusion ...................................................................................................................................... 8
Tables .............................................................................................................................................. 1
Figures............................................................................................................................................. 9
Definitions and Data Sources........................................................................................................ 13
Appendix I: EHRI-SDM and CPDF Coverage ........................................................................ 13
Appendix II: Retirement Type Eligibility Requirements .......................................................... 14
Appendix III: Key Demographic Definitions............................................................................ 15
References ..................................................................................................................................... 17

1
Introduction The current report covers the last 10 fiscal years (2005 - 2014) and includes all federal civilian employees mostly in the non-postal executive branch – having personnel records in the Enterprise Human Resources Integration-Statistical Data Mart (EHRI-SDM) and Central Personnel Data File (CPDF) at the Office of Personnel Management (OPM). The EHRI-SDM and CPDF contains personnel data for most agencies in the executive branch as well as a few agencies in the legislative and judiciary branches. (Refer to Appendix I for further information on the EHRI-SDM and CPDF coverage.) Nearly all federal civilian employees retired under the law of the Civil Service Retirement System (CSRS) or Federal Employees Retirement System (FERS). The Civil Service Retirement System which became effective on August 1, 1920, was replaced by the Federal Employees Retirement System for federal employees who entered service on or after January 1, 1987. To retire under CSRS or FERS, employees need to satisfy the minimum years of service requirement. (Visit OPM website for age and length of service requirements for CSRS1 and FERS2). There are many ways to retire, collectively referred to as Total Retirement: voluntary, disability, mandatory, early-out or in-lieu-of-involuntary-action. (See Appendix II for further information on retirement type eligibility.) The aims of this report are: (1) to provide answer to frequently asked questions and (2) to highlight retirement patterns and examine the trends over the last 10 fiscal years. This report is presented in a variety of ways to be informative and useful. It consists of four major parts: (1) Frequently Asked Questions and Answers, (2) Highlights and Trends, (3) Tables and Figures, and (4) Definitions and Data Sources. Data The analysis was conducted using the Dynamics data from the EHRI-SDM and CPDF. The dynamics file reflects personnel actions (e.g., appointments, promotions and separations) occurring over a given time period. The extracted data contains employee retirement records for the time period: October 1, 2004 through September 30, 2014. The data includes, in general, federal civilian employees of the executive branch representing about 99.9 percent of the total workforce records maintained by OPM. Statistical Analysis Descriptive statistics such as retirement count, average age and average length of service were assessed using the aforementioned data. Retirement number/count is the cumulative frequency of

2
personnel actions (i.e., retirements) during a time period. The average age was estimated using the mean values of age: the number of years between date of birth and the personnel action effective date. Similarly, the average length of service was estimated using the mean of length of service: the number of years (in federal service) between Service Computation Date (generally the date when one was hired) and the retirement effective date. In this report, Total Retirement denotes voluntary, disability, mandatory, early out and in-lieu of involuntary retirements. Furthermore, the current retirement figures include all federal civilian employees (as described in the data coverage) regardless of their work schedule (e.g., full-time) and type of appointment (e.g., permanent) and may include late actions submitted by agencies in subsequent data files; therefore these figures may differ from other OPM reports due to differences in coverage and reporting periods. The analysis includes the following characteristics, as of the retirement effective date:
• Age • Agency • Gender • Length of service • Occupational category • Pay plan • Race/National Origin • Retirement system • Retirement type • Supervisory status • Veteran status
(See appendix III for information on Race/ National Origin, Occupational category, and Veteran status.) The results of the descriptive analysis are presented in the appended Tables and Figures. Notes: The detail statistics displayed on the tables exclude unspecified or missing values; therefore, the detail values may not add to the overall total. Fiscal year (FY) is the period from October 1 of a given year through September 30 of the subsequent year. Frequently Asked Questions and Answers This section provides answers to frequently asked questions related to federal civilian retirement statistics. These questions are described as follows (values can be found in the listed tables):
• Questions 1-6 compare the fiscal year 2014 figures with the overall (fiscal years 2005 - 2014) figures (Tables 1-2, 4-5).

3
• Questions 7-8 compare the overall Federal Employees Retirement System figures with those for Civil Service Retirement System figures (Table 1).
• Questions 9-10 compare the overall average length of service for men with that for women (Table 1).
• Question 11 lists the overall top-3 agencies in the Cabinet-level (Table 7). • Question 12 lists the overall top-3 occupational series in Administrative (Table 7). • Question 13 lists the most popular month in fiscal year 2014 (Table 8). • Question 14 lists the overall top-3 popular months and least popular month (Table 8). • Question 15 lists the top fiscal year (Table 2). • Question 16 lists the bottom fiscal year (Table 2).
Q1 How many employees retired from the federal civil service in fiscal year 2014?
Answer: 68,616 Average age: 61.3 Average length of Service: 26.9
Note: 68,616 include voluntary, disability, mandatory, early out retirement types and in-lieu of involuntary actions.
Q2 How do the retirement numbers in Q1 compare to the average figures for the last 10
fiscal years (2005 - 2014)? Answer: 609,584 Average age: 60.2 Average length of Service: 27.8
Q3 How many employees retired voluntarily from the federal civil service in fiscal year
2014? Answer: 60,948 Average age: 62.3 Average length of Service: 27.5
Q4 How do the retirement numbers in Q3 compare to the average figures for the last 10
fiscal years? Answer: 51,302 Average age: 61.4 Average length of Service: 28.7
Q5 How many employees retired with “disability” in fiscal year 2014?
Answer: 3,622 Average age: 52.1 Average length of Service: 15.7
Q6 How do the retirement numbers in Q5 compare to the average figures for the last 10 fiscal years?
Answer: 4,354 Average age: 51.6 Average length of Service: 17.3
Q7 How many employees in the Federal Employees Retirement System (FERS) retired in the last 10 fiscal years?
Answer: 275,059 Average age: 60.6 Average length of Service: 28.2

4
Q8 How do the retirement numbers in Q7 compare to the figures for Civil Service Retirement System (CSRS)?
Answer: 331,973 Average age: 59.8 Average length of Service: 33.8
Q9 In the last 10 fiscal years, on average how long do men stay in service before retiring? Answer: 27.8
Q10 How does this figure in Q9 compare to the average length of service for women? Answer: 27.8
Q11 What were the top-3 cabinet level agencies with the most retirements for the last 10 fiscal years?
Answer: • Department of the Army (85,561 retirees) • Department of Veteran Affairs (84,088 retirees) • Department of the Navy (61,232 retirees)
Q12 What were the top-3 occupational series in Administrative with the most retirements for
the last 10 fiscal years? Answer:
• Miscellaneous Administrative and Program (29,006 retirees) • Information Technology Management (24,323 retirees) • Management and Program Analysis (22,868 retirees)
Q13 In fiscal year 2014, what was the most popular month to retire?
Answer: January (14,588 retirees)
• What were the other two popular months? Answer:
o May (7,034 retirees) o December (5,812 retirees)
• What month has the lowest retirement number?
Answer: October (2,965 retirees)
Q14 In fiscal years 2005 - 2014, what was the most popular month to retire? Answer: January (103,218 retirees)
• What were the next two popular months?

5
Answer: o December (80,523 retirees) o September (57,071 retirees)
• What month had the lowest retirement number?
Answer: November (27,214 retirees)
Q15 What fiscal year (2005 - 2014) had the highest retirement number? Answer: Fiscal year 2012 (69,320 retirees) Q16 What fiscal year (2005 - 2014) had the lowest retirement number?
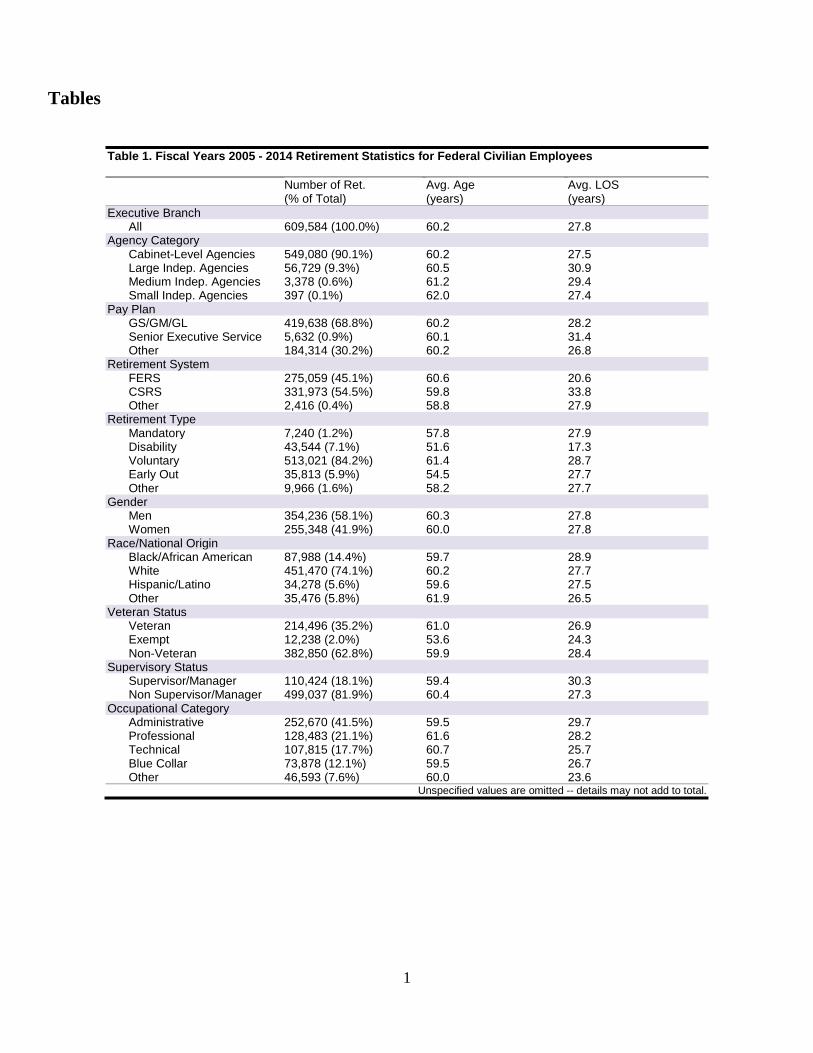
Answer: Fiscal year 2009 (46,100 retirees) Highlights and Trends This section provides in-depth analysis of the federal retirement by characteristics, from fiscal years 2005 through 2014. Table 1 presents the number, average age and length of service of federal civilian employees of the executive branch who retired over the last ten fiscal years. Overall, 609,584 (averaged out to 60,958 retirees per fiscal year) employees retired from fiscal years 2005 through 2014. Their average age was 60.2 years and average length of service was 27.8 years. Among all agency categories, the cabinet-level accounted for 90.1 percent of the total number of retirees. Among all retirement types, the average age (51.6 years) and average length of service (17.3 years) for “disability” were substantially lower relative to the overall averages. Table 2 presents the number of federal civilian employees of the executive branch who retired during each fiscal year. In fiscal year 2014 – the retirement number was 68,616 – that is up from 65,258 in fiscal year 2013. The number of retirees for fiscal years 2006 (60,253), 2008 (58,913) and 2009 (46,100) were all below the last 10 fiscal years’ average retirement count (60,958) – with 2009 having the lowest number. The following categories show moderate to substantial change (percent difference of 50 or higher) in retirement count from fiscal years 2005 to 2014:
• Retirement System – FERS retirement rose by 123.7 percent, from 19,284 retirees in fiscal year 2005.
• Retirement Type – mandatory retirement went up by 83.8 percent, from 557 retirees in fiscal year 2005 and early-out retirement declined by 67.3 percent, from 7,511 retirees in fiscal year 2005.

6
Table 3 presents the proportions of the above population – by fiscal year and characteristic. 2014 accounted for 11.3 percent of the overall number of retirees in the last 10 fiscal years. The following categories show moderate to substantial increase (absolute difference of 6 percentage points or higher) in retirement, from fiscal year 2005 to 2014:
• Retirement System – in fiscal year 2014, FERS represented 62.7 percent of all retirees, up from 31.2 percent in fiscal year 2005; whereas in fiscal year 2015, CSRS represented 37.1 percent of all retirees, down from 67.8 percent in fiscal year 2005.
• Retirement Type – the percentage for voluntary retirement increased from 76.2 in fiscal year 2005 to 88.8 in fiscal year 2014; whereas the percentage for early-out retirement decreased from 12.1 percent in fiscal year 2005 to 8.6 percent in fiscal year 2014;
• Veteran Status – in fiscal year 2014, veterans represented 31.7 percent of all retirees, down from 38.5 percent in fiscal year 2005; whereas in fiscal year 2014, non-veterans represented 67.5 percent, up from 58.6 percent in fiscal year 2005.
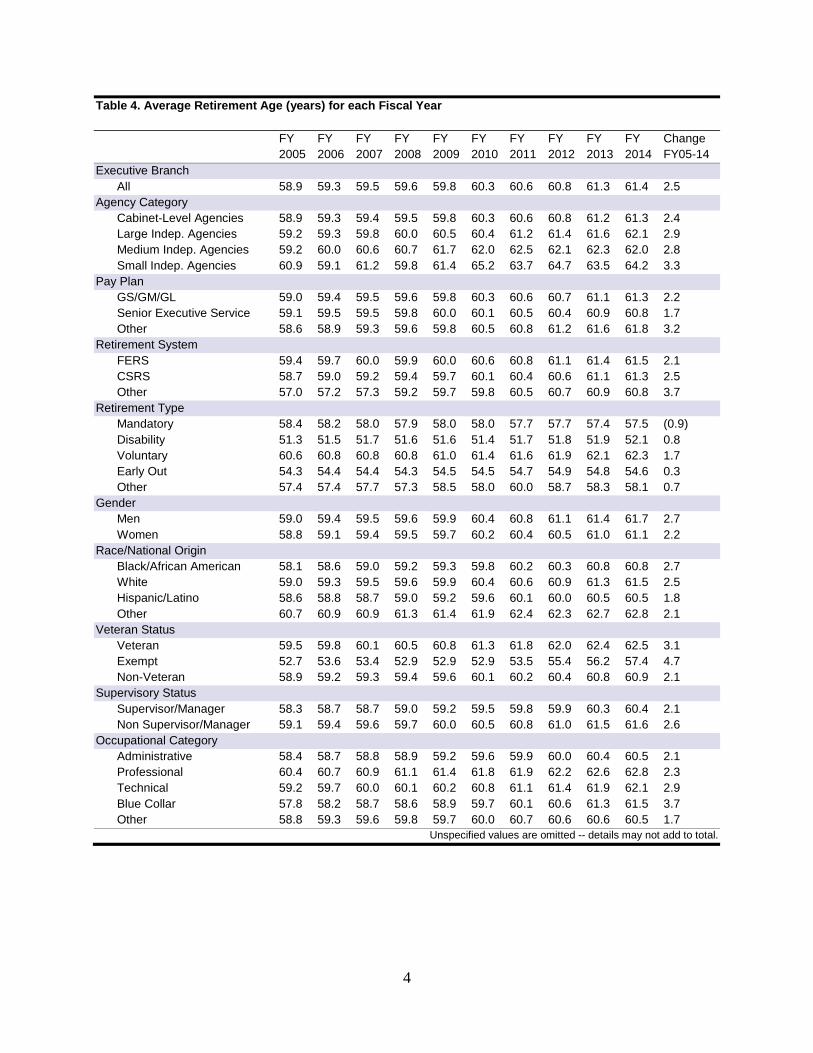
Table 4 presents the average retirement age of executive branch federal civilian employees by fiscal year. The average retirement age went up 2.5 years – from 58.9 years in fiscal year 2005 to 61.4 years in fiscal year 2014. The following categories show moderate change (difference of 3 years or higher) in retirement age, from fiscal years 2005 to 2014:
• Agency category – the average retirement for small independent agencies was 64.2 years in fiscal 2014, up from 60.9 years in fiscal 2005.
• Occupational Category – the average retirement age for blue-collars was 61.5 years in fiscal year 2014, up from 57.8 years in fiscal year 2005.
• Veteran Status – the average retirement age for veterans was 62.5 years in fiscal year 2014, up from 59.5 years in fiscal year 2005.
Table 5 presents the average length of service (LOS) of executive branch federal civilian employees at retirement, by fiscal year. The retirement age declined minimally from 27.9 years in fiscal year 2005 to 26.5 years in fiscal year 2014. The following category shows moderate change (difference of 2 years or higher) in average LOS, from fiscal years 2005 to 2014: Retirement System – the average LOS for FERS was 21.7 years in fiscal year 2014, up from 19 years in fiscal year 2005; and that for CSRS was 35.7 years in fiscal year 2014, up from 32 years in fiscal year 2005. Table 6 presents the proportion of executive branch federal civilian retirees – by age and length of service, separately. During the last 10 fiscal years, 96.6 percent of employees who retired were 50 or older. Half of the retirees had worked 30 years or more. In fiscal year 2014,
7
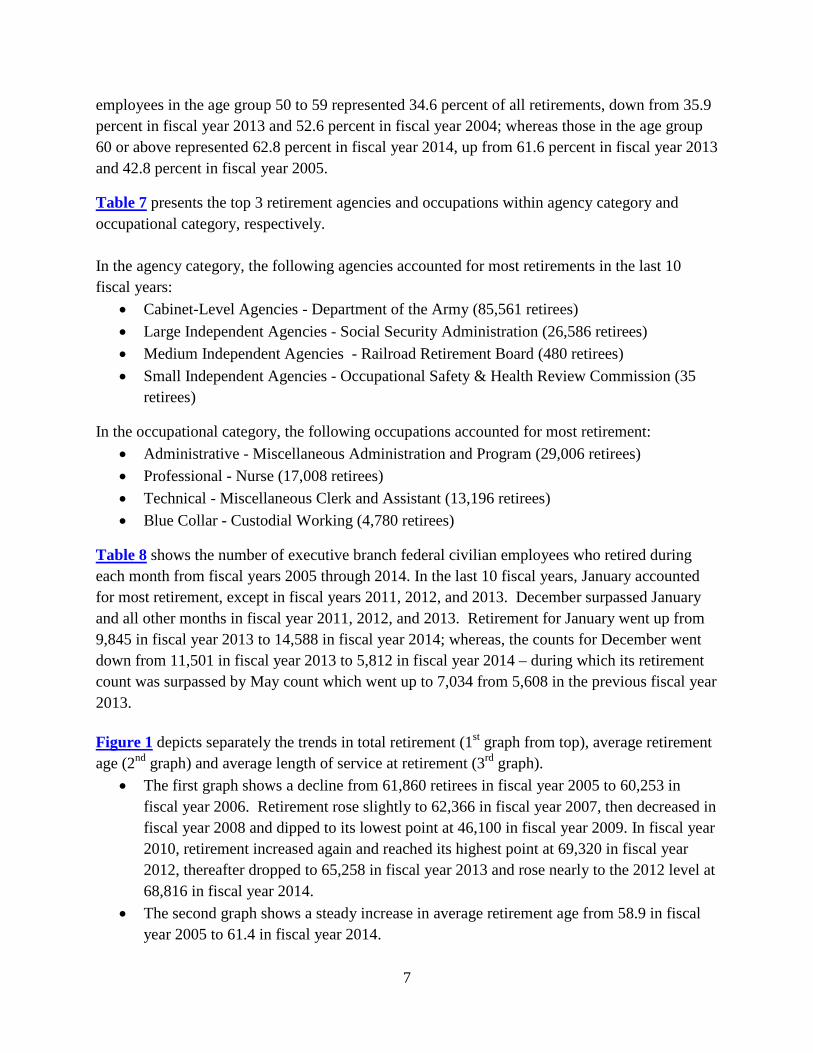
employees in the age group 50 to 59 represented 34.6 percent of all retirements, down from 35.9 percent in fiscal year 2013 and 52.6 percent in fiscal year 2004; whereas those in the age group 60 or above represented 62.8 percent in fiscal year 2014, up from 61.6 percent in fiscal year 2013 and 42.8 percent in fiscal year 2005.
Table 7 presents the top 3 retirement agencies and occupations within agency category and occupational category, respectively. In the agency category, the following agencies accounted for most retirements in the last 10 fiscal years:
• Cabinet-Level Agencies - Department of the Army (85,561 retirees) • Large Independent Agencies - Social Security Administration (26,586 retirees) • Medium Independent Agencies - Railroad Retirement Board (480 retirees) • Small Independent Agencies - Occupational Safety & Health Review Commission (35
retirees)
In the occupational category, the following occupations accounted for most retirement: • Administrative - Miscellaneous Administration and Program (29,006 retirees) • Professional - Nurse (17,008 retirees) • Technical - Miscellaneous Clerk and Assistant (13,196 retirees) • Blue Collar - Custodial Working (4,780 retirees)
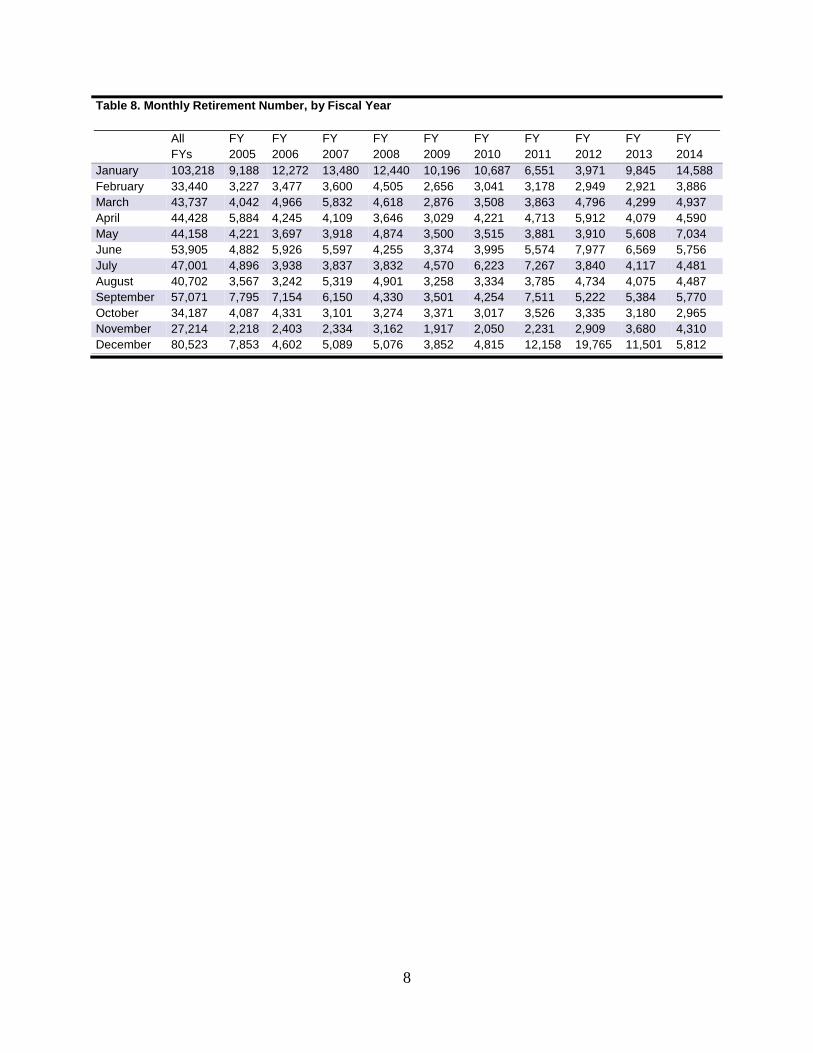
Table 8 shows the number of executive branch federal civilian employees who retired during each month from fiscal years 2005 through 2014. In the last 10 fiscal years, January accounted for most retirement, except in fiscal years 2011, 2012, and 2013. December surpassed January and all other months in fiscal year 2011, 2012, and 2013. Retirement for January went up from 9,845 in fiscal year 2013 to 14,588 in fiscal year 2014; whereas, the counts for December went down from 11,501 in fiscal year 2013 to 5,812 in fiscal year 2014 – during which its retirement count was surpassed by May count which went up to 7,034 from 5,608 in the previous fiscal year 2013. Figure 1 depicts separately the trends in total retirement (1st graph from top), average retirement age (2nd graph) and average length of service at retirement (3rd graph).
• The first graph shows a decline from 61,860 retirees in fiscal year 2005 to 60,253 in fiscal year 2006. Retirement rose slightly to 62,366 in fiscal year 2007, then decreased in fiscal year 2008 and dipped to its lowest point at 46,100 in fiscal year 2009. In fiscal year 2010, retirement increased again and reached its highest point at 69,320 in fiscal year 2012, thereafter dropped to 65,258 in fiscal year 2013 and rose nearly to the 2012 level at 68,816 in fiscal year 2014.
• The second graph shows a steady increase in average retirement age from 58.9 in fiscal year 2005 to 61.4 in fiscal year 2014.

8
• The third graph shows the average length of service at retirement rose from 27.9 in fiscal year 2005 to stay at 28.3 from fiscal year 2006 to 2007. It then declined from 28.2 in fiscal year 2008 to 27.7 in fiscal year 2010. The average length of service climbed back to 28 in fiscal year 2011, thereafter dropped to the 2005 level in fiscal year 2012, and declined again to 27.5 and 26.9 in fiscal years 2013 and 2014, respectively.
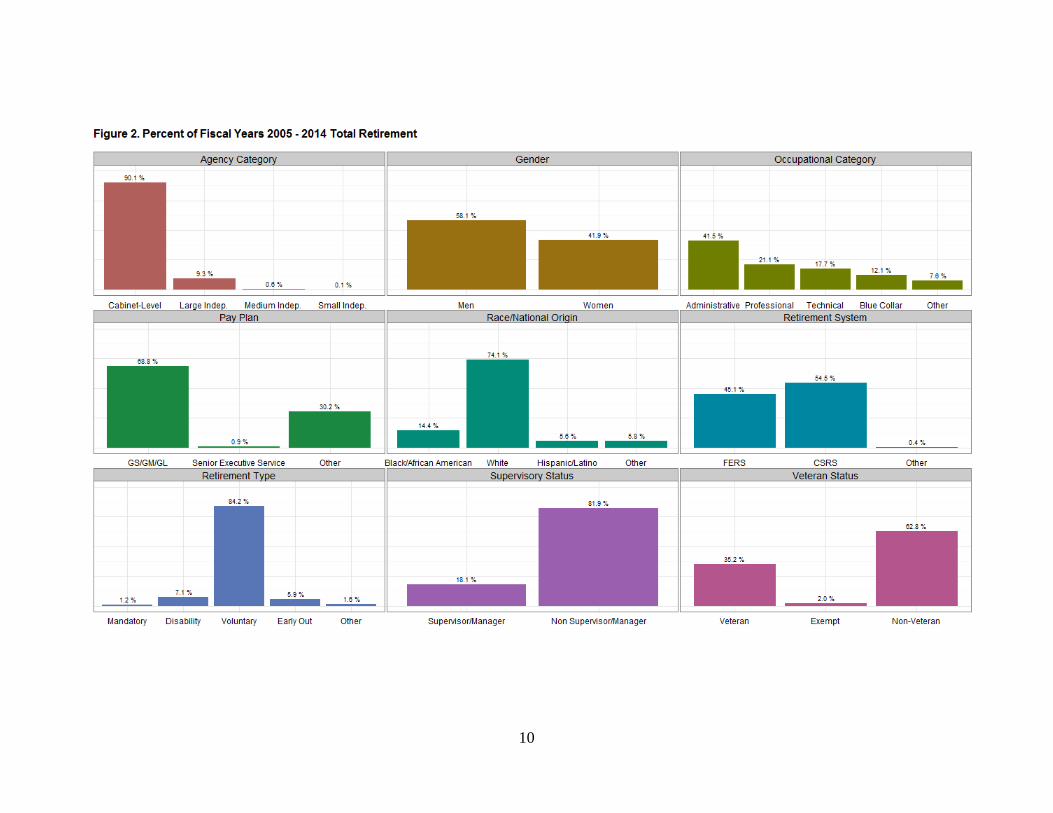
Figure 2 compares the percentages of total retirement by category. This figure shows retirement during fiscal years 2005 - 2014 was greater in the following levels (or subcategories):
• Agency Category – cabinet-level • Occupational Category – administrative • Race/RNO – White • Retirement system – CSRS • Veteran Status – non-veteran
• Gender – men • Pay plan – GS/GM/GL • Retirement Category – voluntary • Supervisory Status – non
supervisor/manager Figure 3 compares the percentages of total retirement by age and length of service categories. This figure reveals that retirement during fiscal years 2005 - 2014 was mostly concentrated in the following age groups: 50-59 and 60 or above:
• Age 50-59 – 30 percent of employees in this age group had 30 or more years of service. • Age 60+ – 20 percent of employees in this age group had 30 or more years of service.
Figure 4 contrasts the monthly total retirement during each fiscal year. Retirement peaked during January from fiscal year 2004 to 2010. January dropped to the fourth place, seventh place and second place in fiscal years 2011, 2012, and 2013, respectively. December surpassed all others months from fiscal years 2011 through 2013 – with an all-time high of 19,765 retirees in fiscal year 2012. In fiscal 2014, December was surpassed by January and May in the first place and second place, respectively. Conclusion All fiscal years: The analysis reveals in the last 10 fiscal years (2005 - 2014), 609,584 federal civilian employees of the executive branch retired from service – which is about 60,958 retirees per fiscal year. They mostly retired voluntarily and were more likely to retire in January and December than any other months. They were mainly men, whites, non-veterans, non-supervisors and were largely in the cabinet-level agencies, in general schedule and equivalent pay-plans, in Civil Service Retirement System and in administrative occupations. Over the same time period, the overall average retirement age was 60.2 years and average length of service at retirement was 27.8 years. About half of retirees were 60 years of age or older and half of the retirees had worked 30 years or more. On average, employees who retired with disability tended to be younger (51.6 years old) and had lower years of service (17.3 years) compared with those in other retirement types.

9
Across fiscal years: From fiscal years 2005 to 2014, retirement increased by 10.9 percent, from 61,860 to 68,816. The lowest retirement number was recorded in fiscal year 2009 (46,100 retirees); and the highest number was in fiscal year 2012 (69,320 retirees). Over the last 10 fiscal years, the retirement numbers for employees who retired mandatory went up by 83.8 percent; while early-out retirement decreased by 67.3 percent. From fiscal years 2005 to 2014, the average age trended up (2.6 years increase by end of fiscal year 2014); whereas, the average length of service fluctuated over the same time period and has slightly decreased of a year by end of fiscal year 2014. On average, employees who retired in fiscal year 2014 were slightly older (average age 61.4) than those who retired in fiscal year 2004 (average age 58.9) – 62.8 percent were 60 years of age or older in fiscal year 2014 compared with 42.8 percent in fiscal year 2005.
1
Tables
Table 1. Fiscal Years 2005 - 2014 Retirement Statistics for Federal Civilian Employees
Number of Ret. (% of Total)
Avg. Age (years)
Avg. LOS (years)
Executive Branch All 609,584 (100.0%) 60.2 27.8
Agency Category Cabinet-Level Agencies 549,080 (90.1%) 60.2 27.5 Large Indep. Agencies 56,729 (9.3%) 60.5 30.9 Medium Indep. Agencies 3,378 (0.6%) 61.2 29.4 Small Indep. Agencies 397 (0.1%) 62.0 27.4
Pay Plan GS/GM/GL 419,638 (68.8%) 60.2 28.2 Senior Executive Service 5,632 (0.9%) 60.1 31.4 Other 184,314 (30.2%) 60.2 26.8
Retirement System FERS 275,059 (45.1%) 60.6 20.6 CSRS 331,973 (54.5%) 59.8 33.8 Other 2,416 (0.4%) 58.8 27.9
Retirement Type Mandatory 7,240 (1.2%) 57.8 27.9 Disability 43,544 (7.1%) 51.6 17.3 Voluntary 513,021 (84.2%) 61.4 28.7 Early Out 35,813 (5.9%) 54.5 27.7 Other 9,966 (1.6%) 58.2 27.7
Gender Men 354,236 (58.1%) 60.3 27.8 Women 255,348 (41.9%) 60.0 27.8
Race/National Origin Black/African American 87,988 (14.4%) 59.7 28.9 White 451,470 (74.1%) 60.2 27.7 Hispanic/Latino 34,278 (5.6%) 59.6 27.5 Other 35,476 (5.8%) 61.9 26.5
Veteran Status Veteran 214,496 (35.2%) 61.0 26.9 Exempt 12,238 (2.0%) 53.6 24.3 Non-Veteran 382,850 (62.8%) 59.9 28.4
Supervisory Status Supervisor/Manager 110,424 (18.1%) 59.4 30.3 Non Supervisor/Manager 499,037 (81.9%) 60.4 27.3
Occupational Category Administrative 252,670 (41.5%) 59.5 29.7 Professional 128,483 (21.1%) 61.6 28.2 Technical 107,815 (17.7%) 60.7 25.7 Blue Collar 73,878 (12.1%) 59.5 26.7 Other 46,593 (7.6%) 60.0 23.6
Unspecified values are omitted -- details may not add to total.

2
Table 2. Number of Retirees during each Fiscal Year
FY 2005
FY 2006
FY 2007
FY 2008
FY 2009
FY 2010
FY 2011
FY 2012
FY 2013
FY 2014
% Change FY05-14
Executive Branch All 61,860 60,253 62,366 58,913 46,100 52,660 64,238 69,320 65,258 68,616 10.9
Agency Category Cabinet-Level Agencies 54,746 53,824 56,090 53,187 41,788 47,631 58,512 62,358 59,175 61,769 12.8 Large Indep. Agencies 6,607 5,994 5,917 5,339 4,061 4,753 5,365 6,566 5,686 6,441 (2.5) Medium Indep. Agencies 458 373 320 347 220 252 322 358 363 365 (20.3) Small Indep. Agencies 49 62 39 40 31 24 39 38 34 41 (16.3)
Pay Plan GS/GM/GL 44,581 42,558 42,247 37,235 28,538 33,792 46,106 49,973 45,759 48,849 9.6 Senior Executive Service 533 542 591 538 483 509 590 608 606 632 18.6 Other 16,746 17,153 19,528 21,140 17,079 18,359 17,542 18,739 18,893 19,135 14.3
Retirement System FERS 19,284 20,040 22,802 23,568 20,302 24,666 30,616 34,831 35,948 43,002 123.0 CSRS 41,965 39,788 39,356 35,136 25,596 27,798 33,429 34,305 29,156 25,444 (39.4) Other 580 322 208 209 202 196 191 184 154 170 (70.7)
Retirement Type Mandatory 557 500 563 516 585 755 834 941 965 1,024 83.8 Disability 5,606 5,035 5,093 4,892 4,456 3,925 3,919 3,743 3,253 3,622 (35.4) Voluntary 47,155 47,103 51,017 49,053 38,983 45,758 54,900 59,812 58,292 60,948 29.3 Early Out 7,511 5,788 4,687 3,552 1,241 1,456 2,815 4,124 2,182 2,457 (67.3) Other 1,031 1,827 1,006 900 835 766 1,770 700 566 565 (45.2)
Gender Men 37,241 36,472 37,602 35,291 27,401 30,481 36,402 38,493 36,786 38,067 2.2 Women 24,619 23,781 24,764 23,622 18,699 22,179 27,836 30,827 28,472 30,549 24.1
Race/National Origin Black/African American 8,970 8,473 8,466 7,789 6,449 7,547 9,460 10,621 9,662 10,551 17.6 White 46,687 45,580 47,118 44,780 34,401 38,947 47,506 50,259 46,813 49,379 5.8 Hispanic/Latino 3,438 3,121 3,216 3,060 2,608 3,008 3,479 4,149 3,952 4,247 23.5 Other 2,757 3,019 3,553 3,267 2,559 3,070 3,756 4,259 4,805 4,431 60.7
Veteran Status Veteran 23,828 23,345 23,600 21,496 16,635 18,686 21,173 22,738 21,276 21,719 (8.9) Exempt 1,770 1,626 1,561 1,703 1,211 1,130 1,155 923 611 548 (69.0) Non-Veteran 36,262 35,282 37,205 35,714 28,254 32,844 41,910 45,659 43,371 46,349 27.8
Supervisory Status Supervisor/Manager 10,532 10,750 11,276 10,707 8,393 9,422 11,541 12,624 12,261 12,918 22.7 Non Supervisor/Manager 51,260 49,480 51,069 48,201 37,706 43,237 52,697 56,696 52,996 55,695 8.7
Occupational Category Administrative 24,711 25,004 25,805 24,053 18,915 21,673 27,304 29,460 27,149 28,596 15.7 Professional 12,434 12,568 12,598 12,308 9,285 10,906 13,583 14,322 14,409 16,070 29.2 Technical 11,514 10,475 10,925 10,483 8,247 9,539 11,188 12,237 11,416 11,791 2.4 Blue Collar 8,232 7,558 8,210 7,600 5,959 6,489 7,379 8,097 7,296 7,058 (14.3) Other 4,934 4,639 4,816 4,454 3,679 4,033 4,772 5,194 4,981 5,091 3.2
Unspecified values are omitted -- details may not add to total.

3
Table 3. Percent of Overall Total Retirement for each Fiscal Year
FY 2005
FY 2006
FY 2007
FY 2008
FY 2009
FY 2010
FY 2011
FY 2012
FY 2013
FY 2014
Change FY05-14
Executive Branch All 10.1 9.9 10.2 9.7 7.6 8.6 10.5 11.4 10.7 11.3 1.1
Agency Category Cabinet-Level Agencies 88.5 89.3 89.9 90.3 90.6 90.5 91.1 90.0 90.7 90.0 1.5 Large Indep. Agencies 10.7 9.9 9.5 9.1 8.8 9.0 8.4 9.5 8.7 9.4 (1.3) Medium Indep. Agencies 0.7 0.6 0.5 0.6 0.5 0.5 0.5 0.5 0.6 0.5 (0.2) Small Indep. Agencies 0.1 0.1 0.1 0.1 0.1 0.0 0.1 0.1 0.1 0.1 (0.0)
Pay Plan GS/GM/GL 72.1 70.6 67.7 63.2 61.9 64.2 71.8 72.1 70.1 71.2 (0.9) Senior Executive Service 0.9 0.9 0.9 0.9 1.0 1.0 0.9 0.9 0.9 0.9 0.1 Other 27.1 28.5 31.3 35.9 37.0 34.9 27.3 27.0 29.0 27.9 0.8
Retirement System FERS 31.2 33.3 36.6 40.0 44.0 46.8 47.7 50.2 55.1 62.7 31.5 CSRS 67.8 66.0 63.1 59.6 55.5 52.8 52.0 49.5 44.7 37.1 (30.8) Other 0.9 0.5 0.3 0.4 0.4 0.4 0.3 0.3 0.2 0.2 (0.7)
Retirement Type Mandatory 0.9 0.8 0.9 0.9 1.3 1.4 1.3 1.4 1.5 1.5 0.6 Disability 9.1 8.4 8.2 8.3 9.7 7.5 6.1 5.4 5.0 5.3 (3.8) Voluntary 76.2 78.2 81.8 83.3 84.6 86.9 85.5 86.3 89.3 88.8 12.6 Early Out 12.1 9.6 7.5 6.0 2.7 2.8 4.4 5.9 3.3 3.6 (8.6) Other 1.7 3.0 1.6 1.5 1.8 1.5 2.8 1.0 0.9 0.8 (0.8)
Gender Men 60.2 60.5 60.3 59.9 59.4 57.9 56.7 55.5 56.4 55.5 (4.7) Women 39.8 39.5 39.7 40.1 40.6 42.1 43.3 44.5 43.6 44.5 4.7
Race/National Origin Black/African American 14.5 14.1 13.6 13.2 14.0 14.3 14.7 15.3 14.8 15.4 0.9 White 75.5 75.6 75.6 76.0 74.6 74.0 74.0 72.5 71.7 72.0 (3.5) Hispanic/Latino 5.6 5.2 5.2 5.2 5.7 5.7 5.4 6.0 6.1 6.2 0.6 Other 4.5 5.0 5.7 5.5 5.6 5.8 5.8 6.1 7.4 6.5 2.0
Veteran Status Veteran 38.5 38.7 37.8 36.5 36.1 35.5 33.0 32.8 32.6 31.7 (6.9) Exempt 2.9 2.7 2.5 2.9 2.6 2.1 1.8 1.3 0.9 0.8 (2.1) Non-Veteran 58.6 58.6 59.7 60.6 61.3 62.4 65.2 65.9 66.5 67.5 8.9
Supervisory Status Supervisor/Manager 17.0 17.8 18.1 18.2 18.2 17.9 18.0 18.2 18.8 18.8 1.8 Non Supervisor/Manager 82.9 82.1 81.9 81.8 81.8 82.1 82.0 81.8 81.2 81.2 (1.7)
Occupational Category Administrative 39.9 41.5 41.4 40.8 41.0 41.2 42.5 42.5 41.6 41.7 1.7 Professional 20.1 20.9 20.2 20.9 20.1 20.7 21.1 20.7 22.1 23.4 3.3 Technical 18.6 17.4 17.5 17.8 17.9 18.1 17.4 17.7 17.5 17.2 (1.4) Blue Collar 13.3 12.5 13.2 12.9 12.9 12.3 11.5 11.7 11.2 10.3 (3.0) Other 8.0 7.7 7.7 7.6 8.0 7.7 7.4 7.5 7.6 7.4 (0.6)
Unspecified values are omitted -- details may not add to total.
4
Table 4. Average Retirement Age (years) for each Fiscal Year
FY 2005
FY 2006
FY 2007
FY 2008
FY 2009
FY 2010
FY 2011
FY 2012
FY 2013
FY 2014
Change FY05-14
Executive Branch All 58.9 59.3 59.5 59.6 59.8 60.3 60.6 60.8 61.3 61.4 2.5
Agency Category Cabinet-Level Agencies 58.9 59.3 59.4 59.5 59.8 60.3 60.6 60.8 61.2 61.3 2.4 Large Indep. Agencies 59.2 59.3 59.8 60.0 60.5 60.4 61.2 61.4 61.6 62.1 2.9 Medium Indep. Agencies 59.2 60.0 60.6 60.7 61.7 62.0 62.5 62.1 62.3 62.0 2.8 Small Indep. Agencies 60.9 59.1 61.2 59.8 61.4 65.2 63.7 64.7 63.5 64.2 3.3
Pay Plan GS/GM/GL 59.0 59.4 59.5 59.6 59.8 60.3 60.6 60.7 61.1 61.3 2.2 Senior Executive Service 59.1 59.5 59.5 59.8 60.0 60.1 60.5 60.4 60.9 60.8 1.7 Other 58.6 58.9 59.3 59.6 59.8 60.5 60.8 61.2 61.6 61.8 3.2
Retirement System FERS 59.4 59.7 60.0 59.9 60.0 60.6 60.8 61.1 61.4 61.5 2.1 CSRS 58.7 59.0 59.2 59.4 59.7 60.1 60.4 60.6 61.1 61.3 2.5 Other 57.0 57.2 57.3 59.2 59.7 59.8 60.5 60.7 60.9 60.8 3.7
Retirement Type Mandatory 58.4 58.2 58.0 57.9 58.0 58.0 57.7 57.7 57.4 57.5 (0.9) Disability 51.3 51.5 51.7 51.6 51.6 51.4 51.7 51.8 51.9 52.1 0.8 Voluntary 60.6 60.8 60.8 60.8 61.0 61.4 61.6 61.9 62.1 62.3 1.7 Early Out 54.3 54.4 54.4 54.3 54.5 54.5 54.7 54.9 54.8 54.6 0.3 Other 57.4 57.4 57.7 57.3 58.5 58.0 60.0 58.7 58.3 58.1 0.7
Gender Men 59.0 59.4 59.5 59.6 59.9 60.4 60.8 61.1 61.4 61.7 2.7 Women 58.8 59.1 59.4 59.5 59.7 60.2 60.4 60.5 61.0 61.1 2.2
Race/National Origin Black/African American 58.1 58.6 59.0 59.2 59.3 59.8 60.2 60.3 60.8 60.8 2.7 White 59.0 59.3 59.5 59.6 59.9 60.4 60.6 60.9 61.3 61.5 2.5 Hispanic/Latino 58.6 58.8 58.7 59.0 59.2 59.6 60.1 60.0 60.5 60.5 1.8 Other 60.7 60.9 60.9 61.3 61.4 61.9 62.4 62.3 62.7 62.8 2.1
Veteran Status Veteran 59.5 59.8 60.1 60.5 60.8 61.3 61.8 62.0 62.4 62.5 3.1 Exempt 52.7 53.6 53.4 52.9 52.9 52.9 53.5 55.4 56.2 57.4 4.7 Non-Veteran 58.9 59.2 59.3 59.4 59.6 60.1 60.2 60.4 60.8 60.9 2.1
Supervisory Status Supervisor/Manager 58.3 58.7 58.7 59.0 59.2 59.5 59.8 59.9 60.3 60.4 2.1 Non Supervisor/Manager 59.1 59.4 59.6 59.7 60.0 60.5 60.8 61.0 61.5 61.6 2.6
Occupational Category Administrative 58.4 58.7 58.8 58.9 59.2 59.6 59.9 60.0 60.4 60.5 2.1 Professional 60.4 60.7 60.9 61.1 61.4 61.8 61.9 62.2 62.6 62.8 2.3 Technical 59.2 59.7 60.0 60.1 60.2 60.8 61.1 61.4 61.9 62.1 2.9 Blue Collar 57.8 58.2 58.7 58.6 58.9 59.7 60.1 60.6 61.3 61.5 3.7 Other 58.8 59.3 59.6 59.8 59.7 60.0 60.7 60.6 60.6 60.5 1.7
Unspecified values are omitted -- details may not add to total.

5
Table 5. Average Length of Service (years) at Retirement
FY 2005
FY 2006
FY 2007
FY 2008
FY 2009
FY 2010
FY 2011
FY 2012
FY 2013
FY 2014
Change FY05-14
Executive Branch All 27.9 28.3 28.3 28.2 27.8 27.7 28.0 27.9 27.5 26.9 (1.0)
Agency Category Cabinet-Level Agencies 27.6 28.0 28.0 27.9 27.5 27.4 27.7 27.5 27.1 26.5 (1.1) Large Indep. Agencies 30.3 30.5 30.9 31.2 31.2 30.8 31.4 31.6 31.2 30.4 0.0 Medium Indep. Agencies 28.9 29.3 28.7 29.0 29.0 29.8 31.1 30.6 29.3 28.3 (0.5) Small Indep. Agencies 27.6 28.8 28.0 26.2 28.0 27.1 25.3 28.3 25.2 28.7 1.0
Pay Plan GS/GM/GL 28.2 28.4 28.5 28.5 28.1 28.2 28.5 28.4 28.0 27.5 (0.6) Senior Executive Service 32.1 32.4 31.7 32.0 29.5 31.8 31.8 31.7 31.2 30.3 (1.8) Other 27.0 27.7 27.8 27.5 27.3 26.8 26.5 26.3 25.9 25.0 (1.9)
Retirement System FERS 19.0 19.6 20.1 20.3 20.2 20.6 20.9 21.1 21.1 21.7 2.6 CSRS 32.0 32.6 33.1 33.5 33.9 34.1 34.6 34.8 35.3 35.7 3.7 Other 26.9 27.2 27.2 28.4 28.2 29.9 29.9 28.5 27.9 26.8 (0.1)
Retirement Type Mandatory 28.5 28.6 28.9 28.6 27.4 27.3 27.9 27.3 27.6 28.0 (0.5) Disability 18.3 18.3 18.3 18.3 17.6 16.7 16.1 15.9 15.6 15.7 (2.7) Voluntary 29.1 29.4 29.3 29.2 29.0 28.7 28.8 28.7 28.1 27.5 (1.6) Early Out 27.5 27.5 28.0 28.1 28.0 28.1 27.6 27.9 27.6 27.5 0.1 Other 27.2 29.5 28.2 28.4 26.3 26.8 29.0 25.3 26.1 25.3 (1.9)
Gender Men 28.4 28.8 28.7 28.4 28.0 27.6 27.7 27.4 27.0 26.3 (2.1) Women 27.2 27.4 27.7 27.8 27.6 27.9 28.4 28.4 28.0 27.6 0.5
Race/National Origin Black/African American 28.4 29.0 29.0 29.1 28.6 29.0 29.4 29.5 29.0 28.5 0.1 White 28.0 28.3 28.3 28.2 27.8 27.6 27.9 27.7 27.2 26.6 (1.4) Hispanic/Latino 27.5 27.5 27.6 27.6 27.2 27.3 27.7 27.6 27.4 27.1 (0.3) Other 25.4 26.3 27.1 26.4 26.5 26.3 26.5 26.6 27.2 25.9 0.4
Veteran Status Veteran 27.8 28.4 28.4 28.2 27.6 26.9 26.6 25.9 25.3 24.0 (3.8) Exempt 24.7 25.0 24.9 24.8 23.3 21.8 22.8 24.6 25.1 27.1 2.5 Non-Veteran 28.1 28.3 28.4 28.3 28.2 28.4 28.8 28.9 28.6 28.2 0.1
Supervisory Status Supervisor/Manager 30.7 30.9 30.9 30.7 30.3 30.1 30.4 30.1 29.9 29.2 (1.5) Non Supervisor/Manager 27.3 27.7 27.7 27.6 27.3 27.2 27.5 27.4 26.9 26.3 (1.0)
Occupational Category Administrative 29.7 30.0 30.0 29.9 29.7 29.7 29.9 29.7 29.3 28.8 (0.9) Professional 28.7 28.8 28.9 28.8 28.7 28.1 28.5 28.1 27.6 26.7 (2.0) Technical 26.0 26.2 26.2 26.3 25.6 25.6 25.7 25.7 25.3 24.7 (1.3) Blue Collar 26.2 27.0 27.6 27.3 26.6 26.2 26.4 26.7 26.7 25.7 (0.5) Other 24.1 24.1 23.5 23.2 23.0 23.5 23.9 23.6 22.9 23.6 (0.4)
Unspecified values are omitted -- details may not add to total.

6
Table 6. Percent of Total Retirement, by Age and Length of Service and Fiscal Year
All FYs
FY 2005
FY 2006
FY 2007
FY 2008
FY 2009
FY 2010
FY 2011
FY 2012
FY 2013
FY 2014
Age <50 3.4 4.6 4.0 3.9 3.9 4.1 3.4 2.8 2.6 2.5 2.6 50-59 42.9 52.6 51.4 48.0 46.1 42.9 40.2 40.0 39.4 35.9 34.6 60+ 53.7 42.8 44.6 48.0 50.0 53.0 56.4 57.2 58.0 61.6 62.8
Length of Service (LOS) <20 18.0 17.0 15.7 15.5 15.8 17.7 17.5 17.3 18.1 20.8 23.5 20-29 32.3 33.8 33.1 33.1 32.8 31.9 33.2 32.2 32.2 30.6 30.9 30+ 49.7 49.3 51.2 51.4 51.5 50.4 49.3 50.5 49.7 48.6 45.6
Unspecified values are omitted -- details may not add to total.

7
Table 7. Fiscal Years 2005 - 2014 Top 3 Retirement Agencies and Occupational Series
Rank -
Retirement Count
Agency Category Agency Cabinet-Level Agencies 1 Department of the Army 85,561
2 Department of Veterans Affairs 84,088 3 Department of the Navy 61,232
Large Indep. Agencies 1 Social Security Administration 26,586 2 Nat Aeronautics and Space Administration 5,628 3 Environmental Protection Agency 4,735
Medium Indep. Agencies 1 Railroad Retirement Board 480 2 Pension Benefit Guaranty Corporation 235 3 Commodity Futures Trading Commission 186
Small Indep. Agencies 1 Occupational Safety & Health Review Cmsn 35 2 Office of Government Ethics 33 3 Fed Retirement Thrift Investment Board 25
Occupational Category Occupational Series Administrative 1 Miscellaneous Administration and Program 29,006
2 Information Technology Management 24,323 3 Management and Program Analysis 22,868
Professional 1 Nurse 17,008 2 Contracting 10,910 3 General Engineering 6,848
Technical 1 Miscellaneous Clerk and Assistant 13,196 2 Engineering Technical 8,196 3 Contact Representative 8,102
Blue Collar 1 Custodial Working 4,780 2 Maintenance Mechanic 4,628 3 Materials Handler 3,576
Other 1 Secretary 11,291 2 Miscellaneous Clerk and Assistant 6,786 3 Medical Support Assistance 3,668
8
Table 8. Monthly Retirement Number, by Fiscal Year
All FYs
FY 2005
FY 2006
FY 2007
FY 2008
FY 2009
FY 2010
FY 2011
FY 2012
FY 2013
FY 2014
January 103,218 9,188 12,272 13,480 12,440 10,196 10,687 6,551 3,971 9,845 14,588 February 33,440 3,227 3,477 3,600 4,505 2,656 3,041 3,178 2,949 2,921 3,886 March 43,737 4,042 4,966 5,832 4,618 2,876 3,508 3,863 4,796 4,299 4,937 April 44,428 5,884 4,245 4,109 3,646 3,029 4,221 4,713 5,912 4,079 4,590 May 44,158 4,221 3,697 3,918 4,874 3,500 3,515 3,881 3,910 5,608 7,034 June 53,905 4,882 5,926 5,597 4,255 3,374 3,995 5,574 7,977 6,569 5,756 July 47,001 4,896 3,938 3,837 3,832 4,570 6,223 7,267 3,840 4,117 4,481 August 40,702 3,567 3,242 5,319 4,901 3,258 3,334 3,785 4,734 4,075 4,487 September 57,071 7,795 7,154 6,150 4,330 3,501 4,254 7,511 5,222 5,384 5,770 October 34,187 4,087 4,331 3,101 3,274 3,371 3,017 3,526 3,335 3,180 2,965 November 27,214 2,218 2,403 2,334 3,162 1,917 2,050 2,231 2,909 3,680 4,310 December 80,523 7,853 4,602 5,089 5,076 3,852 4,815 12,158 19,765 11,501 5,812

9
Figures
10

11

12
13
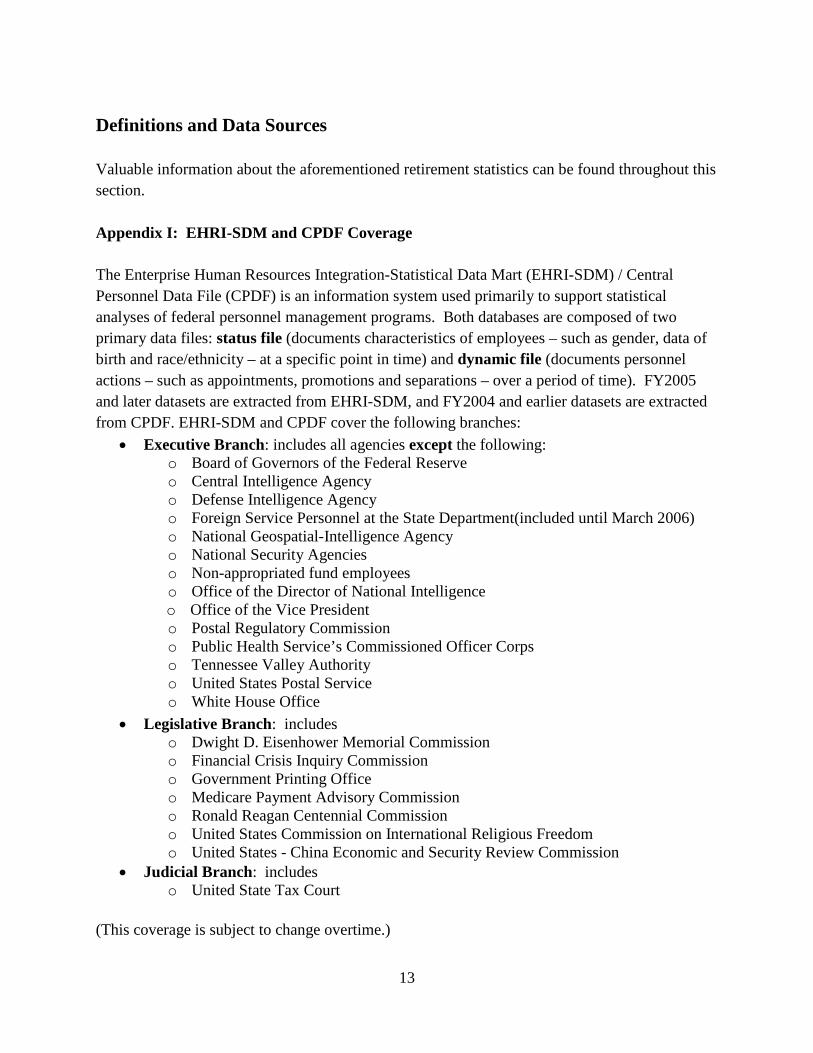
Definitions and Data Sources Valuable information about the aforementioned retirement statistics can be found throughout this section. Appendix I: EHRI-SDM and CPDF Coverage The Enterprise Human Resources Integration-Statistical Data Mart (EHRI-SDM) / Central Personnel Data File (CPDF) is an information system used primarily to support statistical analyses of federal personnel management programs. Both databases are composed of two primary data files: status file (documents characteristics of employees – such as gender, data of birth and race/ethnicity – at a specific point in time) and dynamic file (documents personnel actions – such as appointments, promotions and separations – over a period of time). FY2005 and later datasets are extracted from EHRI-SDM, and FY2004 and earlier datasets are extracted from CPDF. EHRI-SDM and CPDF cover the following branches:
• Executive Branch: includes all agencies except the following: o Board of Governors of the Federal Reserve o Central Intelligence Agency o Defense Intelligence Agency o Foreign Service Personnel at the State Department(included until March 2006) o National Geospatial-Intelligence Agency o National Security Agencies o Non-appropriated fund employees o Office of the Director of National Intelligence o Office of the Vice President o Postal Regulatory Commission o Public Health Service’s Commissioned Officer Corps o Tennessee Valley Authority o United States Postal Service o White House Office
• Legislative Branch: includes o Dwight D. Eisenhower Memorial Commission o Financial Crisis Inquiry Commission o Government Printing Office o Medicare Payment Advisory Commission o Ronald Reagan Centennial Commission o United States Commission on International Religious Freedom o United States - China Economic and Security Review Commission
• Judicial Branch: includes o United State Tax Court
(This coverage is subject to change overtime.)

14
• Recent significant change to coverage: includes
o The Bureau of Consumer Financial Protection, a component of the Federal Reserve, began reporting in March 2011.
o The Federal Bureau of Investigation did not report data on personnel actions until fiscal year 2007.
o The State Department stopped providing data on Foreign Service Personnel in March 2006.
o Prior to September 2013 the U.S. Tax Court although covered – was reflected as a legislative agency.
Appendix II: Retirement Type Eligibility Requirements This appendix provides age and length of service requirements for retiring under FERS and CSRS. Voluntary
1. Under both-the Civil Service Retirement System (CSRS) and the Federal Employees Retirement System (FERS), Federal personnel can retire if they:
(a) Are 55-59 years of age and (b) Have 30 or more years of creditable service.
Or (a) Are 60-61 years of age and (b) Have 20 or more years of creditable service.
Or (a) Are 62 years of age or older and (b) Have 5 or more years of creditable service.
2. Under the Federal Employees Retirement System Law only, Federal personnel can retire
if they: (a) Are 55-61 years of age and (b) Have 10 or more years of creditable service.
Note: Hazardous duty employees (law enforcers, firefighters) can retire voluntarily at age 50 with 20 years of creditable FERS or CSRS service.
Disability Employees who have completed 5 years of creditable service under CSRS or FERS and who the Office of Personnel Management finds to have become disabled can retire based on that disability. Note that for this retirement, there is no minimum age requirement. Mandatory Under retirement law, air traffic controllers must retire at age 55 unless exempted by the Secretary of Transportation. These exempted employees must ultimately retire at age

15
62. Additionally, retirement law stipulates that hazardous duty employees must retire at age 55 or must complete 20 years of creditable service if over that age. An agency may exempt these employees from that provision if the public interest so requires until the age of 60 when they must retire. Early-Out Employees may retire under the Early-out authority - if the Office of Personnel Management determines that an agency is undergoing - major reduction-in-force (RIF), major reorganization, or transfer of function. They can retire under either Civil Service Retirement System (CSRS) or the Federal Employees Retirement System (FERS) if they:
(a) Are 50-54 years of age and (b) Have at least 20 years of creditable service.
Or (a) Are 55-59 years of age and (b) Have between 20 and 29 years of creditable service.
Or (a) 49 years of age or less and (b) Have at least 25 years of creditable service to CSRS or to FERS.
In-Lieu-Of-Involuntary-Action (ILIA) The in-lieu-of-adverse-action retirements can be granted to employees involuntary separated. To be eligible, employees must be at least 50 years old and have at least 20 years of service credited under CSRS or FERS.
Appendix III: Key Demographic Definitions
This appendix provides keys definitions for the following demographics:
• Race or National Origin(RNO) o Black/African American: a person having origins in any of the black racial
groups of Africa. Does not include people of Mexican, Puerto Rican, Cuban, Central or South American, or other Spanish cultures or origins.
o White: a person having origins in any of the original people of Europe, North Africa, or the Middle East. Does not include people of Mexican, Puerto Rican, Cuban, Central or South American, or other Spanish cultures or origins.
o Hispanic/Latino: a person of Mexican, Puerto Rican, Cuban, Central or South American, or other Spanish cultures or origins. Does not include persons of Portuguese culture or origin.
o Other: includes persons who are American Indians or Alaskan natives, Asians or Pacific Islanders.
• Occupational category o Administrative: involves the exercise of analytical ability judgment, discretion,
and personal responsibility, and application of a substantial body of knowledge, principles, concepts, and practices applicable to one or more fields of administration or management.

16
o Professional: requires knowledge in a field of science or learning characteristically acquired through education or training pertinent to the specialized field as distinguished from general education.
o Technical: involves work that is non-routine in nature and is typically associated with, and in support of, a professional or administrative field.
o Blue-Collar: comprises the trades, crafts, and manual labor (unskilled, semiskilled, and skilled), including foreman and supervisory positions entailing trade, craft, or laboring experience.
o Other: includes employees in occupations that do not fall into the above occupational categories.
• Veteran status o Veteran: includes employees who served in the active uniformed military service
of the United States and who was discharged or released from service under conditions other than dishonorable and meet at least one of the following criteria: Vietnam-era veteran (A veteran who served any time during the Vietnam
era (i.e., from August 5, 1964, through May 7, 1975) Pre-Vietnam-era veteran. A veteran whose service ended before the
Vietnam era (i.e., before August 5, 1964). Post-Vietnam-era veteran. A veteran whose service began after the
Vietnam era (i.e., after May 7, 1975). o Non veteran: Not a veteran o Exempt: Employees exempt to report their veteran status.
(Refer to OPM website for further information on definition of data elements.3)

17
References
1. OPM CSRS Information - Eligibility. http://www.opm.gov/retirement-services/csrs-information/eligibility/ . Accessed May 1, 2015.
2. OPM FERS Information - Eligibility. http://www.opm.gov/retirement-services/fers-information/eligibility/ . Accessed May 1, 2015.
3. OPM Guide to Data Standards. http://www.opm.gov/policy-data-oversight/data-analysis-documentation/data-policy-guidance/reporting-guidance/part-a-human-resources.pdf . Accessed May 1, 2015.
If you have questions concerning this analysis, please e-mail [email protected] .
United StateS Office Of PerSOnnel ManageMent
Planning and Policy Analysis1900 E Street, NW
Washington, DC 20415
PPA/DAG-2015-014


