GARTNER CONSULTING
CONFIDENTIAL AND PROPRIETARY
This presentation, including any supporting materials, is owned by Gartner, Inc. and/or its affiliates and is for
the sole use of the intended Gartner audience or other intended recipients. This presentation may contain
information that is confidential, proprietary or otherwise legally protected, and it may not be further copied,
distributed or publicly displayed without the express written permission of Gartner, Inc. or its affiliates.
© 2015 Gartner, Inc. and/or its affiliates. All rights reserved.
Prepared for: XYZ Company
Executive Programs & IT Key Metrics Data
Executive Assessment
May 2015
Version #1
CONFIDENTIAL AND PROPRIETARY
EP ITKMD Executive Assessment | © 2015 Gartner, Inc. and/or its affiliates. All rights reserved. 1
Source: Gartner Benchmark Analytics - IT Key Metrics Data
Content
Assessment Overview & Description of Comparison Groups
Key Data Input
IT Spending as a % of Total Revenues
IT Spending as a % of Operating Expenses
IT Spending per Company Employee
IT Employees as a % of Company Employees
In House vs. Contract IT Employees
Capital vs. Operational IT Spending
IT Spend Distribution (HW, SW, Personnel, Outsourcing)
IT Spend Distribution (Run, Grow, Transform)
Spending & Staffing
IT Security Metrics Comparison
IT Outsourcing Metrics Comparison
Applications Metrics Comparison
CONFIDENTIAL AND PROPRIETARY
EP ITKMD Executive Assessment | © 2015 Gartner, Inc. and/or its affiliates. All rights reserved. 2
Source: Gartner Benchmark Analytics - IT Key Metrics Data
Assessment Overview
The purpose of this executive assessment is to provide a high level overview of investment and
staffing levels and distribution against industry averages as well as insight into technology-specific
cost, staffing and performance levels.
The metrics contained in this report are based on averages sourced from the Gartner IT Key Metrics
Data 2015 publication series, and provide you with a vehicle to easily compare your organization’s
key IT metrics against the Gartner averages in a structured environment.
Published content represents a mix of organization’s of different sizes and vertical industry
segmentations.
As with any data, many potential interpretations and analyses exist, so these measures should be
considered in the context of your organization’s future state objectives and your niche competitive
landscape.
Your organization should assess its own situation carefully, and should not, arbitrarily, change to
conform to published data (which do not necessarily represent best practices).
CONFIDENTIAL AND PROPRIETARY
EP ITKMD Executive Assessment | © 2015 Gartner, Inc. and/or its affiliates. All rights reserved. 3
Source: Gartner Benchmark Analytics - IT Key Metrics Data
Description of Comparison Groups
Industry analysis:
For measures by industry this analysis explores an organization’s total capital and operational
(excluding depreciation and amortization) budget and staffing levels. Your organization has been
compared to organization’s within your industry sector.
Non-industry analysis:
For the Security Metrics Comparison, Outsourcing Metrics Comparison and Applications Metrics
Comparison sections your organization has been compared to the full database for each of the
technology domains analyzed.
4
CONFIDENTIAL AND PROPRIETARY
EP ITKMD Executive Assessment | © 2015 Gartner, Inc. and/or its affiliates. All rights reserved.
Industry Comparison Analysis
CONFIDENTIAL AND PROPRIETARY
EP ITKMD Executive Assessment | © 2015 Gartner, Inc. and/or its affiliates. All rights reserved. 5
Source: Gartner Benchmark Analytics - IT Key Metrics Data
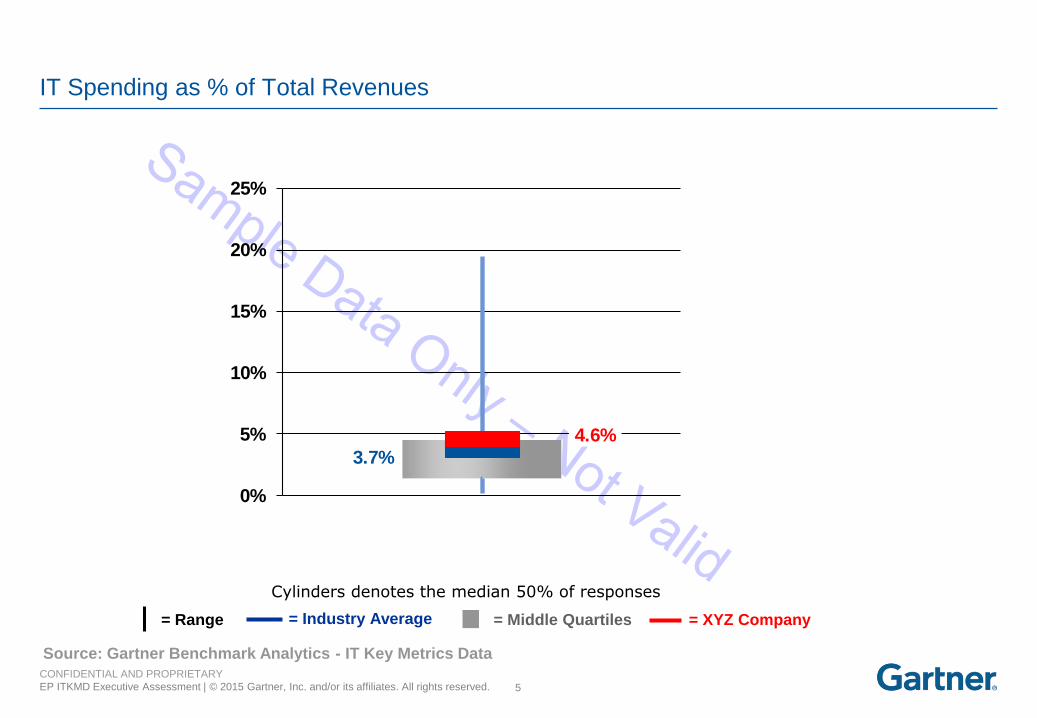
IT Spending as % of Total Revenues
Cylinders denotes the median 50% of responses
= Range = Industry Average = Middle Quartiles = XYZ Company
3.7%
4.6%
0%
5%
10%
15%
20%
25%
CONFIDENTIAL AND PROPRIETARY
EP ITKMD Executive Assessment | © 2015 Gartner, Inc. and/or its affiliates. All rights reserved. 6
Source: Gartner Benchmark Analytics - IT Key Metrics Data
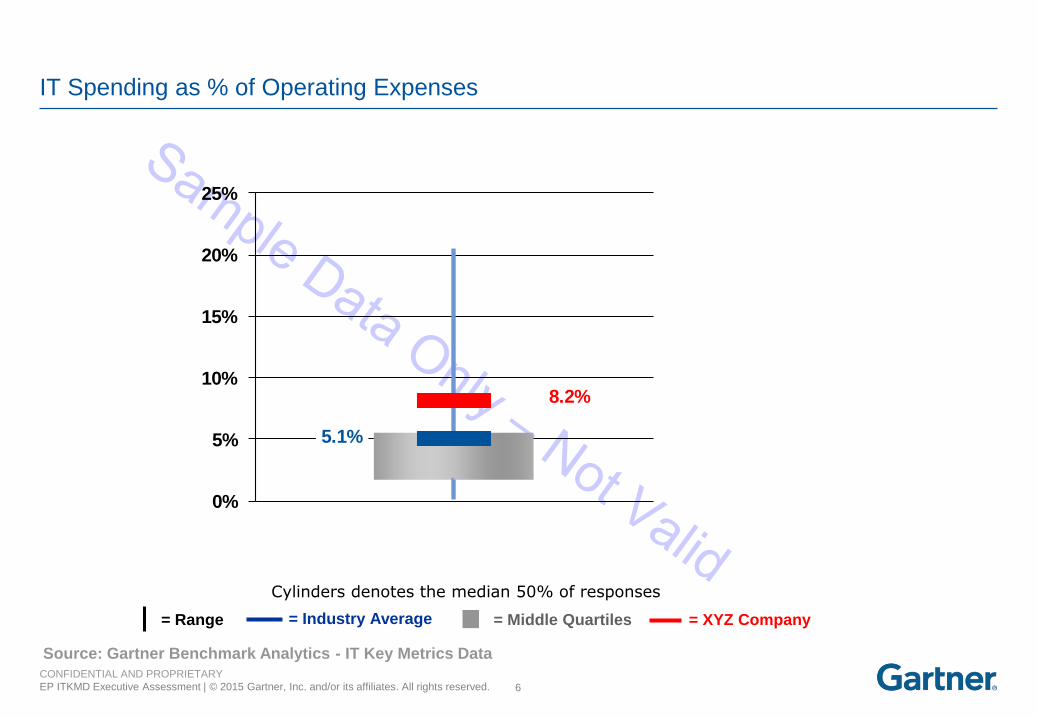
IT Spending as % of Operating Expenses
Cylinders denotes the median 50% of responses
5.1%
8.2%
0%
5%
10%
15%
20%
25%
= Range = Industry Average = Middle Quartiles = XYZ Company
CONFIDENTIAL AND PROPRIETARY
EP ITKMD Executive Assessment | © 2015 Gartner, Inc. and/or its affiliates. All rights reserved. 7
Source: Gartner Benchmark Analytics - IT Key Metrics Data
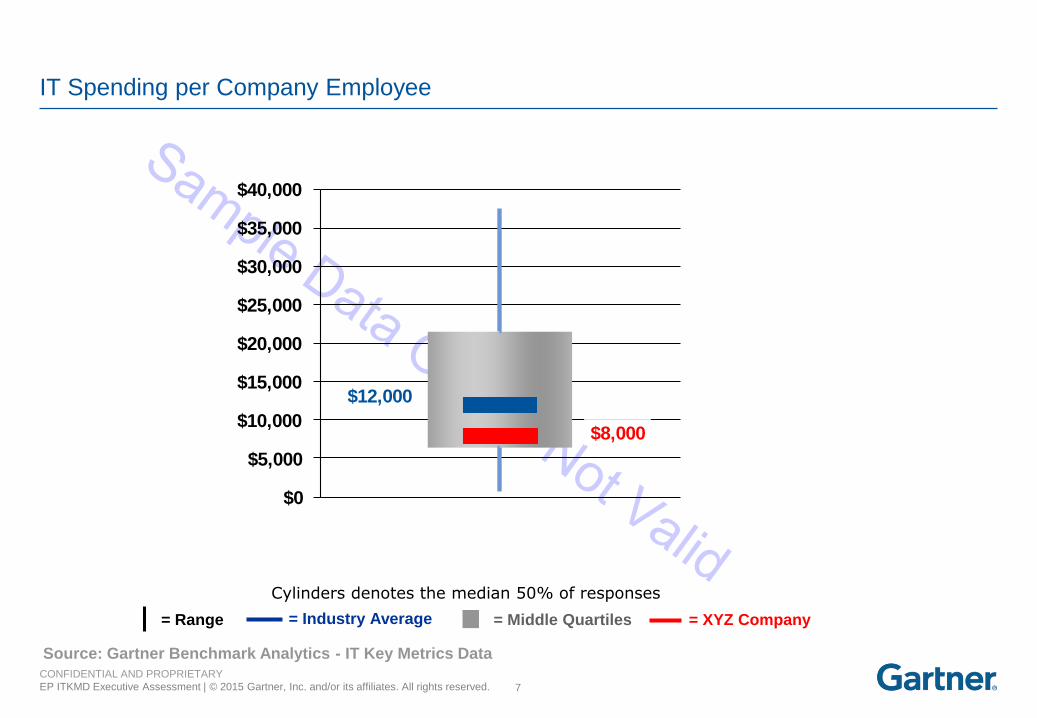
IT Spending per Company Employee
Cylinders denotes the median 50% of responses
$12,000
$8,000
$0
$5,000
$10,000
$15,000
$20,000
$25,000
$30,000
$35,000
$40,000
= Range = Industry Average = Middle Quartiles = XYZ Company
CONFIDENTIAL AND PROPRIETARY
EP ITKMD Executive Assessment | © 2015 Gartner, Inc. and/or its affiliates. All rights reserved. 8
Source: Gartner Benchmark Analytics - IT Key Metrics Data
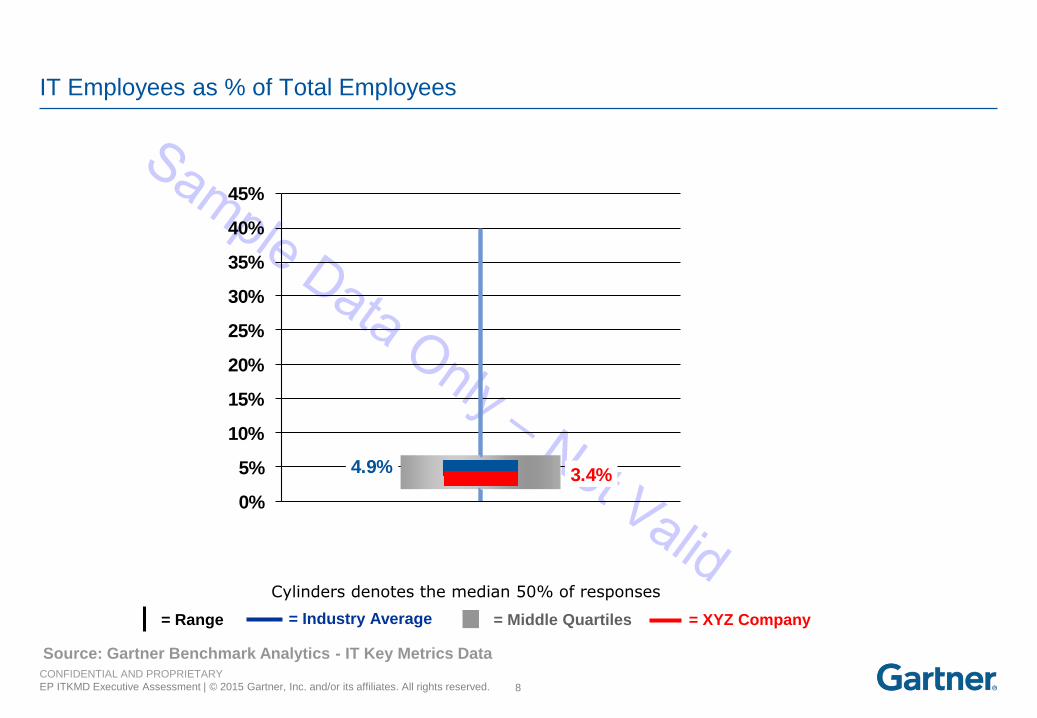
IT Employees as % of Total Employees
Cylinders denotes the median 50% of responses
4.9% 3.4%
0%
5%
10%
15%
20%
25%
30%
35%
40%
45%
= Range = Industry Average = Middle Quartiles = XYZ Company
CONFIDENTIAL AND PROPRIETARY
EP ITKMD Executive Assessment | © 2015 Gartner, Inc. and/or its affiliates. All rights reserved. 9
Source: Gartner Benchmark Analytics - IT Key Metrics Data
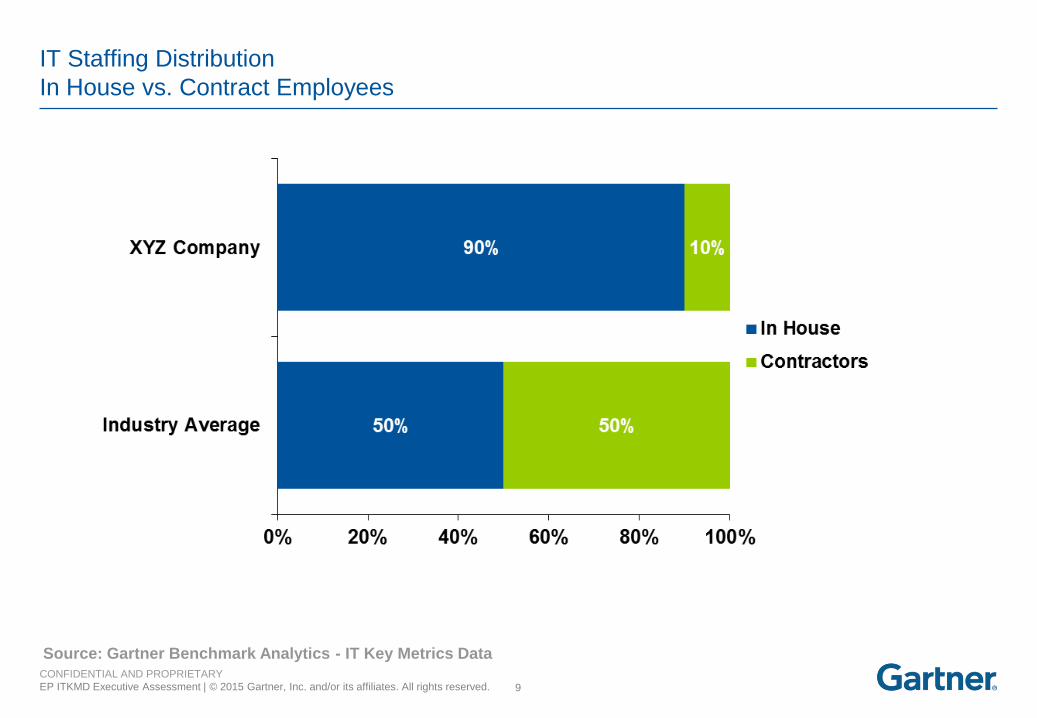
IT Staffing Distribution
In House vs. Contract Employees
CONFIDENTIAL AND PROPRIETARY
EP ITKMD Executive Assessment | © 2015 Gartner, Inc. and/or its affiliates. All rights reserved. 10
Source: Gartner Benchmark Analytics - IT Key Metrics Data
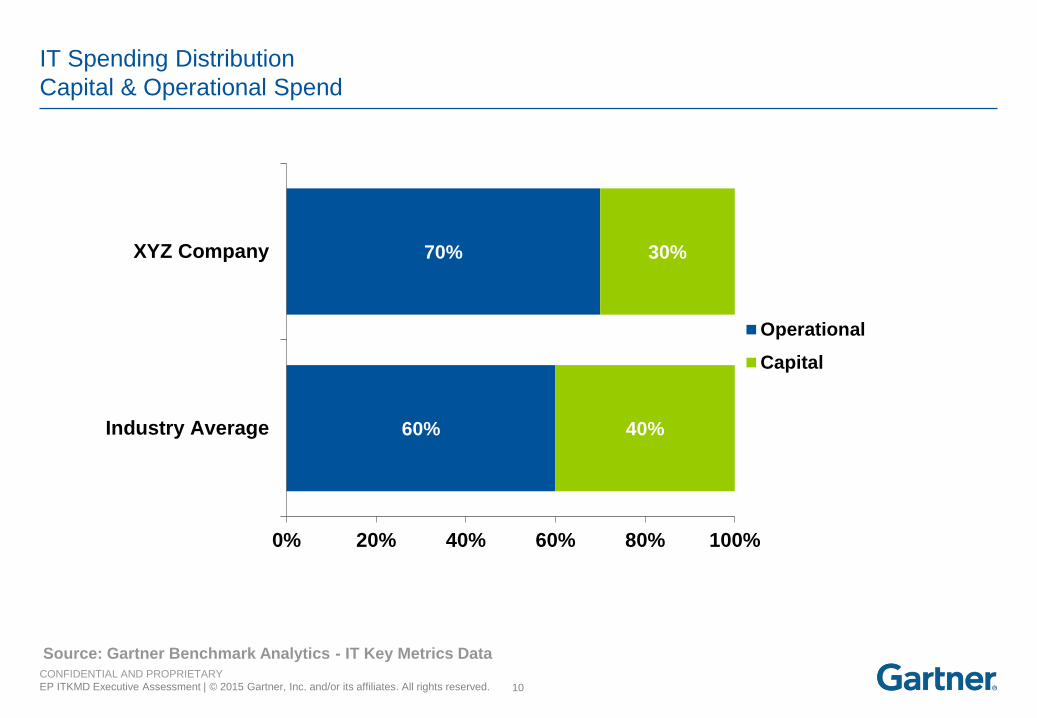
IT Spending Distribution
Capital & Operational Spend
60%
70%
40%
30%
0% 20% 40% 60% 80% 100%
Industry Average
XYZ Company
Operational
Capital
CONFIDENTIAL AND PROPRIETARY
EP ITKMD Executive Assessment | © 2015 Gartner, Inc. and/or its affiliates. All rights reserved. 11
Source: Gartner Benchmark Analytics - IT Key Metrics Data
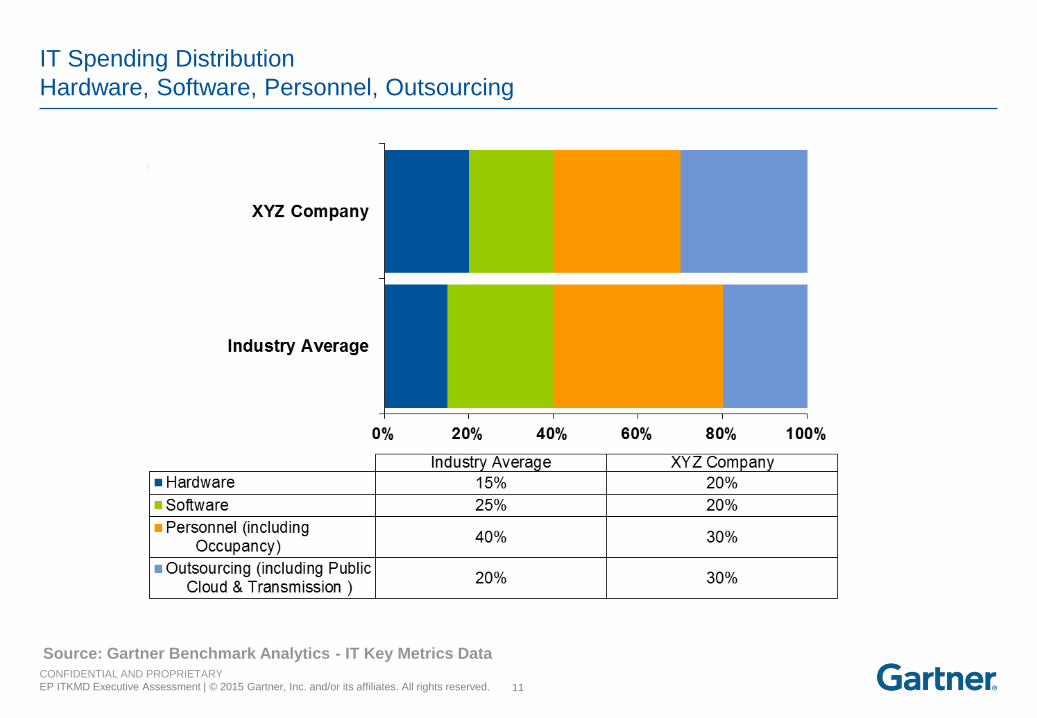
IT Spending Distribution
Hardware, Software, Personnel, Outsourcing
CONFIDENTIAL AND PROPRIETARY
EP ITKMD Executive Assessment | © 2015 Gartner, Inc. and/or its affiliates. All rights reserved. 12
Source: Gartner Benchmark Analytics - IT Key Metrics Data
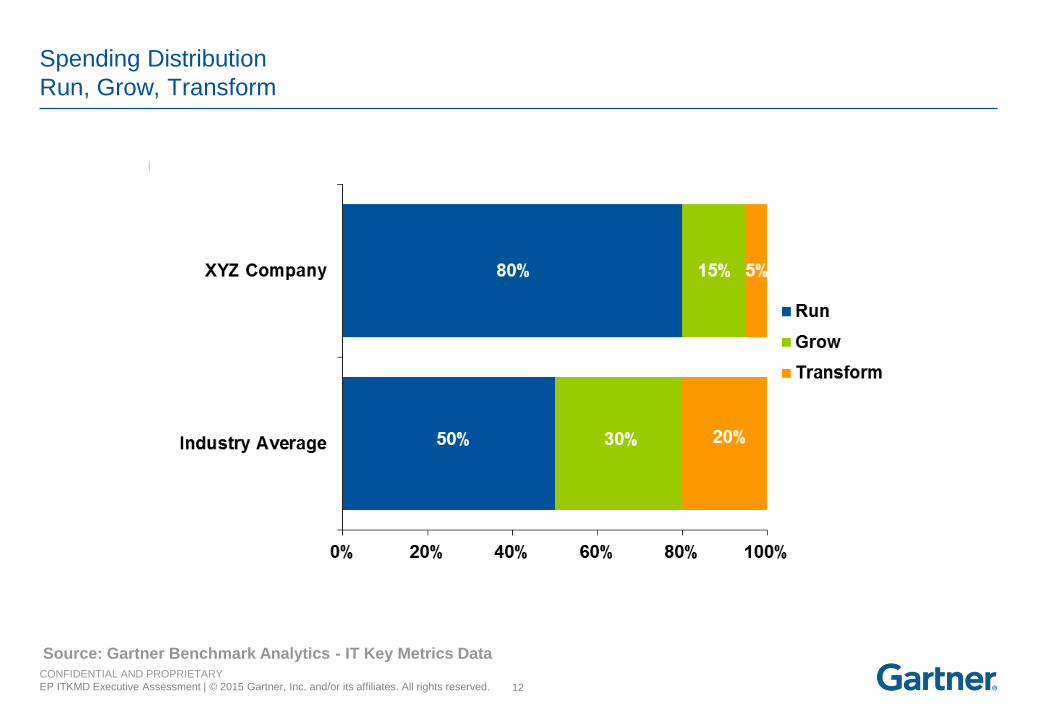
Spending Distribution
Run, Grow, Transform
CONFIDENTIAL AND PROPRIETARY
EP ITKMD Executive Assessment | © 2015 Gartner, Inc. and/or its affiliates. All rights reserved. 13
Source: Gartner Benchmark Analytics - IT Key Metrics Data
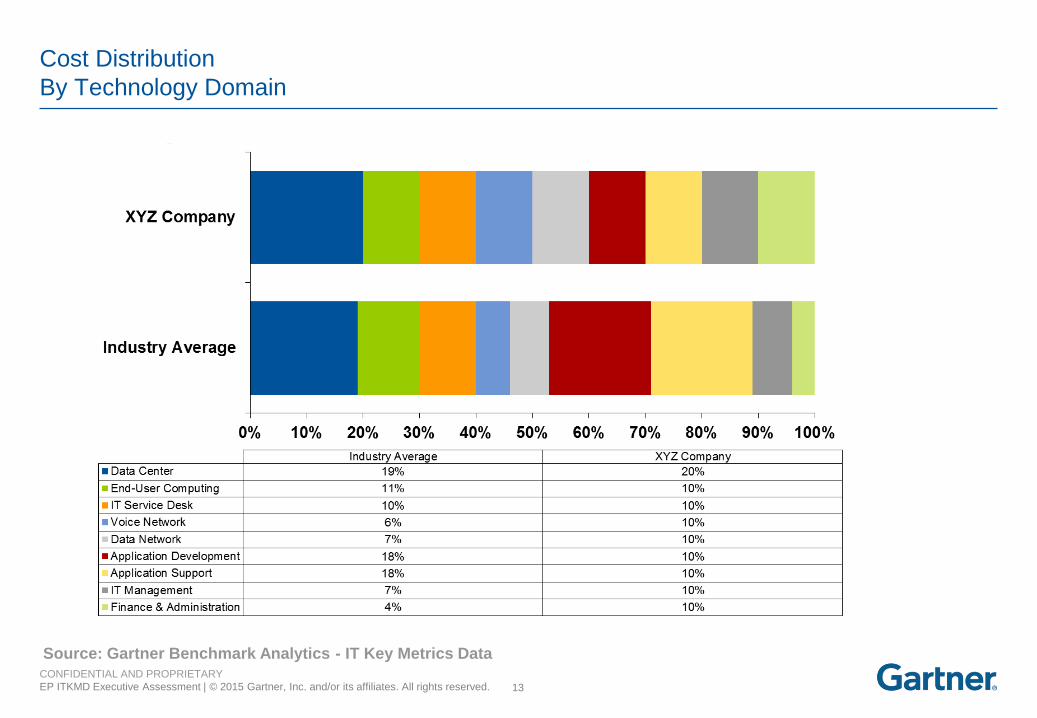
Cost Distribution
By Technology Domain
CONFIDENTIAL AND PROPRIETARY
EP ITKMD Executive Assessment | © 2015 Gartner, Inc. and/or its affiliates. All rights reserved. 14
Source: Gartner Benchmark Analytics - IT Key Metrics Data
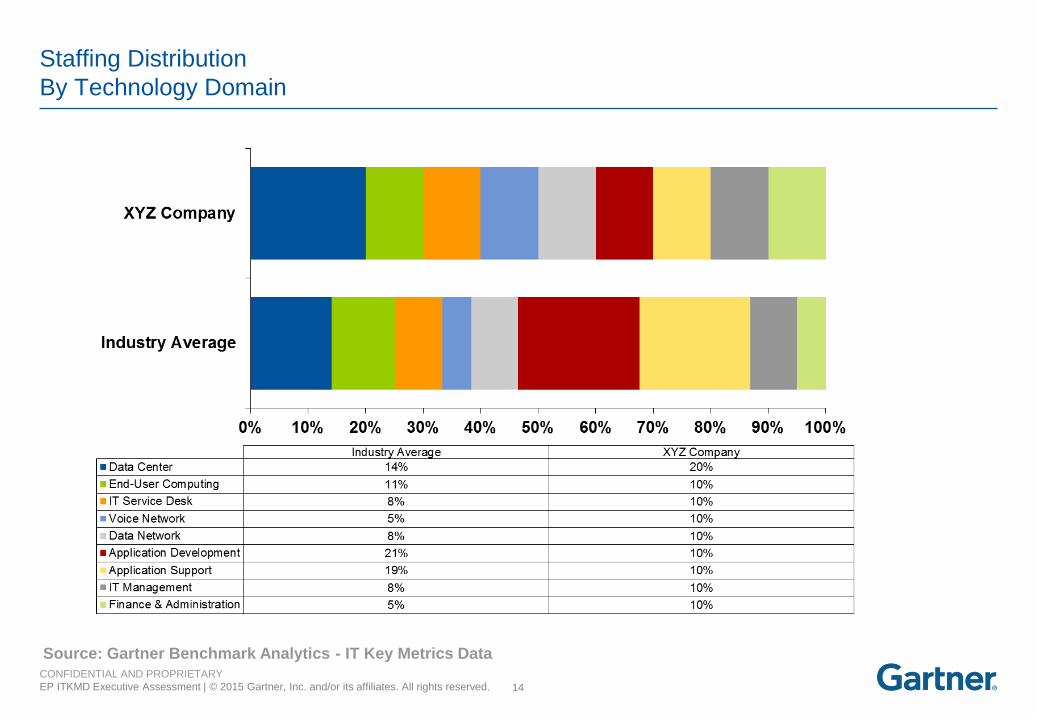
Staffing Distribution
By Technology Domain
15
CONFIDENTIAL AND PROPRIETARY
EP ITKMD Executive Assessment | © 2015 Gartner, Inc. and/or its affiliates. All rights reserved.
IT Security Comparison Analysis
Comparison group based on full security database
(across all industries)
CONFIDENTIAL AND PROPRIETARY
EP ITKMD Executive Assessment | © 2015 Gartner, Inc. and/or its affiliates. All rights reserved. 16
Source: Gartner Benchmark Analytics - IT Key Metrics Data
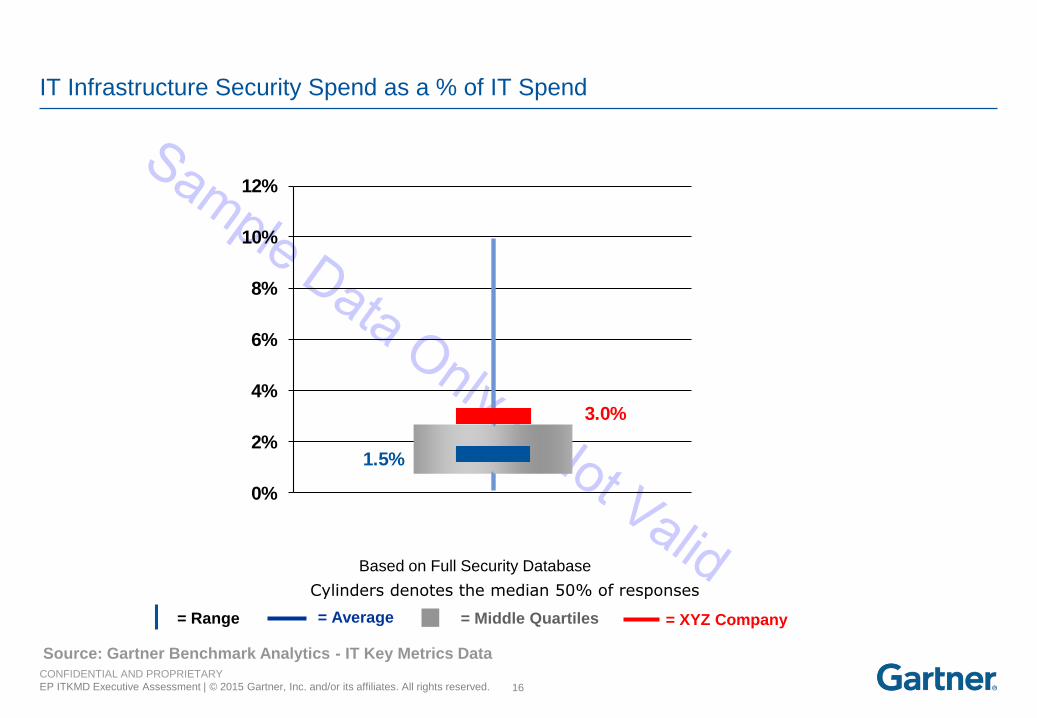
IT Infrastructure Security Spend as a % of IT Spend
Cylinders denotes the median 50% of responses
= Range = Average = Middle Quartiles
Based on Full Security Database
= XYZ Company
1.5%
3.0%
0%
2%
4%
6%
8%
10%
12%
CONFIDENTIAL AND PROPRIETARY
EP ITKMD Executive Assessment | © 2015 Gartner, Inc. and/or its affiliates. All rights reserved. 17
Source: Gartner Benchmark Analytics - IT Key Metrics Data
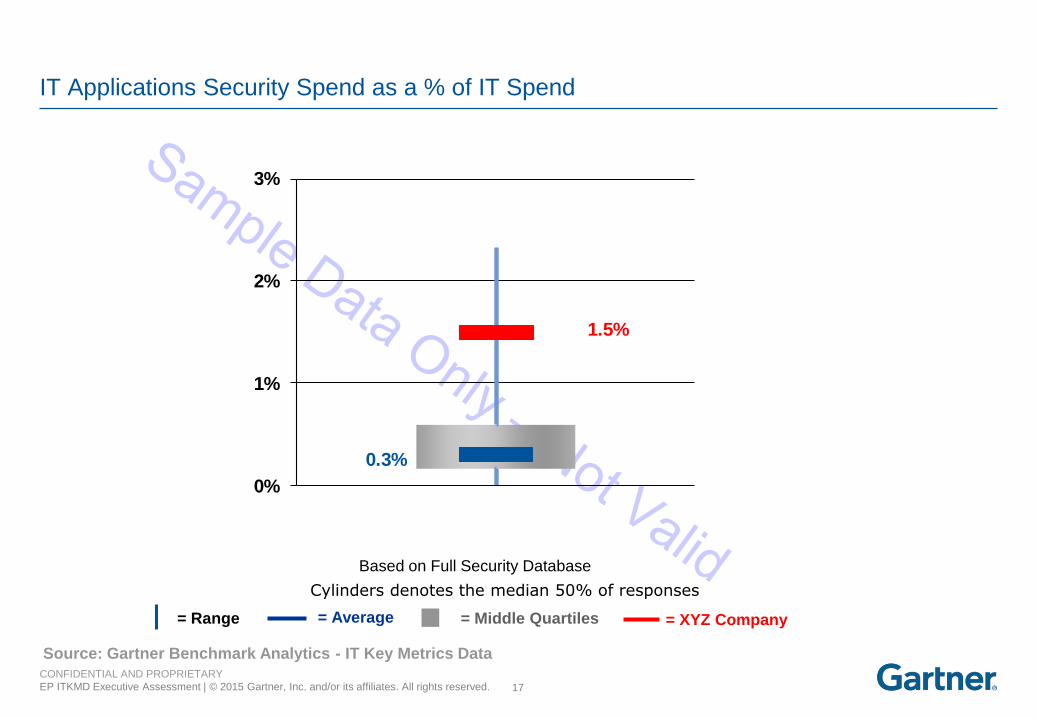
IT Applications Security Spend as a % of IT Spend
Cylinders denotes the median 50% of responses
= Range = Average = Middle Quartiles
Based on Full Security Database
= XYZ Company
0.3%
1.5%
0%
1%
2%
3%
CONFIDENTIAL AND PROPRIETARY
EP ITKMD Executive Assessment | © 2015 Gartner, Inc. and/or its affiliates. All rights reserved. 18
Source: Gartner Benchmark Analytics - IT Key Metrics Data
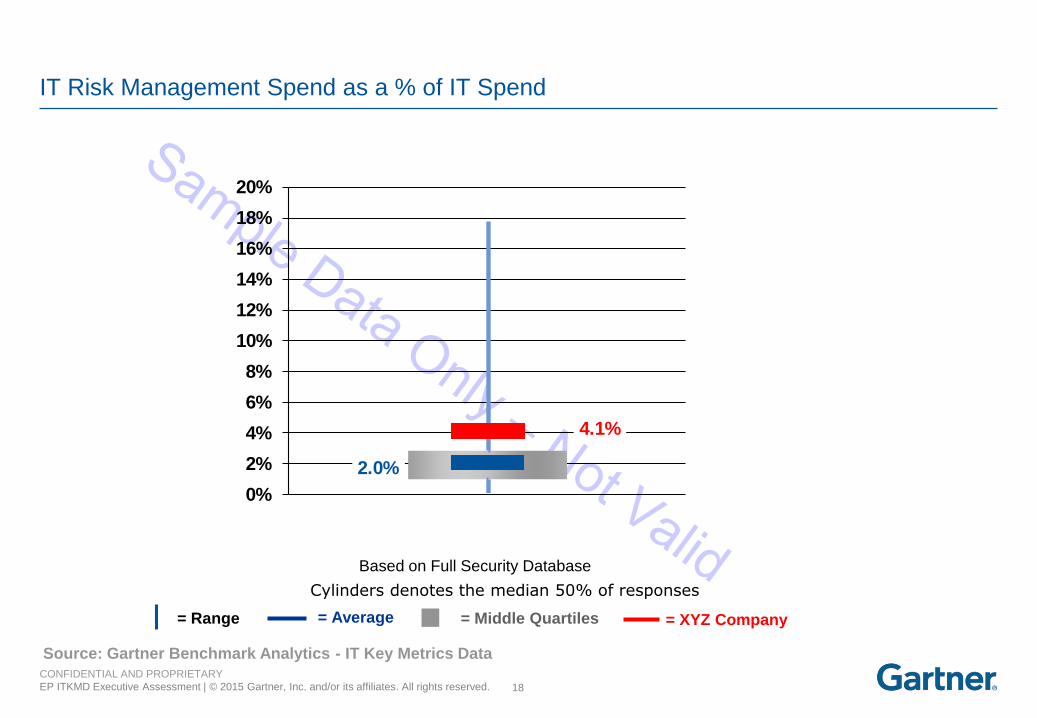
IT Risk Management Spend as a % of IT Spend
Cylinders denotes the median 50% of responses
= Range = Average = Middle Quartiles
Based on Full Security Database
= XYZ Company
2.0%
4.1%
0%
2%
4%
6%
8%
10%
12%
14%
16%
18%
20%
CONFIDENTIAL AND PROPRIETARY
EP ITKMD Executive Assessment | © 2015 Gartner, Inc. and/or its affiliates. All rights reserved. 19
Source: Gartner Benchmark Analytics - IT Key Metrics Data
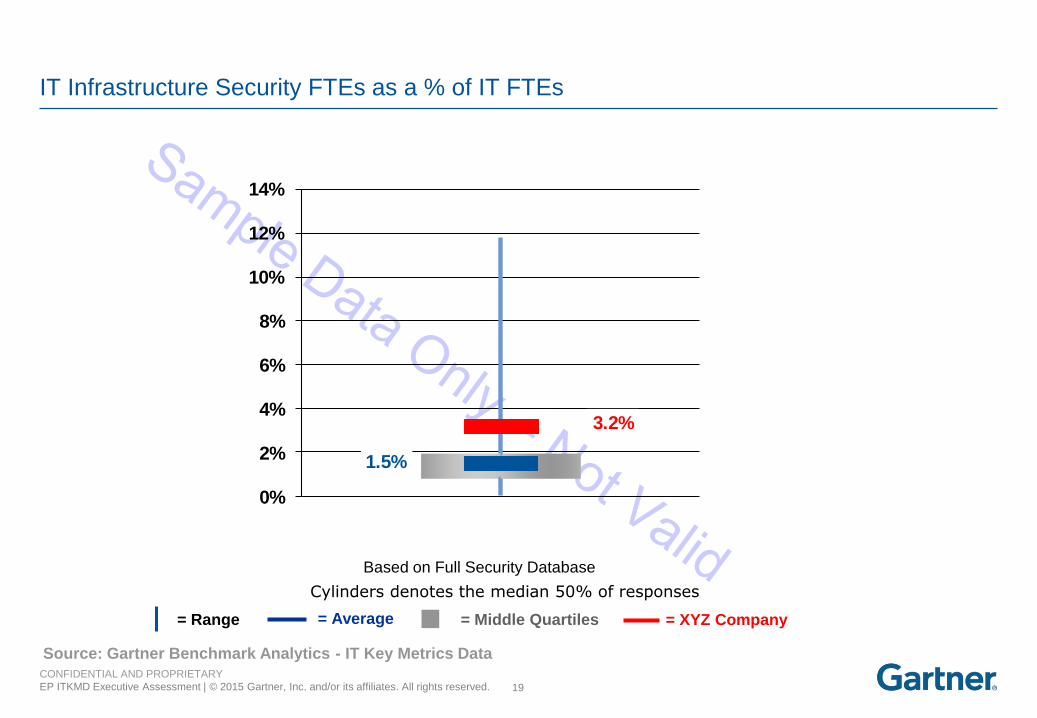
IT Infrastructure Security FTEs as a % of IT FTEs
Cylinders denotes the median 50% of responses
= Range = Average = Middle Quartiles
Based on Full Security Database
= XYZ Company
1.5%
3.2%
0%
2%
4%
6%
8%
10%
12%
14%
CONFIDENTIAL AND PROPRIETARY
EP ITKMD Executive Assessment | © 2015 Gartner, Inc. and/or its affiliates. All rights reserved. 20
Source: Gartner Benchmark Analytics - IT Key Metrics Data
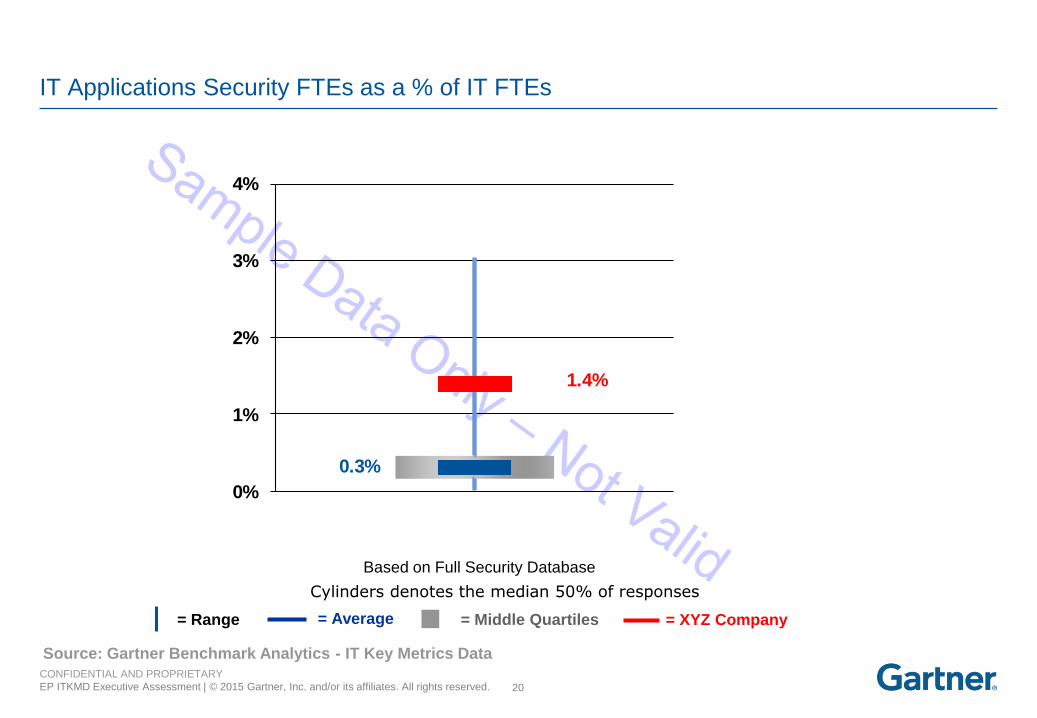
IT Applications Security FTEs as a % of IT FTEs
Cylinders denotes the median 50% of responses
= Range = Average = Middle Quartiles
Based on Full Security Database
= XYZ Company
0.3%
1.4%
0%
1%
2%
3%
4%
CONFIDENTIAL AND PROPRIETARY
EP ITKMD Executive Assessment | © 2015 Gartner, Inc. and/or its affiliates. All rights reserved. 21
Source: Gartner Benchmark Analytics - IT Key Metrics Data
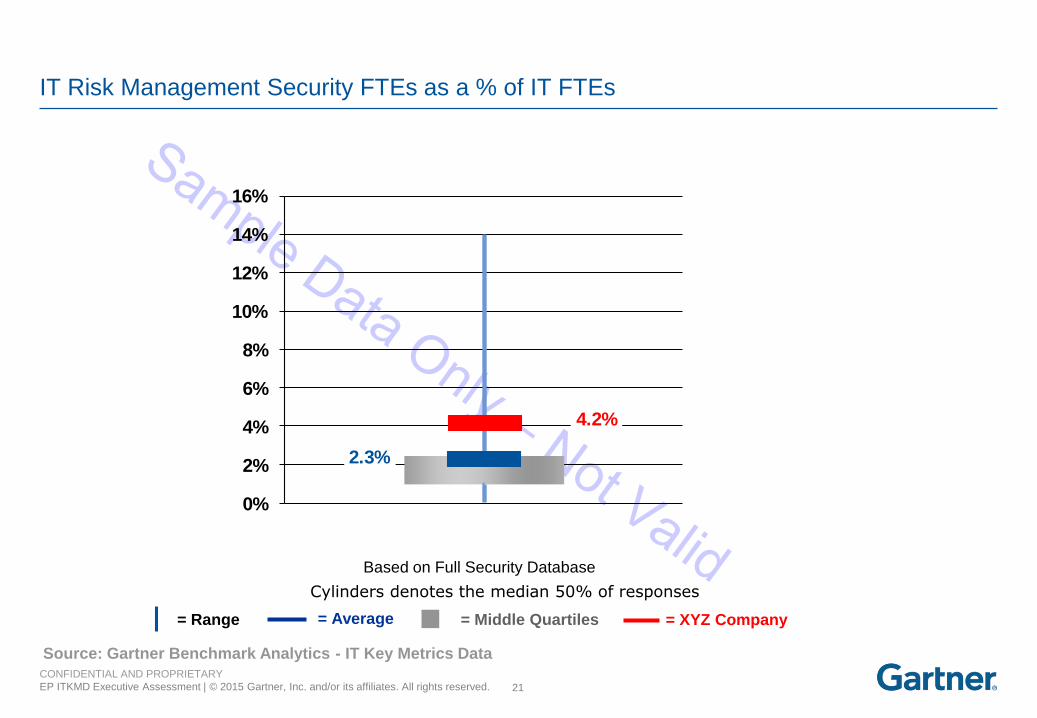
IT Risk Management Security FTEs as a % of IT FTEs
Cylinders denotes the median 50% of responses
= Range = Average = Middle Quartiles
Based on Full Security Database
= XYZ Company
2.3%
4.2%
0%
2%
4%
6%
8%
10%
12%
14%
16%
22
CONFIDENTIAL AND PROPRIETARY
EP ITKMD Executive Assessment | © 2015 Gartner, Inc. and/or its affiliates. All rights reserved.
IT Outsourcing Comparison Analysis
Comparison group based on full outsourcing database
(across all industries)
CONFIDENTIAL AND PROPRIETARY
EP ITKMD Executive Assessment | © 2015 Gartner, Inc. and/or its affiliates. All rights reserved. 23
Source: Gartner Benchmark Analytics - IT Key Metrics Data
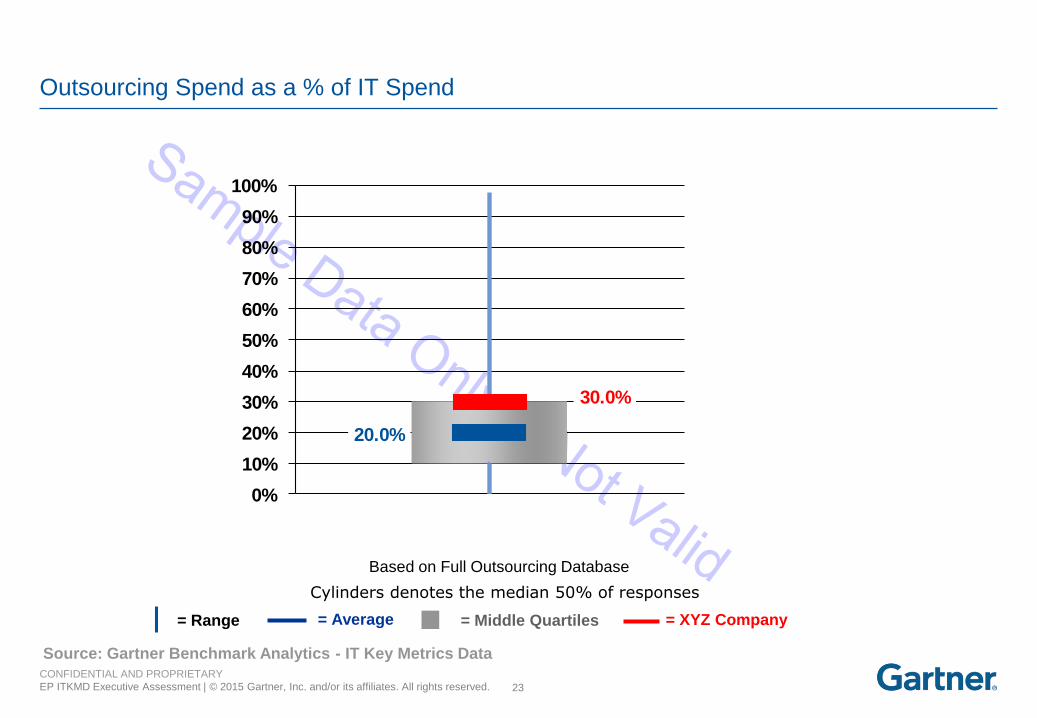
Outsourcing Spend as a % of IT Spend
Cylinders denotes the median 50% of responses
Based on Full Outsourcing Database
= Range = Average = Middle Quartiles = XYZ Company
20.0%
30.0%
0%
10%
20%
30%
40%
50%
60%
70%
80%
90%
100%
CONFIDENTIAL AND PROPRIETARY
EP ITKMD Executive Assessment | © 2015 Gartner, Inc. and/or its affiliates. All rights reserved. 24
Source: Gartner Benchmark Analytics - IT Key Metrics Data
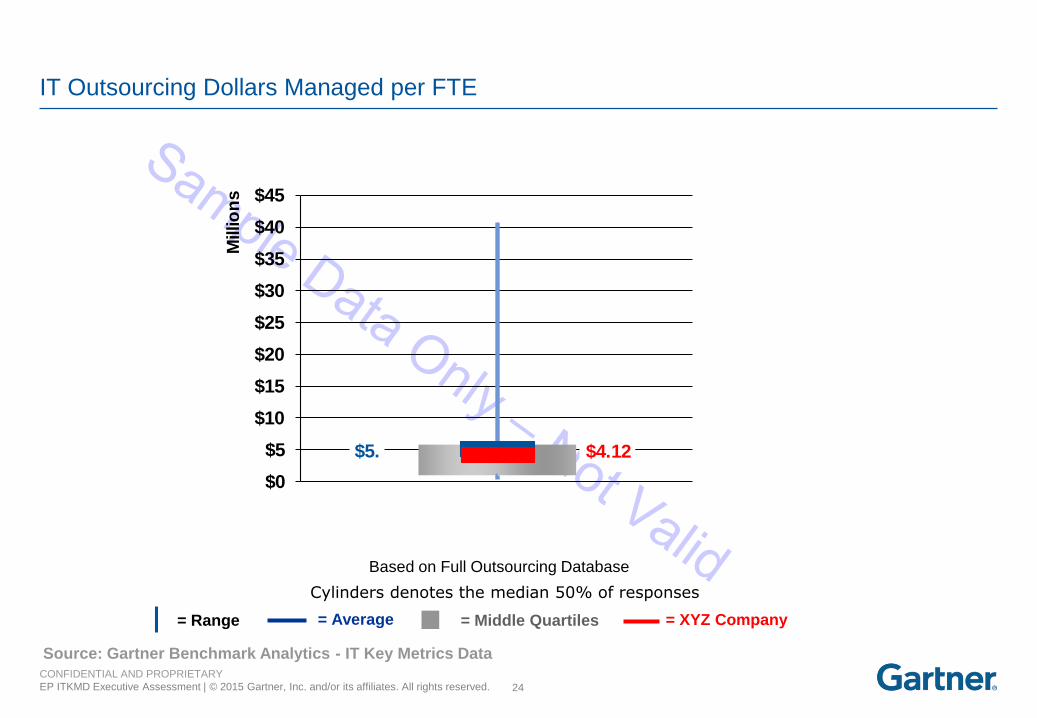
IT Outsourcing Dollars Managed per FTE
Cylinders denotes the median 50% of responses
Based on Full Outsourcing Database
= Range = Average = Middle Quartiles = XYZ Company
$5. $4.12
$0
$5
$10
$15
$20
$25
$30
$35
$40
$45
Millio
ns
25
CONFIDENTIAL AND PROPRIETARY
EP ITKMD Executive Assessment | © 2015 Gartner, Inc. and/or its affiliates. All rights reserved.
Applications Comparison Analysis
Comparison group based on full applications database
(across all industries)
CONFIDENTIAL AND PROPRIETARY
EP ITKMD Executive Assessment | © 2015 Gartner, Inc. and/or its affiliates. All rights reserved. 26
Source: Gartner Benchmark Analytics - IT Key Metrics Data
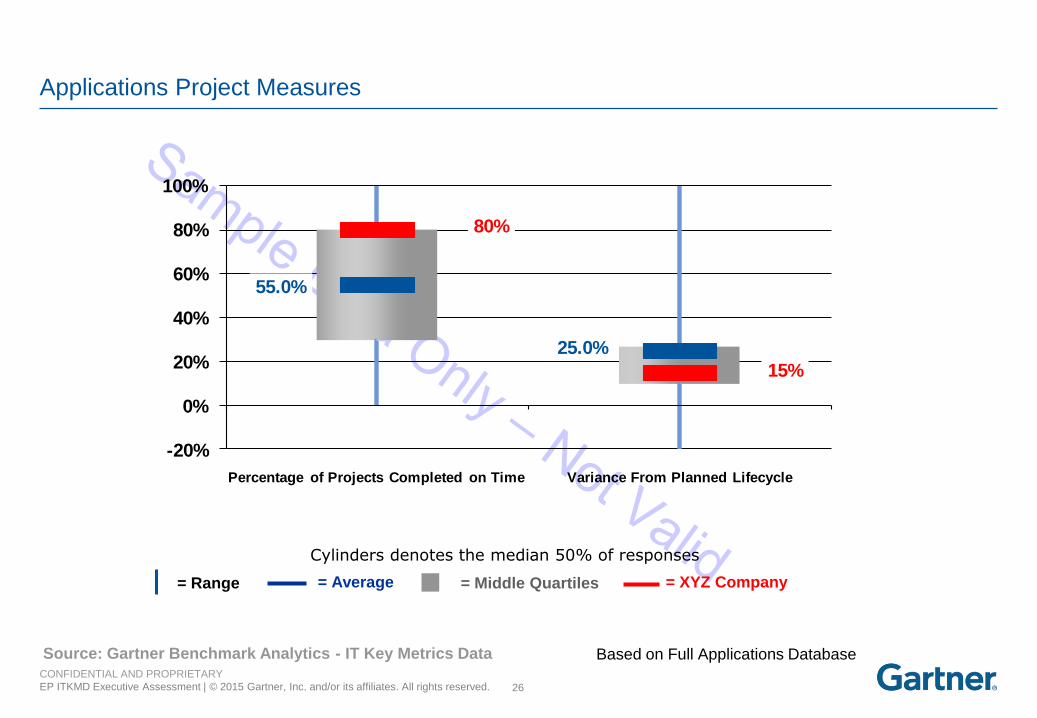
Applications Project Measures
Cylinders denotes the median 50% of responses
= Range = Average = Middle Quartiles = XYZ Company
55.0%
25.0%
80%
15%
-20%
0%
20%
40%
60%
80%
100%
Percentage of Projects Completed on Time Variance From Planned Lifecycle
Based on Full Applications Database
CONFIDENTIAL AND PROPRIETARY
EP ITKMD Executive Assessment | © 2015 Gartner, Inc. and/or its affiliates. All rights reserved. 27
Source: Gartner Benchmark Analytics - IT Key Metrics Data
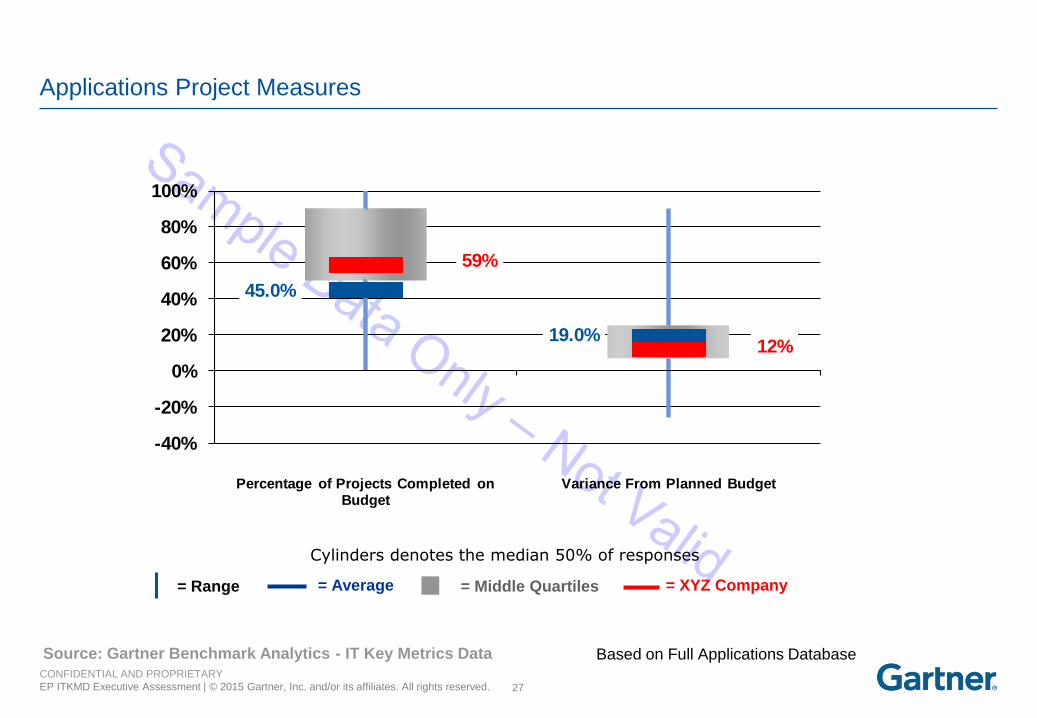
Applications Project Measures
= Range = Average = Middle Quartiles = XYZ Company
45.0%
19.0%
59%
12%
-40%
-20%
0%
20%
40%
60%
80%
100%
Percentage of Projects Completed on Budget
Variance From Planned Budget
Based on Full Applications Database
Cylinders denotes the median 50% of responses
CONFIDENTIAL AND PROPRIETARY
EP ITKMD Executive Assessment | © 2015 Gartner, Inc. and/or its affiliates. All rights reserved. 28
Source: Gartner Benchmark Analytics - IT Key Metrics Data
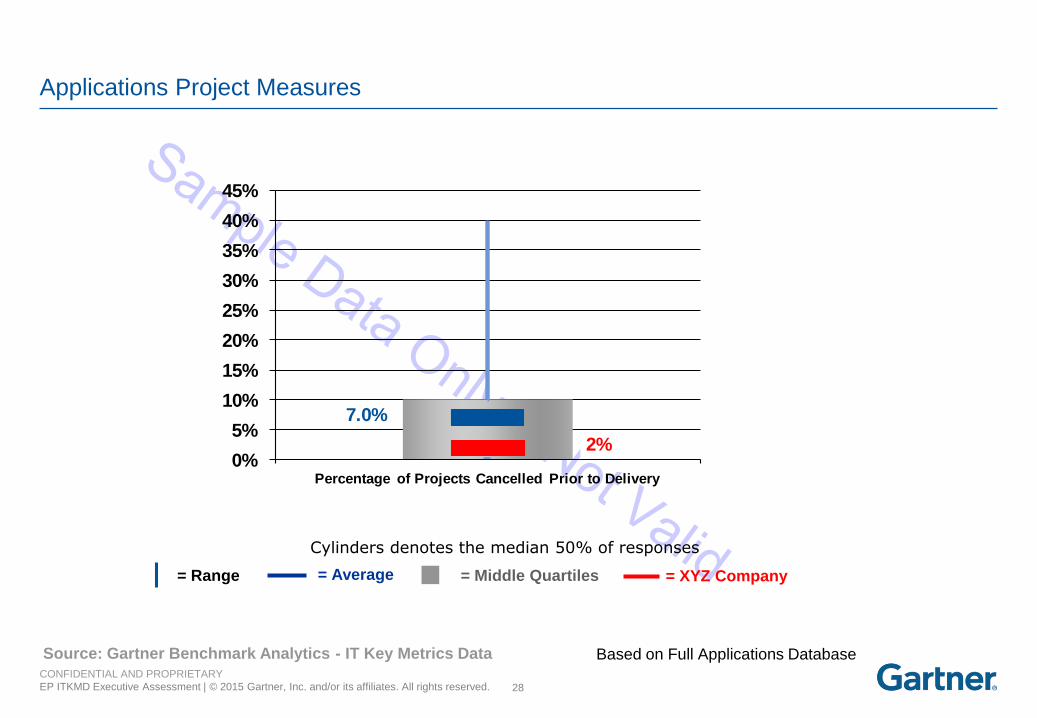
Applications Project Measures
Cylinders denotes the median 50% of responses
= Range = Average = Middle Quartiles = XYZ Company
7.0%
2%0%
5%
10%
15%
20%
25%
30%
35%
40%
45%
Percentage of Projects Cancelled Prior to Delivery
Based on Full Applications Database
CONFIDENTIAL AND PROPRIETARY
EP ITKMD Executive Assessment | © 2015 Gartner, Inc. and/or its affiliates. All rights reserved. 29
Source: Gartner Benchmark Analytics - IT Key Metrics Data
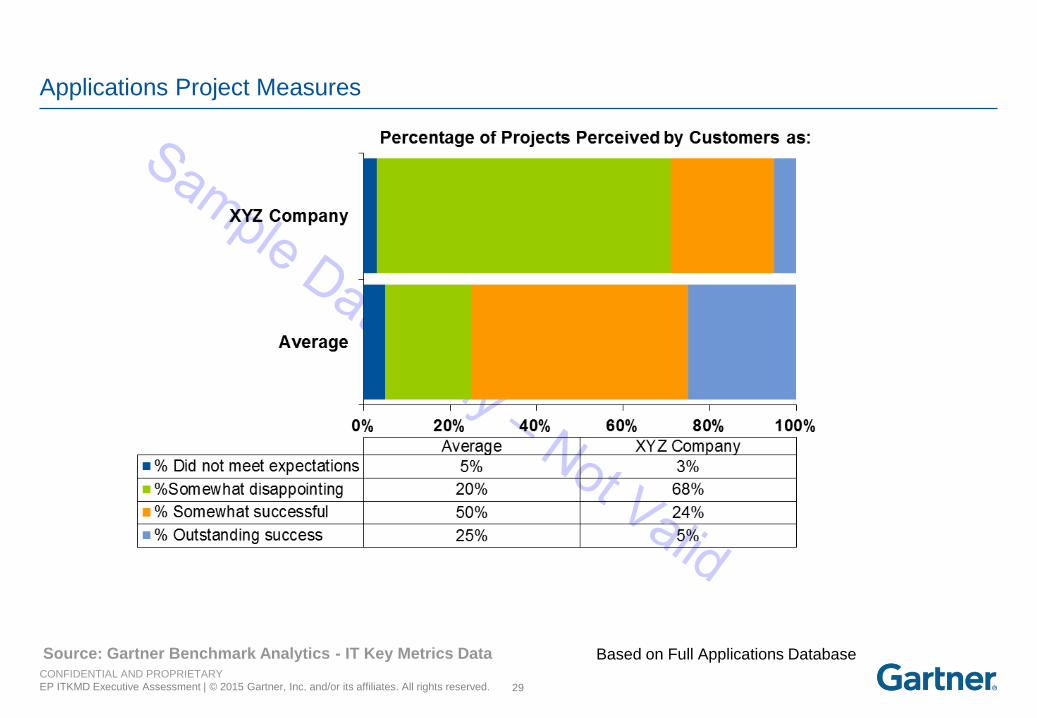
Applications Project Measures
Based on Full Applications Database
CONFIDENTIAL AND PROPRIETARY
EP ITKMD Executive Assessment | © 2015 Gartner, Inc. and/or its affiliates. All rights reserved. 30
Source: Gartner Benchmark Analytics - IT Key Metrics Data
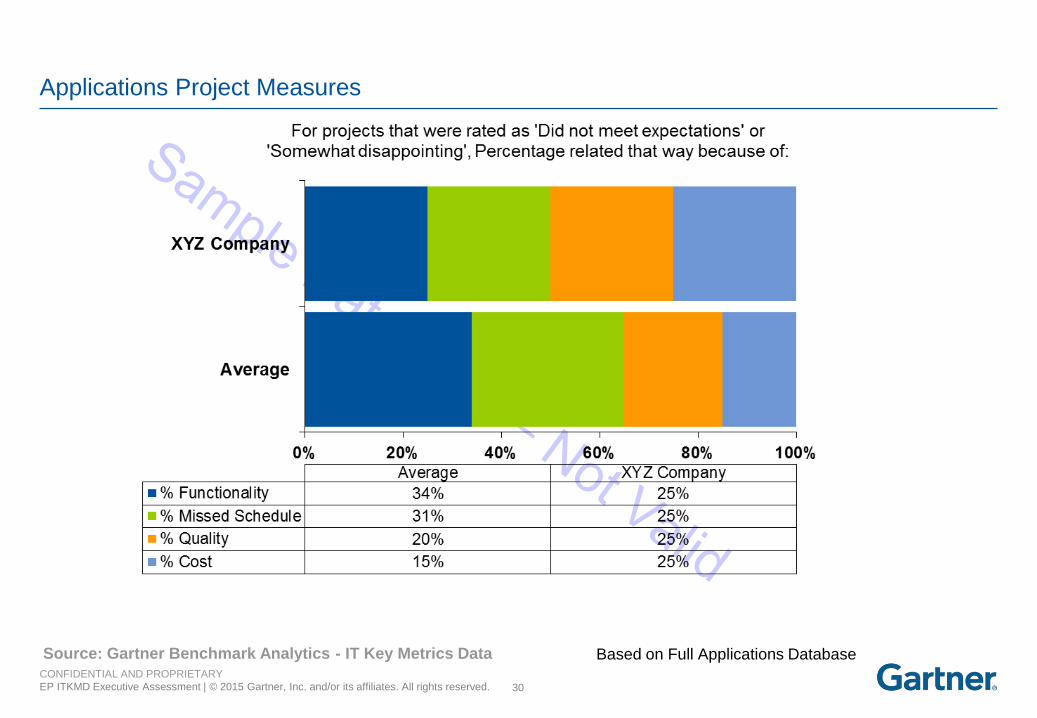
Applications Project Measures
Based on Full Applications Database
CONFIDENTIAL AND PROPRIETARY
EP ITKMD Executive Assessment | © 2015 Gartner, Inc. and/or its affiliates. All rights reserved. 31
Source: Gartner Benchmark Analytics - IT Key Metrics Data
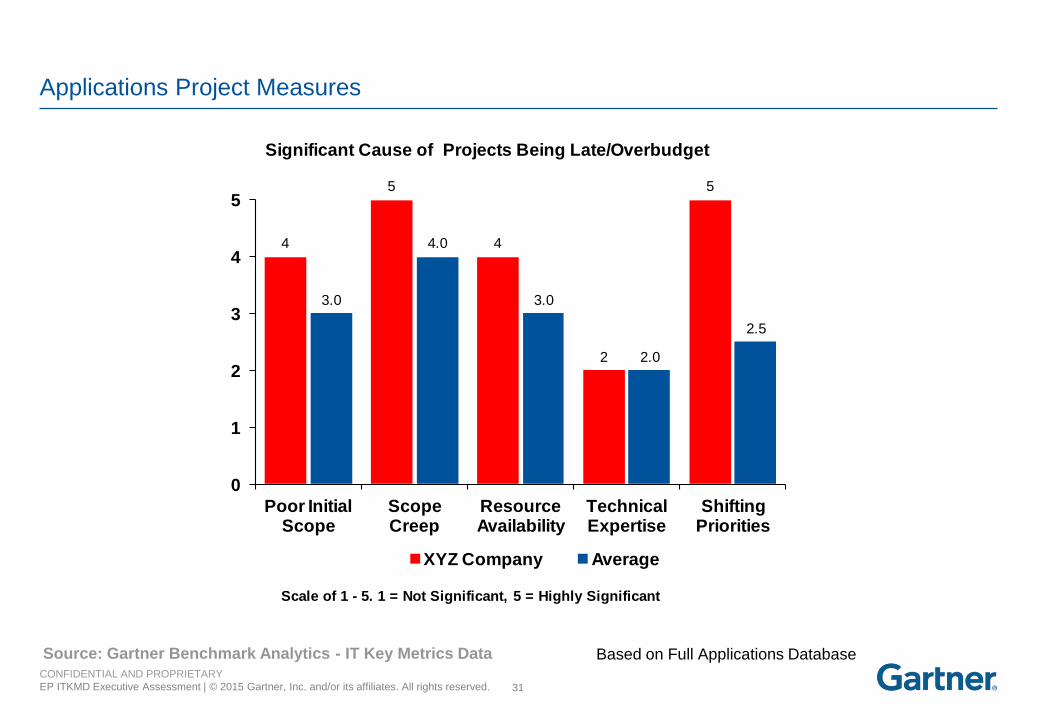
Applications Project Measures
Based on Full Applications Database
4
5
4
2
5
3.0
4.0
3.0
2.0
2.5
0
1
2
3
4
5
Poor Initial Scope
Scope Creep
Resource Availability
Technical Expertise
Shifting Priorities
Significant Cause of Projects Being Late/Overbudget
XYZ Company Average
Scale of 1 - 5. 1 = Not Significant, 5 = Highly Significant
CONFIDENTIAL AND PROPRIETARY
EP ITKMD Executive Assessment | © 2015 Gartner, Inc. and/or its affiliates. All rights reserved. 32
Source: Gartner Benchmark Analytics - IT Key Metrics Data
Information Provided by
Gartner Benchmark Analytics
If you have any questions regarding this report, please contact us at:
[email protected]
To learn more about Gartner Consulting’s Benchmark Analytics solutions,
go to:
gartner.com/benchmarking
or contact us at: [email protected]
To learn more about IT Key Metrics Data please visit our web page on gartner.com
From the “Explore” menu, select the “Metrics & Tools” tab,, then select “IT Key Metrics Data”
Gartner delivers the technology-related
insight necessary for our clients to make the
right decisions, every day.
33