20
EXECU TAX M UTIVE R MANAG RES Novem REPORT EMENT SEARCH mber 15, 20 SUMMA SYSTEM H 013 ARY MS

EXECU
TAX M
UTIVE R
MANAG
RES
Novem
REPORT
EMENT
SEARCH
mber 15, 20
SUMMA
SYSTEM
H
013
ARY
MS
2
TABLE OF CONTENTS
Background Research & Methodology .......................................................................... 3
Executive Summary ....................................................................................................... 4
Section I—General Information .................................................................................... 6
Population of Counties .............................................................................................. 6 Functions Tax Office Provides ................................................................................... 7 Number of Real Property Tax Bills ............................................................................. 8 Number of Personal Property Tax Bills ....................................................................... 9 Amount of Real Property Tax Dollars ....................................................................... 10 Real Property Tax Dollars as Percent of Jurisdiction’s Total Revenue ......................... 10 Changes in the Size of Office Staff ........................................................................... 11 Public Access Over the Internet to Property Tax Information .................................... 12 Tax Transactions on the Internet ............................................................................ 13 Present Tax Management System Integration with Other Offices ............................... 14 County Offices with which Tax Software Management Systems are Integrated ........... 15
Section II—Views on Tax Management Systems ........................................................ 16
Needs a Tax Management System is Required to Meet ............................................. 16 Technology Innovations and Trends of Value .......................................................... 17 Issues of Importance When Selecting a Vendor ...................................................... 18

3
BACKGROUND RESEARCH & METHODOLOGY
Advanced Analytics (AA), a division of Hidalgo & DeVries, Inc., was commissioned to conduct the jointly sponsored, Second Annual Thomson Reuters-National Association of Counties (NACo) Tax Systems Research Study (in association with the National Association of County Collectors, Treasurers and Finance Officers—NACCTFO), amongst tax officials in U.S. counties. On May 21, 2013, a self-administered online questionnaire was emailed to tax officials in counties across the country. The e-mailing database of 3,395 names was generated by NACo. As in last year’s study, a major objective of the research was to investigate the present views and future needs of tax officials, and to compare, where appropriate, 2013 results with those obtained in the 2012 study. The research topics covered both general information descriptive of the processes used, and services offered by the officials’ offices, as well as specifics regarding their views and ratings of various tax systems and their features and benefits. By the cutoff date of June 24, 2013, a total of 230 (6.8% response) questionnaires had been completed online. The information contained in the total number of completed questionnaires, forms the basis for this report. The following information presents a summary analysis of that data. About the Sponsors of this Study Thomson Reuters, the provider of Aumentum Tax—a leading software system in use in jurisdictions across the country—is the world's leading source of intelligent information for governments, businesses, and professionals. Combining industry expertise with innovative technology, we deliver critical information to leading decision makers. Aumentum simplifies the revenue management lifecycle for governments around the world. Our unique combination of technology enhanced by experience enables you to optimize revenue generation, support sustainable growth and improve services to the public. For more information about Aumentum Tax, visit tax.thomsonreuters.com/aumentum The National Association of Counties (NACo) is the only national organization that represents county governments in the United States. Founded in 1935, NACo provides essential services to the nation’s 3,068 counties. NACo advances issues with a unified voice before the federal government, improves the public's understanding of county government, assists counties in finding and sharing innovative solutions through education and research, and provides value-added services to save counties and taxpayers money. For more information about NACo, visit www.naco.org. Research Notes: Specific counties and county official are not identified in this report. E-mail addresses are not, and have not been matched to completed surveys, only recorded in order to provide an Executive Report of findings to all respondents who made such requests. All information is presented in aggregate form, with additional cross-tabs by county population where appropriate.

4
EXECUTIVE SUMMARY A. About the Respondents Size of Counties: Population size of responding counties ranged from less than 10,000 for the smallest responding county to a high of over one million for the largest. When grouped by size according to NACo’s grouping guidelines, responding counties offer a fair representation of the average population range of counties across the United States.
63% of responding counties=populations of <50K compared to 70.5%* nationally 12% of responding counties=populations of 50-100K compared to 12.5%* nationally 13% of responding counties=populations of 100-250K compared to 9.7%* nationally 12% of responding counties=populations of 250K> compared to 7.3%* nationally
*Source NACo
B. General Information Functions Provided: Nine in ten of respondent’s offices are responsible for collection/cashiering (97%) and property tax billing (87%). Seven in ten (73%) are responsible for revenue distribution and personal property tax billing (72%) and six in ten development of tax bills (59%). Property Tax Bills: When measured against the last reporting period, six in ten (57%) of respondents indicated an increase in the number of real property tax bills their office sent, with an average increase of 1.5% for all respondents reporting an increase. And while 38% of respondents reported no change in the number of real property tax bills sent by their offices, only 5% of respondents indicated a decrease which averaged 2.0% for this group. Property Tax Collected: When measured against the last reporting period, more than six in ten (65%) of respondents’ offices indicated an increase in the number of real property tax dollars collected, with an average increase of 2.0% for all respondents. And while 21% of respondents reported no change in the number of real property tax dollars collected by their offices, a low of 14% of respondents indicated a decrease which averaged 2.0% for this group.
Staff Size: When compared to the previous year there was a decrease of 28 basis points in offices reporting staff reductions—12% vs. 40%, with eight in 10 (83%) of respondents’ reporting no change in the size of office staff, and 5% indicating an increase averaging 1.5% FTE’s. The continued trend of decrease of staff reductions which began the previous year, combined with an increase—albeit modest, in hiring point to not only market stabilization, but growth.

5
Access to Data: Eight in ten (80%) of respondents provide access to property tax information over the internet. Of the respondents that allow public access to property tax information over the internet, 82% indicated they allow transactions such as payments of taxes—resulting in an average of 10% of taxes paid over the internet.
Integration with Other Offices: With no change since the last reporting period, more than three quarters (78%) of respondents indicated that their Tax system is integrated with other county office systems—Assessor (86%), Treasurer (68%), GIS (50%), and Auditor (50%).
C. Views on TAX Systems Needs System Must Meet: When ranking the most important jurisdictional needs that a TAX system must meet, the majority (65%) of respondents identified: Improving accuracy of tax bills as their first or second need, followed by improvement on efficiency and productivity of staff (52%), and improving reliability of data (43%).
New Technology: Based on what they believe to be the most valuable technology trends to their offices, respondents ranked Mobile highest at 75%, followed by eGovernment (42%) and Cloud (31%).
Vendor Selection Issues: When ranking the issues that are “Very Important” or “Important” to their jurisdictions when selecting a vendor, all (100%) of respondents ranked support after installation and training quality first, followed by Tax Domain Knowledge and Experience (99%), Conversion Expertise (97%), Periodic System Enhancements Provided (97%), Cost (95%), Leading Edge Technology (90%), and Certified Project Management Expertise (89%).

Populat Six in tenwith 46%the balanof responpopulatio250,000
tion of Coun
n (63%) of r% of those rence indicatedndents reporons above 10(13%), 250,
Se
nties
respondents eporting a pod a populatiorted a popula00K amount,001 to 500,
ection I—G
reported theopulation beon between ation betweeed to almost,000 (5%), a
6
General Info
e populationetween 10,0025,001 and en 50,001 at one fourth and 500,001
ormation
n of their cou01 and 25,050,000. Slignd 100,000, (24%) of a
1 to 2,000,00
unty to be 5000 and less ghtly over on, while counll responden00 (6%).
50,000 or lesthan 10,000
ne in ten (12ties reportin
nts—101,001
ss, 0 and 2%) ng 1 to

TaxDevProPerColRevMotBusSpeTaxOth
Function Nine in teBilling (8Personal Functions(45%), M(22%), a
x Assessmenvelopment ooperty Tax Birsonal Propelection/Cashvenue Distribtor Vehicle Tsiness Tax oecial Assessmx Sales her self-repo
ns Tax Offi
en of respon7%) are funProperty Tas indicated bMotor Vehicleand Taxes As
Fun
nt of Tax Bills illing rty Tax Billin
hiering bution Tags r Licenses ment Tax
orted taxes
ce Provide
ndents indicanctions withiax Billing (72by less than e Tags (26%ssessment (1
nctions Tax
ng
es
ated that Con their office
2%), Developfive out of t
%), other sel17%).
x Office Pro
Less tha50,000
18%52%90%73%95%76%28%23%41%46%20%
7
ollection/Cashes, followed pment of Taten respondef-reported ta
ovides (By C
an 0
50,10
hiering (97%by Revenue
ax Bills (59%ents were Spaxes (23%),
County Pop
,001 to 00,000 19% 57% 82% 79% 93% 71% 19% 10% 38% 57% 29%
%) %) and Pe Distribution
%), and Tax Special Asses, Business T
pulation)
100,000 250,00
13% 87% 93% 83% 100% 70% 30% 26% 57% 65% 26%
Property Taxn (73%), Sales (50%)sment Tax ax or Licens
to 0 25
x
).
ses
50,000+
11% 74% 81% 74% 100% 87% 21% 21% 15% 47% 37%

Les10,25,50,1012505007501,0
Number
More thaby their onumber tless thanthe numbthe numbbetween
ss than 10,00001 to 25, 0001 to 50,00001 to 100,01,001 to 2500,001 to 5000, 001 to 7500,001 to 1,0000,000 +
Increase
Almost siTax bills of 1.5%)sent. Onl
r of Real Pr
an half (55%office duringto be betwee
n 10,000 billsber to be beber of Real P100,001 an
Numb
00 000 00 000 0,000 0,000 0,000 00,000
e vs. Decre
ix in ten (57that their of
), while 38%ly 5% of res
roperty Tax
%) of all respg the last billen 10,001 as sent last bietween 25,00Property Taxd 1,000,000
ber of Real Less than
50,000 37% 43% 20% 1% 0% 0% 0% 0% 0%
ease
%) of respoffice sent du
% of respondespondents in
x Bills
ondents estiing period tond 25,000 willing period.01 and 100,0x bills sent b0+.
Property T 50,00
ondents indicring 2012 bients reportedicated a de
8
imated the no be less tha
with the rema. About four 000. The rem
by their office
Tax bills (B
01 to 100,0
10% 14% 43% 33% 0% 0% 0% 0% 0%
cated an incrilling period ed no changeecrease whic
number of Ran 25,000. Oaining 25% in ten (36%
maining 9% e during the
By County P
000
rease in the compared toe in the numch averaged
Real PropertyOf those, 30indicating th
%) of responof responde
e last billing p
Population)100,000 t
250,0000% 4% 9% 78% 9% 0% 0% 0% 0%
number of o 2011 (an a
mber of real 2.0% for th
y Tax bills se% indicatedhe number tdents indicaents estimatperiod to be
) to 0 25
Real Propertaverage incrproperty tax
his group.
ent the to be ated ted e
50,000+
5% 5% 11% 11% 32% 32% 5% 0% 0%
ty rease x bills

Less1,002, 55,007,5010,0
Number Nearly hanumber o1,000. Thbetween 4% betw
s than 1,000 01 to 2,500 501 to 5,000 01 to 7,500 00 to 10,000 000 +
Increase
Two thirdsent durioffices re
r of Person
alf (48%) ofof personal phe remaining1,001 and 2
ween 7,501 a
Numb
e vs. Decre
ds of offices ng the 2012
eported an a
al Property
f respondentproperty taxg 52% of res2,500, 11% and 10,000.
ber of PersoLess than
50,000 61% 16% 8% 4% 1% 10%
ease
(65%) repo2 billing perioaverage incre
y Tax Bills
ts—a 20% inx bills sent byspondents inbetween 2,5
onal Property
50,0
orted no chaod comparedease of 1.5%
9
ncrease fromy their officendicated the501 and 5,00
y Tax Bills (
01 to 100,0
26% 5% 32% 21% 5% 11%
nge in the nd to the 201
% while 16%
m the previoue for the laste following: 100, 9% betw
(By County P
000 100
number of pe11 billing per% reported a
us year—indt billing perio16% sent ouween 5,001 a
Population)
0,000 to 25
32% 9% 14% 23% 9% 14%
ersonal propriod. Of the b decrease, a
dicated the od are less tut 10,001+, and 7,500, a
0,000 25
perty tax billsbalance, 19%also of 1.5%
than 12%
and
50,000+
16% 0% 11% 11% 11% 53%
s % of
%.

Amount
More thatotal amothe 2011
Real Pro
Increase DecreaseNo Chang
Real Pro
Perc
t of Real Pr
an six in ten ount of Real billing perio
operty Tax
R
e ge
operty Tax
cent of Resp20% 29% 24% 27%
roperty Tax
(65%) of reProperty Ta
od—while 14
Dollars Inc
Real PropeLess th
50,0068%10%22%
Dollars as
pondents
x Dollars Co
espondents’ oax dollars co4% indicated
crease/Dec
erty Tax Dohan 00
5
% % %
Percent of
% of Tota0-265176-
10
ollected
offices indicallected durind a decrease
crease by C
ollars (By C50,001 to 100,000
68% 11% 21%
f Total Cou
al Revenue-25 6-50 -75 -100
ated an increng the 2012 e also averag
County Pop
County Pop100,0
250,572419
nty Revenu
ease averagbilling perio
ging 2%.
pulation
ulation) 000 to ,000 % % %
ue
ging 2% in tod compared
250,000
58% 26% 16%
the d to
+

Changes
When coreportingchange incontinuedan increa
Reasons
AccordingCuts (41%saw an inTechnolo
Increa
No ChangDecreaseIncrease
s in the Siz
mpared to tg staff reductn the size ofd trend of dease—albeit m
s for Chang
g to respond%), Retiremncrease in stogy (29%).
ase/Decrea
ge e
ze of Office
he previous tions—12% f office staff,ecrease of s
modest, in hi
ges in Staff
dents who sament (29%), taff size, the
ase of Size Less t
50,091%7%2%
e Staff
year there wvs. 40%, w
, and 5% indstaff reductioiring point to
f Size
aw a decreaand Use of T
e leading rea
of Office Sthan 000
5
% % %
11
was a decreaith eight in 1dicating an ions which beo not only m
se in staff siTechnology asons were:
Staff During50,000 to 100,000
87% 7% 7%
ase of 28 ba10 (83%) ofncrease aveegan the pre
market stabili
ize, the lead(29%). AccoIncreased W
g 2012(By 100,00
250,058%37%5%
asis points inf respondenteraging 1.5%evious year, ization, but g
ding reasonsording to res
Workload (86
County Po00 to 000 2
% % %
n offices ts’ reporting
% FTE’s. Thecombined wgrowth.
were: Budgspondents w6%) and Use
opulation)
250,000+
68% 16% 16%
no e with
get who e of

Public A
Eight in tover the
Public A
Yes
No
Access Over
ten (79%) ointernet.
Access Ove
r the Intern
f all respond
er the InterLess th
50,0073%
27%
net to Prop
dents’ offices
rnet to Prophan 00
5
%
%
12
perty Tax I
s allow the p
perty Tax I50,001 to 100,000
73%
27%
Information
public to acc
Informatio100,0
250,95
5%
n
cess property
on (By Coun000 to ,000 %
%
y tax inform
nty Populat
250,000
100%
0%
ation
tion)
+
Tax Tran
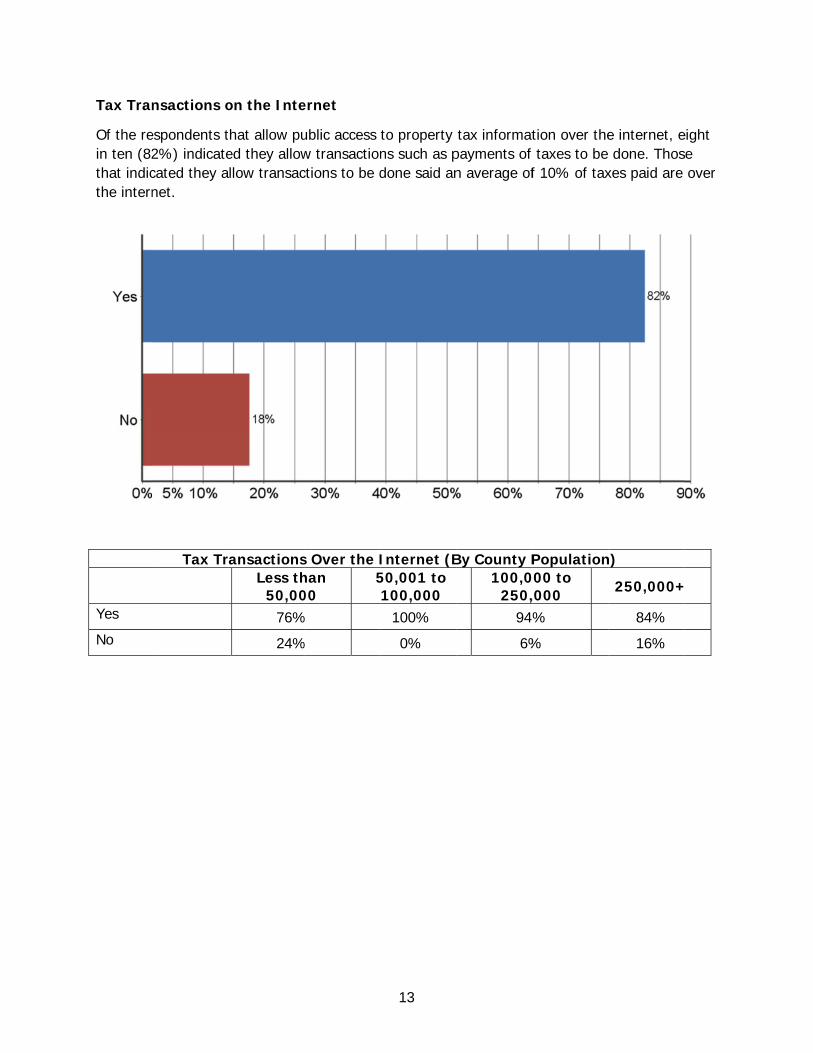
Of the rein ten (82that indicthe intern
Yes
No
nsactions o
espondents t2%) indicatecated they anet.
Tax Tr
on the Inte
that allow pued they allowllow transac
ransactionsLess th
50,0076%
24%
ernet
ublic access w transactionctions to be d
s Over the Ihan 00
5
%
%
13
to property ns such as pdone said an
Internet (B50,001 to 100,000
100%
0%
tax informatpayments of n average of
By County P100,0
250,94
6%
tion over thetaxes to be
f 10% of tax
Population000 to ,000 %
%
e internet, edone. Thos
xes paid are
n)
250,000+
84%
16%
eight se
over
+

Present
Nearly eiother jur
Present
Yes No
Tax Manag
ght in ten (7isdictional of
t Tax Syste
gement Sy
78%) of all rffices.
m IntegratLess than
50,000 82% 18%
ystem Integ
respondents
tion with On 50
10
14
gration wit
indicated th
Other Count0,001 to 00,000 67% 33%
th Other Of
hey have int
ty Offices (100,00
250,079%21%
ffices
tegrated thei
(By County00 to 000 % %
ir TMS with
y Populatio
250,000+
67% 33%
on)

County
Of those with counTreasure
Offices wit
respondentsnty offices, t
er (68%), GI
th which Ta
s that indicathe majority S (50%), an
ax Softwar
ated integrat(86%) said
nd Auditor (5
15
re Managem
ting their pretheir system
50%) followe
ment Syste
esent tax sofm is integrated.
ems are Int
ftware manated with an A
tegrated
agement sysAssessor.
stems
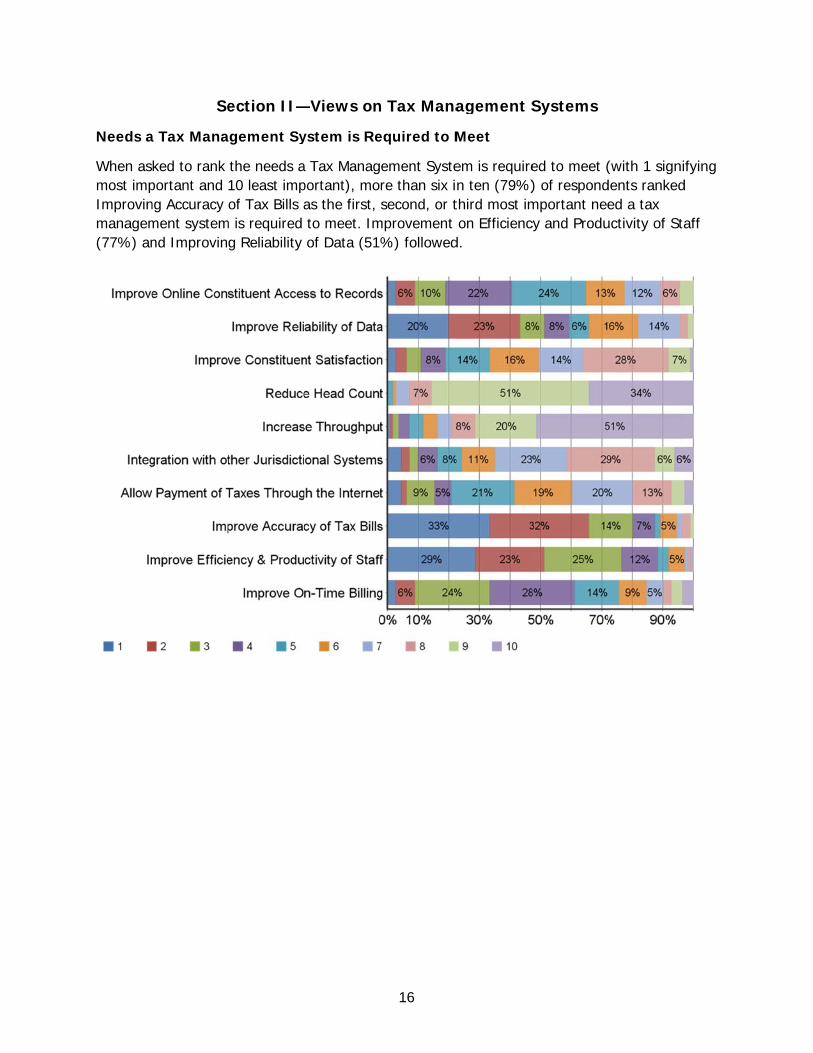
Needs a
When asmost impImprovinmanagem(77%) an
Se
a Tax Mana
ked to rank portant and ng Accuracy ment systemnd Improvin
ection II—
agement Sy
the needs a10 least impof Tax Bills a
m is required g Reliability
—Views on
ystem is Re
a Tax Managportant), moas the first,to meet. Imof Data (51
16
n Tax Mana
equired to M
ement Systere than six isecond, or t
mprovement %) followed
agement S
Meet
em is requiren ten (79%)third most imon Efficienc
d.
Systems
ed to meet () of respondmportant neecy and Produ
(with 1 signidents rankeded a tax uctivity of Sta
fying d
aff

Technol
When asand 10 lefirst, secoand eGov
logy Innova
ked to rank east importaond, or thirdvernment (5
ations and
the most imnt), more th
d most valua51%).
Trends of
mportant techhan eight in able technolo
17
Value
hnology trenten (84%) oogy innovatio
nds (with 1 sof respondenon or trend,
signifying monts ranked M followed by
ost importanMobile as they Cloud (54%
nt e %)

Issues o
Respondemanagemfollowed Periodic Sand Certi
of Importan
ents indicatement systemby Tax DomSystem Enhaified Project
nce When
ed that the km provider armain Knowledancements PManagemen
Selecting a
key issues (Vre: Support Adge and ExpProvided (97nt Expertise
18
a Vendor
Very ImportaAfter Installaperience (997%), Cost (9(89%).
ant or Impoation and Tr%), Convers
95%), Leadin
rtant) when aining Qualision Expertisng Edge Tec
selecting a ty (100%), se (97%), chnology (90
tax
0%),

19
Issues of Importance When Selecting a Vendor (By County Population)
Less than 50,000
50,001 to 100,000
101,001 to 250,000 250,000+
Provides a Scalable System Very Important 27% 42% 23% 19% Important 59% 25% 46% 63% Somewhat Important 11% 33% 23% 19% Not Important 3% 0% 8% 0%
No “Offshoring” of Design and Development Very Important 43% 50% 54% 44% Important 41% 25% 31% 19% Somewhat Important 13% 25% 8% 31% Not Important 3% 0% 8% 6%
Provides Periodic System Enhancements Very Important 64% 358% 69% 63% Important 31% 42% 31% 38% Somewhat Important 3% 0% 0% 0% Not Important 1% 0% 0% 0%
Local Sales/Support Representation Very Important 57% 42% 38% 38% Important 27% 25% 31% 25% Somewhat Important 16% 25% 23% 19% Not Important 0% 8% 8% 19%
Ability to Host Solution Very Important 56% 42% 23% 6% Important 31% 25% 23% 50% Somewhat Important 9% 33% 38% 38% Not Important 4% 0% 15% 6%
Cost Very Important 77% 75% 62% 44% Important 21% 8% 38% 44% Somewhat Important 1% 17% 0% 13% Not Important 0% 0% 0% 0%
Robust Base of Successful Deployments Very Important 37% 42% 54% 56% Important 47% 50% 46% 31% Somewhat Important 14% 8% 0% 13% Not Important 1% 0% 0% 0%

Certified Project Management Expertise Very Important 46% 50% 38% 50% Important 44% 42% 54% 31% Somewhat Important 6% 8% 8% 13% Not Important 4% 0% 0% 6%
Tax Domain Knowledge & Experience Very Important 86% 92% 69% 88% Important 13% 8% 31% 13% Somewhat Important 1% 0% 0% 0% Not Important 0% 0% 0% 0%
Training Quality Very Important 91% 83% 69% 69% Important 9% 17% 31% 31% Somewhat Important 0% 0% 0% 0% Not Important 0% 0% 0% 0%
Conversion Expertise Very Important 79% 75% 85% 75% Important 21% 25% 15% 6% Somewhat Important 0% 0% 0% 19% Not Important 0% 0% 0% 0%
Support After Installation Very Important 94% 83% 92% 94% Important 6% 17% 8% 6% Somewhat Important 0% 0% 0% 0% Not Important 0% 0% 0% 0%
Prior Experience with Your Jurisdiction Very Important 39% 25% 23% 25% Important 34% 8% 23% 38% Somewhat Important 21% 42% 38% 31% Not Important 6% 25% 15% 6%
Local vs. National Presence Very Important 36% 25% 31% 13% Important 36% 17% 23% 44% Somewhat Important 20% 50% 38% 31% Not Important 9% 8% 8% 13%
Leading Edge Technology Very Important 50% 42% 69% 44% Important 39% 50% 23% 50% Somewhat Important 10% 8% 8% 6% Not Important 1% 0% 0% 0%
20


![Architecture Portfolio [2012-2015] Ileana Cristina Balan](https://static.documents.pub/doc/80x56/57906d3c1a28ab68748f1cef/architecture-portfolio-2012-2015-ileana-cristina-balan.jpg)


