I How to Enable Electric Bus Adoption in Cities Worldwide WRIROSSCITIES.ORG HOW TO ENABLE ELECTRIC BUS ADOPTION IN CITIES WORLDWIDE A Guiding Report for City Transit Agencies and Bus Operating Entities XIANGYI LI, CAMRON GORGUINPOUR, RYAN SCLAR, SEBASTIAN CASTELLANOS
Transcript
iHow to Enable Electric Bus Adoption in Cities WorldwideWRIROSSCITIES.ORG
HOW TO ENABLE ELECTRiC BUS ADOPTiON iN CiTiES WORLDWiDE A Guiding Report for City Transit Agencies and Bus Operating Entities
XIANGYI LI, CAMRON GORGUINPOUR, RYAN SCLAR, SEBASTIAN CASTELLANOS
EXECUTIVE SUMMARY
CONTRiBUTORSA number of individuals conducted interviews and were coauthors on the case studies, which serve as the foundation for the report. They include Cristina Albuquerque, Berta Pinheiro, Virginia Tavares, and Eduardo Henrique Siqueira from WRI Brasil for their work on the case studies of Belo Horizonte and Campinas, Brazil, and Bogotá, Colombia; Lulu Xue from WRI China for her work on the case studies of Shenzhen and Zhengzhou, China; Anusha Chitturi and Pawan Mulukutla from WRI India for their work on the case studies of Ahmedabad, Bangalore, and Manali, India; Jone Orbea from WRI Mexico and Ana Alcantara and Rafael Diaz who worked as consultants at WRI Mexico for their work on the case studies of Mexico City, Mexico; Madrid, Spain; Quito, Ecuador; and Santiago, Chile; Celal Tolga Imamoglu and Tugce Uzumoglu from WRI Turkey’s Sustainable Cities Program for their work on the case study of Izmir, Turkey; Gail Jennings, an independent researcher based in Cape Town, South Africa, for her work on the Cape Town case study; and the team from Lucy Partners, a consulting firm based in Addis Ababa, Ethiopia, for their work on the case study of Addis Ababa.
ACKNOWLEDGMENTSThis report was developed under the project “Transitioning to a zero-emission transport world through bus electrification” along with its sister report, Barriers to Adopting Electric Buses. We are grateful for the financial support of Germany’s Federal Ministry for Economic Cooperation and Development (BMZ) for this project.
We would like to express our gratitude to the many people whose ideas and contributions were invaluable to the structure and content of this report. Several staff contributed to its creation. Emma Stewart was instrumental in helping to structure and initiate the report. Our internal reviewers at WRI helped guide the direction of the report: Anne Maassen, Eric Mackres, Michael Westphal, and Lihuan Zhou. We would particularly like to acknowledge Renata Marson, Laura Malaguzzi Valeri, Maria Hart, and Emilia Suarez for their dedication and support in the research and review process. We also thank Emily Matthews and Sarah DeLucia for timely and crucial editorial support. We would like to thank the communications team—Romain Warnault, Jenna Park, Schuyler Null, and Tini Tran—who provided support in editing, graphic design, and outreach.
We would like to thank the following external reviewers, whose expertise in transport electrification were invaluable to the report: Arturo Ardila-Gomez (World Bank), Caroline Watson (C40), Daniel Moser (GIZ), Sudhir Gota (SLoCaT), and Nikola Medimorec (SLoCaT). We are also grateful to the local stakeholders who participated in the case studies research and helped improve the credibility of this report.
The research underpinning this publication also received support from the “Climate Technology Transfer Mechanisms and Networks in Latin America and the Caribbean” project. The project, implemented by the Inter-American Development Bank (IDB) and financed with resources from the Global Environment Facility (GEF), promotes the development and transfer of technologies to contribute to the reduction of greenhouse gas emissions and vulnerability to climate change in Latin America and the Caribbean. The project prioritizes the topics of mitigation and adaptation to climate change in the sectors of energy efficiency and renewable energy, transport, forest monitoring, and resilient agriculture. WRI is the project executing agency for the transport component of the project.
We are pleased to acknowledge our institutional strategic partners, which provide core funding to WRI: Netherlands Ministry of Foreign Affairs, Royal Danish Ministry of Foreign Affairs, and Swedish International Development Cooperation Agency. We are also pleased to acknowledge the Stephen M. Ross Philanthropies for its support of WRI’s Ross Center for Sustainable Cities program.
ABOUT THE AUTHORSXiangyi Li is a research analyst with the Ross Center for Sustainable Cities program at WRi.
1How to Enable Electric Bus Adoption in Cities Worldwide
on track towards sustainability. In case studies of 16 electric bus projects in 16 cities, we analyze different pathways cities have taken toward electric bus adoption, the enabling conditions for success, and common problems.
Based on the observed successes in our case studies and through other literature, we identified common enabling factors, including structured and flexible pilot programs; well-informed and methodical cost-benefit analyses; and actionable and time-bound targets for scaling-up adoption from a small number of buses to entire fleets.
The report utilizes in-depth case studies, clear steps, and illustrative adoption paths, to provide not only a compelling vision of the future, but also a clear pathway to harnessing the air quality, climate, and other benefits of electric buses for a more sustainable future.
The revolution is underway!
Imagining the world in 2030 can be a dangerous thing. But it can also help us plot how to achieve the net-zero carbon world we need to survive. Large-scale electrification is a necessary step down this road, and bus fleets are an opportunity to make an outsized impact on air pollution and greenhouse gas emissions in dense urban environments.
One way to do this is demonstrated by cities like Shenzhen, which have been ambitious and aggressive, adopting large-scale fleets with the help of multiple incentives. Other cities have been more cautious, piloting electric buses but hesitating to scale beyond a few dozen vehicles. Most cities have been holding back, making no immediate plans and no progress toward integrating electric buses into their existing, largely fossil-fuel-based fleets.
Electric buses could pioneer a new age of clean and efficient urban transport and put cities on track toward sustainability. But adoption is not accelerating fast enough for the world to meet transport-related global climate objectives and limit global temperature rise to below 2 degrees Celsius.
Those reading this report – especially transit practitioners, city employees and on-the-ground technical staff – will find practical solutions to adopting electric buses. Its precursor report, Barriers to Adopting Electric Buses, is a high-level document that focuses on the current obstacles to adopting electric buses. In these two sister reports, WRI aims to tackle several pressing questions to help change the trajectory of cities and put them
FOREWORD
Andrew SteerPresident World Resources Institute
Ani DasguptaGlobal Director WRI Ross Center
WRIRossCities.org 2
3How to Enable Electric Bus Adoption in Cities Worldwide
EXECUTiVE SUMMARYElectric buses (e-buses) have zero tailpipe emissions and lower
operational costs, can help cities address local noise and air
quality issues, and reduce greenhouse gas emissions when the
grid is clean enough. However, the process of transitioning to
electric transportation poses many significant challenges that
must be addressed through careful planning and coordination.
This report is based on lessons learned from 16 cities that are
working toward electrifying their bus transit fleets. it provides
background information on e-buses and offers a planning and
implementation framework for cities with varying levels of
experience in e-bus adoption.
WRIRossCities.org 4
It is an exciting time for clean energy technologies, and the transport sector is undergoing a particularly important transformation. As part of this revolution, cities around the world have begun to consider integrating electric buses into their transit fleets. E-buses have been tested and adopted in several major metropolitan areas in the past decade. However, nearly all the cities adopting e-buses are located in China, Europe, and the United States. Challenges exist to expanding the adoption of e-buses around the world, especially in the global South. In general, the barriers lie in three major categories—technological, financial, and institutional—and deal with issues related to vehicles and batteries, operations, and charging infrastructure. However, a systematic review of potential solutions and an adoption framework are seldom provided for cities that need help adopting electric buses.
About This ReportThe aim of this report is to fill in knowledge gaps and provide actionable guidance for transit agencies and bus operating entities to help them overcome the most common and debilitating barriers to e-bus adoption. We analyzed e-bus activities in 16 cities1 as case studies to ensure that all recommendations are rooted in real-world experiences. The case studies were selected to reflect a wide range of geographies and levels of experience in e-bus adoption, with a focus on the global South. The research was completed through a literature review of academic papers and reports, interviews, and on-the-ground gathering of information from primary sources.
We focus on two key questions: What pathways have cities taken toward electric bus adoption? And what are the enabling conditions for electric bus adoption in cities? These questions helped us identify key actions that cities have taken to adopt e-buses under different circumstances.
This report may be read in conjunction with Barriers to Adopting Electric Buses, a sister publication produced by World Resources Institute (WRI). That report, based on the same 16 case study cities, identifies and elaborates on the main barriers that cities face when implementing e-bus projects, especially in the global South. The barriers outlined in that report are meant to serve as cautionary tales, helping officials anticipate the challenges they may face and plan accordingly to avoid costly mistakes.
HIGHLIGHTS
▪ Electric bus adoption projects should be planned and carried out in a thoughtful way. For initial planning and small-scale projects, five steps should be followed: consider the existing policy landscape; conduct an initial analysis to understand costs, benefits, stakeholders, and constraints; plan and launch a structured pilot project; collect local data, update the initial cost-benefit analysis, and explore financing options; and set actionable and time-bound targets for long-term and large-scale adoption.
▪ For the mass adoption of large-scale electric bus projects, at least four components should be considered: formalizing and implementing a long-term infrastructure plan for large-scale electric bus fleets; formalizing and implementing e-bus procurement plans adjusted to city conditions, and financial instruments to reduce costs and risks; providing training to bus operators based on international best practices and local experiences; and planning for the end-of-use of the buses, especially their batteries.
▪ Cities adopting electric buses can be categorized into five development stages, depending on policy readiness and on-the-ground implementation level, and cities may take different actions depending on their development stage to ensure quality adoption and enhancement.
▪ Transit agencies and bus operating entities play a key role in electric bus adoption. They should be actively involved at the planning and analysis stages of a city’s electric bus adoption projects, together with city policymakers and utility companies; be serious about piloting and testing projects, using them as valuable learning tools to improve planning and operation; and consider the long-term environmental and social benefits of clean technology.
5How to Enable Electric Bus Adoption in Cities Worldwide
Different Stages of E-Bus AdoptionBased on city actions taken to date, we developed a categorization system to assess the relative progress made by each of the 16 cities toward mass e-bus adoption. The cities are predominantly from the global South but two cities from the United States and Europe (Philadelphia and Madrid) are also included because their advancement in e-bus adop-tion can provide some useful information for other cities. Specific city-level actions were also categorized as either policy- or implementation-based actions:
▪ POLICY-BASED ACTIONS: The city government has considered or is actively considering specific e-bus policies or adoption targets.
▪ IMPLEMENTATION-BASED ACTIONS: The city (or some operators) has procured and is operating e-buses either as a pilot or as part of its public transit operations.
The extent to which each of the 16 cities has taken concrete policy and/or implementation actions
was evaluated to place each city into one of five categories, called Stages 0 to 4. Cities can use this evaluation system as a guide to determine where they stand in terms of their stage of electric bus adoption.
Solutions to Enable E-Bus Adoption in CitiesTransit agencies and bus operating entities are encouraged to maximize electric bus adoption targets based on local conditions, and to develop a responsible strategy for implementation. This report provides step-by-step guidance to establish and achieve e-bus adoption targets using concrete and diverse real-world experiences. We define nine steps to be taken by stakeholders interested in moving toward full e-bus adoption (Figure ES-1). The first five steps cover initial preparation and planning, and the next four steps address how to scale up to reach mass e-bus adoption.
Source: Authors.
Figure ES-1 | Enabling Factors and Actions in the Planning and Scaled-Up Lifecycle of E-Bus Adoption
PLAN FOR E-BUS ADOPTION MASS E-BUS ADOPTION
Structured pilot Actionable and time-bound targets
Cost-benefit analysis and financing planning Plan for end-of-use of bus
Large-scale adoption
Training on operation and maintenance
Formalize and implement procurement plan
Formalize and implement long-term infrastructure plan
Policy landscape
Initial analysis of costs and benefits, technology,
stakeholders, and constraints
WRIRossCities.org 6
Initial preparation and planning for e-bus adoptionPerhaps the most difficult step toward any bold transformation is making the decision to get started. Information provided in this section is intended to make that decision as easy as possible. Five major steps are described in this report for building an actionable e-bus adoption plan:
1. Consider the policy landscape. Before starting any project, transit agencies and bus operators should review existing policies in the country and city, either supportive of, obstructive to, or indirect to electric bus adoption; analyze the potential impact of their adoption of e-buses; and analyze the potential impact if the policies were to change. City officials who want to increase the e-bus fleet size of the city should also consider the potential to use different policy instruments to incentivize adoption, and coordinate between sectors to facilitate effective policy implementation.
2. Perform an initial analysis. When the project is starting from scratch, questions that arise should be answered based on concrete analysis. It is key for transit agencies and bus operating entities to conduct an initial analysis to understand the following: the total cost of owning electric buses; the environmental and social benefits generally and in the local context; the existing and potential new stakeholders; the constraints of adopting electric buses in the city; and any potential solutions to address the constraints. If cities lack sufficient capacity to conduct any part of this analysis, they can reach out to peers or research institutes for help.
3. Launch a structured pilot project. Cities should avoid “analysis paralysis” by taking action and gaining practical experience. Pilot projects are a low-barrier opportunity for cities to test ideas and learn by doing. A good electric bus pilot project has clear definitions on the scale and timing, specifies the data needed, includes data collection mechanisms, and plans ahead for charging infrastructure regardless of the scale of the current e-bus fleet. In addition, choosing more than one bus model to test can reduce the vulnerability of the project and give more flexibility for the city to adapt to technology upgrades. Lastly, it is important to
have a flexible planning process that takes into account emerging results and lessons learned through trial and error and that supports information sharing and peer learning.
4. Update the cost-benefit analysis and explore financing options. Based on the initial analysis and operational data collected, a more advanced cost-benefit analysis of the project should be conducted. Different financing options should also be researched and analyzed to ensure the electric bus adoption plan will be sustainable over the long term. Considering that transit agencies and bus operating entities normally do not monetize the environmental benefits of reduced pollution from the public transport sector, the results of the cost-benefit analysis and financial analysis may differ, leaving room for innovative financing mechanisms.
5. Set actionable and time-bound targets. Targets are easy to set but hard to follow if they are not analysis-based, actionable, and time-bound. Stakeholders should work together to reduce duplicative efforts or miscommunication and define a reliable electric bus adoption target for the city based on the city’s ambition and information collected. This can also improve the actionability of the project and help ensure the targets are achieved.
Reaching mass e-bus adoptionScaling e-bus implementation is a fundamental challenge to fully adopting e-bus fleets, but is often given too little attention at the outset of an e-bus program. While many cities around the world have successfully initiated e-bus pilot programs, very few2 to date have been able to move e-buses to the mainstream and position them as a substantial percentage of their entire bus fleets. Four major steps are described in this report for expanding the scale and quality of an e-bus fleet:
1. Formalize and implement a long-term infrastructure plan. Charging infrastructure is one of the most important features of electric buses that conventional buses do not share. Having sufficient infrastructure is paramount to the success of large-scale electric bus adoption due to the increased complexity of an e-bus network. A few aspects should be planned ahead by the transit agency and bus operating entity
7How to Enable Electric Bus Adoption in Cities Worldwide
together with the utility and urban planning sectors: creating a site plan to address the reality of land scarcity; analyzing and defining the technical specifications of charging stations; exploring innovative charging mechanisms, such as smart charging; and developing plans to deal with power outages. In addition, infrastructure-related expenses, which are often underestimated, should be carefully evaluated.
2. Formalize and implement an e-bus procurement plan. As e-buses use a relatively new technology with limited operational experience, transit agencies and bus operating entities should integrate the technological uncertainties into formalized procurement plans. Specific technical details should be defined in the procurement plan, which could be customized to assure the public transport service of the city. Since the technology is evolving quickly, future technology advancement should be considered. The procurement models that work for the city should be carefully studied and analyzed and, ideally, should help incentivize electric bus adoption and reduce the costs and risks for bus operating entities.
3. Train bus operators—a necessary but often overlooked step in electric bus adoption. Training can help improve the operation behavior of drivers, increase the
efficiency of buses, extend the life of batteries, and reduce the need for maintenance. These can help decrease the operation and maintenance expenses for the operators
4. Plan for end-of-use for each e-bus. E-bus batteries can be harmful to the environment if they are not handled responsibly at the end of their lifespans. Meanwhile, the residual value of e-bus batteries is poorly defined due to the evolving nature of the technology. This potential environmental harm and economic uncertainty for electric buses requires the transit agency and bus operating entity to carefully craft a responsible retirement plan for each electric bus and explore innovative bus and battery scrappage mechanisms with other stakeholders, especially bus and battery manufacturers, to reduce the total costs and risks. This, in turn, can help incentivize the adoption of electric buses and reduce the negative impacts on the environment.
Recommended Key Actions for Cities at Different Development StagesBased on the enabling conditions identified in our analysis of the 16 case study cities, we recommend that in addition to following our general guidelines for e-bus adoption cities emphasize the key actions described in Figure ES-2.
Figure ES-2 | Key Actions for City Stakeholders at Different Development Stages
STAGE 4STAGE 0 STAGE 1 STAGE 2 STAGE 3
City leadersResearch institutesPublic
City leadersTransit agencies Bus operatorsResearch institutes
Transit agencies Bus operatorsCity leadersUtility companiesResearch institutesPublic
Transit agencies Bus operatorsUtility companiesCity plannersResearch institutes
Transit agencies Bus operatorsResearch institutes
Initiation
Stak
ehol
ders
Key a
ctio
ns
Pilot Breakthrough Scale-up
• Understand local needs• Conduct feasibility analysis
• Develop actionable plans and time-bound targets• Adopt a flexible planning process
• Initiate a well-designed pilot project• Adopt a flexible planning process• Develop long-term plans
• Build a network• Explore innovative and sustainable financial mechanisms
• Evaluate project and improve operation• Increase project replicability
WRIRossCities.org 8
9How to Enable Electric Bus Adoption in Cities Worldwide
iNTRODUCTiONThis report fills in knowledge gaps and provides actionable
guidance for electric bus adoption. it offers a framework that
can be used by cities at all stages of developing e-bus transit,
and is primarily intended for use by transit agencies and bus
operating entities.
WRIRossCities.org 10
It is an exciting time for clean mobility technolo-gies, and the transport sector is undergoing a par-ticularly important transformation. One aspect of this transformation is that cities around the world have begun integrating electric buses (e-buses) into their transit fleets (Li et al. 2018). E-buses reduce local air pollution, limit greenhouse gas emissions, and are typically much quieter and more comfort-able than conventional diesel buses (USDOT 2016). Some cities have already taken bold steps toward the mass adoption of e-buses (SLoCaT 2019), and a few cities—like Shenzhen, China—have already completely transitioned their transit fleets to e-buses (Xinhua News 2017).
Electric buses have been tested and adopted in several major metropolitan areas in the past decade, with a dramatic rise starting in 2014 (BNEF 2018). However, nearly all the cities adopting e-buses are located in China, Europe, and the United States (Figure 1, blue dots) (Li et al. 2018). E-buses have a smaller market share and narrower geographical coverage than other low-emission vehicle technologies, such as hybrid electric buses (Figure 1, orange dots).
Figure 1 | Electric Bus and Hybrid Electric Bus Adoption Worldwide
Note: Blue dots represent e-bus adoption; orange dots represent hybrid electric bus adoption. The data are illustrative of general trends, don’t show the size of the fleet in the city, and are not exhaustive. They were compiled by Li et al. (2018) before October 2016. Currently, more than 99 percent of electric buses are in China; by the end of 2018, cities in india and Latin America had adopted more e-buses than shown on the map (iEA 2018).Source: Li et al. 2018.
Hybrid BusBattery Electric Bus
11How to Enable Electric Bus Adoption in Cities Worldwide
However, the process of transitioning to electric transportation poses many significant challenges. Some difficulties—for example, unavailable financing for vehicles (FSCI 2018), rigid procure-ment models, lack of information—are already relatively well-known. A companion report to this publication, Barriers to Adopting Electric Buses (Sclar et al. 2019), elaborates on these challenges and others that have received less attention, including space limitations at depots, the effects of public perception, and the hidden complexi-ties in planning grid infrastructure. Scaling e-bus operations from pilot routes to mainstream operation presents a slew of challenges, all of which must be addressed through careful plan-ning and coordination. We encourage interested stakeholders to read the Barriers report as part of their preparatory planning for e-bus adoption.
1.1 About This ReportThis report offers a framework that can be used by cities at all stages of developing e-bus
transit. It aims to fill in knowledge gaps and provide actionable guidance for cities to help them overcome the most common and debilitating barriers to e-bus adoption. The report is based on our analysis of e-bus activities in 16 cities (Figure 2). These case studies support the information provided and ensure that all recommendations are rooted in real-world experiences. The case study cities were selected to reflect a wide range of geographies and development stages in e-bus adoption, but the primary focus is on cities in the global South, though cities in China, Europe, and the United States are, in many cases, at a more advanced stage of e-bus adoption. The research involved a literature review of academic papers, reports, city strategic plans, and governmental or corporate websites; interviews conducted with stakeholders; and on-the-ground collection of primary data and operating experiences when quantitative and qualitative information was lacking. A full description of our methodology is provided in Appendix B.
Figure 2 | Distribution of Case Study Cities
Source: Authors.
Stage 0Stage 1Stage 2Stage 3Stage 4
WRIRossCities.org 12
1.2 Limitations of the StudyCities are likely to encounter barriers that this report does not address due to the limited number of case studies in our research. Cities are encouraged to explore innovative options to solve these issues. We anticipate the following challenges could become the focus of further research as we continue to research and develop innovative solutions to the barriers to e-bus adoption:
▪ LAND RIGHTS: Land rights problems are seen in several cities, such as Shenzhen, China, and Campinas, Brazil. They usually arise due to a lack of space to establish new infrastructure (such as charging stations, transformers, and substations). Local situations, such as land prices and ownership, also complicate this problem. Cities should evaluate land acquisition issues before adopting large numbers of e-buses.
▪ UTILITY AND INFRASTRUCTURE: Grid and charging infrastructure are generally important components of e-bus projects that are not well understood by planners and policymakers. While the issue is discussed in this document, more research is needed, together with continuous coordination among infrastructure-related stakeholders.
▪ POTENTIAL BENEFITS AND OBVIOUS COSTS: The environmental benefits of e-buses are not normally monetized or listed in a company’s financial spreadsheet, and they are often neglected or not well-represented when making decisions. City governments and bus operators should calculate the monetized value of avoided pollution due to e-bus adoption, and fully weigh the potential benefits along with the obvious cost and operational factors.
It is also worth mentioning that this report does not aim to provide guidance for how a city, transit agency, or bus operator should choose between different bus technologies; our guidance begins after a city, bus operator, or transit agency has already decided to adopt e-buses, no matter the scale (e.g., pilot test, small-scale operation, or mass-scale adoption). Today’s choices for bus technologies include but are not limited to fossil fuels, such as diesel, gasoline, CNG, or liquefied natural gas (LNG); biogas; and buses using a certain level of electric component, such as hybrid,
plug-in hybrid, trolley bus, fuel cell, or battery electric bus. The bus technology could be chosen before using this document or after piloting different bus technologies, depending on the city’s policymaking process.
A few factors can influence the decision-making process, such as service quality (which is important for bus operators and public satisfaction), technology availability domestically, fuel price, and fuel availability. However, these should not be the only factors that determine the choice of technology. The total cost of ownership (TCO) and environmental impacts of different technologies could also be key considerations. The ways to compare the TCO and environmental benefits of the various technologies are discussed in Sections 2.2 and 2.4 of this report. In addition, based on real-world analysis, factors such as industry development, mayoral determination, future trends, and technology tests may also impact the decision-making process of adopting a certain technology. Therefore, this report does not aim to provide guidance on how to determine which technology to choose or which is the best for a city, but rather on how to start and formalize the adoption of battery electric buses, and encourage users to analyze the pros and cons of electric buses compared with other technologies.
1.3 Structure of the ReportWe developed a methodology to categorize the relative progress made by each of the 16 cities toward mass e-bus adoption. Specific city-level actions were first broadly categorized as either policy- or implementation-based actions:
▪ POLICY-BASED ACTIONS: The city government has considered or is actively considering specific e-bus policies or adoption targets.
▪ IMPLEMENTATION-BASED ACTIONS: The city (or some operators) has procured and is operating e-buses either as a pilot or as part of its public transit operations.
Based on the extent to which each of the 16 cities has taken concrete policy and/or implementation actions, we placed them into one of five categories (called Stages 0–4). The criteria used to determine each city’s stage of action were based on the authors’ experiences in bus procurement and
13How to Enable Electric Bus Adoption in Cities Worldwide
STAGE DEFINITION CASE STUDY CITIES
0 No substantial planning.
▪ There have been no substantial official talks or discussions on e-buses.
▪ No official research has been conducted.
▪ No private parties have been formally contacted regarding providing capital or services for an e-bus program.
▪ There is no actual implementation of an e-bus program.
Addis Ababa, Ethiopia
1 Talks and plans, but no pilot tests.
▪ There have been formal discussions about e-buses.
▪ initial research has been conducted.
▪ initial policies, targets, and/or tenders may have been released.
▪ No e-buses have been tested by the transit agency/operator.
Ahmedabad, india; Bangalore, india; Cape Town, South Africa; Mexico City, Mexico; Quito, Ecuador
2 The city is running an initial pilot program.
▪ E-buses have been procured.
▪ E-buses have been tested (with or without passengers) by the transit agency/operator.
▪ Tests have offered some information on the operational performance of the e-buses (although these data may have severe limitations).
▪ A pilot program is underway, but further expansion has not been planned.
Belo Horizonte, Brazil; Bogotá, Colombia; Madrid, Spain; Manali, india; Philadelphia, United States
3 The city has gone past an initial pilot program.
▪ The city is expanding the number of e-buses and/or starting a second e-bus procurement.
▪ There are plans in place to substantially grow the number of e-buses in the near future.
Campinas, Brazil; izmir, Turkey; Santiago, Chile
4 Mass adoption.
▪ E-buses account for a substantial portion of the municipal bus fleet.
▪ The city is at or approaching its long-term e-bus target.
Shenzhen, China; Zhengzhou, China
implementation projects. Table 1 summarizes the findings and categorization of each city evaluated for this report. Other cities can use this table as a guide to determine their own stage of adoption for electric bus development.
Transit agencies and bus operators play a central role in enabling large-scale e-bus adoption and are the primary audience for this report. The information provided is intended to fill in knowledge gaps especially relevant to these organizations and suggest a program of action on the basis of international experiences.
The next two sections of this report present an enabling strategy comprising two main steps: planning and scaling up. The strategy is designed to enable electric bus adoption from scratch and then to scale up to mass adoption, regardless of the different operational and governance structures that exist in cities around the world. Section 2 (planning) is more applicable to cities that identify with Stages 0, 1, and 2 of e-bus adoption. Section 3 (scaling up) is more applicable to cities that identify with Stages 2, 3, and 4.
Table 1 | Stage of Electric Bus Adoption in the 16 Case Study Cities Based on Actions to Date
Source: Authors.
15How to Enable Electric Bus Adoption in Cities Worldwide
HOW TO PLAN FOR E-BUS ADOPTiONPerhaps the most difficult step toward any bold
transformation is making the decision to get started. The
information in this section is intended to make that decision
as easy as possible. information is organized into five major
steps for building an actionable e-bus adoption plan. These
steps will not necessarily be executed in sequence; the goal
here is to offer a complete view of the actions that should be
taken to successfully prepare for mass e-bus adoption.
WRIRossCities.org 16
2.1. Consider the Policy Landscape
Before starting to plan or implement a project, transit agencies and bus operators should review related national and local policies to assess their potential impact on e-bus adoption. For example, agencies and operators should ask the following questions: What are the supportive and obstructive policies? What policies can be leveraged to make a greater impact? What would the potential consequences be if the policies were to change?
In general, there are three categories of policies to explore:
▪ Policies and targets specifically related to electric buses
▪ Supportive policies and financial assistance programs
▪ Other policies with environmental or economic considerations
A city or country may have specific targets, roadmaps, or plans to create incentives for electric bus adoption (SLoCaT 2019). If the plans are progressive, actionable, and accompanied by supportive policies, they can serve as the most direct enabler for transit agencies and bus operators to proceed. This section provides examples of current national and city policies that may have had a positive impact on e-bus adoption. While not every city will have policies like these in place, they may help city officials think through which policies to look for, and, as appropriate, advocate for.
Transit agencies and other government entities involved in the transportation sector usually have lead responsibility for planning and implementing e-bus projects. Taking stock of the policy landscape can help avoid or overcome institutional barriers related to interagency coordination, financing, and infrastructural requirements. For further information, see Barriers to Adopting Electric Buses.
17How to Enable Electric Bus Adoption in Cities Worldwide
identify policies and targets specifically related to electric busesChina’s Policies and Subsidies for Electric Buses
The Chinese national government began to promote electric bus adoption in 2009 with large demonstration projects and multiple supportive policies (Lu et al. 2018). Many Chinese cities have developed electric bus adoption targets or roadmaps since then. Shenzhen, the most advanced city for electric bus adoption, has set progressive targets since 2009 in line with national policies, and has shown flexibility in adjusting the targets according to technology maturity and adoption status.
For many Chinese cities, national and local policies and incentives play a key role in reducing the up-front procurement cost of electric buses. Before
2016, a 12-meter electric bus could receive a 1 million RMB (US$150,000) government subsidy, which accounted for more than half of the vehicle’s price (Lu et al. 2018). This large subsidy was one of the major drivers for accelerated adoption in Shenzhen.
However, whether subsidies in China can be a sustainable funding source or sustain longer-term adoption of electric vehicles is unknown. In China, the subsidies have been gradually declining since 2017. Compared with 2016, the national subsidy for vehicle procurement was reduced by 20 percent in 2017–18 and will be reduced by a further 40 percent in 2019–20 (Ministry of Finance 2015). As a result, a surge of adoption took place in Shenzhen in 2016 (Figure 3) before the subsidy decreased.
Source: Compiled by the authors, based on information from the Shenzhen Municipal Transport Commission through interviews and desktop research.
Figure 3 | Progress of E-Bus Adoption in Shenzhen
2009
Joined the Thousands of Vehicles, Tens of Pilot Cities (TVTC) projectIssued Shenzhen New Energy Vehicle Promotion Work Plan (2009-2012) with a target of 4,000 new energy buses by 2012
2011Adopted the first electric bus fleet
2012Issued Shenzhen Urban Transport White Paper with a target of 7,000 new energy bus stock by 2015Reduced the target to 4,500 due to technology immaturity
20154,877 electric buses were adopted
2016Targeted 7,700 buses by end of 2016, and 100% electric buses in three years
2017Targeted 100% electric buses by end of 2017Achieved 100% bus electrification with a total of 16,359 e-buses
WRIRossCities.org 18
Although electric vehicle–related subsidies in China are declining (for both buses and passenger vehicles), the country is planning to issue a new credit system called the Parallel Management Regulation for Corporate Average Fuel Consumption and New Energy Vehicle Credits (“Dual Credits”) (Ministry of Industry and Information Technology 2017). Currently, these schemes apply only to passenger vehicle manufacturers as a starting point, with the potential to expand to other modes, such as electric buses. The Dual Credits scheme sets targets for fossil fuel–vehicle fuel efficiency and the percentage of electric vehicles the manufacturers produce, with criteria determining how many credits each manufacturer can earn. The system also establishes how manufacturers can deal with the credits earned, including a platform for manufacturers to trade surplus credits.
FAME Scheme in india
In 2015, India initiated the Faster Adoption and Manufacturing of (Hybrid &) Electric Vehicles (FAME) program (Ministry of Finance 2015) to increase the supply of hybrid and electric buses. FAME also stimulated the demand side with allocated funding to procure hybrid and electric buses. On September 12, 2017, the national Department of Heavy Industry (DHI) amended FAME and increased the demand incentives available for fully-electric buses (DHI 2017). The new incentive scheme (often referred to as “FAME II”) (PTI 2019) includes two levels of subsidies that depend on the percentage of localized production—the percentage of the total cost of bus components that are locally or domestically manufactured (Table 2).
Source: Lu et al. 2018.
Figure 4 | Number of Electric Buses Operating in Shenzhen, 2012–17
277 6971,277
4,877
14,603
16,359
0
2,000
4,000
6,000
8,000
10,000
12,000
14,000
16,000
18,000
2012 2013 2014 2015 2016 2017
Num
ber o
f Veh
icles
19How to Enable Electric Bus Adoption in Cities Worldwide
FAME has initiated the electric bus tendering process in 10 cities3 in India, providing subsidies for 40 electric buses for each city4 with regional
variances. Cities have also developed a few procurement models and financing methods under this national scheme (Table 3).
BUS INCENTIVE LEVEL 1 INCENTIVE LEVEL 2
Fully battery electric bus
if the localized production is between 15 and 34%: Subsidy equals 60% of the procurement cost of a bus or Rs. 85 lakhs (about $120,000), whichever is lower.
if the localized production is 35% or higher: Subsidy equals 60% of the procurement cost of a bus or Rs. 1 crore (about $140,000), whichever is lower.
Table 2 | FAME incentive Scheme for Battery Electric Buses
CITY/REGION
NUMBER OF BUSES
DRIVING FACTORSa KEY PLAYERS FINANCING
Bangalore 80 electric buses
Technology adoption
Department of Heavy industry (central government); Goldstone-BYD (manufacturer); Bangalore Metropolitan Transport Corporation (local operator)
Department of Heavy industry (central government) funding; gross cost contract model proposed
Ahmedabad 100 electric buses (most recent)
Technology adoption
Department of Heavy industry (central government); Ahmedabad Municipal Corporation, AMC (state government)
Originally FAME, but after missing a submission deadline, AMC is now looking to access state government funds
Delhi 1,000 electric buses
Air pollution Supreme Court;High Court of Delhi;Delhi government;Delhi Transport Corporation
No DHi FAME funding—100% state government funding;funded using the Environmental Compensation Charge, a type of green tax collected in the state
Manali-Rohtang Pass
25 electric buses (midibuses)
Ecological conservation
National Green Tribunal;National government (DHi and others); Himachal Pradesh state government; Himachal Road Transport Corporation
75% DHi FAME funding;25% state government funding
Pune 500 electric buses
Technology adoption
State government Not known yet
Kerala 10 in various regions of the state
Technology adoption and ecological conservation
State government Gross cost contract model
Table 3 | Procurement Models Adopted by indian Cities under the FAME Scheme
Note: a. The driving factors section aims to capture only the explicitly mentioned factors the cities considered when adopting e-buses. Hidden factors—such as reduced cost of operation or national subsidies—may exist in cities globally but are not the focus of this table.
Source: Compiled by the authors.
WRIRossCities.org 20
U.S. Federal Transit Administration’s Low or No Emission Vehicle Program
The U.S. Federal Transit Administration (FTA) established the Low or No Emission Vehicle (LoNo) Program as a discretionary funding program that provides capital funding for acquiring low- or zero-emission buses (FTA 2014). In Philadelphia, United States, the transit agency received $2.6 million through this program for electric buses in 2016 (FTA 2015), an amount approved in 2015 and used to purchase 25 Proterra buses. Six other agencies in the country have received funding through the program. In 2018, a new LoNo grant of $1.5 million was offered to Philadelphia’s public transit agency to procure an additional 10 electric buses from New Flyer, as well as associated charging equipment (FTA 2018).
FTA LoNo grants have enabled the adoption of most e-buses currently operating in the United States (FTA 2019). Now, more funding opportunities are slowly becoming available and more test data are being collected from pilot projects. Other general funding for U.S. public transit agencies to procure electric buses comes from the Environmental Protection Agency and state-level energy and environment authorities (Casale and Mahoney 2018).
identify other indirect but supportive policiesAlong with targets and direct subsidies, many other supportive policies and financial assistance programs at the national or local level can accelerate e-bus adoption.
Tax Benefits
In Izmir, Turkey, electric vehicles enjoy signifi-cantly lower private consumption tax (PCT) and motor vehicle tax (MVT) rates, as specified in national law amendments (Resmi Gazete 2011). The PCT is 2–15 percent for electric vehicles and 84 percent for gasoline- and diesel-powered vehicles; the MVT for electric vehicles is 25 percent of that of gasoline- and diesel-powered vehicles—before 2018, there was no MVT for electric vehicles. Even though these benefits were not implemented specifically for e-buses and the rate has increased over time, this example shows one way electric
mobility can be incentivized. In Campinas, Brazil, the city government offers a reduced corporate tax for bus businesses located in the city. This attracted a bus manufacturer to establish a new factory, which largely advanced the development of electric buses in the city and provided on-site support for local bus operators. This latter example shows how potential enablers may not be self-evident from the outset but can prove helpful—in this case by helping to create a local market for e-buses coupled with technical capacity-building.
Environmental Policies
Electric buses have zero tailpipe emissions. They can help reduce urban greenhouse gas (GHG) emis-sions—as long as the electricity grid has a relatively low carbon intensity with more renewable energy generation—as well as other emissions, thereby reducing pollution and improving local air quality in cities. Many environmental policies and targets—such as urban air quality standards, urban emis-sions reduction plans, and climate-related targets in nationally determined contributions under the Paris climate agreement—can serve as enablers for electric bus adoption. The following examples are just a few among many city initiatives.
In Santiago, Chile, one of the reasons the city government decided to consider electric bus adoption was to meet the commitments the country had made under the Paris Agreement and Atmospheric Decontamination Plan to reduce GHG emissions 30 percent below 2007 levels by 2030 (Herrera 2015). In Izmir, the city municipality signed agreements to reduce GHG emissions by at least 20 percent by 2020 (Covenant of Mayors 2016), which led to the establishment of an emissions reduction target for the transport sector. Similar considerations are seen in Shenzhen, China, where tailpipe emissions from vehicles account for nearly 50 percent of particulate matter emissions (PM 2.5) in the city (Guangzhou Daily 2015). More than 20 percent of vehicle carbon dioxide (CO2) emissions come from buses, which account for only 0.5 percent of vehicles in the city (Lu et al. 2018). Thus, bus electrification is a promising way to achieve the city’s environmental targets through a relatively small number of vehicles and transactions.
21How to Enable Electric Bus Adoption in Cities Worldwide
In some cases, e-buses have been adopted to address urgent environmental needs. Located in the Himalayas, the Manali-Rohtang Pass is a major tourist destination and an ecologically sensitive place with a heavy carbon footprint from vehicles. To tackle this issue, the national tribunal for environment-related cases issued an order on February 6, 2014, that put daily restrictions on the number and fuel type of vehicles that can enter this area (National Green Tribunal 2014). This led to the adoption of 25 electric buses to deal with the pollution issues generated by vehicles (The Hindu 2017).
2.2. Perform an Initial Analysis
KEY QUESTIONS THINGS TO CONSIDER
What are the costs and benefits of adopting electric buses in your city?
1. Are electric buses cheaper to procure and operate than traditional buses? Potential data can be collected on annual distance traveled, fuel economy, bus life, residual value, down payment, cost of labor, fuel cost, and maintenance cost, among others.
2. What is the air quality and general environmental quality in your city? 3. What are the environmental benefits of using electric buses in your city compared with
operating the same number of traditional buses? Potential data can be collected on annual distance traveled, fuel economy, bus life, and emissions factors for key air pollutants, such as CO2, nitrogen oxides, sulfur oxides, and particulate matter. Some data may not be available at first, but can be collected during a pilot project, which will be discussed in Section 2.3.
Who are the stakeholders that may potentially be involved?
1. Who are the stakeholders involved in the policy landscape analysis? What are their roles?2. Does the city have any e-bus–related manufacturing facilities? if so, who are the
manufacturers? if not, are diesel buses manufactured in the city or country? if not, from where are they sourced?
3. Who is involved in the utility sector in your city?4. Are there any research institutes or organizations you could ask for help regarding the
latest technology status, and specifically, electric bus adoption? Are there any institutes at the local, national, or international level?
5. What is your current financial or business model? Who is involved?
What is the landscape of existing technology and technical players?
1. Who are the mainstream electric bus and battery manufacturers around the world? What is available in your local market?
2. What are the technical specifics of these available e-bus technologies?3. What are the performance needs in your city for public transit?
What are the key constraints that could delay adoption?
1. What is the grid and utility capacity in your city? Can the capacity carry the extra demand that will result from e-bus adoption?
2. What is the infrastructure construction process in your city, especially regarding electricity network expansion and new depot construction, and what are the related costs?
3. What are the basic land rights regulations in your city? What do you need to do to acquire new land? What are the potential problems and costs to procure new land?
Table 4 | Question Template for initial Analysis of Electric Bus Adoption
Key stakeholders may lack basic information relating to the up-front and long-term cost implications of introducing an e-bus fleet, the range of actors that need to be involved, and the technical performance and requirements of e-buses. Early and thorough analysis will help avoid many pitfalls caused by the knowledge barrier. For further information, see Barriers to Adopting Electric Buses.
Table 4 presents some questions that deserve con-sideration before moving forward with the adoption of e-buses. The list is not exhaustive but can help initiate the analytical process.
Detailed guidance on how to conduct the initial analysis, which can be used to help answer these questions, is provided in this section.
Understand the costs and benefits of e-busesAnalyzing the costs of e-buses compared with those of conventional buses requires considering the buses’ total cost of ownership (TCO). TCO refers to the overall costs of procuring and operating a bus over its useful lifespan, and is a reasonable metric to compare the costs of different bus technologies. Usually, it is presented in the form of present value (PV) to capture the time value of money using a discount rate (Cooper et al. 2019). TCO generally includes two components: capital expenditure (CapEx) and operational expenditure (OpEx) (Cooper et al. 2019). CapEx includes the procurement costs (including financial cost of buses) and OpEx includes operational and maintenance (O&M) costs, labor costs (details may differ by place), fuel costs, and regular maintenance costs (e.g., for body, tires, engine).
Under some conditions, infrastructure-related costs may be considered capital expenditures
for the transit agency or bus operator, if it needs to pay for the additional infrastructure needed to accommodate the new buses. For example, conventional buses (except for some natural gas buses) may not need specific fueling equipment on-site. But most electric buses benefit from having charging facilities established in the depot (as in Shenzhen) as they help save time and energy and increase the useful range per charge since trips to charge at public charging facilities are not needed. Whether the bus operator needs to pay for the additional cost of installing charging facilities depends on the specific business model used (see Section 3.2) and the charging pattern. Therefore, infrastructure-related costs may be part of the TCO for bus operators if they need to install the charging facilities at their own cost. Another example is the potential road and pavement requirement for buses—especially low-floor buses, which require higher-quality pavement—to reduce damage on the bus body. If bus operators need to contribute to this type of infrastructure, it should be included in the TCO analysis as well.
The benefits of electric buses can come from either a reduced cost of ownership or reduced emissions (local air pollutants and GHGs). In the case of Izmir, the operating costs for 20 e-buses led to an 84 percent reduction in fuel costs and a 60 percent
23
reduction in total maintenance costs5 relative to conventional buses. Izmir’s use of a solar power plant to provide electricity to charge the buses has resulted an annual avoidance of around 420 tons of CO2 emissions. In Shenzhen, the TCO over eight years (including bus procurement cost, CapEx, fuel cost, and OpEx maintenance costs) for e-buses in 2016 was almost the same as a diesel bus’s TCO (Lu et al. 2018). And according to the Shenzhen munici-pal transport bureau (Shenzhen Transport Bureau 2017), switching to e-buses could result in 62.4 tons of CO2 reduction per bus, which could lead to about one million tons of CO2 reduction annually.
For the comparison between e-buses and other types of buses to be valid, they should have similar characteristics. For example, the buses compared could have the same physical specifications, such as seat configuration, door and window arrangements, and suspension systems. Some existing e-bus mod-els have fewer seats and heavier weights due to the batteries. It is important to consider the impact of these features. Also, if it is hard to get these physi-cal specifications comparable (e.g., given the fewer seats on e-buses), the public transit services should be held at the same level, such as total vehicle kilometers traveled, passenger load profiles, and the features of the bus route.
In practice, because bus procurement involves significant initial capital investment and the costs and environmental benefits are highly localized, the environmental benefits are not usually monetized. However, the costs and benefits of technology conversion should be carefully evaluated before initiating the procurement.
Fortunately, tools exist to make cost-benefit analyses easier. For example, WRI is working with the support of FedEx6 philanthropic grants to develop and validate a tool (Cooper et al. 2019) that allows transit bus operators to compare the total cost of ownership and environmental benefits (in terms of emissions reduction) for multiple bus technologies, including e-buses. Inputs of the tool include fleet-specific, O&M, and emissions-related data, among others. Outputs of the tool are the costs and emissions of different bus technology combinations. The full list of input variables (all are not necessarily required) can be seen in Figure 5. Figure 6 illustrates one possible result of the tool, which can compare the unit cost and emissions for a certain bus type based on local operating data. When agencies or bus operators are considering fleet upgrades to achieve certain emissions reductions, they can use the tool to compare the costs and emissions reductions of different combinations of bus technologies, including e-buses.7
WRIRossCities.org 24
Source: Cooper et al. 2019.
Figure 5 | Sample input Variables for WRi’s Costs and Emissions Appraisal Tool for Transit Buses
Graphical Summary(By fleet and by bus type)
Detailed Output
Cost Output
INPUTS
General Economic Data• Country• Discount rate (%)
Fleet-Specific Data• Fuel type, technology
• Number of buses
• Annual (individual) bus distance traveled (km/year/bus)
• Bus life (years)
• Bus length (m)
• Final purchase price for a single bus ($/bus)
• Residual value (% of final purchase price)
• Down payment (% of total cost)
• Loan interest rate (%)
• Loan lifetime (years)
Overhaul Data• Engine overhaul ($/bus); frequency (years)
• Transmission overhaul ($/bus); frequency (years)
• CNG fuel system overhaul ($/bus); frequency (years)
• Hybrid system overhaul ($/bus); frequency (years)
• Battery replacement ($/bus); frequency (years)
• Vehicle retrofits ($/bus); frequency (years)
Infrastructure Data• Depot/fuel station construction ($); bus quantity
• Depot/fuel station retrofit($); bus quantity
• Special tools ($); bus quantity
Emissions Data• CO exhaust (g/km)
• THC exhaust (g/km)
• NOx exhaust (g/km)
• PM exhaust (g/km)
• CO2 exhaust (g/km)
• GHG/ CO2e exhaust (g/km)
• Upstream CO2 (g/km)
• Upstream PM (g/km)
Operations/Maintenance Data• Total cost of driver labor ($/year/bus)
• Fuel economy (L/100 km)
• Fuel cost ($/L)
• Fuel cost projection (%/year)
• Fuel station operation costs ($/y)
• Insurance ($/year/bus)
• Additional operational costs to include ($/year/bus)
• Fixed annual maintenance costs ($/year/bus)
• Total cost of maintenance labor ($/year/bus)
• Brake reline ($/bus); frequency (years)
• Tires ($/bus); frequency (years)
• Battery conditioning ($/bus); frequency (years)
• DPF cleaning ($/bus); frequency (years)
• Fuel station maintenance ($/bus); frequency (years)
• Additional maintenance costs to include ($/year/bus)
Emissions Output
Operational Costs
Capital and Financing
Costs
An analysis of the TCO and environmental benefits is a necessary part of the initial project scoping process, and a more detailed discussion is included in Section 2.4. This report encourages agencies and operators to use pilot projects as an opportunity to collect data that can be used to update the initial
analysis, thus providing more useful information for project implementation. In addition, an initial financial feasibility analysis and plan should be done based on an analysis of costs, benefits, and the policy landscape to understand the potential need for financing and prepare for future planning.
25How to Enable Electric Bus Adoption in Cities Worldwide
identify stakeholdersTransit agencies and bus operators play a key role in electric bus adoption in cities, but their influence and capacity are typically not sufficient to implement an entire project alone. Enabling measures such as national guiding policies, supportive financial regulations, and city-level strategies for electric vehicle adoption led by other stakeholders can all be helpful. But it is important to identify potential stakeholders early, and to proactively work to establish collaborative relationships that will last for the duration of the project (Buckingham et al. 2018).
Stakeholders are parties with an interest in the project. They may be government officials and
experts in sectors such as transportation, electricity, and urban planning with responsibility for differ-ent aspects of an e-bus project. Other stakeholders may be parties directly affected by the project, such as passengers and landowners. Because stakehold-ers may have different opinions, all voices must be heard at an early stage and potential conflicts resolved or at least addressed. The pathway for engagement will be specific to each city, but stake-holder engagement should always be a part of e-bus strategies and action plans.
Some of the stakeholder groups most likely to be involved in electric bus planning and adoption are shown in Figure 7.
Source: Cooper et al. 2019.
Figure 6 | Sample Output Graphic from WRi’s Costs and Emissions Appraisal Tool for Transit Buses
0
200
400
600
800
1,000
1,200
1,400
0.00 0.50 1.00 1.50 2.00 2.50 3.00 3.50
Exha
ust C
O 2(G
/km
/bus
)
Unit Annual Cost ($/km/bus)
Exhaust Co2Vs. Cost
Bus type 1 Bus type 2 Bus type 3 Bus type 4 Bus type 5 Bus type 6
WRIRossCities.org 26
Primary stakeholders:
▪ City leaders, who are responsible for making policies, developing city-level adoption strategies, and allocating financial budgets. They may work in sectors ranging from trade and industry to environment or energy.
▪ City planners, especially the land use planners or land development agency in the city, who oversee the planning of urban infrastructure.
▪ Transit agencies and bus operators, which provide public transport services, procure and operate electric buses, and determine public transit operations in the city.
▪ Utility companies, which are in charge of planning city power distribution and constructing facilities.
▪ The public, who use the e-buses and are critical players because public opinion can affect the success of an e-bus project.
Source: Authors.
Figure 7 | Major Stakeholders Who Are Likely to Be involved in Electric Bus Adoption
27How to Enable Electric Bus Adoption in Cities Worldwide
Secondary stakeholders:
▪ Officials at the national, state, provincial, and regional level, who regulate the e-bus industry and may develop supportive policies for electric bus adoption. They may work in different sectors, such as trade and industry, environment, or energy.
▪ Manufacturers, which produce electric buses including batteries (Box 1).
▪ Financiers, who are responsible for providing funding and financial products for bus procurement. They may already be involved in
procuring diesel buses or new players in the field.
▪ Charging infrastructure and service providers, which are involved in the construction, operation, and maintenance of the e-bus charging facilities. The role can be shared with other stakeholders in some cases.
Tertiary stakeholders: This category includes other stakeholders who are involved in, are influenced by, or may impact electric bus adoption projects.
Manufacturers have played an important role where e-bus technology has been introduced in cities with limited knowledge of and experience in e-bus adoption. For example, in Shenzhen, Izmir, and Campinas, manufacturers were actively involved in promoting e-bus adoption and offered assistance to the transit agencies and operators. However, cities should
BOX 1 | The Role of Manufacturers
conduct independent research to determine the full range of supplier options. More than 30 companies worldwide now manufacture e-buses, though many have limited production and distribution capacities. City officials who are uncertain about procurement decisions can find suggestions on how to find help in Section 2.2 of this report.
Table B-1 | Top 10 Manufacturers of E-Buses Based on Estimated Total Number of E-Buses Produced
MANUFACTURER ESTIMATED UNITS SOLD PRIMARY MARKET(S)
Yutong 35,000 China
BYD 20,631 China and International
Zhongtong 20,000 China
Solaris 103 Europe
Proterra 100 North America
Optare 82 Europe
VDL Bus and Coach 67 Europe
Volvo Bus 50 Europe
Van Hool 40 Europe
Bolloré Group 23 Europe
Source: BNEF 2018.
Engage with stakeholdersEffective stakeholder coordination and cooperation can leverage different expertises, improve communication and efficiency, and avoid duplication of efforts. Electric bus adoption is not simply a matter for transit agencies, and it requires interdisciplinary knowledge. For example, many of our case study cities identified infrastructure concerns as a key area of need for interdisciplinary collaboration:
▪ GRID CAPACITY: Power generation, distribution networks, distribution planning, and related capacity to build, operate, and maintain the facilities, including charging stations, need to be understood. Charging mechanisms are more centralized for e-buses than for private vehicles (e.g., in Addis Ababa, Ethiopia; Belo Horizonte, Brazil; Campinas; Bangalore; Zhengzhou, China), but they can present challenges of land or space availability. Potential stakeholders may include bus operators, manufacturers of charging facilities, utility companies, urban planners, and city and regional officials in charge of power generation planning and city electricity bills. City government and utility companies need to be involved; in some cities, state or provincial governments or power generating companies may also be involved.
▪ INFRASTRUCTURE CONSTRUCTION: Officials need to be knowledgeable about what types of permitting and planning are required and how much the overall construction of charging facilities will cost (Philadelphia and Shenzhen, for example, encountered high charging facility costs and land permitting problems). Potential stakeholders may include bus operators, city planners, city officials in charge of urban planning and construction, and manufacturers of charging facilities. Sometimes research institutes can help with related research.
▪ LAND RIGHTS: Charging infrastructure is a permanent physical installation. However, bus depots and terminals are sometimes leased by the bus operators, and land is usually a scarce resource in urban areas. The high price of land in urban centers and complicated regulatory structures may also exacerbate this issue, as was noted in Shenzhen, Campinas, and Philadelphia. Landowners or city officials may want to use the land for other more valuable purposes than charging e-buses. Potential stakeholders involved may include bus operators, city officials, and landowners, among others.
In general, it is important to convene all stakeholders and encourage direct communication.
29How to Enable Electric Bus Adoption in Cities Worldwide
This happened in Santiago and Belo Horizonte, where before the actual implementation of electric buses, stakeholders from all sectors were invited to attend a workshop. During the workshop, stakeholders such as utility companies, bus operating agencies, and government institutions shared their perspectives and considerations for the electric bus project. This limited the potential for dissent and resulted in comprehensive project plans. Some additional examples of effective stakeholder coordination and cooperation are briefly described below.
Manufacturer – Operator – Manufacturer
In Shenzhen, the close cooperation between operators and manufacturers led to important technology improvements (Box 1). Operators provided continuous feedback and suggestions to manufacturers, and manufacturers adjusted the technology according to the needs of the operators. This generated a virtuous cycle of technological improvement; however, it required prolonged dedication from both stakeholders and close physical proximity. Close relations between manufacturers and operators, usually the two most prominent parties in developing e-bus projects, is important. Information needs to be fully shared and requirements clearly communicated. However, the interests of the two parties do not need to fully overlap and the objectivity of manufacturers should be carefully observed and considered throughout the project development process.
Utility – Manufacturer – Operator
Utility companies are indispensable in provid-ing a robust charging network and potential price incentives for electric buses (Fitzgerald et al. 2016). If these typically heavily regulated monopolies are properly incentivized and well-coordinated with other stakeholders, adoption may be accelerated.
In Santiago, the utility company took the lead in supporting the adoption of electric buses along with the transit agency and bus operators. It analyzed grid capacity and worked with the manufacturer and operators to test the technology. The utility company also provided expertise to help with electrical grid issues during the procurement process. With the active involvement of the utility
company and well-coordinated communications, Santiago has advanced in the adoption process.
Electric vehicles may also benefit the utility by providing an opportunity to develop a cleaner, more resilient, and more profitable grid (Fitzgerald et al. 2016). If electric vehicles’ charging patterns are smartly controlled, they can help flatten the peaks and fill in the troughs of demand on the power grid. This may help reduce the unit cost of electricity and avoid unnecessary investment in power generation to meet peak demand. Also, for those utility companies with flatlining loads, electric vehicles can provide extra demand and increase revenue. These factors can help incentivize utility companies to be proactive in the electric vehicle adoption process.
Consider key constraintsCost is an obvious constraint on the mass adoption of e-buses but there are many other factors that can limit a city’s ambitions. A few examples are provided here.
Grid Capacity
Mass adoption of electric buses increases a city’s demand for electricity. A typical e-bus has a battery capacity of approximately 300 kilowatt hours (kwh). This is a large load but likely not debilitating. However, at scales of hundreds or thousands of e-buses, the cumulative electricity requirements can account for a large portion of that of an entire city. For example, assuming on average each city has one bus per 1,000 people (PPIAF 2006) and that the current bus fleet is fully electrified, the electricity consumption of a whole e-bus fleet roughly equals 14 percent of the electricity consumption of a lower-middle-income city, 5 percent of that of a middle-income city, 3 percent of that of an upper-middle-income city, and 1 percent of that of a high-income city.8 The per capita electricity consumption of different cities is based on IEA categories (IEA 2014). Similar studies with more localized models and data can be found and they confirm the results of this estimation. For example, in Singapore, a fully electrified bus fleet requires around 1.4 gigawatt hours per day, which accounts for about 1 percent of Singapore’s daily electricity demand (Gallet et al. 2018).
WRIRossCities.org 30
Ensuring a stable grid with sufficient capacity to support e-bus charging is a prerequisite through all phases of e-bus adoption. Some key questions to consider regarding grid infrastructure are as follows:
▪ Generation and transmission capacity: Do the power plants and electricity transmission networks supporting the city have sufficient capacity to support the increased load from various degrees of e-bus adoption?
▪ Distribution network quality and capacity: At the locations where the e-buses are expected to be charged, what electrical infrastructure (e.g., distribution transformers, substations) must be upgraded to support anticipated daily charging needs? How much do these upgrades cost?
▪ Smart charging: Are there systems and processes that can be put in place to manage charging as a means of minimizing infrastructure expenses and/or operating costs?
▪ Future planning: What work can be done now to minimize future infrastructure expenses and operational challenges as e-bus adoption reaches a mass scale?
In Campinas, transit officials determined that one of the most important first steps was upgrading the bus depots with charging facilities. This required coordinating with local utility companies to analyze the capability of the grid and whether upgrades or maintenance were needed. By focusing on this issue early, they were able to avoid significant future delays. They also established a clear structure of actions and responsibilities between those organizations responsible for vehicles and those responsible for infrastructure, which is a common impediment to successful completion of e-bus projects.
Similarly, in Santiago a combination of a grid capacity analysis (utility company), pilot test (operator), route selection analysis (consulting institute), and determination of business and service models (with the manufacturer) were conducted jointly (Orbea 2018). These careful actions increased the confidence and preparedness of local stakeholders and led to more ambitious adoption targets.
Procurement and Financial Management Rules
A more detailed description of procurement considerations is provided in Section 3.2 as these issues tend to be more relevant to large-scale adoption. However, even smaller procurements will face similar challenges. Traditional bus procurement models often consider up-front cost as a key factor, rather than the buses’ total cost of ownership. This does not encourage the adoption of electric buses, which have a much higher up-front cost than diesel buses but a comparable total cost of ownership. In Latin America and South Africa, for example, competitive tendering is often used for electric bus adoption, which can incentivize market competition and result in a lower cost for high-quality delivery. However, this mechanism enables diesel buses to tender a lower bid and win the contract. If e-buses are to win bids and achieve widespread adoption, traditional bus procurement models need to consider the buses’ total cost of ownership.
Bus procurement models also need to include a mechanism to manage the risks and uncertainties of electric buses as a new technology (Li et al. 2018). In some cases, financial leasing and operational leasing mechanisms have been applied when adopting electric buses (see the Shenzhen example in Section 3.2). Financial leasing mechanisms can reduce costs for bus operators, which do not need to pay the up-front cost and have the flexibility to procure the asset at the end of the leasing period. Operators make regular payments to lessors, and lessors might receive a tax benefit if the buses are recorded as an asset on their balance sheets (instead of on those of the operators).9
Find helpCities can find financial and other support when they lack sufficient capacity to launch their own e-bus projects. They should review existing supportive policies, projects, or subsidies, as explained in Section 2.1. Other stakeholders, such as utility companies or other transit agencies in similar cities, may have resources and experience with e-bus adoption.
31How to Enable Electric Bus Adoption in Cities Worldwide
Cities can reach out to research entities and third parties, such as universities, research institutes, think tanks, and the research branch of development organizations, to learn more about the latest technologies and practical experiences with e-bus adoption. These entities and organizations can be local, national, or even international. For example, technical support from international organizations and research institutes (GIZ, National Renewable Energy Laboratory, C40 Cities Climate Leadership Group) helped Mexico City, Mexico, start its initial pilot project and conduct technical feasibility analysis, together with local stakeholders, on Metrobús Línea 4 and Eje 8 Sur corridor (Valdez 2016; C40 Cities Finance Facility 2017). These activities can help enhance the city’s understanding of the status of technology, local operational conditions for e-buses, and routes that are best suited to e-bus performance. Cities like Santiago and Belo Horizonte successfully convened all stakeholders and initiated conversations with the help of international organizations (WRI, the United Nations Environment Programme, Centro Mario Molina Chile). These activities catalyzed policy discussions in the city around the topic and provided a more objective perspective for e-bus adoption.
International development funds or multilateral development banks may be sources of additional funding, which can help cities in developing countries initiate the adoption of clean technology, and possibly attract more finance from other sectors. For example, when adopting hybrid electric buses in Bogotá, Colombia, a concessional loan program was put in place with initial funding from the Clean Technology Fund. This amount was matched by Colombia’s national development bank (Bancoldex), and jointly distributed to commercial banks and bus operating companies.
2.3. Launch a Structured Pilot Project
Pilot projects offer a relatively low-barrier opportunity for cities to learn by doing and explore new mechanisms of adoption. Cities that have been most successful in adopting e-buses have used pilot projects to gather targeted information to support broader adoption.
The term “analysis paralysis” refers to a situation where a group is so concerned with studying a problem that it fails to take action. This is a common challenge when adopting any new technology, including e-buses. A well-conducted analysis can help in developing better projects, but practical experience is essential to success.
This section provides a basic framework for structuring a useful pilot program, while offering examples from around the world.
Define the scale and timing of the pilot projectPilot projects can involve a single e-bus or several. Generally, the number of manufacturers and buses to be evaluated depends on available funding. Manufacturers sometimes provide e-buses at no cost to cities specifically for this purpose, which can be helpful. However, there are costs associated with installing charging infrastructure, collecting data, and running operations that should also be considered. Even if it is feasible to obtain only one e-bus, a structured pilot project can provide essential information in crafting a successful e-bus adoption strategy.
Another key parameter is timing. A pilot project should typically last no more than two years to ensure that momentum is maintained toward broader implementation. In some cases, an iterative process may be prudent to address any unexpected outcomes of an original pilot effort. This may prolong the pilot period but it should not be allowed to continue indefinitely; establishing a final deadline is advisable. Similarly, the time required to plan and execute procurement of the e-buses and associated infrastructure can also be time consuming and subject to unexpected delays. For example, Philadelphia ordered 25 e-buses for its initial pilot but a late update to the vehicle specifications delayed operations by six months. Cape Town, South Africa, ordered 11 e-buses for its initial pilot, amid much media interest and publicity. However, the program is on hold pending
Transit agencies and other entities interested in starting an e-bus project face many uncertainties concerning technological requirements and performance, financing, and institutional responsibilities and capacities. Lack of specific data can inhibit project initiation or compromise its chances of success. For further information, see Barriers to Adopting Electric Buses.
WRIRossCities.org 32
legal investigation into accusations of corruption and misadministration. These types of prolonged processes can diminish enthusiasm, so it is generally advisable to plan for other analyses and outreach activities in parallel with the procurement process.
Define information needsSome parameters will be of interest to all prospective e-bus operators:
▪ Range – including variations based on route, passenger load, and temperature
▪ Vehicle Availability Rate – including availability limitations due to maintenance, repair, and charging infrastructure unavailability
▪ Charging Time and Energy Consumption – including variations based on temperature and charging station capabilities
▪ Driver and Customer Satisfaction – factors related to noise, comfort, and air quality
In addition to these general data parameters, pilot efforts should consider city- and location-specific information that could impact the project. For example, e-bus operators in Campinas found that their buses were not equipped to drive on poorly paved roads. To minimize weight, the bus manufacturers used aluminum for the bus
body, which resulted in cracks when operating on rough roads. In Bogotá, the operators procured vehicles with ruggedized suspension systems, which proved very uncomfortable for drivers and passengers. Enhanced suspension systems are now part of the technical requirements for tenders in these locations and the world benefits from the knowledge gained through their experiences. In Cape Town, passenger safety and public acceptability are important factors to consider under local conditions. In the past, arson and vandalism of trains and buses have cost the city millions of dollars. This risk has been key in considering e-bus routes and charging locations. Future pilot projects should consider these types of location-specific factors and incorporate them into an overarching plan.
Define how information will be collected and evaluatedIt is imperative to gather pilot project information in ways that ensure that appropriate and actionable conclusions are drawn. A robust testing plan for e-buses will evaluate their performance in different terrains, with different passenger loads, and under different road and weather conditions. The easiest way to test against these varying conditions is to operate the e-buses across multiple routes and compare the results.
33
Izmir is an excellent example of a city that implemented a highly structured testing procedure for evaluating e-buses across multiple routes. The public transit agency in Izmir tested 20 e-buses on 280 of its 340 routes to better understand e-bus performance under a range of conditions and determine which routes were suitable for electric buses. The results will provide vital input if the public transit agency of Izmir is to achieve its target of 400 e-buses established in its 2015–20 strategic plan. Such route testing is also seen in one of Mexico City’s pilot projects. In the project planning to be conducted on Metrobus Line 4, 16 buses will be tested for 3 weeks under different scenarios. Data will be used to compare the implications of types of e-buses and route specifications for operational planning.
In general, varying the routes on which e-buses operate is considered a best practice for fully evaluating e-bus capabilities. Route planning is important and necessary for electric bus adoption, especially for cities that want to scale up and achieve mass implementation. Some key route-related factors that will impact vehicle efficiency and battery range include the following:
▪ Road surface conditions
▪ Route length and slope
▪ Route infrastructure design
▪ Distance between routes and charging facilities
▪ Passenger demand, stop times, and operational speeds
▪ Other local characteristics
Participating e-buses must include data-logging devices to gather operational information. If these devices are not included, information will be limited and impossible to validate.
Plan ahead for charging infrastructureElectric buses require charging infrastructure. Constructing and maintaining this charging infrastructure requires careful consideration of various factors, including but not limited to the following:
▪ Existing power capacity and distribution facilities in the city, and potential locations for charging facilities
▪ Likely electricity demand, expected charging behaviors, and impact on the grid
▪ Potential requirements for new charging facilities in case of future expansion, in terms of both location and type of infrastructure (e.g., transformers, substations, generators, power plants)
▪ Costs of all required infrastructure and sources of funding and/or financing
WRIRossCities.org 34
Careful planning of charging infrastructure can help increase system efficiency, reduce unnecessary costs and risks, and limit potential redundancy of infrastructural assets. Even though a pilot project may not require in-depth infrastructure analyses, it is often the case that the costs associated with installing charging stations are significant. By planning ahead, infrastructure created for a pilot project can be fully integrated and leveraged for future expansion of the e-bus fleet, which will increase the efficiency of the overall project. A thoughtful charging-infrastructure construction plan can contribute to a successful e-bus adoption plan because it can help establish a limit on the size of the e-bus fleet that is feasible at defined points in time. This is a lesson learned in Shenzhen.
In Shenzhen, multiple charging infrastructure plans were released to support electric vehicle adoption (including e-buses). In 2009, the city government issued the “Public Charging Infrastructure Implementation Plan for New Energy Vehicles (2009–2012)” before the first e-bus was put into service. This plan provided a roadmap for public charging infrastructure and paved the way for initial e-bus adoption. However, in the final acceleration stage of e-bus adoption, the number of buses increased faster than anticipated in the charging infrastructure plans. This caused a shortage of charging infrastructure in the city that led to operational impediments and higher-than-necessary costs to resolve.
In Belo Horizonte, the local utility company, together with bus operators, conducted a grid analysis using actual depot locations and grid capacity information to determine the infrastructure needs and charging patterns for local electric bus adoption. In Philadelphia, potential investment in charging infrastructure was considered before procuring electric buses. Although the estimated prices increased during the procurement process, a grant from the federal government was secured to cover some of the cost for charging equipment. In Zhengzhou, charging infrastructure is planned and constructed before more e-buses are introduced, taking into account the limitations of the local power grid. Then, the
number and routes of electric buses are confirmed based on the number of available charging facilities.
Underestimating the importance of charging infrastructure may cause existing projects to stagnate, compromise the benefits of electric buses, or reduce the buses’ operating efficiency. For example, in Philadelphia, the electric bus rollout was delayed because of the need for a new substation. In Campinas, due to a lack of charging capacity, a separate diesel power generator was procured, increasing the carbon footprint of the electricity used to charge the buses. In Shenzhen, despite the success in the city, the efficiency of the charging stations has been limited due to a lack of coordinated planning and a surge of electric buses, which has reduced the efficiency and sustainability of the system.
Even if local conditions are not optimal for electric bus adoption, grid system improvements can be incorporated as part of the planning process. For example, in Izmir, the local bus operator installed a solar power plant near one of its depots to generate electricity specifically for charging the e-buses. Installed solar panels total 9,250 square meters, with a generating capacity of 5.2 kilowatt hours per square meter per day. This helps reduce the emissions generated by electric buses and mitigate the generally high carbon intensity of the Turkish national grid.
Select one or more e-buses to evaluateOnce the pilot project scope and data collection plan are in place, this information should be shared with multiple e-bus manufacturers to refine the plan and prepare for procurement. To the greatest extent possible, competitive procurement procedures should be used to select participating bus manufacturers.
In the case of Zhengzhou, the city took a proactive role in the adoption process. Bus operators conducted a series of tests with different bus models under varied conditions and different charging methods, such as battery swapping and wireless charging. This form of comparative testing allowed the city to evaluate similarities and differences
35How to Enable Electric Bus Adoption in Cities Worldwide
between vehicle makes and models in a structured manner, and determine the ideal technical features that fit for the city’s operational conditions. The findings helped inform future procurements, and now e-buses constitute 69 percent of the transit fleet (29 percent are fully electric and 40 percent are plug-in hybrid electric).
The novelty of electric vehicle technologies often generates heightened interest and scrutiny and cities may sometimes be unprepared for the public backlash that can result from noncompetitive awards. Therefore, an open and transparent procurement process is important. Specific procurement strategies are suggested in Section 3.2, based on lessons learned from bus procurements observed around the world. It should be noted that this is an active area of further investigation and additional business models are likely to emerge over time.
Plan for trial and errorThere is always a learning curve when adopting new technologies. Some failures or disappointments are inevitable and should be acknowledged as a necessary part of a continuous learning and improvement process. Cities should plan for a “flexible planning process” based on thorough monitoring and evaluation of emerging results. Building in such flexibility yields returns in the long term with the adoption of new technologies that may have uncertain outcomes.
Shenzhen currently operates the largest electric bus fleet in the world. As the first and only city to achieve such a large transformation to electric transport, Shenzhen experienced numerous challenges and had no precedent to guide decision-making as issues arose. Shenzhen thus provides an exceptional example of the importance of trial and error (Table 5).
CHALLENGES SOLUTIONS
initial technology could not meet operational requirements
1. Continuously provided feedback and negotiated with manufacturers to address the issues, which led to technology improvement.2. Shifted battery and vehicle maintenance risks to manufacturers.3. Operated early models on less crowded routes.
No precedent for charging infrastructure business models
1. Formed a joint venture with local charging providers, which are responsible for financing, constructing, and operating bus charging facilities. The capital investment can be paid back through service fees and by providing services to private vehicles.2. Applied an alternative business model by establishing a service package with the manufacturers, which are also responsible for constructing and maintaining the charging infrastructure as well as delivering the vehicles.
Lack of charging infrastructure, especially in terminals
1. Established a dedicated committee including members from different departments.2. Worked with manufacturers to improve charging efficiency. This reduced the number of charging ports required and, thus, demand for charging infrastructure.3. Addressed land scarcity issues by building large depots on the urban periphery, extending land leases for rental properties, and finding unused state-owned land to install charging infrastructure.
Table 5 | Electric Bus Adoption in Shenzhen: Challenges and Solutions
Source: Shenzhen case study.
WRIRossCities.org 36
Izmir’s adoption and operation of electric buses. After Izmir became the leading e-bus city in Turkey, ESHOT started to disseminate knowledge nationally, accelerating the development of electric bus projects in other cities.
2.4. Update the Cost-Benefit Analysis and Explore Financing Options
Cost-benefit analysis and financial planning are two essential steps in achieving a sustainable cash flow during e-bus operations. Both cost-benefit analysis and financial planning should be started during the initial analysis phase (Section 2.2) and informed by information gathered during the pilot project phase.
Share knowledgeWhile the number of cities that have achieved mass adoption of e-buses is very small, more cities have begun pilot testing. A commonly cited barrier to e-bus adoption is a lack of available information on vehicle performance and best practices. This report intends to bridge some of that gap, but new information will emerge every day.
Knowledge exchange activities such as site visits, workshops and online courses, international conferences, and stakeholder meetings can help cities learn intensively and interactively. Sometimes these activities can generate unexpected synergies between stakeholders and lead to new development opportunities.
In Izmir, the bus operator, ESHOT, took a proactive role at the initial stage, when operational knowledge was still lacking. It developed a team of engineers, planners, and decision-makers that undertook technical visits and literature reviews to develop the internal knowledge base necessary to initiate the electric bus adoption project. The team visited cities in China where e-bus fleets have been scaled up and some countries in the European Union (where many e-buses are imported from Turkish manufacturers, making them a potential e-bus market for Turkey) to gain a better understanding of the current and future e-bus marketplace. These activities helped guide
E-buses may be better from a cost-benefit analysis perspective than diesel buses due to the environmental benefits, though most of the time the benefits are not monetized. However, from a financing perspective, e-bus projects face multiple barriers including their high up-front costs, lack of financing options, rigid or inappropriate business models, and general uncertainty surrounding the long-term costs and who will bear them. For further information, see Barriers to Adopting Electric Buses.
37How to Enable Electric Bus Adoption in Cities Worldwide
Update the cost-benefit analysisConsidering the relative immaturity of electric buses and the potential for rapid technology evolution, long-term planning should be included in the cost-benefit analysis to support strategic decision-making. Some relevant issues to consider are briefly discussed below, besides the TCO analysis and benefits discussed in Section 2.2.
Price variability. The most obvious price variability is the ongoing decrease in battery prices. Because the price of the battery accounts for a large portion of the price of the whole vehicle (BNEF 2018), a decrease in battery price could greatly affect the future adoption of electric buses. Also, e-bus project prices may vary by region due to imported components (e.g., importing an electric bus from China is more expensive than procuring one domestically due to shipping costs); local taxes and tariffs (see 2.1); and higher prices due to fluctuating exchange rates (e.g., if a loan is borrowed in an international currency before the project is implemented, or if certain components need to be purchased abroad but local currency depreciates before the loan is paid back or before the components are purchased). The possible financial risks for banks and the operating agencies are worth considering as well.
Costs for supportive elements are sometimes overlooked when transit agencies plan for electric bus adoption. To operate electric buses efficiently, city-level infrastructure may need to be upgraded, which requires significant resources. Additional substations and distribution network expansion, additional land for charging infrastructure, and even the materials and human power required to establish new infrastructure in the city—as well as the variance in the prices of these components (especially land prices)—can all add significantly to initial cost estimates. These are additional factors to consider other than the infrastructure costs discussed in Section 2.2.
E-buses have social and environmental benefits, which need to be monetized. For example, e-buses have zero tailpipe emissions, which can help reduce local air pollution and bring benefits such as improved human health (USDOT 2016). E-buses may also help reduce CO2 emissions and address climate change issues. The
exact threshold of whether e-buses can help reduce CO2 emissions depends primarily on the carbon intensity of local electricity generation, but also on the fuel type and efficiency of other fleet buses (e.g., diesel, CNG, or hybrid buses). Cities with less stringent vehicle emission standards, worse fuel quality, and a cleaner grid will enjoy more climate benefits from a transition to an electrified bus system. These should be monetized and included in the full cost-benefit analysis of e-bus adoption projects to reflect the real costs and benefits of adopting e-buses.
Theoretically, these social and environmental benefits can be monetized and included in the cost-benefit analysis to determine the real value of adopting clean technology. However, in practice, the social and environmental benefits are rarely monetized or included in cost-benefit analyses published by public companies, even though companies probably do conduct estimates on these benefits internally.
Financial planningPotential financing options should also be considered and explored at this stage to secure the successful and sustainable implementation of the project. Even though the TCO of electric buses, which includes the up-front procurement cost, financing costs, operation and maintenance costs, and the residual value of bus scrappages, is often comparable to that of diesel buses (BNEF 2018), the up-front cost of e-buses is much higher. Transit agencies and bus operators should therefore use the entire lifespan of electric buses as their primary financial unit of measurement. They should also explore innovative financing options and procurement models to reduce the risks of up-front costs (discussed in more detail in Section 3.2).
Table 6 below lists three financing-related components and real-world examples seen in e-bus procurement based on 26 case studies conducted in 2016 (Li et al. 2018). Even though the list may not be comprehensive or capture developments since 2017, it can at least provide a relatively comprehensive picture of potential financing options that transit agencies and bus operators can explore. The three categories of financing-related components include the following:
WRIRossCities.org 38
▪ Nonreimbursable funds, which refer to the potential funding and income sources for the bus operator or transit agency, specifically regarding e-buses. This category may include the regular sources of income for bus operators and transit agencies, such as farebox revenues, bus scrappage payments, or the public trans-port budget, or subsidies directly supporting the procurement and operation of e-buses. It may also include types of direct grants either to reduce the up-front costs or the risks associated with the new technology. The reduced taxes for e-buses—an incentive policy—can also be seen as a form of income.
▪ Investment capital, which refers to the typical financial mechanisms or reimbursable funds that transit agencies or bus operators can apply to pay for the high up-front costs of buses. Even though traditional mechanisms used by operators, such as debt and equity, are usually used to procure e-buses, specific financial mechanisms designed to support e-buses are rare. Table 6 lists two mechanisms supporting e-buses—soft loans (used in Curitiba, Brazil, and Bogotá, Colombia, for hybrid electric buses as concessional loans) and green bonds (used in one city in China, Tianjin, with lower interest rates). More innovations are emerging annually.
▪ Legal arrangements, which refer to the procurement and operational models, some of which are used specifically for e-buses. More information about legal arrangements provided by the case studies will be discussed in Section 3.2.
2.5. Set Actionable and Time-Bound TargetsClear, specific, time-bound, and thus actionable targets help cities organize their planning and actions for timely implementation of full electric bus adoption. Manufacturers and utility companies have led successful pilot schemes (such as in Belo Horizonte and Campinas) but guidance from the local government has been indispensable in cities that have wanted to expand beyond pilot projects (such as in Shenzhen, Zhengzhou, and Izmir).
Targets can provide valuable guidance for stakeholders, especially in the early adoption stage of new technologies, but targets alone are insufficient. In Santiago, the national government issued the National Electric Mobility Strategy in 2018, which includes a target of 90 e-buses in its public procurement process as the first step toward achieving a fully electrified public transport system by 2050. However, the strategy does not include a detailed implementation plan or clear responsibilities and actions for different stakeholders. Thus, even though transit agencies and utility companies in Santiago have analyzed and advocated for e-buses, they have expressed uncertainty regarding the next step of adoption.
CATEGORY EXAMPLES
Nonreimbursable funds
Private grantsPublic grantsCapital expenditure grantsOperational expenditure grantsResearch and development grantsPublic transportation budgetsFarebox revenuesBus scrappage paymentsSales taxesEnvironmental impact taxesPayroll taxes
investment capital Soft loansGreen bonds
Legal arrangements Bus leasesBattery leasesLease-purchase contractsLeaseback agreementsConcessionsPublic procurement contractsAdvertising contracts
Table 6 | Potential Funding and Financing Mechanisms to Support Electric Bus Projects
Source: Li et al. 2018.
39How to Enable Electric Bus Adoption in Cities Worldwide
Actionable and time-bound targets can assist stakeholder coordination and avoid duplicative efforts. In Belo Horizonte, potential stakeholders convened for a detailed conversation regarding electric bus adoption. The convening event resulted in a detailed timeline (Figure 8) with clearly defined actions in different categories, such as vehicle, infrastructure, operation and maintenance, and communication. This helped the city identify potential actions for the near term, allocate responsibilities to different stakeholders, and keep
track of progress. Even though Belo Horizonte has not yet started e-bus procurement and operation, a testing plan of 25 e-buses has been released, and an initial analysis, including charging station feasibility analysis and planning, has been done. The actionable and time-bound targets reduced potential redundancy and increased the efficiency of the e-bus adoption process, which helped the city transition quickly from Development Stage 0 (no substantial plans or awareness) to Stage 1 (actual plans) in less than two years.
Source: Authors, WRi Brasil.
Figure 8 | Belo Horizonte’s Electric Bus Adoption Timeline (initial Plan)
Business model
workshop
Study the energy
infrastructure of bus depots
Start to develop
communication plan
Start to evaluate the
normative aspects
Normative aspects
concluded
Communication plan and
seminar to launch the
project
Announcement of the
project
Training of bus drivers and
maintenance team
Definition of bus depots and
development of an
adaptation plan
Bus depot infrastructure
adaptation
Energy grid infrastructure
adaptation
Bus depots and energy grid ready
Financing process starts
Definition of the e-bus
routesFinancing approval
Start to manufacture
the busesDelivery of
the bus
JULY 2017
OCT2017
NOV2017
MAR2018
APR2018
MAY2018
JUNE2018
OCT2018
NOV2018
JAN2019
FEB 2019
MAY 2019AU
G 20
17
SEP
2017
DEC
2017
JAN
2018
FEB
2018
JULY
2018
AUG
2018
DEC
2018
SEPT
2018
MAR
2019
APR
2019
JUNE
2019
JULY
2019
Oper
ation
al te
st of
the v
ehicl
es
Star
t of o
pera
tion
Vehicles Infrastructure Operation and mintenance Communication Normative aspects
WRIRossCities.org 40
41How to Enable Electric Bus Adoption in Cities Worldwide
3. HOW TO REACH MASS E-BUS ADOPTiONMany cities around the world have successfully initiated
pilot e-bus programs but only a few have been able to
move e-buses to the mainstream and include them as a
substantial percentage of their entire bus fleets. Scaling e-bus
implementation is a fundamental challenge that is often
overlooked at the outset of an e-bus program. This section
discusses strategies for moving e-buses past initial pilot
projects to mass adoption.
WRIRossCities.org 42
3.1. Formalize and Implement a Long-Term Infrastructure Plan
The same infrastructure considerations identified for pilot projects in Section 2.3 apply to scaled implementation. The degree of rigor will be greater and additional considerations will apply to large-scale e-bus deployment. For example, a pilot project may cover only one or a few routes, but with broad adoption, multiple routes or a network of bus routes
are involved. This requires more careful planning of charging facility locations. Also, scaled-up adoption requires more electricity, which increases the impact on and response of the grid system. In all cases, it is critical that planners consider not just current infrastructure needs but potential future needs as e-bus adoption increases.
Create a site planTransit agencies often lack space within depots and parking lots and the physical requirements of charging infrastructure can further limit the space available for buses. Charging stations with multiple charging ports can help minimize the space requirements, depending on the physical characteristics of the parking area. Other electrical equipment, such as distribution transformers and substations, also require physical space that may not be readily available. Thus, the distribution of e-buses across potential parking locations should be based in part on the availability of physical space.
Source: Authors.
Figure 9 | Enabling Factors and Actions in the Planning and Scaled-Up Lifecycle of E-Bus Adoption
PLAN FOR E-BUS ADOPTION MASS E-BUS ADOPTION
Structured pilot Actionable and time-bound targets
Cost-benefit analysis and financing planning Plan for end-of-use of bus
Large-scale adoption
Training on operation and maintenance
Formalize and implement procurement plan
Formalize and implement long-term infrastructure plan
Policy landscape
Initial analysis of costs and benefits, technology,
stakeholders, and constraints
Officials may underestimate the formidable planning challenges inherent in scaling up an e-bus pilot scheme. Lack of information concerning the technical implications and costs associated with expanding infrastructure and associated land-use requirements can present a serious obstacle to success. For further information, see Barriers to Adopting Electric Buses.
43How to Enable Electric Bus Adoption in Cities Worldwide
Charging stations are expensive but are typically not the most expensive element associated with charging infrastructure. For example, Philadelphia reported that charging stations represented only 40 percent of the total infrastructure cost of its pilot project. The other 60 percent was related to electrical equipment and construction expenses.
In general, the distance between where charging stations and facility electrical equipment are located impacts cost due to the physical facilities required. For example, it is usually necessary to dig trenches through concrete to run wires from electrical and communications equipment to the charging stations. A shorter physical distance will likely reduce overall cost, though the cost also depends on the number of vehicles served by the charging facilities. Power management strategies (such as circuit and panel sharing) that limit the maximum load potential can lessen the overall cost burden for electrical infrastructure. These types of costs should not be overlooked when preparing for the mass adoption of e-buses because they can be a major impediment to success.
It is generally advisable to prepare facilities for the long-term adoption of e-buses to minimize recurring expenses. For example, it is likely much more expensive to install and then replace a distribution transformer than it is to install a larger transformer than is immediately needed. However, the expected changes in the technology also need to be taken into account when the city is making a decision.
Define technical specifications for charging stationsTechnical specifications for charging stations, such as charging standards, power requirements, safety standards, and communication mechanisms, are important to consider and should be standardized before the long-term and large-scale adoption of electric buses and charging facilities.
There are currently no globally accepted charging standards for e-bus charging stations, but many companies are pursuing a common standard. Standards generally pertain to the physical plug and communication protocols that allow charging stations to connect to and communicate with vehicles. Charging standards are generally
established for light-duty vehicles, but the higher power requirements of e-buses makes it necessary to define new standards or adapt existing standards. Establishing common technical standards, such as those of the International Organization for Standardization, is important for the industry. Regarding transit agencies and bus operators, industry coalitions such as CharIn offer important technical and institutional information for cities seeking support as they plan for e-bus adoption (CharIn 2019).
Determining the power requirements of charging stations is also necessary. Higher power ratings allow e-buses to charge more quickly but also require more expensive charging equipment. Generally, a 50-kilowatt charging station is the minimal rating that would be appropriate for charging fully-electric transit vehicles (Gnann et al. 2018). Lower power ratings may not ensure a full overnight charge. The power rating should be determined based on the charging time necessary to ensure adequate vehicle availability, the power ratings available from charging station manufacturers, the power ratings available from the existing electricity network, and potential downtime for the charging facilities due to maintenance and other activities.
Charging stations for e-bus fleets should also include standard safety features and either Wi-Fi or Ethernet communications capabilities to enable monitoring, data collection, and “smart charging” systems (described in the next section). Some charging station models include a high-accuracy metering capability, which allows operators to closely monitor and control e-bus electricity consumption.
Consider implementing smart charging systemsSmart charging is enabled by a software system that manages the charging schedules and load profiles for each individual charging station (Moghaddam et al. 2018). The purpose is usually to optimize charging schedules to minimize cost by ensuring not only that vehicles are charged when electricity is cheapest, but also that vehicles are fully charged for their next scheduled use. In locations where the price of electricity or vehicle use schedules are highly variable, smart charging can be an effective means to reduce e-bus operational expenses. More sophisticated smart charging solutions also
WRIRossCities.org 44
consider electricity consumption from nonvehicle sources in a given facility to ensure that electric vehicle charging does not adversely affect the facility’s overall electricity load. Implementing smart charging solutions typically does not cost a significant amount of money because these solutions are primarily software-based. However, there must be a means to communicate between computer servers and charging stations, either through Wi-Fi or an Ethernet connection.
In addition, considering the bus route network, smart charging may not be limited to securing a cheaper price of electricity, but can also be used to optimize the costs for the whole system by taking into account local operational features. For example, buses may be charged along the route or during off-peak hours when buses are in low demand, but when the electricity price is high. However, the increasing costs for electricity may be compensated by a reduction in infrastructure costs. On-route and off-peak charging may reduce the need to establish charging facilities for overnight charges and increase the usage rate of public chargers during the day. Therefore, a deeper analysis should be performed to determine the optimized solutions for cost reduction.
Establish a plan for power outagesPower outages can wreak havoc on city public transit systems when e-buses are widely deployed. It is essential for transit agencies to develop and implement back-up power strategies to mitigate operational risks. For example, strategies to detect potential system failures need to be adopted, such as signing a contract with a power company that includes penalties for service disruptions; establishing demand reliability regulations at the national level; and further applying smart charging technology and different charging patterns to reduce the impact of power outages.
In addition to rapid response, additional charging sources, such as stationary or mobile generators, are capable of effectively charging e-buses. Energy storage facilities and batteries are also seen as additional sources of electricity during power outages. However, the energy sources of these back-up generators and energy storage facilities should be considered from an environmental perspective. Alternatively, plans can be developed to allow for the temporary replacement of e-buses by renting or reassigning conventional buses to
fulfill e-bus routes until power has been restored if the e-bus fleet scale is small or if the city is not targeting a 100 percent adoption rate of e-buses and still has conventional buses in operation. It is worth noting that this option does not encourage cities to purchase new fossil fuel–powered buses, but to improve the efficiency of the whole fleet once e-bus adoption begins.
identify and plan for capital infrastructure expensesThe cost to install an e-bus charging station varies widely between countries, regions, and facilities. Costs observed through the case studies used for this report ranged from approximately $20,000 to $80,000 per unit, including all supporting electrical equipment and construction (information estimated based on experiences in Shenzhen, China, and the United States). Certain fast-charging systems can cost several hundreds of thousands of dollars.
Unfortunately, options to finance charging infrastructure are currently limited. It is possible to use green bonds or power purchase agreements as mechanisms to amortize infrastructure expenses, but few examples were identified in the preparation of this report. We observed one mechanism that involved engaging with electrical utilities to support infrastructure expenses. Electrification of transit buses is generally in the interest of utilities (public or private) because it increases electricity demand from participating transit agencies. In Campinas, for example, the local utility provider partnered with a transit operator to install a substation for a bus depot and equip garages with charging infrastructure.
3.2. Formalize and Implement an E-Bus Procurement Plan
E-buses represent a new and emerging technology. Transit agencies and bus operators face multiple uncertainties related to e-bus design technology, operational performance and maintenance, financing, and end-of-life scrap value. it may be difficult to establish effective working relationships with e-bus manufacturers, especially if none are present locally. For further information, see Barriers to Adopting Electric Buses.
45How to Enable Electric Bus Adoption in Cities Worldwide
Transit agencies and bus operators are generally experienced in procuring and operating buses. However, to successfully implement e-buses at scale, cities need to select procurement models that address the uncertainties mentioned above.
Create e-bus technical specificationsPublic transportation aims to provide urban residents with efficient, comfortable, and reliable transit services. Since this goal is essential for any transit agency, adopting e-bus fleets should not come at the expense of the quality of transit service. E-buses are a relatively new technology with great variances in technical specifications and performance; cities need to understand these nuances to ensure their adoption of e-buses is compatible with local operational requirements. Based on all analyses and pilot projects conducted prior to preparing a tender, transit agencies should develop requirements for the buses to be procured that meet both technical needs and passenger satisfaction.
Transit agencies can and should negotiate with manufacturers on specific technical requirements to achieve the best performance possible. These technical requirements should include both e-bus–specific components, such as battery, electric engine, and transmission system, and those that are common for both electric and conventional fossil fueled buses, such as air conditioning, heating, and the number and condition of seats. For example, the public transit agency in Izmir conducted a feasibility analysis and procured 20 electric buses for further testing. The tendering document listed specific technical requirements, including battery range, air conditioning and heating system, and
ideal price, among others. In the first tendering process, none of the manufacturers met the conditions required by the transit agencies related to battery range, the fuel used in the heating system (which shouldn’t be fossil fuel), or air conditioning technology. Later, transit agencies negotiated with manufacturers but maintained their quality requirements, which were eventually met by one manufacturer.
This may be easier to achieve in places with either more technology choices or more bus manufacturers. For example, in China, cities usually have specific technical requirements, especially regarding the number of battery packs, and issue tenders tailored to local conditions. However, even cities with less developed e-bus marketplaces should never feel compelled to accept inadequate technical specifications from a manufacturer. It is better to narrow the scope of the tender than risk the quality of transit service.
Plan for technology advancementsE-buses are relatively new and use constantly improving technologies. For example, in just five years, Shenzhen’s supportive policies for electric vehicles, increased targets, and high demand for electric buses emphasized the need for technology upgrades and led to an improvement in performance. Problems such as limited battery range and frequent breakdowns have been largely reduced in the new-model buses adopted since 2016. In 2011, 2 electric buses were needed to secure the service quality of 1 diesel bus (50 percent availability rate) whereas in 2016 only 103 e-buses were needed to achieve the same level of service as 100 diesel buses (97 percent availability rate) (Table 7).
Table 7 | Performance of Electric Buses in Shenzhen before and after Technology Upgrade
FIRST E-BUSES, IN 2011 E-BUSES IN 2016
Daily operation mileage in kilometers (km) 125 175
Battery range (km) 180 250
Energy efficiency (/100 km) 150 kilowatt hours (kwh) 110 kwh
Availability rate 50% 97%
Source: Compiled by the authors, Shenzhen case study.
Other early adopters have also experienced operational improvements. In Campinas, for instance, the newest e-buses have longer battery ranges and more power than the older models, which allows them to traverse a higher percentage of the city’s routes.
However, e-bus technology will improve over time only if manufacturers are able to produce and sell more vehicles. Hence, the most prudent course of action for transit agencies is to implement a multiyear procurement strategy that gradually increases the quantity, complexity, and route difficulty for e-buses as new generations of vehicles are introduced. As with long-term planning for charging infrastructure, it is important to take a long-term view of e-bus procurement.
Select a procurement model for e-buses and supporting services The case studies conducted for this report demonstrate that many cities have difficulty
acquiring e-buses using conventional procurement models since current contracting models do not consider the unique cost structure of e-buses (Section 2.2). If e-buses are to compete successfully with diesel buses, contracting models need to find ways to meet the high capital investment and maintenance responsibilities and overcome the risks associated with their adoption.
Given the unrivaled success of mass e-bus adoption in China, it may seem reasonable to look to cities like Shenzhen or Zhengzhou for lessons on how to model procurement processes. However, the procurement models used for e-bus adoption in China require strong government financing (see Section 2.1), which does not exist in most regions of the world. In Shenzhen, several e-bus financing models are in use, some of which require a financing entity (typically backed by some element of government) or charging facility operator to bear the risk associated with owning and leasing e-buses or batteries to operators. An example of a procurement model used in Shenzhen is shown in Figure 10.
Source: Shenzhen Municipality Transport Commission 2017.
Figure 10 | A Procurement Model for E-Buses in Shenzhen
Bus operating companies
Bus manufacturer
Financial institute
After 8 years, vehicles belong to bus operating companies
Lease vehicle, charging stations
Purchase whole vehicle, and
charging infrastructure
Maintenance; charging station construction
Bus operators
operate the vehicle
47How to Enable Electric Bus Adoption in Cities Worldwide
For regions with limited government-backed financing options, WRI has led research on how to structure e-bus procurement models. The findings of this research are detailed in the paper Adapting Procurement Models for Electric Buses in Latin America (Orbea et al. 2019). While that paper focused on Latin America, the major takeaways concerning the allocation of risks and costs are applicable globally. Orbea et al. (2019) propose that cities devise a procurement model that divides bus service responsibilities into three main categories of stakeholders:
▪ Multiple bus procurement companies, which specialize in raising capital and understanding and underwriting the technological risks. The number of procurement companies should be numerous enough to sufficiently divide risk, but few enough to prevent logistical and coordination issues between each other.
▪ One or multiple infrastructure building companies, which are responsible for building the necessary depot infrastructure while providing adequate space for operation, administrative support, maintenance, cleaning, and maneuvering. The number of infrastructure building companies should depend on the size of the e-bus fleet and how much infrastructure will be needed.
▪ Multiple bus operating companies, which provide transport services. These operating companies should function much as they do now, but with a greater focus on operating e-buses, rather than maintaining and procuring them.
This model aims to place responsibility for specific tasks with the stakeholders that are best equipped to manage them. For example, bus procurement companies can focus solely on evaluating financial risks, while infrastructure-building companies focus on charging and maintenance issues and operators focus on the logistics of providing transit services.
While this model is still relatively unproven and is not a one-size-fits-all solution to procurement challenges, it does provide a framework that cities may be able to customize for their e-bus tenders. For example, forms of this procurement model have been adopted, or are under consideration,
in multiple cities in Latin America including Belo Horizonte and Santiago. An example of the duties and the responsible parties in Santiago’s proposed contractual model is shown in Figure 11.10 Santiago historically contracted all bus responsibilities to one entity, the operator. Under the proposed model, the responsibilities and associated risks are shared among multiple stakeholders.
In the most recent bus procurement case, in Bogotá, the intention to separate the procurement of e-buses and the bus service is also observed. TransMilenio, the city’s transit agency, has issued open bidding documents for approximately 1,400 buses, of which 67 percent are bi-articulated and
Note: The colors are used only to distinguish the different stakeholders. The roles or responsibilities of each stakeholder are briefly introduced on the left-hand side of the graphic. The following describes WRi’s proposed model: Bus procurement companies (BusCos) are responsible for procuring buses based on the needs defined by the governing body. The governing body and depot builders are responsible for land and infrastructure–related procurement and installation, while the governing body needs to define bus operating needs and requirements and establish contracts. Operators will purchase buses from BusCos under contracts designed by the governing body, with the main responsibility to provide good service. The mixed area for BusCos and operators represents different options available for maintaining electric drive and battery components; this role can be played by BusCos, operators, or a combination. Source: Orbea et al. 2019.
Figure 11 | A Procurement Model for E-Buses in Santiago
ExistingContracts
Responsibility
Vehicle provision
Maintenance
Fuel
Operation
Drivers
Terrain
Infrastructure
WRIProposal
Operator
Operators
Governingbody
BusCos
Depotbuilders
Governingbody
WRIRossCities.org 48
33 percent are articulated (TransMilenio 2018).11 The procurement model includes two components, which separate bus procurement and operation. The first component is the procurement and supply of the bus fleet; the second component includes the operation and maintenance of the fleet, and the operation of a depot with maintenance capacity (“patio-taller” in Spanish) (Figure 12). According to TransMilenio, this model minimizes the risk of operation and encourages the best quality provision of bus service.
Source: TransMilenio 2018.
However, it is worth noting that even though there are incentives to adopt clean technologies, steps can be taken to further incentivize e-bus adoption. For example, the current model is open to all types of clean technologies—including e-buses, natural gas buses (e.g., CNG and LNG buses), and buses with high emission standards (e.g., Euro VI buses)—but the model could be more stringent by setting limits to bus technology to support e-bus adoption. In addition, the points allocated to clean technology in the contract model to incentivize its adoption can be further increased from 200 points (out of 1,000), and stricter fuel efficiency standards in general for new bus concessions can push operators to procure e-buses.
Other financing mechanisms for electric buses have been used in some cities. For example, leasing is a common mechanism. This usually involves a third-party financial institute that procures and leases the bus to operators, with an option for bus operators
to purchase the bus after a set number of years. A few other derivative mechanisms include purchase-leaseback, which involves tax-reduction options, and a combination of financial leasing and operational leasing for different bus components. Concessional loans have been used in Latin America, and green bonds were used in one Chinese city (Li et al. 2018). International development banks or funds can also provide financing mechanisms and additional funding sources to support the adoption of e-buses in developing countries. Some examples are the Green Climate Fund, Clean Technology Fund, nationally appropriate mitigation action (NAMA) mechanisms, and loan or blended finance options provided by development banks (Li et al. 2018).
3.3. TrainingDriving an e-bus is not significantly different from driving a conventional bus. While there are some nuances to regenerative braking features, and poor driving habits can negatively affect battery performance, driver training associated with these issues is relatively brief and straightforward. Perhaps the most important reason to provide training for e-bus drivers is to increase acceptance of the new technology. This step is especially necessary at the start of a project, when operators may be most apprehensive about adopting a new technology. Bus drivers in Campinas, for example, reported a mistrust of e-buses, and a fear of drastic operational differences between the new buses and traditional diesel buses. However, after an effective training process wherein the bus drivers became familiar with how to operate electric buses, the drivers became more welcoming of the new technology. Many even stated a preference for e-buses over conventional buses due to the decrease in engine vibration and noise.
Maintenance and repair requirements for e-buses and conventional buses differ significantly. Most cities studied while preparing this report opted to contract maintenance services to the bus manufacturers. However, training is required if in-house maintenance services are desired. In Zhengzhou, for example, operators carry out their own maintenance but require training and service manuals to be provided by the manufacturer.
Figure 12 | TransMilenio Bus Contract Model
Model with two components
Fleet procurement
Bus operation and maintenance
Depot operation
49How to Enable Electric Bus Adoption in Cities Worldwide
3.4. Plan for End-of-Use for Each E-BusE-bus technologies are so new that there are very limited examples of e-buses reaching the end of their useful lifespans (normally longer than eight years). Therefore, the information provided in this section is general and not linked to specific case studies.
Unlike conventional buses, e-buses have very few moving parts in the engine and are thus expected to require less maintenance and have longer useful lifespans than their internal combustion engine counterparts (Mahmoud et al. 2016). It is likely that battery degradation will be the primary factor in decommissioning e-buses rather than mechanical systems. For this reason, it is suggested that e-bus disposition plans be aligned with the expiration of battery warranties. Once the battery warranty expires and/or the battery becomes too degraded to operate a bus on routes, there are four options:
▪ Replace the battery and continue operating the bus by the same operator for additional years. This scenario is very likely to happen, as the chassis of a bus lasts longer than its battery. The new battery is likely to come with its own warranty under this mechanism.
▪ Replace the battery and sell the bus to a third party. It is very unlikely the bus operator will bear the cost of the new battery unless the overall resale value can compensate for the cost of installing a new battery. However, the manufacturer will likely bear the cost of a new battery and sell the bus to a new entity, similar to how manufacturers resell old diesel buses to other entities.
▪ Sell or scrap the bus but retain the battery for recycling or second-life use. This can be done by the bus operator or manufacturer. This scenario is likely to happen when the used battery market is mature and the bus chassis is old.
▪ Sell or scrap the bus and the battery, which the operators will be likely to do when the residual values of the battery and e-bus are not clear or low, and the battery replacement cost is higher than the price that would be received by selling everything.
It is difficult to predict the cost and availability of vehicle batteries, but battery costs are rapidly declining and are expected to continue declining over at least the next decade (BNEF 2018). While estimates of future battery prices vary, most mainstream predictions illustrate the same general trend estimated by Bloomberg New Energy Finance: After an approximate 80 percent price decline from 2010 to 2017, battery prices will continue to reduce by half, reaching $96/kwh by 2025 and $70/kwh in 2030.
Meanwhile, there is active research into battery recycling and second-life use that suggests other economic, environmental, and operational considerations. In this context, the term “second-life use” refers to the transition of old electric vehicle batteries into stationary energy storage applications. Battery degradation in vehicles results in a reduction in vehicle range, which ultimately becomes operationally unacceptable. However, the batteries still have adequate capacity to provide various grid and facility support services (Stringer and Ma 2018).
A disposition decision should be based on well-defined criteria, including projections of the future cost of replacement batteries, the future cost and capabilities of new e-buses, the future value of used e-buses and batteries, and other social and environmental considerations. For example, if the cost of a replacement battery falls and the residual value of used e-buses and batteries increases to a certain point, upgrading the batteries of existing buses might be a better option than procuring new buses; if the future capabilities of new buses increase significantly compared with the costs, procuring new buses and disposing of the old ones may be a better solution for bus operating entities. Because these factors are difficult to predict, we suggest that agencies create a set of decisional criteria that describe the conditions that must be true for the agencies to select one of the options listed above. These conditions should be evaluated regularly to help ensure preparedness at an imminent decision point.
WRIRossCities.org 50
51How to Enable Electric Bus Adoption in Cities Worldwide
4. KEY ACTiONS TO ACCELERATE E-BUS ADOPTiONThe general message of this report is clear: To ensure
sustainable electric bus adoption, cities need to initiate a
infrastructure, and ensure stakeholder coordination. While
cities need to take a comprehensive and long-term view, we
also recommend that cities emphasize key actions based on
their development stage to accelerate electric bus adoption.
WRIRossCities.org 52
The guidance in the previous sections is intended to help bus operating agencies create a strategy for maximizing the adoption of electric buses. In this section, we summarize what actions need to be taken based on e-bus development stage so that stakeholders can review what must be done to move to the next stage and accelerate e-bus adoption for that city.
In addition to moving from one stage to the next, leapfrog options exist for cities to skip stages on their paths to mass e-bus adoption. However, leapfrogging requires comprehensive planning and coordination as well as rapid implementation and service delivery among all stakeholders. Cities need to be cautious of leapfrogging because irresponsibly fast advancements may be detrimental to the adoption process if the necessary finance, infrastructure, and supportive policies are not yet in place.
The key actions for stakeholders in different cities are discussed below. Specific city examples are also listed to which they can refer.
From Stage 0 to Stage 1A Stage 0 city attempting to progress to Stage 1 needs to first understand whether or why it wants to pursue electric buses. To do this, city officials and bus operators must understand both the local environmental objectives of the city and whether e-buses will be able to fulfill these goals. For example, if a city aims to reduce local air pollution by a certain target level, the local air pollutant reduction potential of electric buses needs to be analyzed based on local operational conditions. In addition, local conditions such as transit service quality, technology availability, fuel price, and fuel availability may also be considered.
Next, if the city decides to adopt, or even just test, electric buses, some prerequisites for adopting e-buses need to be reviewed to ensure that the city has the capacity to begin a worthwhile e-bus project. If not, the city must first establish the basic infrastructure needed for electric bus adoption—this could include, for example, electricity generation, transmission, and distribution capacities; road conditions; and whether the existing public transport operational model will
support or delay electric bus adoption. If the city has the requisite infrastructure in place, then it needs to decide on a “responsible adoption” path, and plan for well-analyzed and well-designed mechanisms in multiple areas, which are discussed in Section 2 of this report. Generally, the decisions are better made by city decision-makers, bus operating entities, and other related stakeholders together to ensure the messages are aligned and agreed upon.
Cities at Stage 0 can learn from the experiences of Stage 1 cities, and other cities at more advanced stages, regarding both their successes and failures. Actions taken to initiate and scale up discussions of electric bus adoption are particularly worth studying.
From Stage 1 to Stage 2A city at Stage 1 wanting to move to Stage 2 must develop concrete and time-bound targets and action plans based on prior discussion and analysis. City decision-makers can start by providing policy instruments to incentivize adoption, such as subsidies, public grants, and other supportive measures, and facilitating stakeholder conversations and coordination. Transit agencies and bus operators need to analyze policy scenarios, understand the total cost of ownership, the environmental benefits of electric buses under local conditions, and the potential operational constraints they may face later. This information can be integrated and lead to concrete action plans for all stakeholders.
The next step is to start testing theories and implementing a well-designed pilot or testing project. The pilot or test is a trial-and-error process and a good time to collect local operational data for long-term planning and more efficient operations.
For Stage 1 cities, a flexible planning process needs to go hand in hand with knowledge learned from pilot implementation. Any targets and action plans must be reflected in the pilot projects, and lessons from the experiences gained from running pilots need to be used to modify and improve the original targets and plans as necessary. Cities at Stage 1
53How to Enable Electric Bus Adoption in Cities Worldwide
can learn from the experiences of Stage 2 cities, particularly in how to conduct an initial analysis and determine an actionable pathway for adoption.
From Stage 2 to Stage 3A city at Stage 2 wanting to move to Stage 3 must determine what targets they want to achieve, and how to scale up the current e-bus projects to achieve them. Using data collected from structured pilots and tests, cities need to standardize their e-bus protocol, determine which bus assignments are compatible with electric buses, and secure sustainable financing sources.
At this point, cities at Stage 2 need to be committed to developing a long-term plan for large-scale adoption that is tailored to fit their local situations. For example, the three Stage 3 cities studied in this report all took different paths. Izmir benefited from a strong bus industry, an innovative manufacturer, and a responsible transit agency when preparing for large-scale, long-term adoption. Campinas does not have a local electric bus manufacturer, but the city provided incentives for a foreign manufacturer to accelerate implementation. Santiago has abundant resources for battery manufacturing but does not have a local e-bus manufacturer. However, it conducted multiple rigorous analyses led by the utility company and based on local conditions and developed a good long-term plan for adoption.
One key common factor among these three cities is that they all coordinated among different stakeholders. E-bus adoption is not a task for the transport sector alone, nor is it only about vehicles. It involves power generation, electricity distribution, land use, technology promotion and diffusion, urban planning, passenger behavior, and engagement, among others. Officials must envision a comprehensive picture, coordinate with all stakeholders, and plan accordingly.
From Stage 3 to Stage 4A city at Stage 3 wanting to move to Stage 4 must build a bus route network to approach its target. At this point, a comprehensive and holistic
analysis is necessary to scale up the project, and implementation measures need to be planned for the long term to encompass future expansion. For example, innovative and sustainable financing mechanisms, the ability to monitor and improve bus performance, sustainable sources of electricity, and a responsible, cost-effective program of infrastructure construction are all factors that can secure a smooth and sustainable transition. This stage may take much longer than previous stages to complete because the efforts required to replicate and scale up route-based experiences to a network may be exponential and the capabilities to do this need to be established gradually. Currently, only some cities in China have achieved large-scale adoption and operation, with some other cities around the world aiming for aggressive adoption and starting down this road (e.g., Santiago; Delhi; Los Angeles, United States). Cities can learn from different elements of their adoption pathways.
Stage 4 and What’s NextStage 4 is not the finishing line for cities adopting electric buses. A lot more can be done by cities that have reached their final e-bus adoption targets. Transit agencies and bus operators need to actively evaluate the current network of buses and learn from their experiences. More data collection and research are needed to reevaluate operations, bus procurement and scrappage mechanisms, sustainable financing sources, infrastructure planning, charging models, and grid performance. Also, cities need to consider the requirements for battery recycling and bus scrappage before their e-buses reach the end of their lifecycles and test out different models. In addition, cities need to actively share their experiences with other cities around the world to improve the efficiency of their operations and accelerate e-bus adoption. Cities may also consider electrifying other modes of transit to increase the electrification level of the entire transport sector, integrating more renewable energy sources into the electricity grid, and helping other cities advance their e-bus fleets based on their experiences.
WRIRossCities.org 54
APPENDiX A. THE ELECTRiC BUS ADOPTiON STAGES OF THE CASE STUDY CiTiESBased on city actions taken to date, WRi developed a categorization system to assess the relative progress made by each of the 16 cities toward mass e-bus adoption. The cities are predominantly from the global South but two cities from the United States and Europe (Philadelphia and Madrid) are also included because their experiences in e-bus adoption can provide some useful information for other cities. Specific city-level actions were also categorized as either policy- or implementation-based actions:
▪ Policy-Based Actions: The city has considered or is actively considering specific e-bus policies or adoption targets.
▪ Implementation-Based Actions: The city (or some operators) has procured and is operating e-buses either as a pilot or as part of its nominal public transit operations.
The extent to which each of the 16 cities has taken concrete policy and/or implementation actions was evaluated to place each city into one of five categories, called Stages 0 to 4 (Table A-1). Cities can use these actions as a guide to determine where they stand in terms of their own stage of electric bus adoption.
Note: Blue – implemented, Yellow – ambiguous, Gray – not implemented.a. Quito has run an e-bus pilot test led by the manufacturer but the government has not had any serious conversations or made any plans for e-bus adoption.b. Mexico City is developing a long-term policy and is planning to pilot buses on certain routes when the research has been completed.c. Cape Town procured a small fleet of electric buses, which are not yet under operation, before a structured pilot plan was made. However, the project was under investigation by
local authorities when the case study was done.d. Bangalore had a three-month e-bus trial supported by a manufacturer, but the agency didn’t further expand the project or procure the buses. Thus, it does not count as a
structured pilot.e. Belo Horizonte is about to start the pilot testing process, but had not officially launched the project at the time of publication. f. Manali has been operating a fleet of 25 electric buses. However, the buses operate only during a certain time of year, the plan to scale up the project is ambiguous, and the
replicability of the project is hard to determine. g. Santiago adopted 100 electric buses in late 2018 and another 100 in early 2019. However, whether these new buses qualify as “mass route operations” is still ambiguous.
Stage City
POLICY/TARGET IMPLEMENTATION
Informal Discussions
Formal Discussions
Policy Enacted
PreliminaryTest
StructuredPilot
Multi-route Operations
(Plan)
Mass Route Operations (Network)
0 Addis Ababa, Ethiopia
1 Ahmedabad, india
1 Quito, Ecuadora
1 Mexico City, Mexicob
1 Cape Town, South Africac
1 Bangalore, indiad
2 Belo Horizonte, Brazile
2 Bogotá, Colombia
2 Madrid, Spain
2 Philadelphia, USA
2 Manali, indiaf
3 izmir, Turkey
3 Campinas, Brazil
3 Santiago, Chileg
4 Zhengzhou, China
4 Shenzhen, China
Table A-1 | Actions toward Electric Bus Adoption Taken by the 16 Case Study Cities
55How to Enable Electric Bus Adoption in Cities Worldwide
APPENDiX B | METHODOLOGYCase Study Protocol and Interview Guidelines of Electric Bus Adoption Case Study (Excerpt)
Overview of the case studyThis project is trying to review the barriers cities are facing during the electric bus adoption process and to identify key actions urban leaders could take to fill knowledge gaps, tackle barriers, and accelerate adoption. The experience of cities in adopting electric buses is a relatively new topic with limited recorded knowledge, which is why WRi has chosen a case study as the best approach to fill the information gap. Both primary and secondary sources of data are needed to finish quality case studies with limited resources. While desktop research can collect secondary data and answer questions like “who,” “what,” and “where,” interviews with stakeholders can help answer “how” and “why” questions regarding electric buses adoption.
The case studies will be conducted under a consistent analytical framework that is mainly based on lifecycle elements of electric bus adoption and allows for adjustment due to potential differences between cities. The case studies will be selected to include as many types of cities as possible and may include counterpart cases that are not as successful but which could help identify specific barriers that may have different impacts on cities in different stages of electric bus adoption. in addition to literature reviews and desktop research, detailed information will be collected through interviews with local stakeholders. These case studies serve as the major sources to facilitate a deep dive into cities of different situations, and to learn about the on-the-ground barriers they have encountered in their local contexts. This document provides a guide and general requirements for the case studies and interviews, to ensure cross-case comparability.
Case study questions and hypothesesThrough the case studies and interviews, we attempted to answer two key questions:
1. What barriers does a city face when planning and implementing the adoption of electric buses?
2. What actions can urban leaders take to address these barriers and accelerate the adoption process?
We hypothesized that multiple stages exist for electric bus adoption in different cities. Even though the adoption approaches could vary, similar categories of barriers and related actions may exist, such as institutional, technical, financial, social, and environmental ones.
The case studies attempted to understand “what,” “how,” and “why” certain steps are taken, or certain measures are carried out, for electric bus adoption in selected cities. The “what” questions were mainly addressed by literature reviews and desktop research and supplemented by interview questions, especially for the indirect aspects of adoption. The “how” and “why” questions we pursued mainly through interviews with related stakeholders, who could provide
firsthand information on the case. When we identified applicable literature, we used additional literature reviews to strengthen our understanding of all components of the case studies.
This research does not focus on any specific electric bus technology. instead, its aim is to determine how and why a technology was adopted, and key measures related to “technology adoption” and “technology diffusion,” using electric buses as an example. When the results of the project are delivered to the target audiences, we suggest that rather than focus on which technology to choose, it could be more productive to focus on the local situation and base the choice on those circumstances. The choice of bus technology should be made by local officials based on local conditions.
Theoretical framework for the case studies Technology diffusion normally can be divided into multiple stages, based on the level of technology maturity and market penetration. We hypothesize that electric buses, as an emerging clean technology, will go through the same development stages. Based on author preliminary analysis through research, case studies, local engagement, and literature reviews, we developed five stages for electric buses, according to the adoption conditions for cities around the world. The definitions will be improved once the research is done.
▪ STAGE ZERO (0): At this stage, there are no specific measures regarding electric buses in the city. Some thoughts may have been articulated, but no concrete actions have been taken yet.
▪ EMERGING STAGE (1): At this stage, the city is considering electric bus adoption, starting to conduct research and analysis on the applicability and feasibility of electric buses to the local context, preparing a related work plan or roadmap, or setting targets for adoption.
▪ BREAKTHROUGH STAGE (2): At this stage, the city starts to test the technology with pilot projects, trying to collect operational data, investigating areas for improvement, and preparing for mass adoption of electric buses.
▪ GROWING STAGE (3): At this stage, the city is speeding up the adoption process by procuring more electric buses. Meanwhile, route-based or city-level planning has started to ensure quality service and improve operational efficiency.
▪ CONSOLIDATED STAGE (4): To the maximum level of electrification defined by the city: At this stage, the city is heading for 100 percent electrification of its local bus system, or, based on local needs and conditions, it is reaching the maximum level of electrification it is willing to or could have, without sacrificing service quality. Meanwhile, city-level planning needs to happen, and backup plans need to be prepared before full electrification.
in order to conduct the comparative case study analysis and collect comparable information, we have used a predefined case study outline. Some flexibility can be exercised due to variance among cases. But the general categories are the same.
WRIRossCities.org 56
Case study outlineInstructions: Case study authors should refer to this framework first before starting the research process in order to generate a set of con-sistent and comparable case studies. Then, based on the information collected, authors can determine if the city context requires anything outside of this framework, or if any innovations in the system should be added to the list. The sample questions should be considered as a guide to information collection and may provide some ideas of the content. They may be tailored and adjusted based on local context.
1. General information on the city
2. Electric bus development
a. History of electric bus development
b. identification of the stage of development
c. Next steps
3. Barriers and benefits (if any recorded information exists)
a. Barriers: Potential categories include, but are not limited to, technology and infrastructure, cost and financing, and institu-tional, operational, environmental, and social aspects.
b. Benefits: Cost savings, emissions reductions, and so on.
4. Stakeholder analysis
5. Key components
a. What are the key components of this stage, and of previous stages, if any?
b. What other components or variables in this case are not reflected in this lifecycle component framework?
6. Key takeaways (keep short but synthesized)
Data collection proceduresin this project, desktop research and interviews are the two primary research methods. Apart from published journal articles, which are limited in this case, the literature review should have a strong emphasis on gray literature, such as reports and other resources not publicized internationally, government policies, company reports, research institute publications, and unpublished research. For the interviews, the project will use a semistructured approach to collect primary information from local stakeholders. This type of interview contains predetermined questions but allows the flexibility to ask more customized questions based on the actual conversation. The targeted local stakeholders are ideally all sectors involved in the city’s electric bus adoption project, to reduce potential bias and incorporate diverse voices.
This section will not go into literature review methods, and will focus on interviews only. it covers the suggested steps for data collection (more focus on interviews), the type of evidence to be expected, specific information to be reviewed, and issues to be covered prior to fieldwork (interviews).
Expected preparation prior to interview For each city, the status, policy, and process of electric bus adoption could be different. Thus, it is important to define key concepts ahead, and develop a general framework for information collection, in order to maintain the uniqueness and comparability of all cases.
a. Define the key terms below before the interview:
□ The scope of the electric bus adoption project or effort. ▪ Whether district, city, regional/provincial, or national level
efforts are included. Be clear about different levels’ efforts in the case. The actions, measures, stakeholders, and results could be different.
□ The technology the city will be, is, or has been implementing. ▪ This project is mainly focused on battery electric buses,
which could include different charging methods. ▪ if the city does not distinguish among the categories
of battery electric bus, plug-in hybrid electric bus, fuel cell bus, and conventional hybrid electric bus, it will be important to find out the intention and reason behind this, and maintain a good record of the general policy or plan and other information.
□ The transport modes included in electrification targets, plans, or projects. ▪ This project is mainly focusing on buses. ▪ But it will be interesting to see the connections with other
modes, such as private vehicles, 2–3 wheelers, taxis, and freight if the city’s electrification focus is not solely or mainly on electric buses.
□ The development stage (see case study outline) of the city. ▪ if multiple stages exist, try to separate the information for
each stage and record the trends, if any.
b. Create a stakeholder map and identify the right person to perform the interview.
□ if this task is hard to initiate at the beginning with desktop research, find the focal contact person, or people who issued a certain target, for example, and ask them for more information. The more stakeholders involved, the less informant bias exists.
Potential stakeholdersA list of potential stakeholders is shown below. it varies by city and should be a list of reference. Each case will also have key stakeholders and tertiary stakeholders, who play different roles and have different impact on the project. This could be analyzed later in the case study and report. At the current stage, it is important to capture as many stakeholders as possible.
57How to Enable Electric Bus Adoption in Cities Worldwide
a. City level
□ Bus operators (public, private, etc.) □ City officials who are in charge of the related project
▪ Public planning ▪ Related public work or infrastructure ▪ Transport ▪ Energy and/or environment ▪ Treasury (for budget purpose, fuel vs. electricity), or who
pays the bills ▪ Other
□ Utility companies (public, private, etc.) □ Charging service providers
▪ Utilities (if they are in charge) ▪ Manufacturer ▪ installer
□ Local transport research institute □ Manufacturers (local) □ Passengers/public (if involved in decision-making process) □ Financial institute
□ National-level officials ▪ Transport, energy, industry and technology, treasury,
environment, etc. □ Utility companies (national, regional) □ Manufacturers (national, international) □ National research institute, academia □ Financial institute
▪ Bank, leasing company, international development organization, etc.
d. Other local specific stakeholders
□ E.g., a certain committee organized specifically for a certain electric bus project in a city, or a group of specialists for the project, or a local carbon market (if connected with electric buses)
interview questionsNot all of these questions need to be asked in interviews; some may be answered through desk research. Some categories are applicable to specific stakeholders.
BarrierBarriers and opportunitiesLocal and universal
Source: Authors.
WRIRossCities.org 58
Results of the Case Studies and InterviewsThe results of the case studies are reflected in this report. A brief summary of interviews conducted is listed in the table below.
CitySTAKEHOLDERS INTERVIEWED
City officials, government
Transit agency/ authority Bus operator Vehicle/battery
ManufacturerUtility/
chargingResearch institute
Addis Ababa, Ethiopia x x x x x
Ahmedabad, india x x
Quito, Ecuador x x
Mexico City, Mexico x x x
Belo Horizonte, Brazil x x x x
Cape Town, South Africa x x x x x
Bogotá, Colombia x x x x x x
Bangalore, india x x x
Madrid, Spain x x x x x
Philadelphia, USA x x x x x
Manali, india x
izmir, Turkey x x
Campinas, Brazil x x x x x
Santiago, Chile x x x x
Zhengzhou, China x x
Shenzhen, China x x x x
Table B-1 | A Summary of Stakeholders interviewed in 16 Case Studies
Source: Authors.
59How to Enable Electric Bus Adoption in Cities Worldwide
4. The number of buses in the tender varies by region. For Jammu and Guwahati, 15 buses were included in the tenders; for Bangalore, 150.
5. The maintenance cost here refers to the buses’ total maintenance cost. The numbers were accessed through interviews, with some additional information on the environmental benefits of the project collected from bus operator ESHOT’s website: https://www.eshot.gov.tr/tr/CevreselSonuclar. it is worth mentioning that this information does not include the breakdown of maintenance costs of different categories, such as engine, bus chassis, labor, and tires. it also doesn’t compare the specific breakdown maintenance costs between electric and conventional buses. This type of information is helpful for bus operators, however, and should be collected.
6. FedEx Corporation is a multinational courier delivery service company headquartered in the United States.
7. The results are not intended to calculate the exact costs and emissions in a city, but to provide an initial overview of different bus types and their emissions mitigation potential at the fleet level. Then, the results of the tool can trigger more detailed analysis based on the city’s actual situation. For example, given the city’s road conditions, average travel speeds, and other factors, how much can emissions be reduced by upgrading how many buses from diesel to electricity? Or, given prices, taxes, and subsidies in the city, what is the total cost reduction or increase of the fleet upgrade?
8. The calculation is based on iEA’s average annual per capita electricity usage for lower-middle-income, middle-income, and upper-middle-income countries. it assumes one bus consumes 300 kilowatt hours of electricity daily and that the city has one bus per 1,000 people (PPiAF 2006).
9. Recording the buses as an asset on a balance sheet may produce tax benefits due to depreciation. This is usually tax deductible in many countries, but may vary depending on local accounting rules and regulations.
10. This shows only the proposal with project research language and does not necessarily reflect the actual model Santiago is going to adopt.
11. An articulated bus usually refers to a bus with two or more sections linked by a pivoting joint. A bi-articulated bus usually refers to an articulated bus with an extra section and two joints.
GLOSSARY Action: An act taken toward realizing a step (see “step” glossary definition below) of e-bus planning or implementation.
Barrier: An obstacle or circumstance that can prevent transit agencies and governments from initiating, continuing, or expanding their fleets of e-buses.
Development stage: The level of advancement of an e-bus program in a particular city. This report adopts five development stages, as shown in Table 1.
Electric bus (E-bus): A bus with a propulsion system that runs entirely on electricity, which is housed inside the bus in a battery (typically a lithium-ion battery). For this report, e-buses do not include buses that are powered by parallel electric infrastructure, such the overhead electric wires typically used to power trolley buses.
E-bus lifecycle: The overall processes required for e-bus adoption—including initial preparation, long-term planning, e-bus procurement, and operation and maintenance—and those for after buses reach the end of their useable lifespans.
E-bus pilot program: A project to explore e-bus technology, usually initiated and organized by a transit agency or government entity. E-bus pilot programs involve the procurement, testing, and operation of e-buses, typically with a limited number of e-buses and sometimes for a limited duration.
Emissions: All substances that are discharged in the air. For this report, this term usually refers to tailpipe emissions emitted by buses.
Enabler: An element (such as a policy or an action) that can help transit agencies and governments in initiating, continuing, or expanding their e-bus fleets.
Step: A distinct set of actions that helps achieve a planning or implementation goal.
Transit agencies and bus operating entities: These refer to the entities that provide public transport services to a region. The roles and names of these types of entities may differ in different places; in this report, the terminology is kept relatively vague. Normally, transit agencies (in some places, public transport authorities or bus companies) have the responsibility and capacity to regulate and plan public transport systems, with some of them also sharing the roles of bus operating entities. Bus operating entities, or bus operators, are usually responsible for operating and maintaining the buses, and procuring and reselling the buses at the end of their lifespans. The procurement and operational models and funding sources of bus operating entities depend on whether the entity is public or private.
REFERENCES BNEF (Bloomberg New Energy Finance). 2018. Electric Buses in Cities— Driving Towards Cleaner Air and Lower CO2. https://c40-production-images.s3.amazonaws.com/other_uploads/images/1726_BNEF_C40_Electric_buses_in_cities_FiNAL_APPROVED_(2).original.pdf?1523363881.
Buckingham, K., S. Ray, B. Arakwiye, A. G. Morales, R. Singh, O. Maneer-attana, S. Wicaksono, H. Chrysolite, A. Minnick, and L. Johnston. 2018. Mapping Social Landscapes: A Guide to Identifying the Networks, Priori-ties, and Values of Restoration Actors. Washington, DC: World Resources institute. https://wriorg.s3.amazonaws.com/s3fs-public/18_Guide_So-cialMapping_FiNAL3.pdf?_ga=2.121728075.1989315013.1554690110-29079707.1530758621.
C40 Cities Finance Facility. 2017. “Cities in Mexico Working Together to Transition to Electric Buses.” https://www.c40cff.org/news-and-events/cities-in-mexico-working-together-to-transition-to-electric-buses.
Casale, M., and B. Mahoney. 2018. Paying for Electric Buses: Financing Tools for Cities and Agencies to Ditch Diesel. U.S. PiRG Education Fund. https://uspirg.org/sites/pirg/files/reports/National - Paying for Electric Buses.pdf.
Cooper, E., E. Kenney, J. Miguel Velasques, X. Li, and T. Hein Tun. 2019. Costs and Emissions Appraisal Tool for Transit Buses. Washington, DC: World Resources institute. https://wriorg.s3.amazonaws.com/s3fs-public/costs-emissions-appraisal-tool-transit-buses.pdf?_ga=2.153840504.1989315013.1554690110-29079707.1530758621.
Covenant of Mayors. 2016. “İzmir Metropolitan Municipality Action Plan.” https://www.covenantofmayors.eu/about/covenant-community/signa-tories/action-plan.html?scity_id=8954.
DHi (Department of Heavy industry, india). 2017. “Notification.” New Delhi: Ministry of Heavy industries and Public Enterprises of the Gov-ernment of india. https://dhi.nic.in/writereaddata/UploadFile/inclusion of e bus in fame india scheme_1.PDF.
FTA (U.S. Federal Transit Administration). 2014. “FY13 Discretionary Funding Opportunity: Low or No Emission Vehicle Deployment Program (LoNo) Program.” Federal Register 79 (6): 1668–72. https://www.govinfo.gov/content/pkg/FR-2014-01-09/pdf/2014-00134.pdf.
FTA. 2015. “Fiscal Year 2015 Low and No-Emission Vehicle Deployment Program Projects.” Washington, DC. https://www.transit.dot.gov/research-innovation/fiscal-year-2015-low-and-no-emission-vehicle-deployment-program-projects.
FTA. 2018. “Fiscal Year 2018 Low or No-Emission (Low-No) Bus Program Projects.” Washington, DC. https://www.transit.dot.gov/funding/grants/fiscal-year-2018-low-or-no-emission-low-no-bus-program-projects.
FTA. 2019. “Low or No Emission Vehicle Program - 5339(C).” https://www.transit.dot.gov/funding/grants/lowno.
61How to Enable Electric Bus Adoption in Cities Worldwide
Fitzgerald, G., C. Nelder, and J. Newcomb. 2016. Electric Vehicles as Distributed Energy Resources. Rocky Mountain institute. https://rmi.org/wp-content/uploads/2017/04/RMi_Electric_Vehicles_as_DERs_Fi-nal_V2.pdf.
Gallet, M., T. Massier, and T. Hamacher. 2018. “Estimation of the Energy Demand of Electric Buses Based on Real-World Data for Large-Scale Public Transport Networks.” Applied Energy 230: 344–56. https://doi.org/https://doi.org/10.1016/j.apenergy.2018.08.086.
Gnann, T., S. Funke, N. Jakobsson, P. Plötz, F. Sprei, and A. Bennehag. 2018. “Fast Charging infrastructure for Electric Vehicles: Today’s Situation and Future Needs.” Transportation Research Part D 62 (March): 314–29. https://doi.org/10.1016/j.trd.2018.03.004.
Guangzhou Daily. 2015. “Shenzhen PM 2.5 Reduced Significantly in 10 Years.” April 28. http://www.pm25.com/news/766.html.
Herrera, C. 2015. “Chile Commits to 30 Percent Reduction of Greenhouse Gas Emissions by 2030” (blog) May 3. Natural Resources Defense Coun-cil. https://www.nrdc.org/experts/carolina-herrera/chile-commits-30-percent-reduction-greenhouse-gas-emissions-2030.
The Hindu. 2017. “Goldstone infratech’s Electric Bus Joins HRTC Fleet,” September 23. https://www.thehindu.com/news/cities/Hyderabad/goldstone-infratechs-electric-bus-joins-hrtc-fleet/article19738227.ece.
iEA (international Energy Agency). 2014. “Electric Power Consumption (kWh per Capita).” Organisation for Economic Co-operation and Development/international Energy Agency via the World Bank. https://data.worldbank.org/indicator/EG.USE.ELEC.KH.PC.
iEA. 2018. Global EV Outlook 2018.
Li, X., S. Castellanos, and A. Maassen. 2018. “Emerging Trends and innovations for Electric Bus Adoption—a Comparative Case Study of Contracting and Financing of 22 Cities in the Americas, Asia-Pacific, and Europe.” Research in Transportation Economics 69 (August): 470–81. https://doi.org/10.1016/j.retrec.2018.06.016.
Lu, L., L. Xue, and W. Zhou. 2018. “How Did Shenzhen, China Build World’s Largest Electric Bus Fleet?” (blog) April 4. World Resources institute. http://www.wri.org/blog/2018/04/how-did-shenzhen-china-build-world-s-largest-electric-bus-fleet.
Mahmoud, M., R. Garnett, M. Ferguson, and P. Kanaroglou. 2016. “Electric Buses: A Review of Alternative Powertrains.” Renewable and Sustain-able Energy Reviews 62 (September): 673–84. https://doi.org/10.1016/j.rser.2016.05.019.
Ministry of Finance (China). 2015. “Notice on Financial Supporting Poli-cies for NEV Promotion from 2016-2020.” Beijing. http://www.mof.gov.cn/gp/xxgkml/jjjss/201504/t20150429_2512151.html.
Ministry of industry and information Technology (China). 2017. “Parallel Administration of the Corporate Average Fuel Consumption (CAFC) and New Energy Vehicle (NEV) Credits.” Beijing. http://www.miit.gov.cn/n1146290/n4388791/c5826378/content.html.
Moghaddam, Z., i. Ahmad, D. Habibi, and Q. V. Phung. 2018. “Smart Charging Strategy for Electric Vehicle Charging Stations.” IEEE Transactions on Transportation Electrification 4 (1): 76–88. https://doi.org/10.1109/TTE.2017.2753403.
National Green Tribunal. 2014. “Application No. 237 (THC)/2013.” http://greentribunal.gov.in/Writereaddata/Downloads/237_2013(THC)(App)6Feb2014_final_order.pdf.
Orbea, J. 2018. “How Santiago de Chile Became a Global Leader on Elec-tric Buses” (blog) December 18. The City Fix, World Resources institute. https://thecityfix.com/blog/santiago-de-chile-became-global-leader-electric-buses-jone-orbea/.
Orbea, J., S. Castellanos, C. Albuquerque, R. Sclar, and B. Pinheiro. 2019. “Adapting Procurement Models for Electric Buses in Latin America.” 19–03907R1. Washington, DC: World Resources institute.
PPiAF. 2006. “Urban Bus Toolkit, Benchmarks and indicators.” https://ppiaf.org/sites/ppiaf.org/files/documents/toolkits/UrbanBus-Toolkit/assets/1/1c/1c7.html.
PTi (Press Trust of india). 2019. “Cabinet Clears Rs 10,000 Crore FAME ii Scheme.” India Times, updated February 28. https://timesofindia.india-times.com/business/india-business/cabinet-clears-rs-10000-crore-fame-ii-scheme/articleshow/68207816.cms.
Resmi Gazete. 2011. “Health insurance Law Amendments [Original in Turkish].” http://www.resmigazete.gov.tr/eskiler/2011/02/20110225M1-1.htm.
Sclar, R., C. Gorguinpour, S. Castellanos, and X. Li. 2019. Barriers to Adopting Electric Buses. Washington, DC: World Resources institute.
Shenzhen Municipality Transport Commission. 2017. “Low Carbon Traffic and Green Travel, introduction of New Energy City Bus in Shenzhen.” Shenzhen.
Shenzhen Transport Bureau. 2017. “Shenzhen Will Achieve 100% Bus Electrification in September.” Shenzhen. http://www.sztb.gov.cn/pcjt/zhjt/201708/t20170807_8067058.htm.
SLoCaT (Partnership on Sustainable Low Carbon Transport). 2019. “E-Mobility Trends and Targets.” http://Slocat.Net/Sites/Default/Files/e-Mobility_overview.Pdf.
Stringer, D., and J. Ma. 2018. “Where 3 Million Electric Vehicle Batteries Will Go When They Retire.” Bloomberg Businessweek, June 28. https://www.bloomberg.com/news/features/2018-06-27/where-3-mil-lion-electric-vehicle-batteries-will-go-when-they-retire.
TransMilenio. 2018. “The Pre-proposals for the Tender in TransMilenio Have Been Published.” Bogotá, Colombia: TransMilenio. 2018. https://www.transmilenio.gov.co/publicaciones/150008/publicacione-spublicados_los_prepliegos_para_la_licitacion_en_transmilenio/.
USDOT (United States Department of Transportation). 2016. “Zero Emis-sions Bus Benefits.” https://www.transportation.gov/r2ze/benefits-zero-emission-buses.
Valdez, i. 2016. “in 2017, the First Electric Buses Will Arrive at the CdMx.” Milenio, December 5. https://www.milenio.com/estados/en-2017-llega-ran-los-primeros-autobuses-electricos-a-la-cdmx.
Xinhua News. 2017. “Shenzhen Public Transit Reached Full Electrifica-tion, Number of Pure Battery Electric Taxi is over 10 Thousand.” http://www.xinhuanet.com/2017-12/27/c_1122176505.htm.
ABOUT WRiWorld Resources institute is a global research organization that turns big ideas into action at the nexus of environment, economic opportunity, and human well-being.
Our Challenge
Natural resources are at the foundation of economic opportunity and human well-being. But today, we are depleting Earth’s resources at rates that are not sustainable, endangering economies and people’s lives. People depend on clean water, fertile land, healthy forests, and a stable climate. Livable cities and clean energy are essential for a sustainable planet. We must address these urgent, global challenges this decade.
Our Vision
We envision an equitable and prosperous planet driven by the wise management of natural resources. We aspire to create a world where the actions of government, business, and communities combine to eliminate poverty and sustain the natural environment for all people.
Our Approach
COUNT iT
We start with data. We conduct independent research and draw on the latest technology to develop new insights and recommendations. Our rigorous analysis identifies risks, unveils opportunities, and informs smart strategies. We focus our efforts on influential and emerging economies where the future of sustainability will be determined.
CHANGE iT
We use our research to influence government policies, business strategies, and civil society action. We test projects with communities, companies, and government agencies to build a strong evidence base. Then, we work with partners to deliver change on the ground that alleviates poverty and strengthens society. We hold ourselves accountable to ensure our outcomes will be bold and enduring.
SCALE iT
We don’t think small. Once tested, we work with partners to adopt and expand our efforts regionally and globally. We engage with decision-makers to carry out our ideas and elevate our impact. We measure success through government and business actions that improve people’s lives and sustain a healthy environment.
PHOTO CREDiTSCover photo: Secretaría de Movilidad de Medellín; table of contents: ian Muttoo; foreword: Maximus Yang; p. 2: Ken Shimoda; p. 9: Hans Johnson; p. 14: Deensel; p. 16: SolarPVTV; p. 20–21: (left) Benoit Colin; (middle) Jo Sau; (right) Volvo Electric City; p. 28: Jo Sau; p. 32–34: (left) Gordon Werner; (middle) ian Halsey MMXii; (right) BeyondDC; p. 36: Flickr/@ruich_whx; p. 40: BeyondDC; p. 50: Hans Johnson.
ABOUT WRi ROSS CENTER FOR SUSTAiNABLE CiTiESWRi Ross Center for Sustainable Cities helps create accessible, eq-uitable, healthy and resilient urban areas for people, businesses and the environment to thrive. Together with partners, it enables more connected, compact and coordinated cities. The Center expands the transport and urban development expertise of the EMBARQ network to catalyze innovative solutions in other sectors, including buildings, land use, energy and water. it combines the research excellence of WRi with 15 years of on-the-ground impact through a network of more than 250 experts working from Brazil, China, Ethiopia, india, Mexico and Turkey to make cities around the world better places to live. More information at www.wrirosscities.org.
63How to Enable Electric Bus Adoption in Cities Worldwide
Copyright 2019 World Resources institute. This work is licensed under the Creative Commons Attribution 4.0 international License. To view a copy of the license, visit http://creativecommons.org/licenses/by/4.0/. The material in this work is subject to copyright.
Each World Resources institute report represents a timely, scholarly treatment of a subject of public concern. WRi takes responsibility for choosing the study topics and guaranteeing its authors and researchers freedom of inquiry. it also solicits and responds to the guidance of advisory panels and expert reviewers. Unless otherwise stated, however, all the interpretation and findings set forth in WRi publications are those of the authors.
Maps are for illustrative purposes and do not imply the expression of any opinion on the part of WRi, concerning the legal status of any country or territory or concerning the delimitation of frontiers or boundaries.
WRIRossCities.org 64
10 G STREET NE SUiTE 800WASHiNGTON, DC 20002, USA+1 (202) 729-7600WWW.WRi.ORG iSBN 978-1-56973-959-4

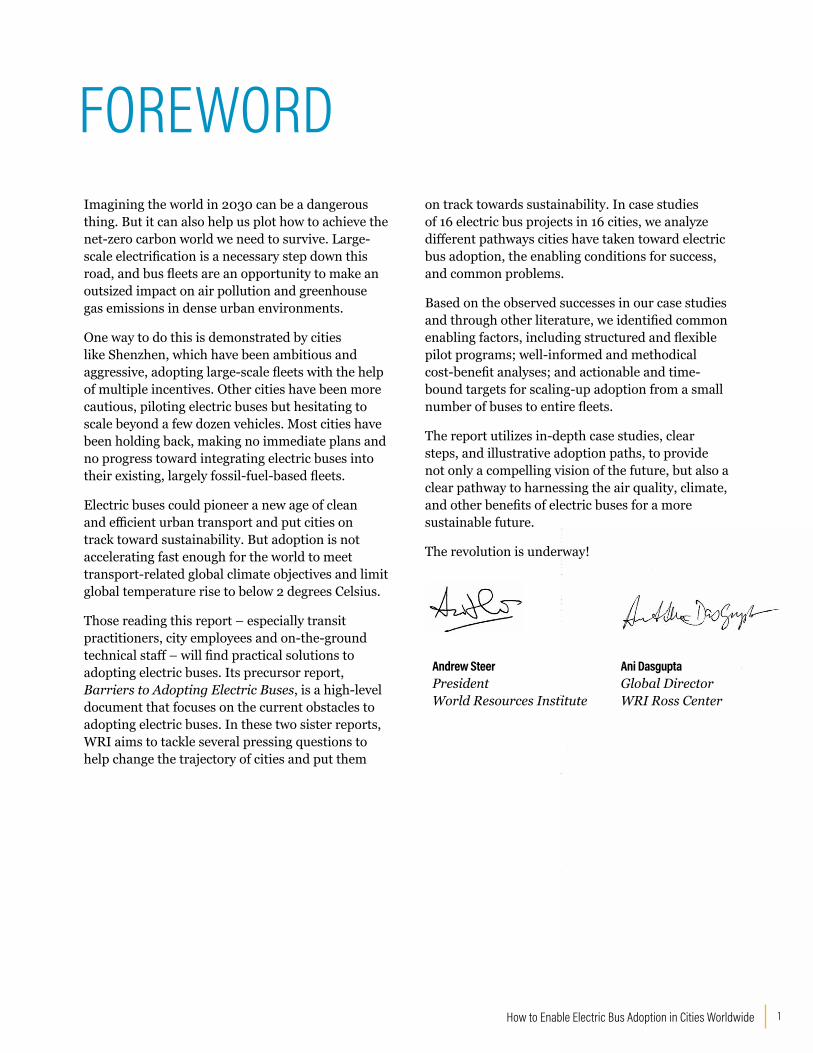
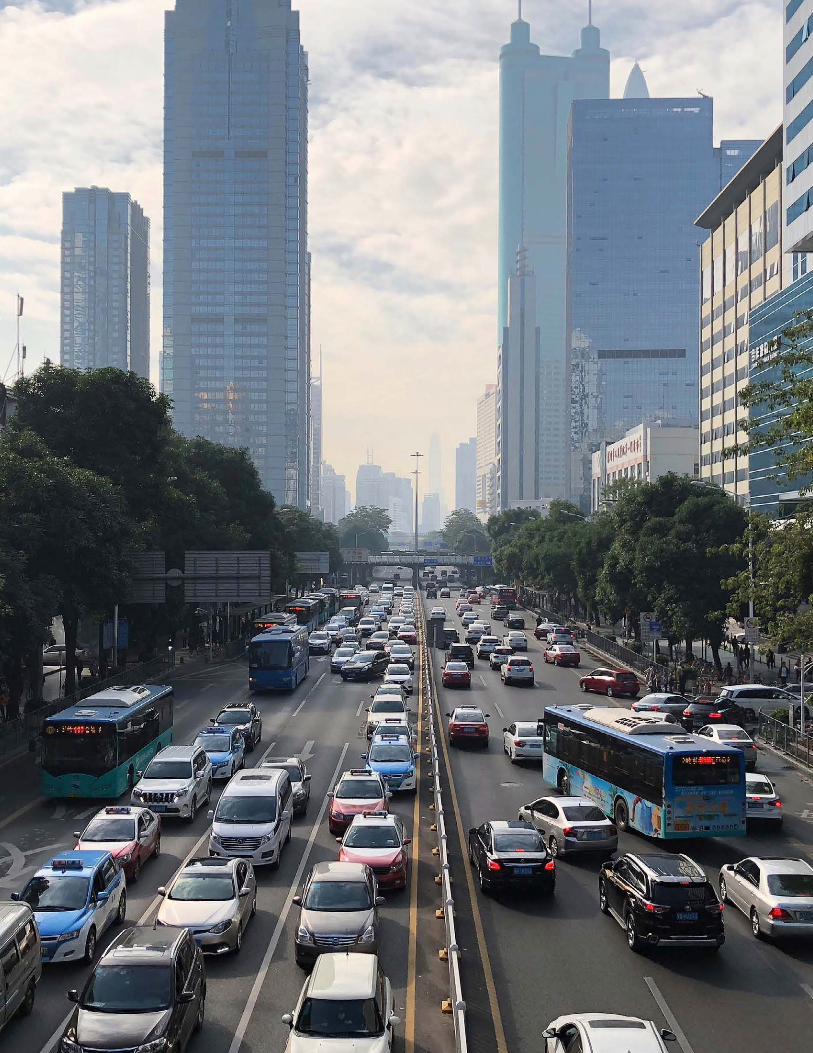

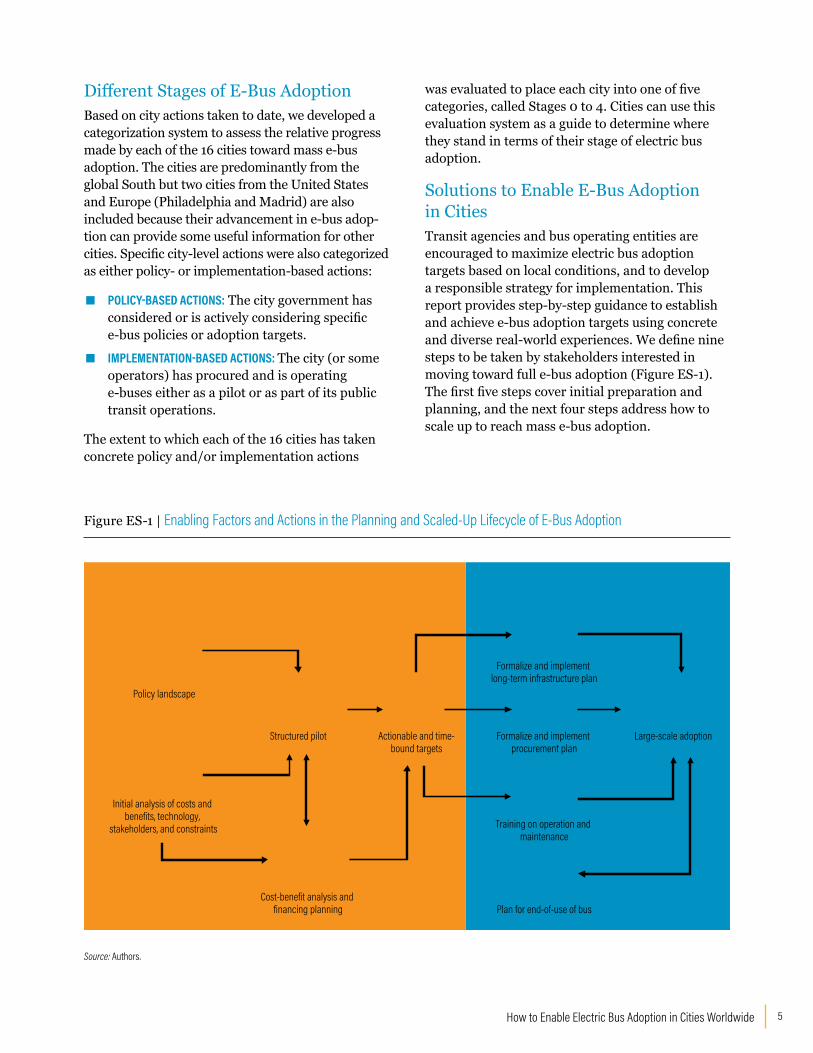

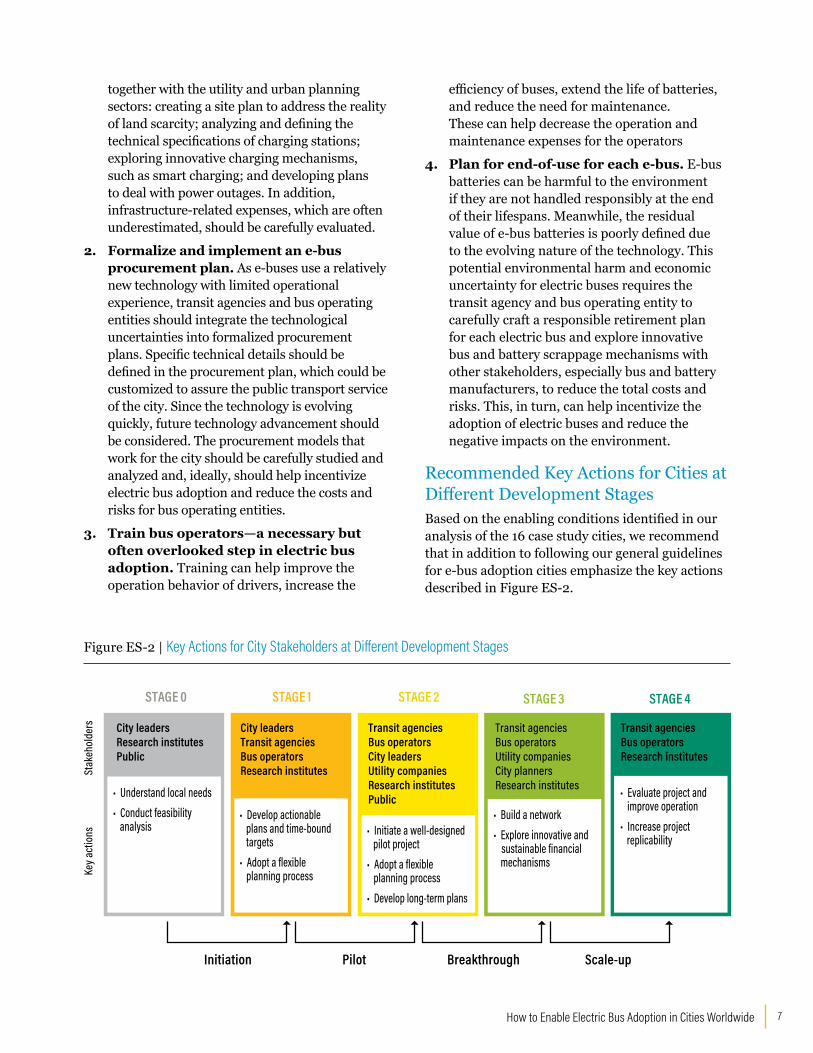
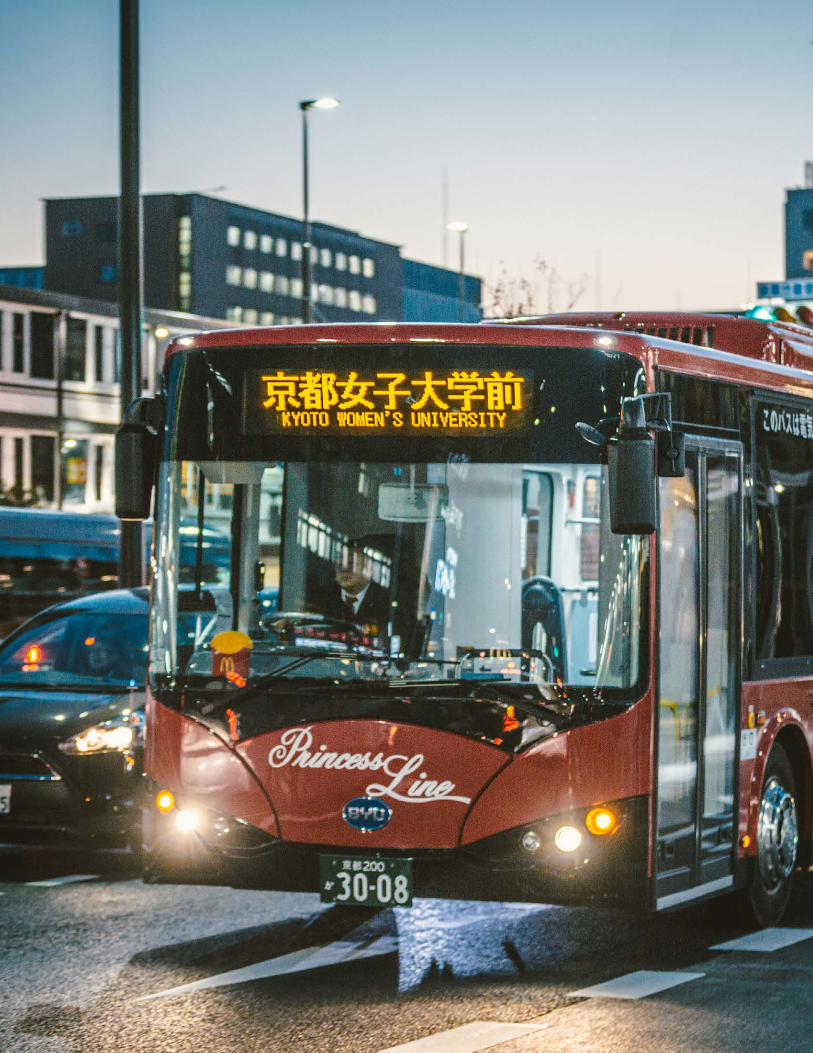

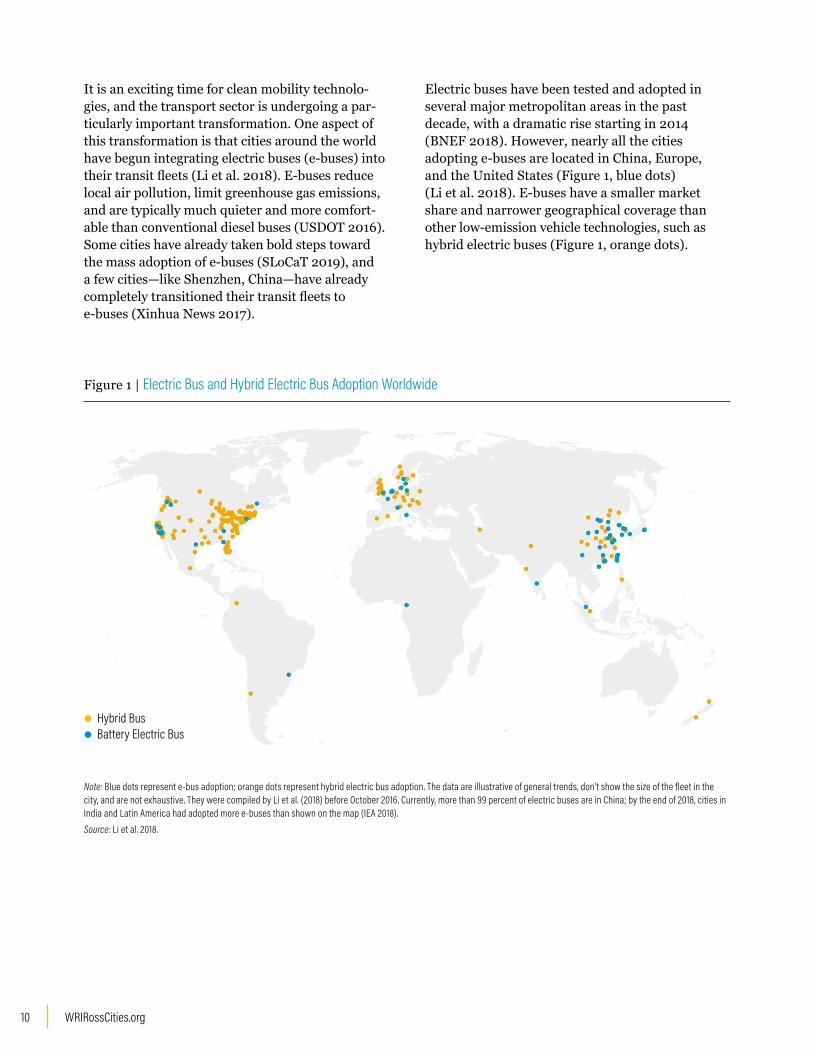


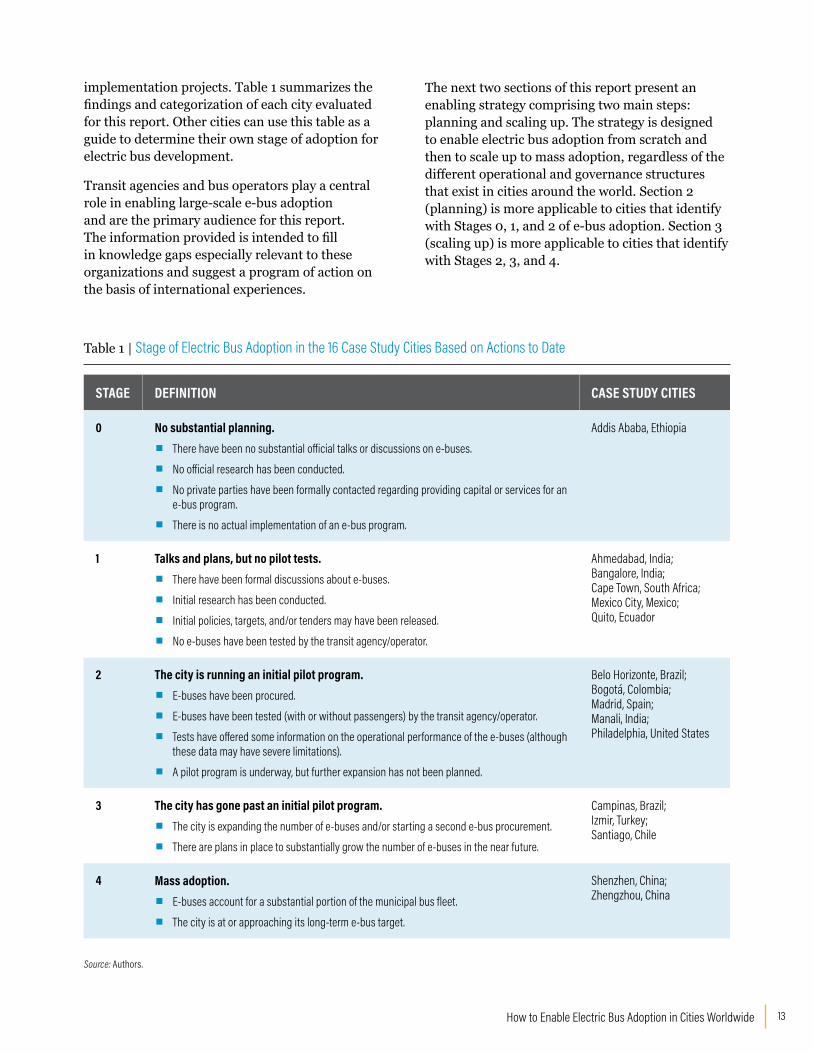


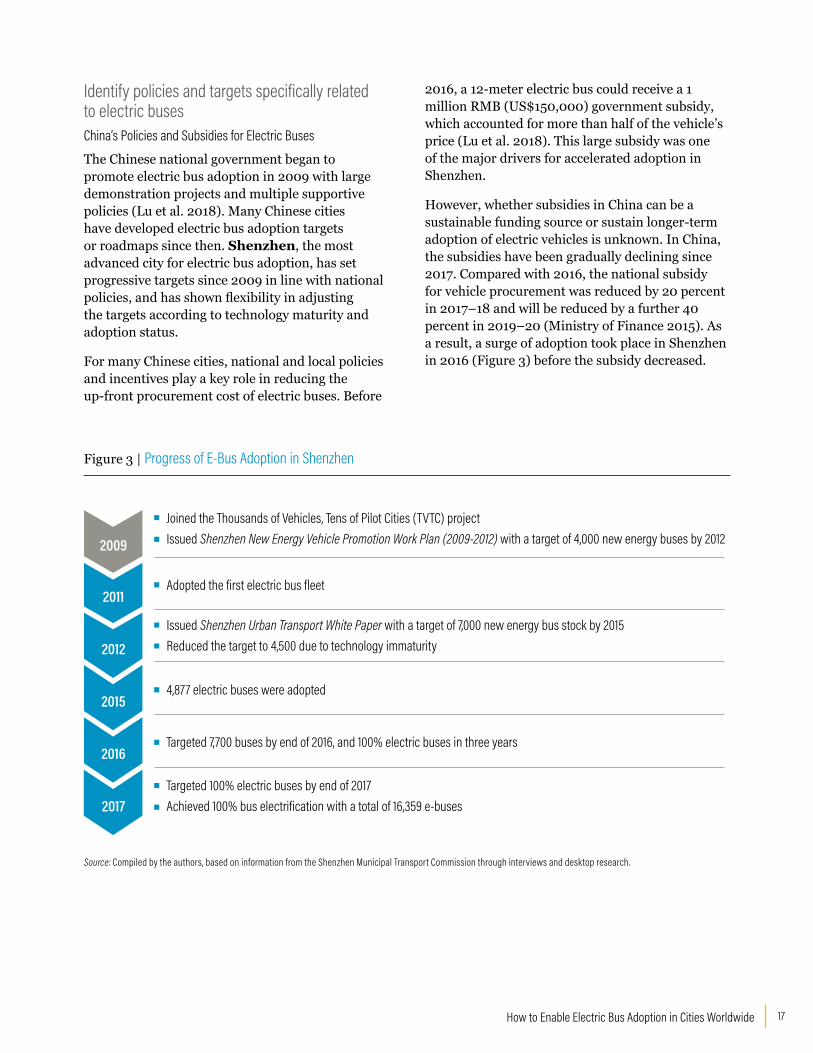
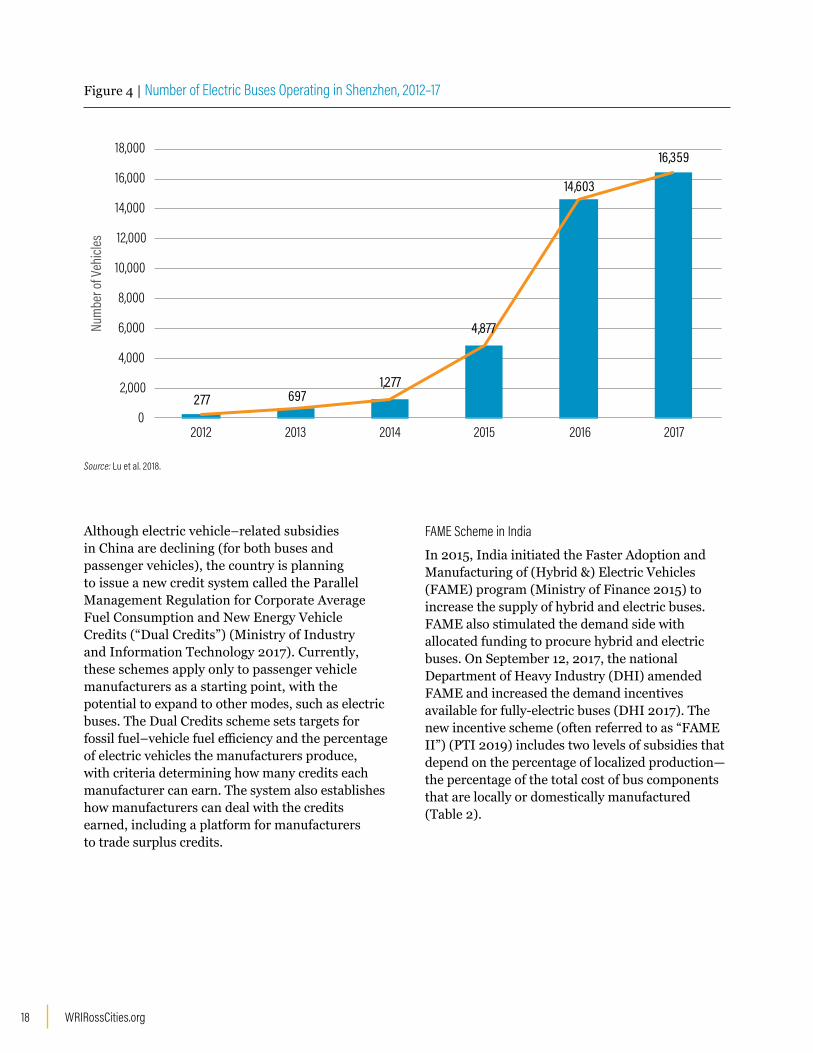


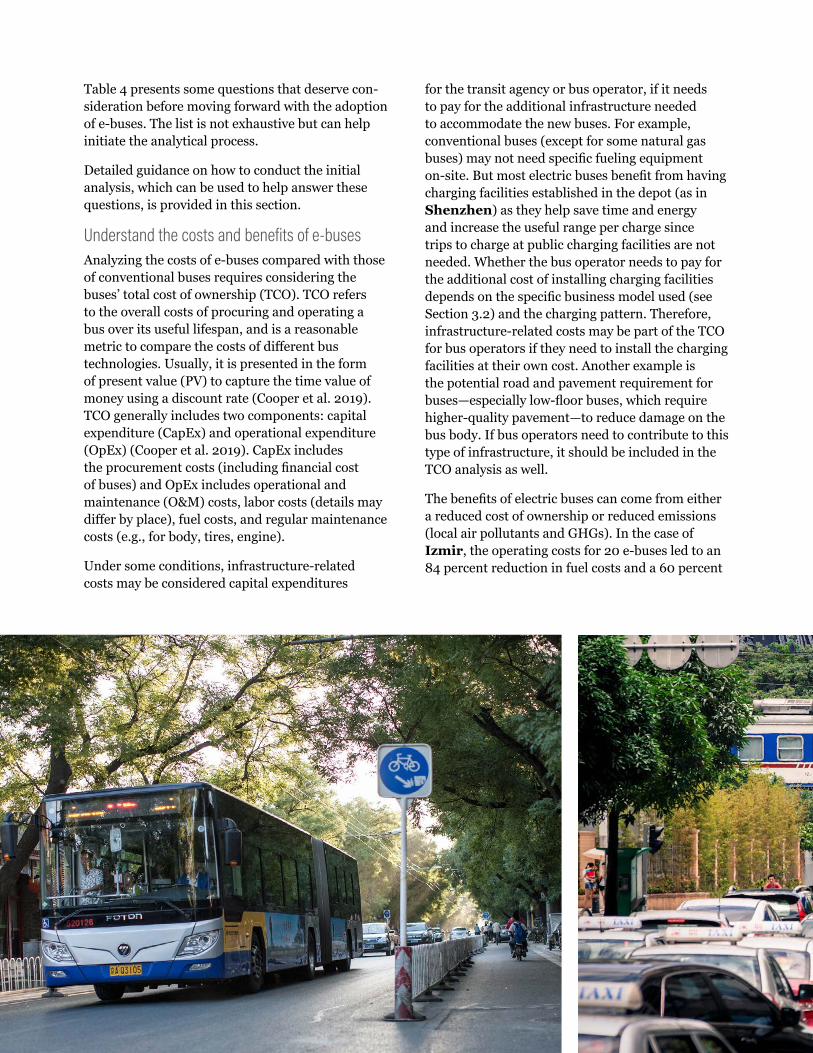

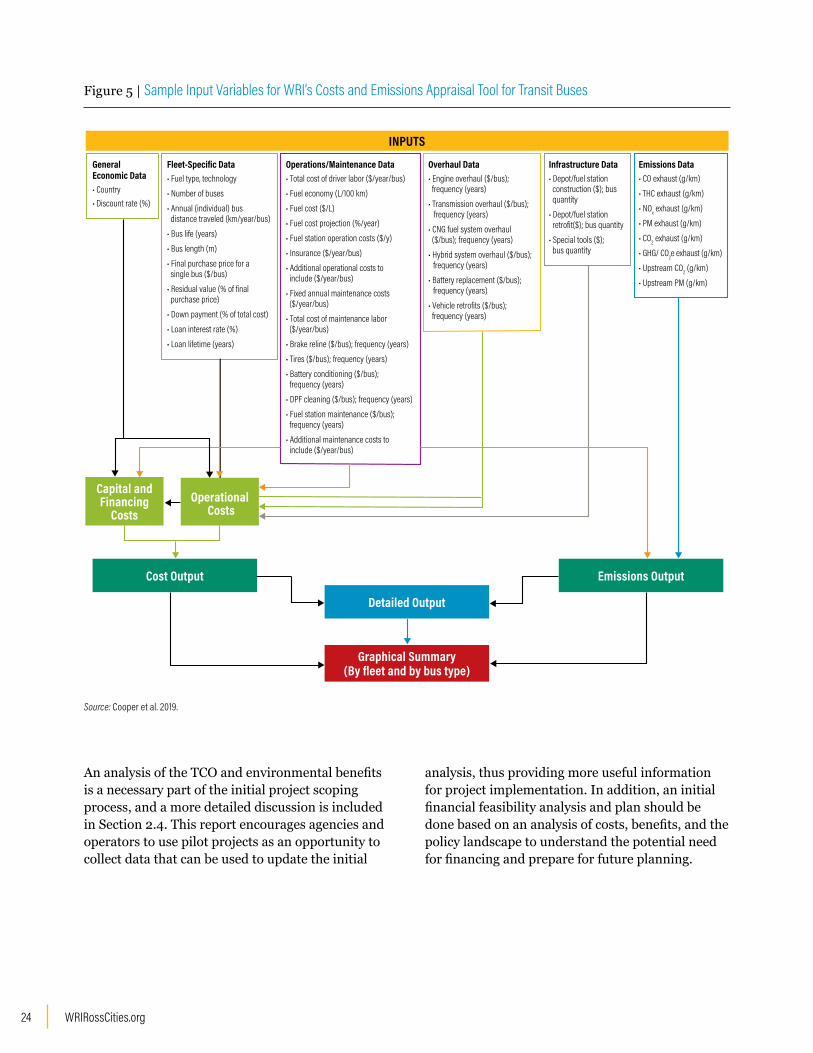
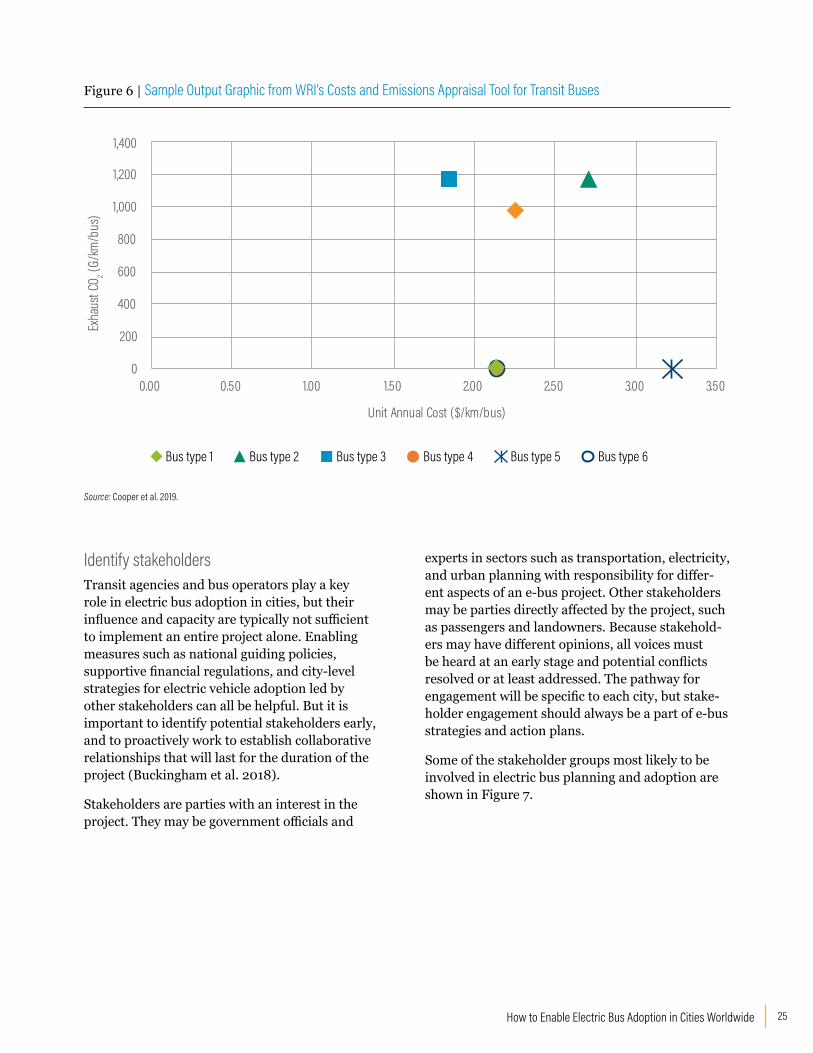

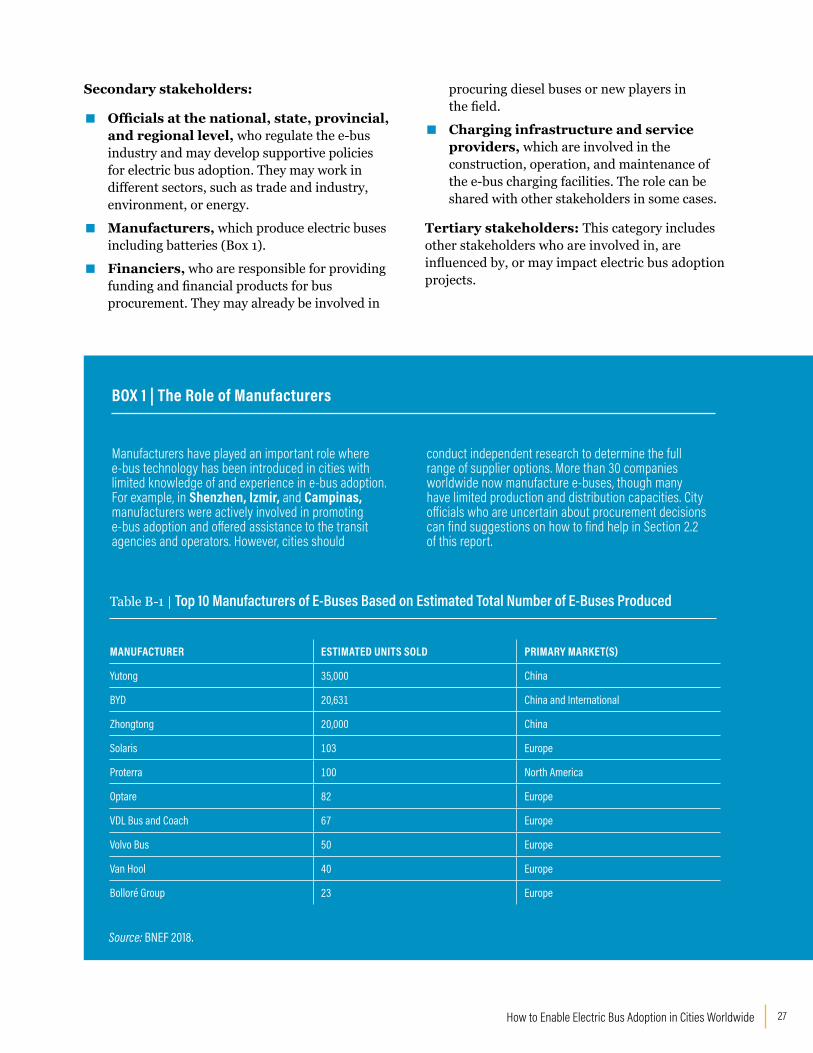


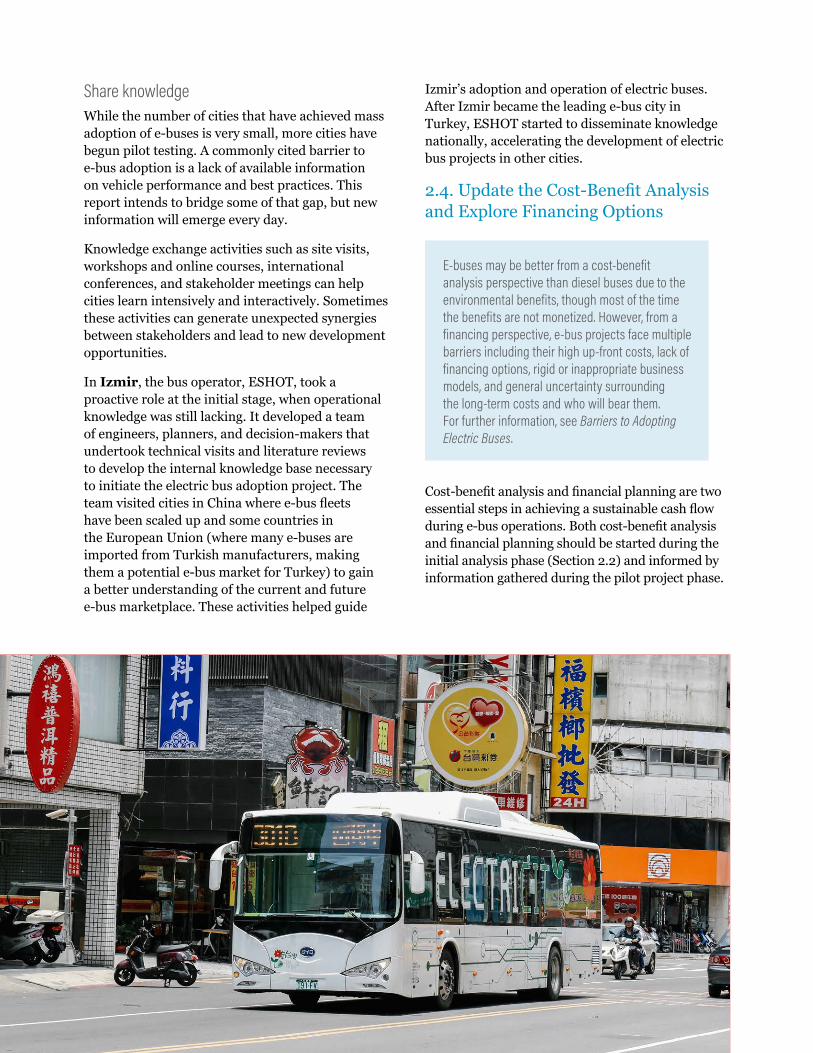
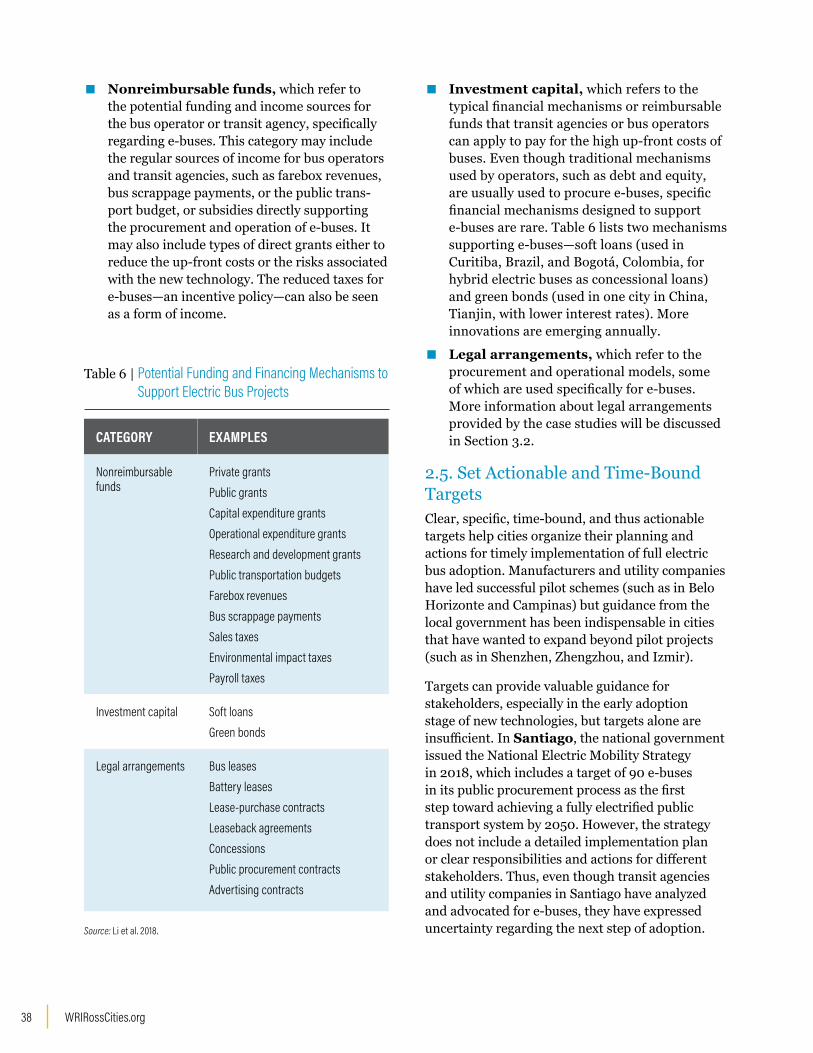
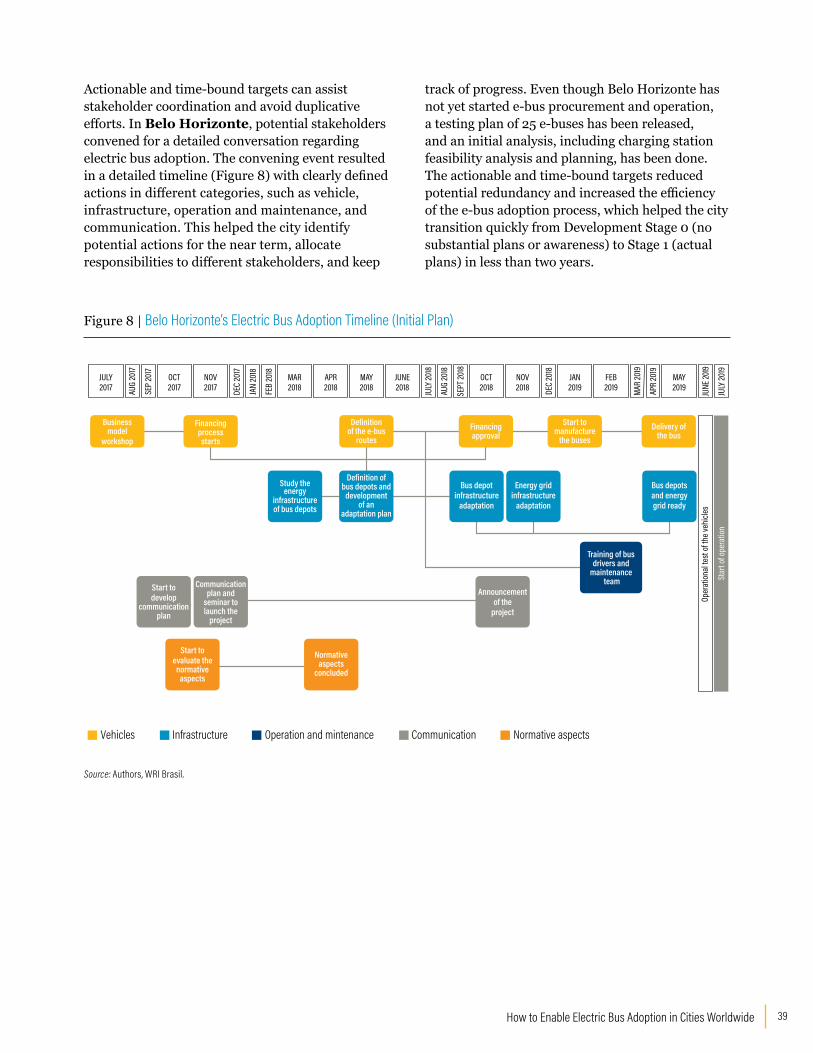
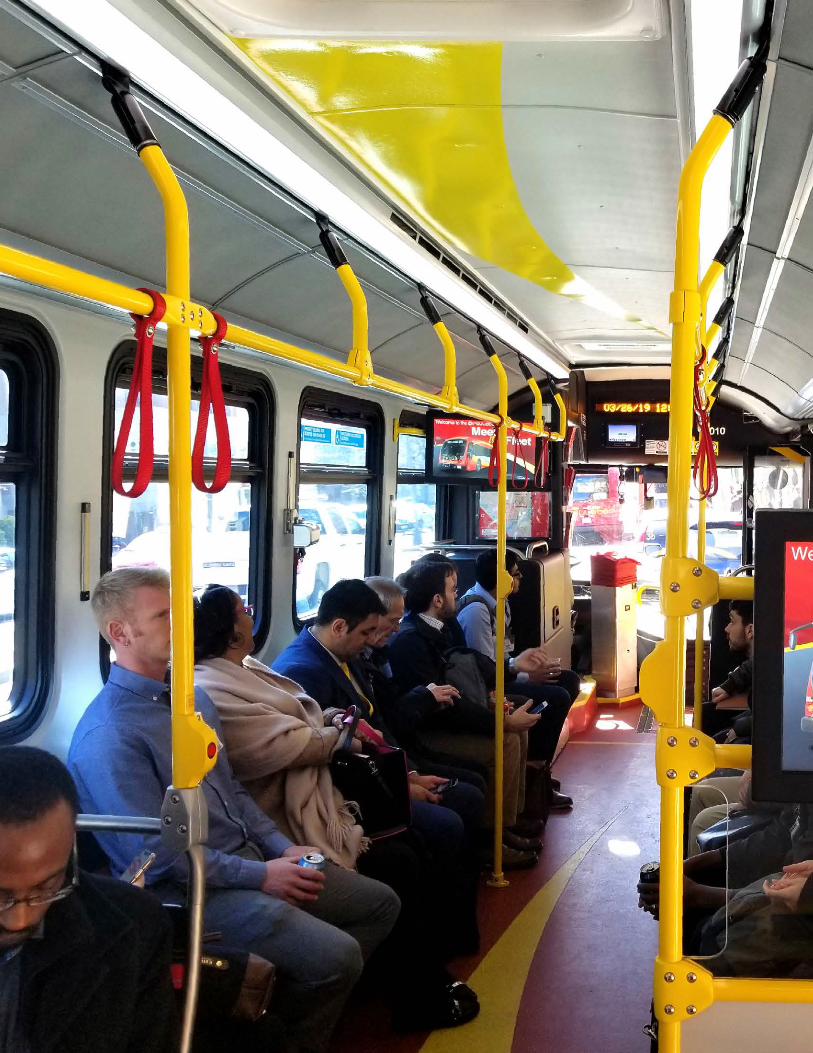


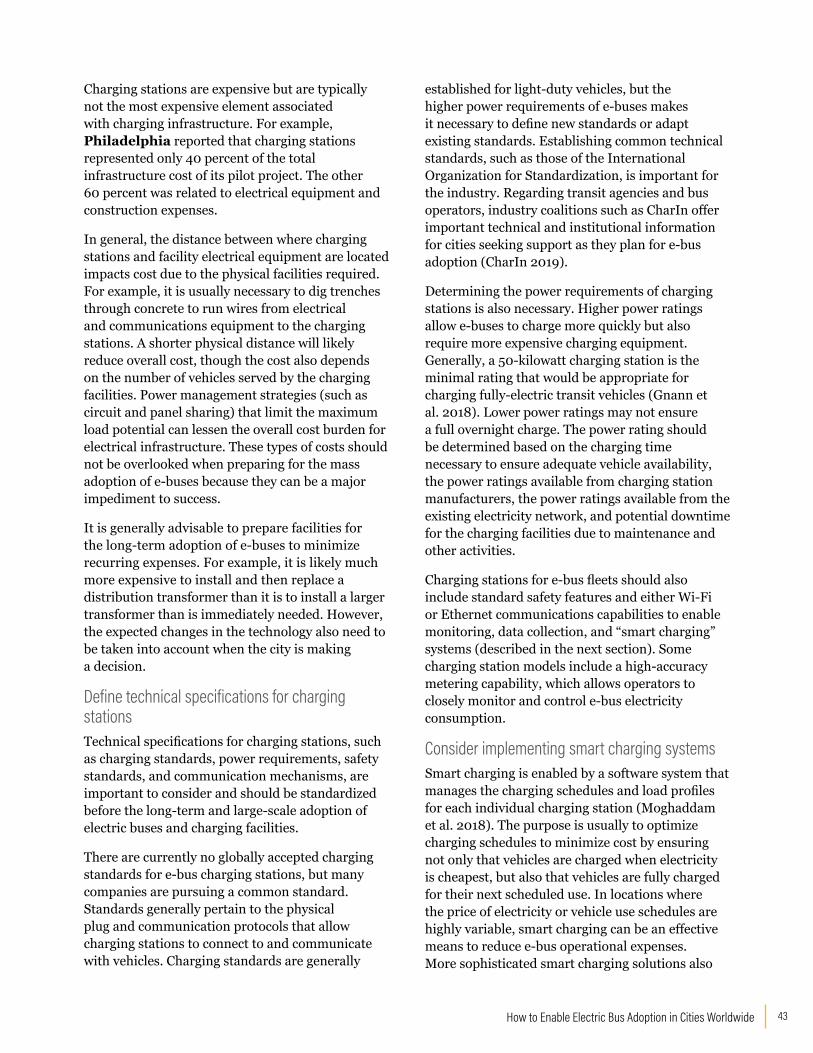


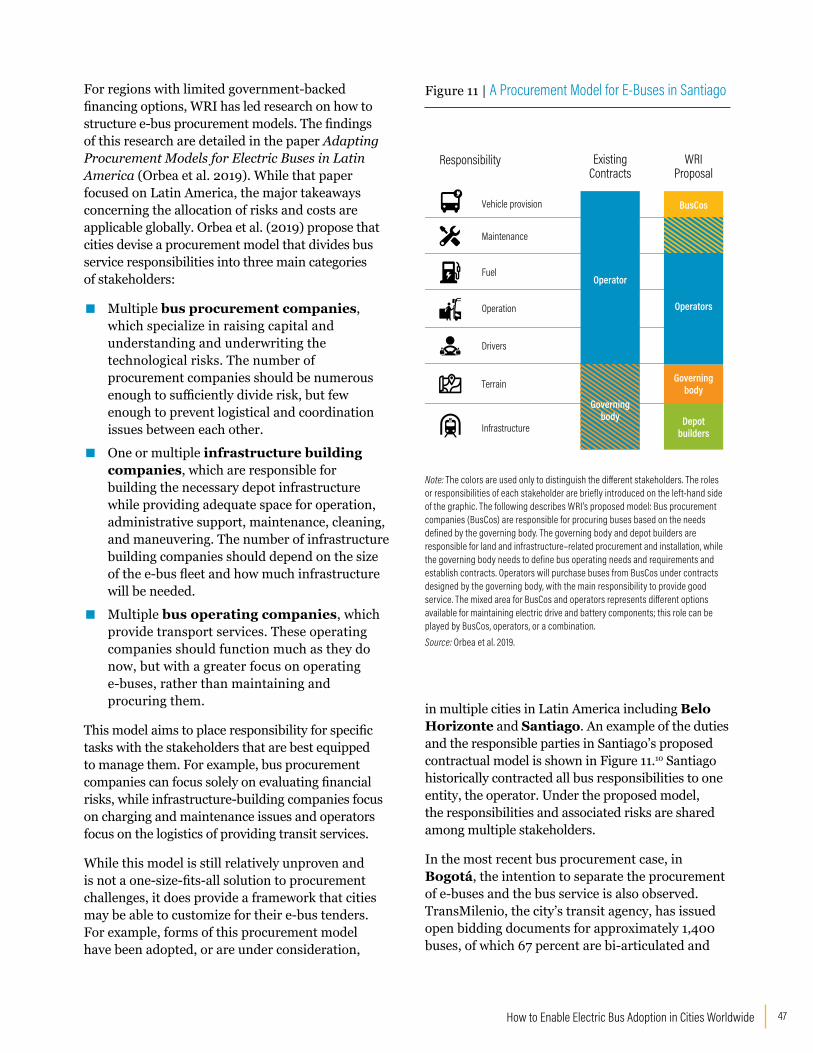

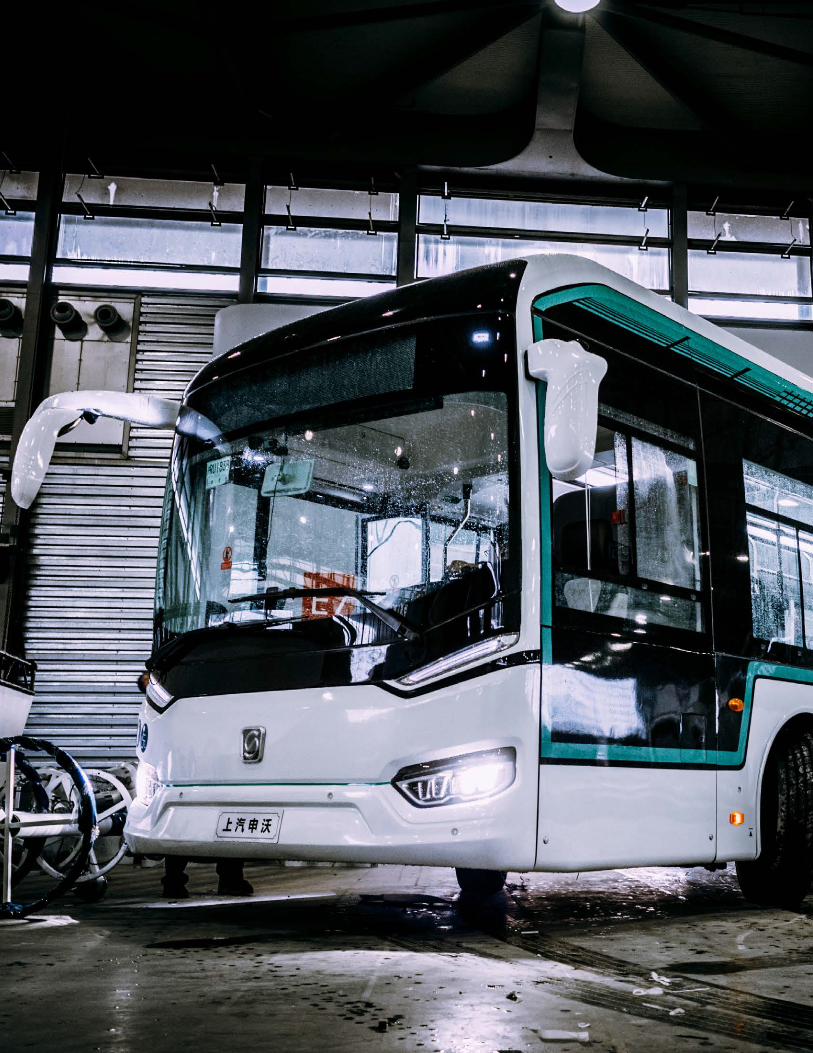
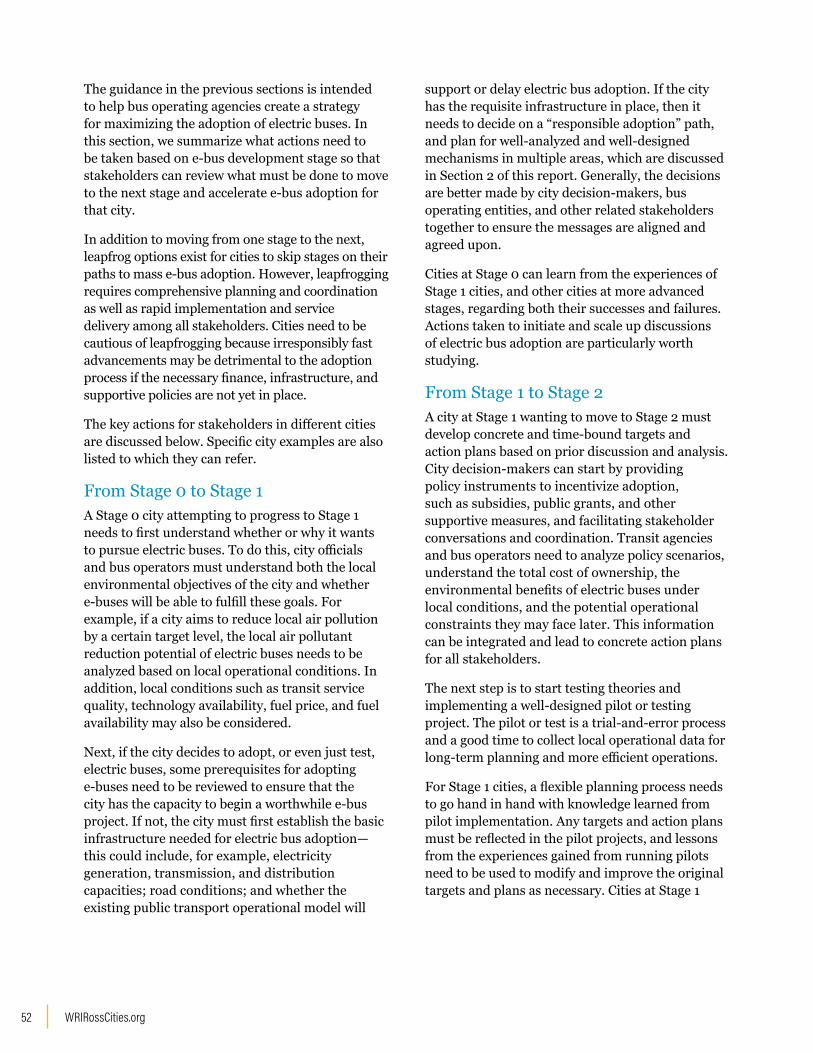
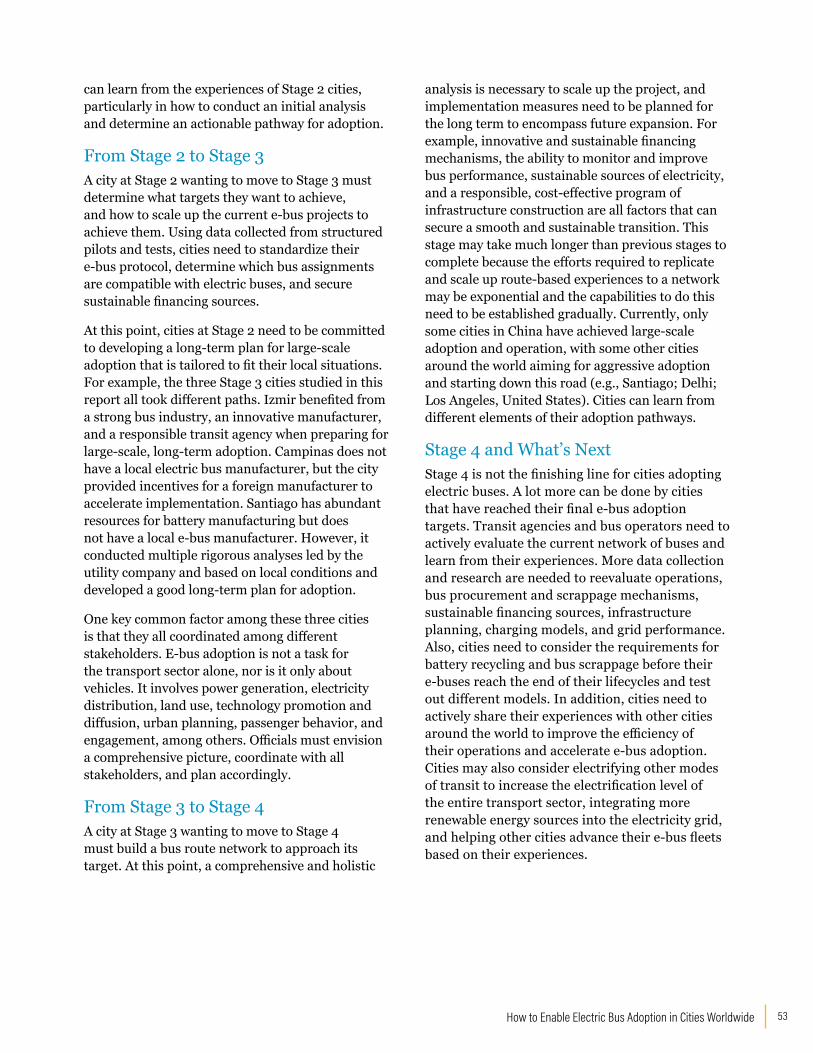

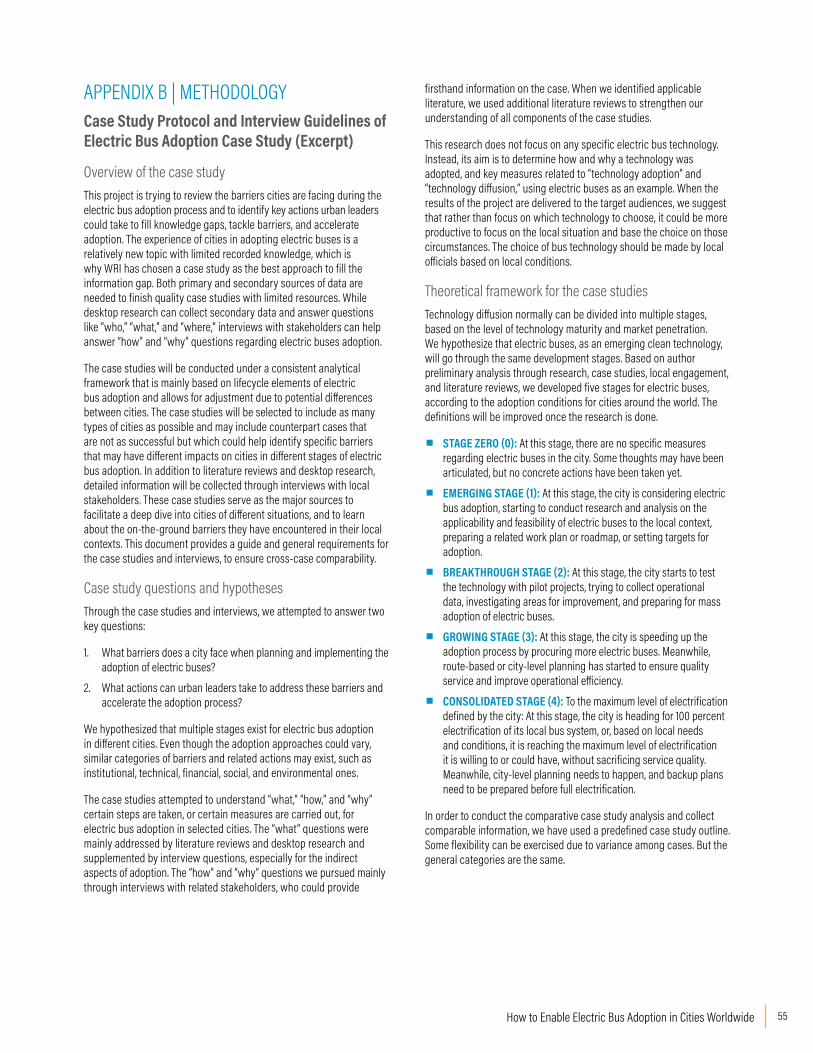

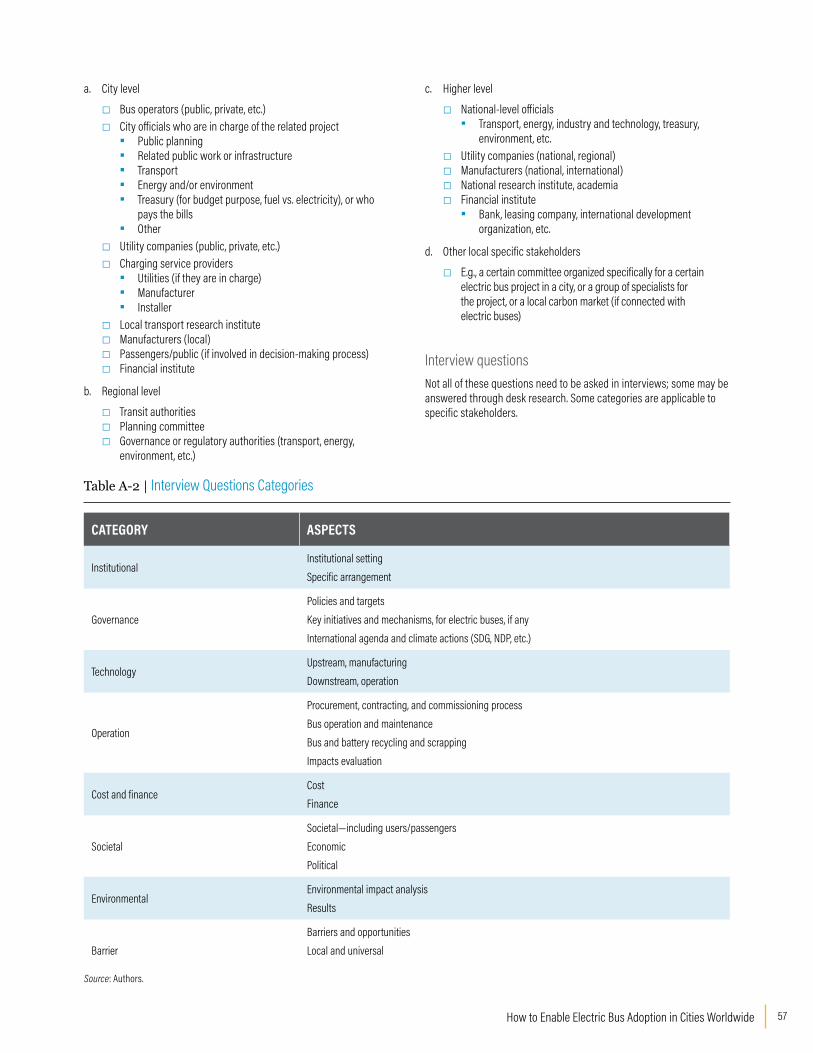


![[Bos Lines ] Bus Lines (Conl'd) ) Buses—CliarlBr ] [Buses ...](https://static.documents.pub/doc/80x56/61cb52f5cae34a654467d956/bos-lines-bus-lines-conld-busescliarlbr-buses.jpg)
