NDLERF Funded by the National Drug Law Enforcement Research Fund An Initiative of the National Drug Strategy Drug and Alcohol intoxication and Subsequent Harm in night-time Entertainment Districts (DASHED) Executive summary Professor Peter Miller, Associate Professor Raimondo Bruno, Anthony Morgan, Richelle Mayshak, Elise Cox, Dr Kerri Coomber, Dr Nicolas Droste, Nicholas Taylor, Nicolette Dimitrovski, Dr Amy Peacock, Hayley Boxall and Isabella Voce Monograph Series No. 67
Transcript
NDLERF
Funded by the National Drug Law Enforcement Research Fund An Initiative of the National Drug Strategy
Drug and Alcohol intoxication and Subsequent Harm in night-time Entertainment Districts (DASHED)
Executive summary
Professor Peter Miller, Associate Professor Raimondo Bruno, Anthony Morgan, Richelle Mayshak, Elise Cox, Dr Kerri Coomber, Dr Nicolas Droste,
Nicholas Taylor, Nicolette Dimitrovski, Dr Amy Peacock, Hayley Boxall and Isabella Voce
Monograph Series No. 67
Drug and Alcohol intoxication and Subsequent Harm in night-time
Entertainment Districts (DASHED)
Executive summary
Professor Peter Miller Associate Professor Raimondo Bruno
Anthony Morgan Richelle Mayshak
Elise Cox Dr Kerri Coomber Dr Nicolas Droste Nicholas Taylor
Nicolette Dimitrovski Dr Amy Peacock
Hayley Boxall Isabella Voce
Funded by the National Drug Law Enforcement Research Fund, an initiative of the National Drug Strategy
Produced by the National Drug Law Enforcement Research Fund (NDLERF)GPO Box 1936, Canberra, Australian Capital Territory 2601
This work is copyright. Apart from any use as permitted under the Copyright Act 1968, no part may be reproduced by any process without prior written permission from the Commonwealth available from the National Drug Law Enforcement Research Fund. Requests and enquiries concerning reproduction and rights should be addressed to the National Drug Law Enforcement Research Fund, GPO Box 1936, Canberra, Australian Capital Territory 2601.
Opinions expressed in this publication are those of the authors and do not necessarily represent those of the National Drug Law Enforcement Research Fund (NDLERF) Board of Management or the Australian Government Department of Health and Ageing.
The research on which this report is based was funded by the National Drug Law Enforcement Research Fund, an initiative of the National Drug Strategy.
v
Acronyms
Acronyms
AmED alcohol mixed with energy drink
BAC blood alcohol concentration
CBD central business district
DANTE Dealing with Alcohol-related harm in the Night-Time Economy
DASHED Drug and Alcohol intoxication and Subsequent Harm in night-time Entertainment Districts
ED emergency department
HAH high alcohol hours
NDLERF National Drug Law Enforcement Research Fund
NEP night-time entertainment precinct
POINTED Patron Offending and Intoxication in Night-Time Entertainment Districts
RTT Regional Targeting Team
RSA responsible service of alcohol
vi
Drug and alcohol intoxication and subsequent harm in night-time entertainment districts (DASHED)
Acknowledgements
The authors thank Debra Salter (Tasmania Police), Detective Superintendent Jim Migro (WA Police), Superintendent Anthony Cooke (NSW Police Force) and Katalina Bradley (NDLERF) for their continued support and advice.
This project would not have happened without David Pryce from the ACT Justice and Community Safety Directorate (previously ACT Policing).
The authors especially thank Ashley Byron (ACT Policing), Toby Keene (ACT Ambulance Service), Rohan Peek (Environment Protection Authority, ACT), Robert Southwell (liquor licensing, ACT), Alexander Wilson (Ambulance Tasmania), Jeramie Sprong (Department of Health and Human Services, Tasmania), Peter Mansfield (Department of Health and Human Services, Tasmania), Jacquie Shea (Department of Treasury and Finance, Tasmania), Peter Ryan (Environmental Protection Authority, ACT), Julie Searle (ACT Health) and Renuka Umbarkar (ACT Health) for providing access to data.
The Hobart team particularly thanks Bridgette Chapman and Assistant Commissioner Richard Cowling from Tasmania Police for their support of the project.
The Canberra team thanks Sergeant James Edwards, Sergeant David Power and Constable Russell Kafer for supporting the project and, in particular, their interviewing, observational fieldwork, and collecting place-of-last-drink data.
The authors also particularly thank the project’s interview and observations teams:
Hobart: Amelia VanderNiet, Bethany Lusk, Caitlin Turner, Jacqui McCoy, Jess Forward, Matthew Wade, Sian Balmer, Stephanie Gough and Thomas Norman.
Canberra: Penny Jorna, Samantha Lyneham, Monica Boyle, Maggie Coughlan, Willow Bryant, Lucy Althorpe, Lauren Renshaw, Madeleine Kapira, Isabella Voce, Simon Ng, Courtney Brown, Georgina Fuller, Georgia Kirton, Lucienne Pratt, Tashena Biffanti, Don Maxim, Fiona Montgomery, Matthew Musgrave, Katie Skinner, Nadienne Roffey, Clair Chapman, Emili Maricic, Georgia Pelle and Aidan Wanna.
Peter Miller especially thanks Kate McLachlan (nee Hall) for her indispensable help, keen eye for detail, her forgiving nature, and her cheerful presence.
1
Executive summary
Executive summary
This project—Drug and Alcohol Intoxication and Subsequent Harm in night-time Entertainment Districts (DASHED)—used an innovative research design by collecting data within the night-time economy. As a mixed-methods cross-sectional study it used three techniques to collect data about consumers during an episode of alcohol and other drug use:
• short patron interviews with people entering or leaving licensed venues;
• sessions of structured observation within licensed venues; and
• using administrative data (police, ambulance, emergency department, and licensing compliance data).
Data was also triangulated across jurisdictions (Hobart and Canberra) to tease out any cultural or other influences between cities.
Little is known about how behaviour and harms differ between locations and types of venue. Without specific evidence—of rates of alcohol and other drug use, patterns of consumption, associated behaviour, and harms—the efforts of police and licensees to address intoxication and offending in licensed venues will continue to be undermined by ineffective policy. This study attempted to address these important questions, using a research design that could capture data from consumers during an episode of alcohol and other drug use. This approach limited the potential for recall bias, and allowed for first-hand observation of behaviour in and around licensed venues.
A core aim of DASHED was to examine alcohol-related violence and to investigate the factors and correlates associated with such violence in the night-time economy. DASHED provides a valuable evidence base to help in selecting and adapting appropriate responses to alcohol and drug-related intoxication and crime in Canberra and Hobart. It also provides a baseline against which to measure the impact of future responses. The study includes an estimate of the costs attributable to alcohol and drug-related crime within a particular entertainment precinct, including the costs to policing. This can be used to inform future decisions on the allocation of resources.
This study will also enhance collaboration across law enforcement, licensees, and research staff when working together to tackle problems associated with alcohol and drug-related behaviour in entertainment precincts.
Project objectives
The study had six specific objectives:
1. Determine the prevalence of alcohol and substance-related harms in Canberra and Hobart entertainment precincts and major trends over time.
2. Identify the main characteristics of alcohol and substance-related harms in Canberra and Hobart entertainment precincts and how these compare with other entertainment precincts elsewhere in Australia.
3. Examine the nature of the relationship between patron alcohol consumption, intoxication, substance use and associated harms in Canberra and Hobart entertainment precincts.
4. Determine the main drivers of alcohol and substance-related harm in Canberra and Hobart entertainment precincts and identify opportunities to implement responses to reduce the level of harm associated with alcohol.
5. Estimate the costs associated with alcohol and substance-related harms in Canberra and Hobart entertainment precincts.
6. Provide a valuable evidence base to help select and adapt appropriate responses to alcohol-related problems in Canberra and Hobart as well as providing a baseline against which to measure the impact of future responses.
2
Drug and alcohol intoxication and subsequent harm in night-time entertainment districts (DASHED)
Methods
Study areas
This study involved evaluating existing strategies to address alcohol-related harm in the entertainment precincts of two regional Australian cities: Canberra (Australian Capital Territory or ACT) and Hobart (Tasmania or Tas). These sites were chosen to investigate jurisdictional differences in alcohol and other drug consumption patterns and intoxication, and related harms. They were also chosen as they form a comprehensive national picture of Australia when combined and contrasted with past studies—Dealing with alcohol-related harm and the night-time economy, or DANTE (Miller et al. 2012) and Patron offending and intoxication in night-time entertainment districts, or POINTED (Miller et al. 2013).
Canberra, the capital of the Australian Capital Territory, and Hobart, the capital of the state of Tasmania, are two of the smallest capital cities in Australia, together contributing just 2.6 percent of the national population (ABS 2016). Both Canberra and Hobart have successful entertainment districts.
Patron interviews
Patron interviews consisted of a systematic random sample (selecting every third person) of all people attending night-time entertainment districts in Canberra and Hobart. Interviews were conducted in busy thoroughfares in each city, as well as with individuals queuing to enter and leave venues. Researchers worked in groups of six or more in these public thoroughfares and outside selected licensed venues (up to six venues each night). Each team had a team leader responsible for liaising with venue staff, carrying support equipment, and overseeing team operations and safety. All interviewers wore easily identifiable clothing from their relevant institution.
Members of the research team interviewed patrons on Friday and Saturday nights between 10 pm and 2 am with target patrons both arriving and leaving the entertainment precinct at these times. To recruit participants, researchers targeted key transport locations including taxi ranks, bus stations and car parks. Patron interviews were not conducted inside licensed premises. Canberra researchers undertook interviews in three phases in April, August and November/December, and Hobart carried out interviews in four phases in April/May, June/July, September and November.
Researchers entered patron answers to interview questions using Tap Forms software and stored on iPod Touch or iPhone devices. The interview consisted of four sections: demographics; current night out (including alcohol and other substance use); aggression/offending/alcohol-related consequences (including verbal aggression, physical aggression, unwanted sexual attention, and injuries); and intentions for the rest of the night. Patrons were also asked to provide a blood alcohol concentration (BAC) measure using a breathalyser.
A randomly selected sub-sample (about every fifth person) was asked if they were willing to undergo a swab for the presence of other drugs (all responses were recorded to allow for the calculation of response rates). Results from the drug tests were recorded in the interview file and used to understand the reliability of self-reported data.
3
Executive summary
Venue observations
Observations were conducted quarterly by members of the research team in two-week blocks (on Friday and Saturday nights) at specified locations in Canberra and Hobart, inside and within the immediate surrounding areas of selected licensed premises.
Venue observations assessed the prevalence of strategies being evaluated in each site and the differences in adoption of strategies in two regional sites. They also described the prevalence of additional evidence-based practices that could contribute to reducing intoxication and/or alcohol-related violence.
Information collected as part of the observations included:
• number of patrons in the establishment and patron characteristics;
• patron movement (entering and exiting licensed premises);
• crowding around alcohol service areas and service times;
• patron interactions (with one another, establishment staff and security personnel);
• patron level of intoxication (and whether intoxicated patrons were still served);
• patron consumption of energy drinks (with or without alcohol);
• use of promotions by establishments (eg $2 shots);
• occurrence and nature of aggressive/violent incidents; and
• the presence of strategies designed to reduce alcohol-related offending (eg high visibility policing, security managers at taxi ranks).
Venues in each city were selected for observation sessions based on opening times and size. Three types of venues were chosen: large mainstream pub—closing time 1 to 3 am; bars—closing time 1 to 5 am; and nightclubs (DJ-focused)—closing time 3 am to 24 hour trading. Each observation period lasted between four and five hours, varying from start times at 8 pm to 10 pm and finishing between 2 am in Hobart and 3 am in Canberra. Each team visited a variety of venues per night of observation (ie teams moved from venue to venue). Observations were conducted as unobtrusively as possible to blend into the setting.
Administrative data
The following types of unit record data have been included, with a specific focus on the major entertainment precincts in Canberra and Hobart:
• ambulance attendance data from the ACT and Tasmania ambulance services for alcohol and substance-related ambulance attendances in Canberra and Hobart;
• alcohol-related presentations in emergency departments and hospital admissions from ACT Health and the Tasmanian Department of Health and Human Services;
• recorded alcohol-related offence data from ACT Policing and Tasmania Police, including assaults, property damage, street offences, drink-driving; and
• compliance data from the ACT Office of Regulatory Services and Tasmania Liquor and Gaming relating to enforcement action targeting licensed premises.
The administrative data was used to identify trends in alcohol and substance-related harms and patterns of offending during high alcohol hours. Street and location information has also been used to identify alcohol and substance-related harm 'hot-spots'. The purpose of the hot-spot analysis was to identify those locations within the Canberra and Hobart entertainment precincts that accounted for the largest number of offences during high alcohol hours. The administrative data was also analysed to determine what impact key reforms and strategies have had on key indicators of alcohol-related crime and disorder in both entertainment precincts that were targeted over this period.
4
Drug and alcohol intoxication and subsequent harm in night-time entertainment districts (DASHED)
Economic assessment
This study attempts to estimate the costs associated with alcohol-related crime incidents in the Canberra entertainment precinct (using the same geographic boundaries as for other components of the research). Drawing on the secondary analyses of administrative data, the following cost items were included in the economic assessment:
• cost of police time responding to alcohol-related offences and other alcohol-related incidents;
• proactive and associated costs related to alcohol incurred by police responsible for policing the CBD;
• health care costs of alcohol-related offences to victims, including hospitalisation, emergency department admissions, ambulance attendances and counselling;
• cost of alcohol-related offences to victims and the broader community, including lost output, intangible costs and damage to property; and
• criminal justice system costs for alcohol-related assault offences, including court proceedings and imprisonment costs.
Results
Alcohol consumption
Interviewees showed moderate levels of intoxication, with peak BAC readings at around 12 am, and subsequent declines in both sites. The overall average when interviewed was 0.048 for Canberra and 0.062 for Hobart. In both Canberra and Hobart, self-rated intoxication was moderately correlated with higher BAC readings. People who rated their level of intoxication at three out of 10, on average, were almost at (in Canberra) or over (in Hobart) the legal BAC drink-driving limit (0.05). People who self-rated their intoxication at more than five varied between 0.081 and 0.130 g/100 mL. The higher the BAC reading or standard drinks consumed on the night for interviewees in Canberra, the better they thought of their driving capability. Just over half of interview participants in both sites showed any signs of intoxication, with the most common being slurred speech or glassy/red eyes.
Pre-drinking behaviours
Pre-drinking behaviour was consistent across the cities of Canberra and Hobart, with more than half the interview sample in Canberra and more than two-thirds of the Hobart sample reporting having consumed alcohol before they went out to licensed venues. The main motivator for pre-drinking in both sites was the cost of drinks in licensed venues.
Energy drink consumption
In both Canberra and Hobart, approximately one in five interview participants said they had consumed energy drinks that night, with the percentage increasing from five to 12 percent at between 10 and 11 pm and dropping from 37 to 36 percent at 2 to 3 am. Almost all patrons (96–98%) who reported consuming energy drinks, reported drinking alcohol as well.
5
Executive summary
Illicit drug consumption
In Canberra, 13 percent of interview participants reported using substances other than alcohol (excluding tobacco) during their current night out, compared with 11 percent in Hobart. Observers suspected illicit substance use among patrons in 9.3 percent of observations in Canberra and 14.2 percent of those in Hobart.
Aggressive incidents and safety
For both Canberra and Hobart, most injury-related ED attendees were males aged between 18 and 24 years. The rate of high alcohol hours (HAH) injury ED presentations increased between 2010 and 2014 in Canberra and remained steady in Hobart.
The overall rate of police-attended assaults during HAH was similar for Canberra (average of 1.57 per 10,000) and Hobart (average of 1.66 per 10,000). The rate of assaults during HAH peaked in the summer months of January/December in Canberra, with a small decrease between 2010 and 2015. In Hobart, they increased over time.
In Canberra, 47 percent of interview participants reported being involved in verbal aggression (30%), physical aggression (17%), or unwanted sexual attention (28%) in or around licensed venues in the three months before being interviewed, with a median of four incidents. Similar patterns were apparent for Hobart, where 49 percent of the sample reported that they had been involved in any form of verbal aggression (33%), physical aggression (16%) or unwanted sexual attention (26%) in or around licensed venues in the three months before interview, with a median of four incidents. The rate of involvement in any aggression is higher than that found for POINTED (at 11% physical and 10% verbal)
In both Canberra and Hobart, females were more likely to report receiving unwanted sexual attention, whereas males were more likely to report being involved in a physically aggressive incident. Police data indicated that most victims of sexual offences during HAH tended to be young, aged 34 years or less in both Canberra and Hobart. In both sites, most victims were also female (78–85%).
Key findings—directions for policy, practice and research
Key findings associated with the study objectives are presented below.
Objective 1: Determine the prevalence of alcohol and substance-related harms in Canberra and Hobart entertainment precincts and major trends over time
Across all measures of alcohol and substance-related harms in Canberra and Hobart entertainment precincts, rates per 10,000 people appear to be increasing between 2010 and 2014. The only exceptions are drink-driving, police-attended assaults, police-attended property damage, and sexual assault in Canberra, and street offences in Hobart. These all show decreasing trends.
6
Drug and alcohol intoxication and subsequent harm in night-time entertainment districts (DASHED)
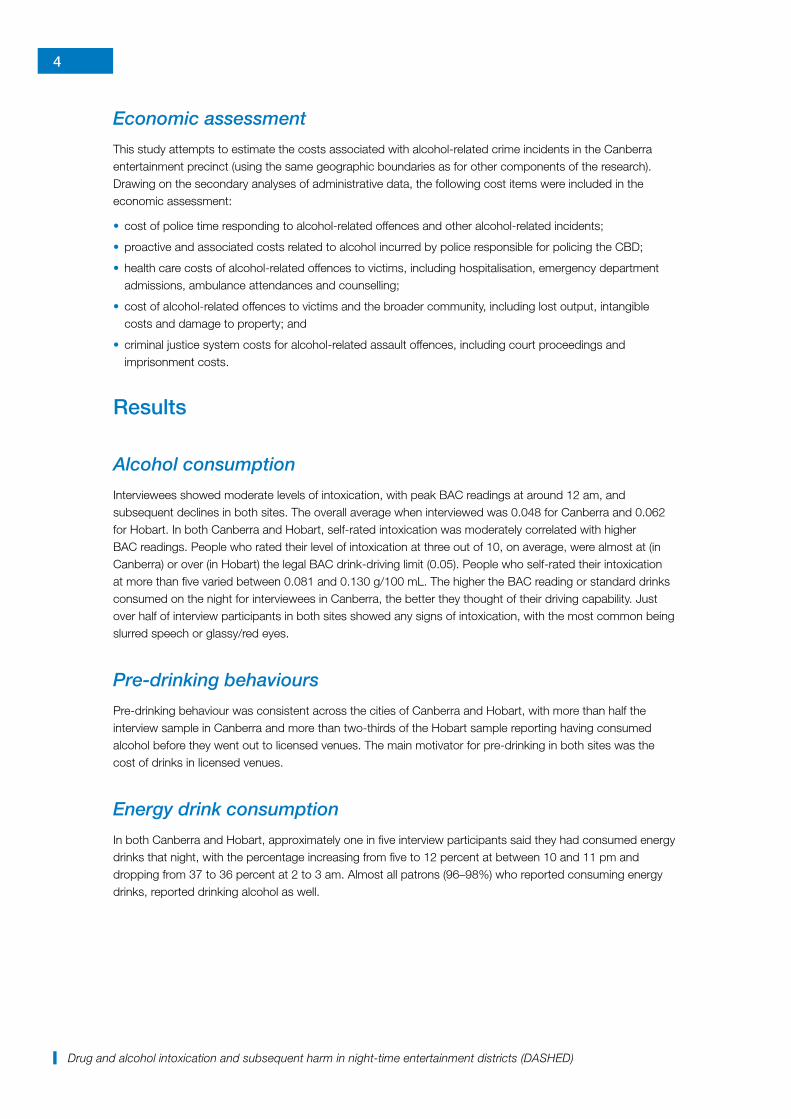
Figure 1 Rate per 10,000 of ambulance attendances during HAH by year, Canberra (ACT)
Figures 1 and 2 show the rate of ambulance attendances between 2010 and 2014 for high alcohol hours within suburbs containing night-time entertainment precincts (NEPs) in Canberra and Hobart. Rates of ambulance attendances during high alcohol hours in Canberra have remained relatively stable from 2012 to 2014, showing between 70 and 72 ambulance attendances per 10,000 people. Rates are considerably lower in Hobart, ranging from 17 ambulance attendances per 10,000 people in 2010, to 23 in 2013. Across both Canberra and Hobart, individuals aged between 18 and 24 years comprised most ambulance attendances during high alcohol hours.
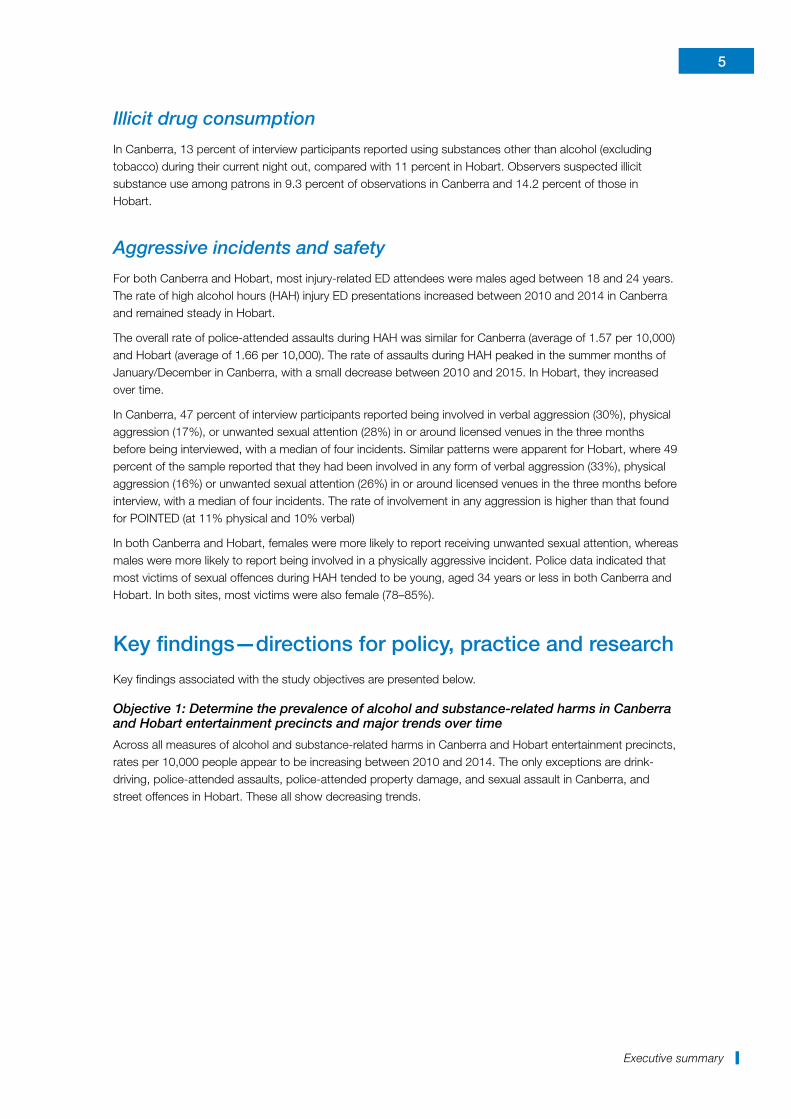
Figure 2 Rate per 10,000 of ambulance attendances during HAH by year, Hobart (Tas)
Figure 3 and Figure 4 show the rate of emergency department attendance between 2010 and 2014 for high alcohol hours. Emergency department attendance rates within high alcohol hours have increased slightly in both Canberra and Hobart, ranging from 61.5 per 10,000 people in 2010 to 70 in 2014 in Canberra, and 56.5 in 2010, to 58.2 in 2014 in Hobart.
7
Executive summary
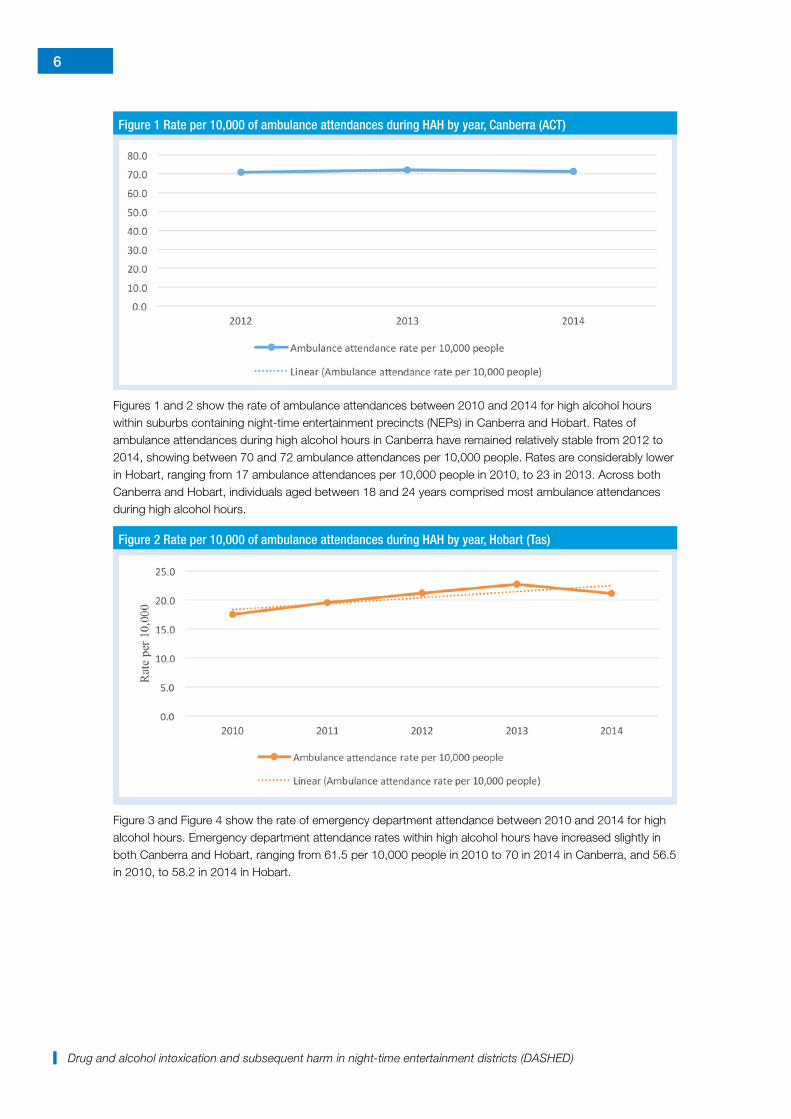
Figure 3 Rate per 10,000 of emergency department attendances in HAH by year, Canberra (ACT)
Figure 4 Rate per 10,000 of emergency department attendances in HAH by year, Hobart (Tas)
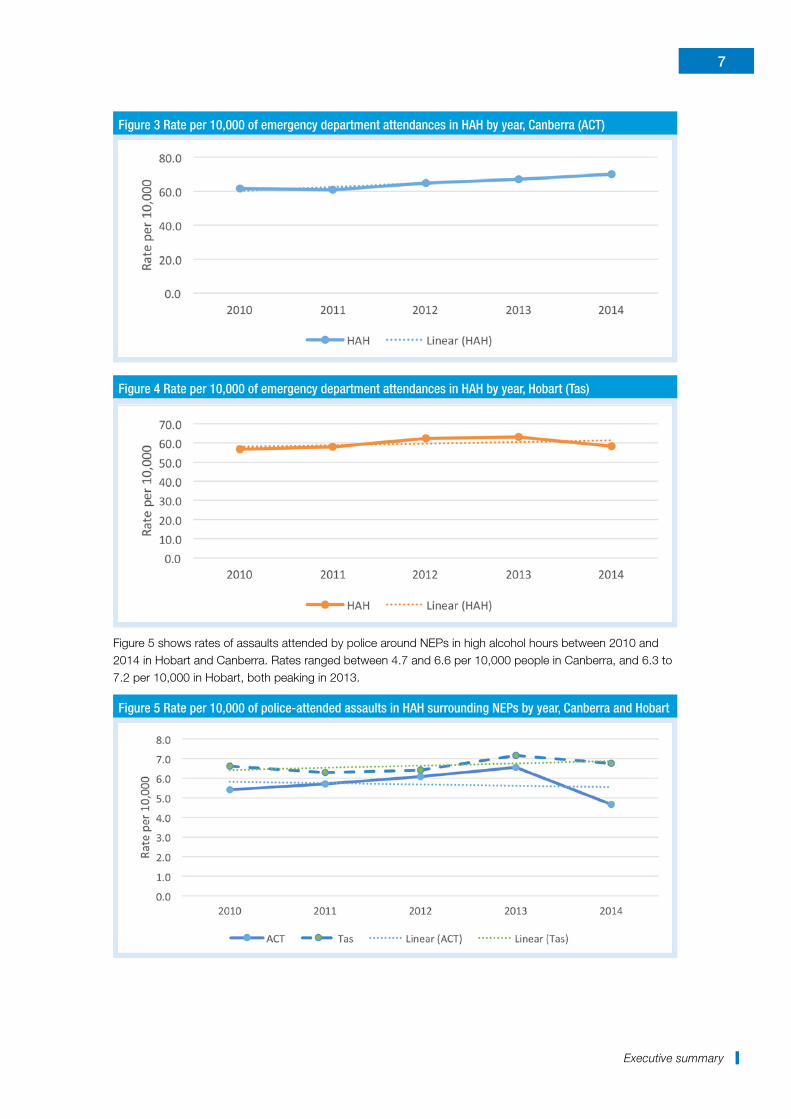
Figure 5 shows rates of assaults attended by police around NEPs in high alcohol hours between 2010 and 2014 in Hobart and Canberra. Rates ranged between 4.7 and 6.6 per 10,000 people in Canberra, and 6.3 to 7.2 per 10,000 in Hobart, both peaking in 2013.
Figure 5 Rate per 10,000 of police-attended assaults in HAH surrounding NEPs by year, Canberra and Hobart
8
Drug and alcohol intoxication and subsequent harm in night-time entertainment districts (DASHED)
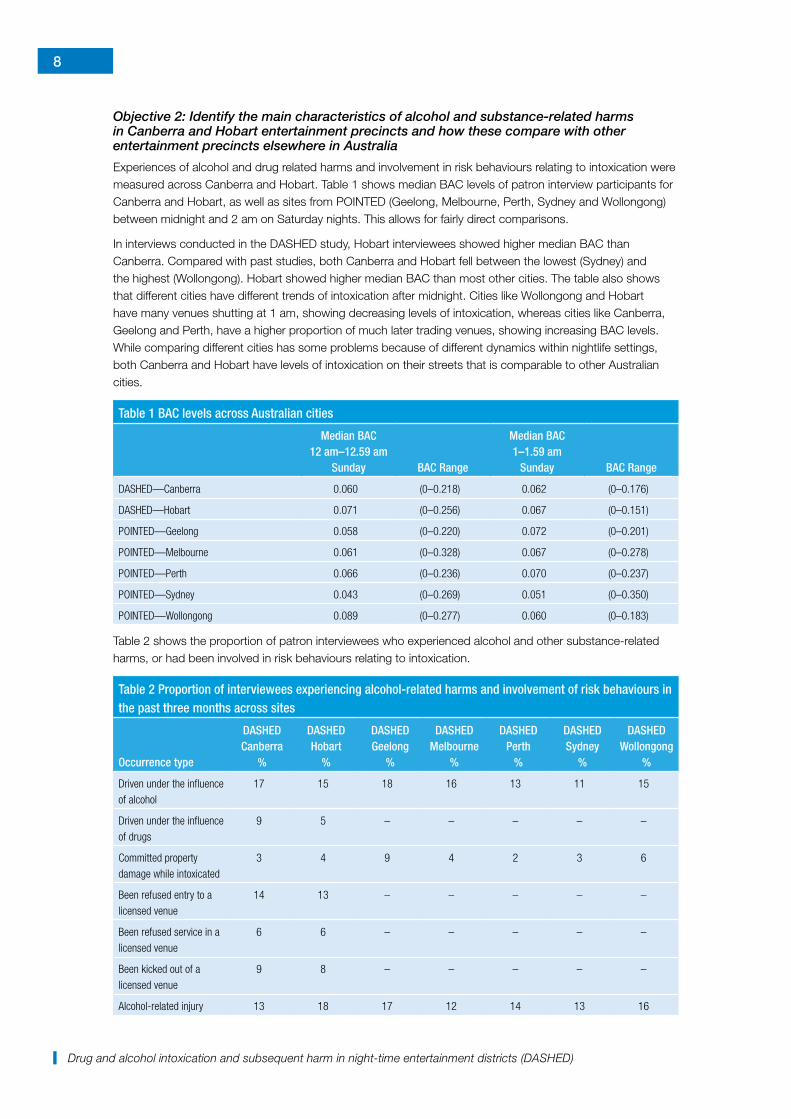
Objective 2: Identify the main characteristics of alcohol and substance-related harms in Canberra and Hobart entertainment precincts and how these compare with other entertainment precincts elsewhere in Australia
Experiences of alcohol and drug related harms and involvement in risk behaviours relating to intoxication were measured across Canberra and Hobart. Table 1 shows median BAC levels of patron interview participants for Canberra and Hobart, as well as sites from POINTED (Geelong, Melbourne, Perth, Sydney and Wollongong) between midnight and 2 am on Saturday nights. This allows for fairly direct comparisons.
In interviews conducted in the DASHED study, Hobart interviewees showed higher median BAC than Canberra. Compared with past studies, both Canberra and Hobart fell between the lowest (Sydney) and the highest (Wollongong). Hobart showed higher median BAC than most other cities. The table also shows that different cities have different trends of intoxication after midnight. Cities like Wollongong and Hobart have many venues shutting at 1 am, showing decreasing levels of intoxication, whereas cities like Canberra, Geelong and Perth, have a higher proportion of much later trading venues, showing increasing BAC levels. While comparing different cities has some problems because of different dynamics within nightlife settings, both Canberra and Hobart have levels of intoxication on their streets that is comparable to other Australian cities.
Table 2 shows the proportion of patron interviewees who experienced alcohol and other substance-related harms, or had been involved in risk behaviours relating to intoxication.
Table 2 Proportion of interviewees experiencing alcohol-related harms and involvement of risk behaviours in the past three months across sites
Occurrence type
DASHED Canberra
%
DASHED Hobart
%
DASHED Geelong
%
DASHED Melbourne
%
DASHED Perth
%
DASHED Sydney
%
DASHED Wollongong
%
Driven under the influence of alcohol
17 15 18 16 13 11 15
Driven under the influence of drugs
9 5 – – – – –
Committed property damage while intoxicated
3 4 9 4 2 3 6
Been refused entry to a licensed venue
14 13 – – – – –
Been refused service in a licensed venue
6 6 – – – – –
Been kicked out of a licensed venue
9 8 – – – – –
Alcohol-related injury 13 18 17 12 14 13 16
9
Executive summary
The findings demonstrate that nightlife patrons in Canberra and Hobart experience high levels of alcohol-related harm and engage in comparable levels of antisocial or risky behaviour as those in other Australian cities. Notable risk-taking behaviours include a high proportion of patrons reporting that they had driven while under the influence of alcohol or drugs in the past three months. Only a small proportion report having been refused service in a licensed venue, while substantially more report having been refused entry, suggesting that, similar to other cities around Australia, pre-drinking plays a role in the problems faced by licensed venues in Hobart and Canberra.
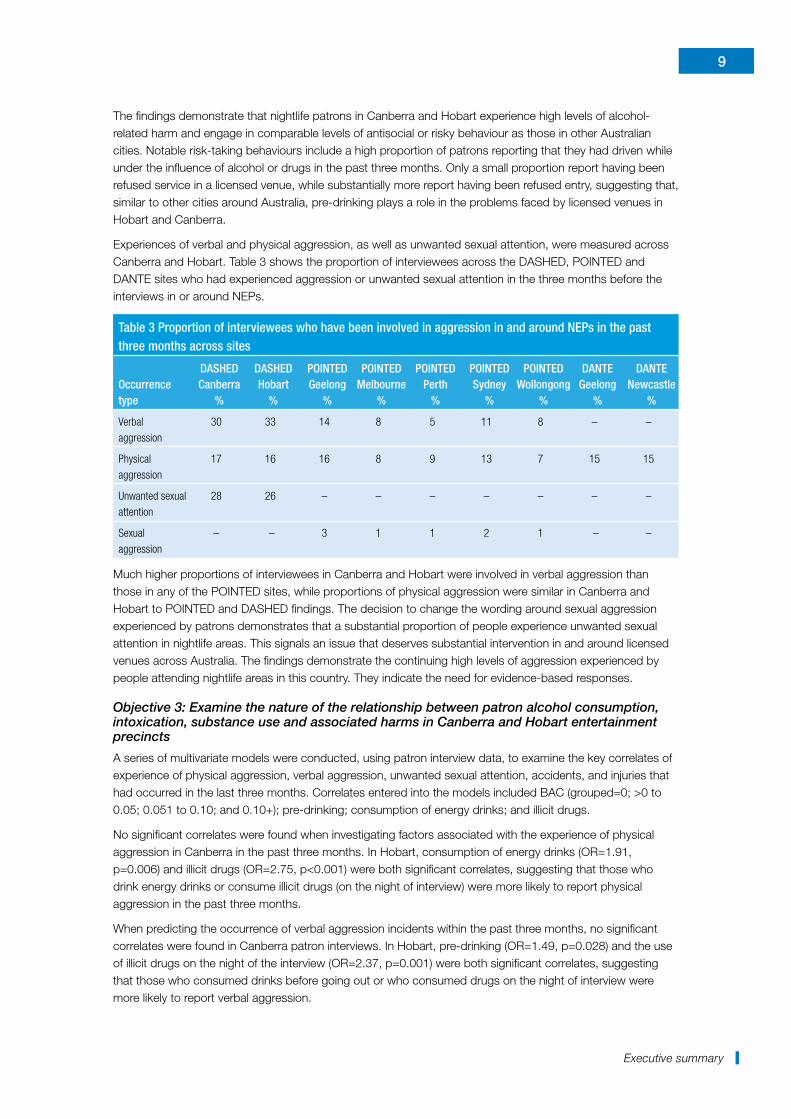
Experiences of verbal and physical aggression, as well as unwanted sexual attention, were measured across Canberra and Hobart. Table 3 shows the proportion of interviewees across the DASHED, POINTED and DANTE sites who had experienced aggression or unwanted sexual attention in the three months before the interviews in or around NEPs.
Table 3 Proportion of interviewees who have been involved in aggression in and around NEPs in the past three months across sites
Occurrence type
DASHED Canberra
%
DASHED Hobart
%
POINTED Geelong
%
POINTED Melbourne
%
POINTED Perth
%
POINTED Sydney
%
POINTED Wollongong
%
DANTE Geelong
%
DANTE Newcastle
%
Verbal aggression
30 33 14 8 5 11 8 – –
Physical aggression
17 16 16 8 9 13 7 15 15
Unwanted sexual attention
28 26 – – – – – – –
Sexual aggression
– – 3 1 1 2 1 – –
Much higher proportions of interviewees in Canberra and Hobart were involved in verbal aggression than those in any of the POINTED sites, while proportions of physical aggression were similar in Canberra and Hobart to POINTED and DASHED findings. The decision to change the wording around sexual aggression experienced by patrons demonstrates that a substantial proportion of people experience unwanted sexual attention in nightlife areas. This signals an issue that deserves substantial intervention in and around licensed venues across Australia. The findings demonstrate the continuing high levels of aggression experienced by people attending nightlife areas in this country. They indicate the need for evidence-based responses.
Objective 3: Examine the nature of the relationship between patron alcohol consumption, intoxication, substance use and associated harms in Canberra and Hobart entertainment precincts
A series of multivariate models were conducted, using patron interview data, to examine the key correlates of experience of physical aggression, verbal aggression, unwanted sexual attention, accidents, and injuries that had occurred in the last three months. Correlates entered into the models included BAC (grouped=0; >0 to 0.05; 0.051 to 0.10; and 0.10+); pre-drinking; consumption of energy drinks; and illicit drugs.
No significant correlates were found when investigating factors associated with the experience of physical aggression in Canberra in the past three months. In Hobart, consumption of energy drinks (OR=1.91, p=0.006) and illicit drugs (OR=2.75, p<0.001) were both significant correlates, suggesting that those who drink energy drinks or consume illicit drugs (on the night of interview) were more likely to report physical aggression in the past three months.
When predicting the occurrence of verbal aggression incidents within the past three months, no significant correlates were found in Canberra patron interviews. In Hobart, pre-drinking (OR=1.49, p=0.028) and the use of illicit drugs on the night of the interview (OR=2.37, p=0.001) were both significant correlates, suggesting that those who consumed drinks before going out or who consumed drugs on the night of interview were more likely to report verbal aggression.
10
Drug and alcohol intoxication and subsequent harm in night-time entertainment districts (DASHED)
Experiences of unwanted sexual attention in Canberra were found to be correlated with BAC level on the night. Compared with 0.10+, those with >0.0 to 0.05 (OR=1.82, p=0.015) and those with 0.051 to 0.10 (OR=1.96, p=0.004) were more likely to report unwanted attention in the last three months. In Hobart, only the occurrence of pre-drinking on the night of the interview (OR=1.73, p=0.005) was a significant predictor. This suggests that those who pre-drink were more likely to report unwanted sexual attention than those who did not report pre-drinking on the night.
When predicting the occurrence of accidents in the past three months, in Canberra the only significant correlate was use of illicit drugs (OR=2.12, p=0.013). This indicated that those who reported using illicit drugs on the night of the interview were 2.12 times more likely to report an alcohol-related accident. No significant correlates of accidents were found for Hobart.
When predicting the occurrence of alcohol-related injuries in the past three months, Canberra showed no significant correlates. In Hobart, pre-drinking (OR=1.59, p=0.042), and consuming energy drinks (OR=1.69, p=0.021) significantly predicted the occurrence of injuries.
These findings demonstrate that a range of factors are associated with people experiencing aggression. While some suggest stronger associations, such as using energy drinks or illicit drugs, these may reflect other patterns of behaviour in general. Ultimately, a variety of factors contribute. Experiencing harm, or engaging in risky behaviour, continue to be complex phenomena with multiple risk and protective factors.
Objective 4: Determine the main drivers of alcohol and substance-related harm in Canberra and Hobart entertainment precincts and identify opportunities to implement responses to reduce the level of harm associated with alcohol
The findings of this report demonstrate that key drivers of alcohol-related harm are consistent with other cities in Australia, and internationally. They can be linked back mostly to high concentrations of venues, generally high consumption levels in the community, pre-drinking (normally related to the price discrepancy between on-licence and off-licence outlets), late trading hours, high levels of intoxication, and the failure of RSA legislation and training to ensure intoxicated patrons are not served more alcohol. However, the findings also specifically point to energy drinks and illicit drugs as correlates of harm. They highlight again the high levels of drug and drink-driving in this sub-population.
Opportunities exist to implement responses that will reduce the level of harm associated with alcohol. The following outlines key findings and potential responses for implementing or piloting.
Finding 1
This research shows that levels of intoxication increased throughout the night across both sites, resulting in a substantial proportion of the people in the night-time economy being heavily intoxicated.
Proposal 1a—Further refine and invest in current regulatory and enforcement frameworks
In particular, responsible service of alcohol measures are insufficient and require more stringent regulation and more comprehensive and systematic enforcement regimes. Possessing a licence to sell liquor means that licensees need to comply with all conditions, and do so to make profit from the sale of alcohol. As with driving or other areas of licensing, repeated breaches should result in licences being revoked. Specific responses include:
• making publicly available data about specific venues that are failing to meet their licence conditions (such as the Violent Venues list released quarterly by the NSW Bureau of Crime Statistics and Research). Also using data collected from emergency departments and ambulance services; and
• increasing penalties, such as trading hours restrictions or temporary closure, for venues that have consistently high numbers of assaults, injuries or licensing breaches.
11
Executive summary
Proposal 1b—Australian states to impose trading hour restrictions
These would be applied consistently across regions to ensure businesses can compete on a level playing field. The evidence from this report shows substantial spikes in assaults between 2 and 3 am. This indicates that 2 am last drinks should be a default minimum, with the option for communities and/or police to appeal for earlier close of trading where indicated. Beyond preventing violence and injury, this measure provides substantial savings—lessening the financial and resources drain on emergency services.
Finding 2
This research, as with previous studies, has identified pre-drinking as a predictor of intoxication and a major impediment to responsible service of alcohol. This behaviour reflects Australia’s culture of determined drunkenness and requires serious, substantial, evidence-based interventions across a range of variables (eg price, availability and advertising).
Proposal 2a—Introduce a minimum price per standard drink of alcohol
Evidence from British Columbia has shown a 10.4 percent reduction in violence associated with alcohol, while the price of most alcohol sold has remained unaffected. By targeting the very cheapest alcohol sold in the community, the measure affects problem and young drinkers; both groups are mostly likely to experience alcohol-related harm.
Proposal 2b—Implement regulatory measures to reduce discount alcohol sales
In particular, policy responses such as banning bulk-buys, two-for-one offers and other promotions based on price could reduce heavy episodic drinking. Some states have regulations relating to discounting that should be more strictly enforced both on and off licensed venues.
Proposal 2c—Place caps on outlet density and the number of licensed venues in nightlife precincts
This would help to prevent any further increases in alcohol-related harm. A large and robust literature demonstrates the association between increased liquor outlet density and street and domestic violence, indicating the need for such restrictions.
Finding 3
As a part of the pre-drinking culture, the research teams often observed people consuming alcohol near licensed venues just prior to entering.
Proposal 3a—Review security training for identifying intoxicated people
A potential amendment for training could be introduced in field-sobriety testing, requiring at least one staff member from each venue to have additional qualifications in this area. Piloting different levels of complexity of testing would determine what is practical. This intervention should be scientifically evaluated before being implemented.
Proposal 3b—Undertake further research and intervention trials to identify methods for reducing levels of pre-drinking in night-time entertainment districts
Examples include:
• systematic trials into the selective use of breathalysers by door staff in night-time entertainment districts to assess their use and effectiveness;
• heavier enforcement such as blitzes on pre-drinking and specific operations targeting venue lines and working with security;
• trial interventions by police and councils to address drinking in cars and taxis, even when stationary, and investigation of council by-laws or state laws; and
• use specially hired and trained council officers to enforce such by-laws and also address the issue of open alcohol containers in many night-time entertainment districts—this is a potential alternative to further stretching police resources.
12
Drug and alcohol intoxication and subsequent harm in night-time entertainment districts (DASHED)
Finding 4
Energy drink use in nightlife patrons has again been found to be associated with increased experience of harm and alcohol consumption in the night-time economy. Measures addressing energy drink consumption include:
Proposal 4a—Undertake policy trials that ban energy drink sales after 10 pm
Proposal 4b—Ban discounts and promotions on alcohol mixed with enery drinks (AmEDs) in all venues
Proposal 4c—Distribute posters to all venues displaying information about the maximum number of energy drinks that should be consumed daily
Posters would include information about the potential risks associated with combining alcohol and energy drinks, and would be placed behind the bar and in the toilets.
Proposal 4d—Trial public education campaigns about the potential dangers of mixing alcohol and energy drinks
Finding 5
Illicit drug use was found at both sites and was associated with people experiencing greater violence and injury. A high proportion of interviewees reported illicit drug use and, despite the hidden nature of this use, research teams consistently observed drug dealing.
Proposal 5a—Trial a policy that tests the impact of banning from nightlife areas those caught drug dealing or trafficking on drug dealing inside and around licensed venues
This would extend current patron banning measures in place in most states. Such a measure would also require implementing mandatory ID scanner technology and the real-time linking of police data to ID scanners.
Proposal 5b—Amend liquor licensing legislation in each state to consider illicit drug-related offences within venues as amenity infringements associated with liquor licence breaches
This includes harms such as overdoses. The amendment would endorse drug harm minimisation licence conditions and allow for disciplinary/amenity inquiries for drug-related reasons. It would empower licensing agencies to invoke inquiry powers that address illicit drug-related harm at licensed premises (eg grievous bodily harm, overdoses etc).
Proposal 5c—Implement harm-reduction measures, such as posters and conditions of the licence
Posters would be placed in venues to warn of the harms of combining alcohol and illicit drugs in night-time entertainment districts. Venues identified as having a lot of drug use could consider conditions on the environmental factors of the licence to limit the consumption of illicit drugs within the venue, such as removing flat surfaces in toilets and having their security increase the surveillance of toilet areas.
Proposal 5d—Use well-constructed, funded trials of interventions such as the Clubs against Drugs program
Finding 6
Drink- and drug-driving were identified as major issues in terms of harm to the community. A large proportion of nightlife patrons reported driving under the influence of alcohol or drugs.
Proposal 6a—Trial targeted enforcement campaigns, with associated awareness campaigns
Proposal 6b—Instigate specific research around who is driving under the influence of drugs (including alcohol) and why, to inform subsequent responses
13
Executive summary
Finding 7
Unwanted sexual attention is a major harm experienced primarily by women in nightlife. It demands a rapid and serious response.
Proposal 7a—Implement and evaluate pilot interventions that draw attention to respectful behaviour in nightlife settings
Proposal 7b—Further research perpetrators of unwanted sexual behaviour—their criminogenic needs and offending pathways
Proposal 7c—Trial and evaluate specific banning provisions to target offenders that are linked to mandatory ID scanning in licensed venues
Banning provisions should be only available via a court-based system and include treatment options.
Objective 5: Estimate the costs associated with alcohol and substance-related harms in Canberra and Hobart entertainment precincts
The final objective of the study was to estimate the financial costs associated with alcohol-related crime incidents within the Canberra entertainment precincts. Drawing on the administrative data analysed as part of the current research, together with the results from previously published studies, it was possible to estimate the:
• short-term costs of alcohol to policing (both reactive and proactive);
• costs of crime including medical costs (hospitalisation, emergency department presentations and ambulance attendances), lost output, intangible costs, property loss and damage; and
• criminal justice system costs associated with alcohol-related assault.
This assessment reports only on the costs of alcohol-related crime within the limited geographical area of the nightlife district. It should be considered a bottom-line cost—and a substantial underestimate. Given the limitations of available data, the results from this economic assessment underestimate the total cost to police and the criminal justice system. It does not include costs incurred outside the suburbs of Canberra City and Braddon and therefore does not represent the total cost of the CBD entertainment precinct to the ACT Government or wider community. Similarly, the 'bottom-up approach' always seems to underestimate the cost of police time. A range of other harms are also associated with alcohol, including accidental injury and other health problems, which are not included in this estimate. Finally, having been developed specifically for the ACT, this estimate will not be applicable to other cities’ entertainment precincts. The number of recorded assaults in other major city entertainment precincts (eg Sydney, Melbourne and Brisbane) is substantially larger, which means the cost to police and to the wider community will be proportionally larger.
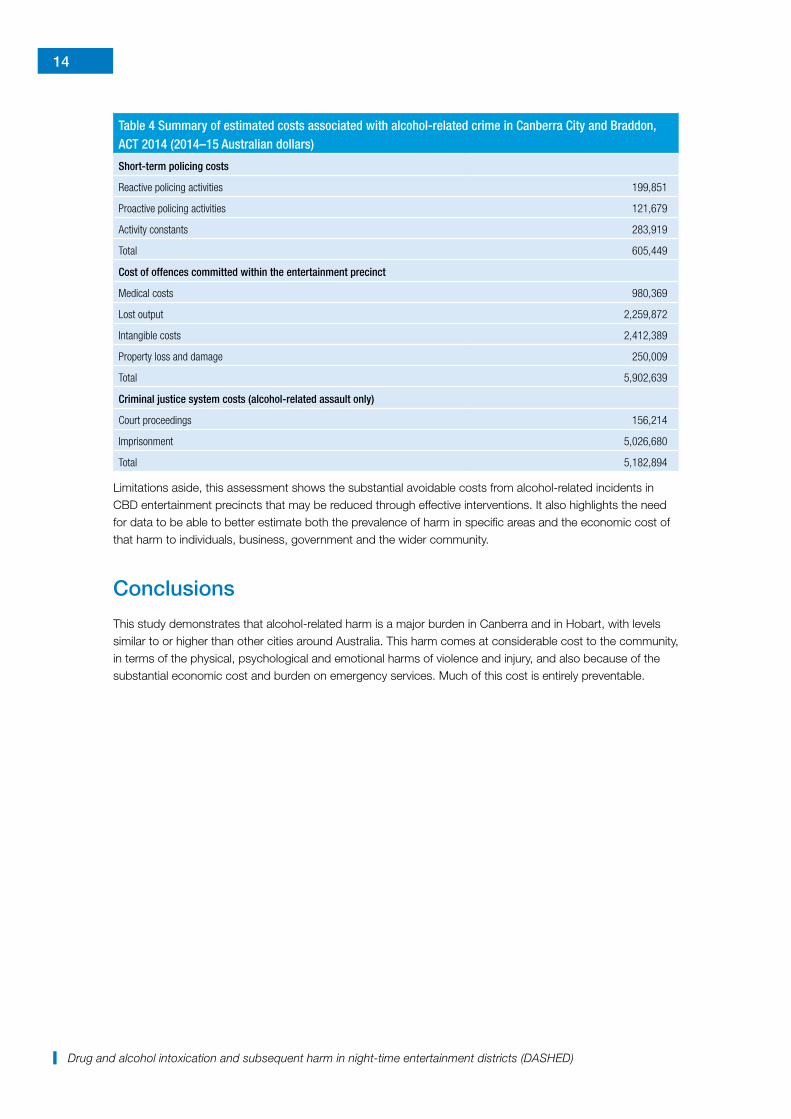
A summary of these costs is presented in Table 4. In 2014, the cost of alcohol-related offences committed within Canberra’s main entertainment precinct (City and Braddon), including unrecorded offences, was estimated to be $5.9m. Intangible costs accounted for the largest proportion of this cost (41%), followed by lost output (38%) and medical costs (17%). In addition, the immediate and short-term cost to police of responding to alcohol-related offences and incidents in the Canberra CBD, based solely on the salaries of officers attending incidents, was estimated to be $199,851. The total short-term cost to police of dealing with alcohol-related issues—primarily the RTT—was estimated to be more than $600,000. A further $5.2m was estimated in criminal justice costs for alcohol-related assault, although this was based on a number of assumptions and limited to assault offences only.
While this research focused on HAH, because of the concentration of alcohol-related offences on Friday and Saturday nights, the economic assessment revealed that the cost of alcohol-related crime is not evenly distributed over this period. The cost of crime and the cost to police both peaked after 2 am. Forty-six percent of the short-term reactive costs to police and 43 percent of the cost of alcohol-related offences committed in Canberra’s main entertainment precinct resulted from incidents between 2 and 6 am. The ability of evidence-based interventions to reduce the level of harm later in the evening therefore has the potential to deliver significant financial savings.
14
Drug and alcohol intoxication and subsequent harm in night-time entertainment districts (DASHED)
Table 4 Summary of estimated costs associated with alcohol-related crime in Canberra City and Braddon, ACT 2014 (2014–15 Australian dollars)
Short-term policing costs
Reactive policing activities 199,851
Proactive policing activities 121,679
Activity constants 283,919
Total 605,449
Cost of offences committed within the entertainment precinct
Medical costs 980,369
Lost output 2,259,872
Intangible costs 2,412,389
Property loss and damage 250,009
Total 5,902,639
Criminal justice system costs (alcohol-related assault only)
Court proceedings 156,214
Imprisonment 5,026,680
Total 5,182,894
Limitations aside, this assessment shows the substantial avoidable costs from alcohol-related incidents in CBD entertainment precincts that may be reduced through effective interventions. It also highlights the need for data to be able to better estimate both the prevalence of harm in specific areas and the economic cost of that harm to individuals, business, government and the wider community.
Conclusions
This study demonstrates that alcohol-related harm is a major burden in Canberra and in Hobart, with levels similar to or higher than other cities around Australia. This harm comes at considerable cost to the community, in terms of the physical, psychological and emotional harms of violence and injury, and also because of the substantial economic cost and burden on emergency services. Much of this cost is entirely preventable.
15
References
References
Australian Bureau of Statistics 2016. Regional population growth, Australia, 2014–15. ABS cat. no. 3218.0. Canberra: ABS. http://www.abs.gov.au/ausstats/[email protected]/mf/3218.0
Miller P, Pennay A, Droste N, Jenkinson R, Quinn B et al. 2013. Patron offending and intoxication in night-time entertainment districts (POINTED). National Drug Law Enforcement Research Fund (NDLERF) Monograph no. 46. Canberra: NDLERF. http://www.ndlerf.gov.au/pub/Monograph_46.pdf
Miller PG, Tindall J, Sonderlund A, Groombridge D, Lecathelinais C et al. 2012. Dealing with alcohol and the night-time economy (DANTE): Final report. National Drug Law Enforcement Research Fund (NDLERF) Monograph no. 43. Canberra: NDLERF. http://www.ndlerf.gov.au/pub/Monograph_43.pdf