Reinhilde Veugelers (reinhilde.veugelers@ bruegel.org) is a Senior Fellow at Bruegel Executive summary Technological progress, such as robotics and artificial intelligence, is often blamed for the loss of jobs and rising income inequality. It is also linked to increasing inequality in the corporate landscape as superstar firms forge ahead in winner-takes-most markets. Our analysis shows that in most sectors there is a high degree of concentration among a few top companies in research and development spending. R&D spending is much more concentrated than sales and employment. In 2015, for example, the top 10 percent biggest spenders on R&D, accounted for 71 percent of the R&D spending of the 2500 companies that spend most on R&D. is concentration is most obvious in the high-tech biopharma and dig- ital sectors, though it is also true for other sectors, such as the vehicles sector. US companies are overrepresented among these R&D superstars, especially in digital sectors where they take up half of the top slots. Over the last decade, there has been little evidence for increasing concentration in the global R&D landscape. On the contrary, a slight decline is discernible. Slight increasing con- centration can only be detected in digital sectors, with in particular the top 1 percent of R&D spending firms in these sectors forging ahead. Although the overall concentration of R&D spending among a few leading firms might not be changing much over time, R&D leaders are slowly losing their positions to new R&D-leading firms. Digital Services is the most turbulent high-tech sector. e US and China are more likely to produce new R&D leaders that take over some of the top positions from incumbent R&D leaders. is poses difficult questions for Europe, which is at risk of losing out in terms of R&D leadership in more technologically advanced sectors. Policy Contribution Issue n˚06 | April 2018 Are European firms falling behind in the global corporate research race? Reinhilde Veugelers
Transcript
Reinhilde Veugelers
(reinhilde.veugelers@
bruegel.org) is a Senior
Fellow at Bruegel
Executive summary
Technological progress, such as robotics and artificial intelligence, is often blamed
for the loss of jobs and rising income inequality. It is also linked to increasing inequality in the
corporate landscape as superstar firms forge ahead in winner-takes-most markets.
Our analysis shows that in most sectors there is a high degree of concentration among
a few top companies in research and development spending. R&D spending is much more
concentrated than sales and employment. In 2015, for example, the top 10 percent biggest
spenders on R&D, accounted for 71 percent of the R&D spending of the 2500 companies that
spend most on R&D. This concentration is most obvious in the high-tech biopharma and dig-
ital sectors, though it is also true for other sectors, such as the vehicles sector. US companies
are overrepresented among these R&D superstars, especially in digital sectors where they take
up half of the top slots.
Over the last decade, there has been little evidence for increasing concentration in the
global R&D landscape. On the contrary, a slight decline is discernible. Slight increasing con-
centration can only be detected in digital sectors, with in particular the top 1 percent of R&D
spending firms in these sectors forging ahead.
Although the overall concentration of R&D spending among a few leading firms
might not be changing much over time, R&D leaders are slowly losing their positions to new
R&D-leading firms. Digital Services is the most turbulent high-tech sector. The US and China
are more likely to produce new R&D leaders that take over some of the top positions from
incumbent R&D leaders. This poses difficult questions for Europe, which is at risk of losing
out in terms of R&D leadership in more technologically advanced sectors.
Policy Contribution Issue n˚06 | April 2018 Are European firms falling
behind in the global corporate research race?
Reinhilde Veugelers
2 Policy Contribution | Issue n˚06 | April 2018
1 Concentration of the corporate landscapeThere is some evidence that markets are becoming more winner-takes-all, with the best
performers surging ahead and taking a greater share of the rewards. In the United States, sales
are becoming more concentrated among fewer firms (Autor et al, 2016). Employment is also
becoming more concentrated, though more slowly. The pattern suggests that firms might at-
tain large market shares with relatively small workforces, a phenomenon that is most marked
among digital companies. Increasing corporate concentration has a broader social relevance
because it might fuel rising income inequality within societies. The best-performing firms pay
higher wages to fewer employees and so sales concentration could be driving greater wage
inequality. According to Bloom (2017) wage gaps between companies rather than within com-
panies are the real drivers of income inequality.
In this respect, the European Union is different to the US. Unlike in the US, recent evi-
dence shows the trend in the EU is not towards greater sales concentration (Dottling et al,
2017). If anything, it is declining, which might correlate with the deregulation of product
markets and more vigorous anti-trust enforcement in the EU.
In the US, greater concentration is particularly notable in the high-tech sectors where
technological change is more rapid (Autor et al, 2016), raising the question of whether
technology is the lever that superstar firms use to win market share. To answer this question,
we need to look at the corporate research landscape: how concentrated is corporate R&D?
Is there a trend of increasing concentration among a few corporate R&D spenders? If there
is greater concentration of corporate R&D, to what extent will the impact on the economy
be determined by who the R&D superstars are? Are they incumbent market leaders exploit-
ing and protecting their market power, incumbent R&D superstars exploiting their superior
innovative capacities and experience, or new superstar firms introducing radically new inno-
vations? In the first case, the speed of technology change might be hampered, in the second
case, disruptive technologies might be hampered.
2 How we assess concentration of corporate R&D and what we expect to see
We look at trends in the concentration of R&D worldwide. We expect to see significant – and
increasing – concentration of corporate R&D. The speed, depth and breadth of technological
change and the need to access networks and partners are all factors that would predict greater
concentration of corporate R&D over time. Furthermore, we can expect the most likely win-
ners to be the incumbent R&D investors, because they are the companies that already have
stocks of knowledge, networks of customers and partners, the capital to invest in R&D and the
capacity to deliver innovations more efficiently to customers.
However, as technological innovations are diffused, other firms can take advantage
of them, resulting in them catching up with the incumbent leaders and chipping away at
incumbent R&D leadership positions. If the diffusion process happens quickly enough,
differences between leaders and laggards can shrink rapidly, reducing the concentration
of corporate R&D. In addition, incumbents’ R&D competences, networks and technology
leadership can be quickly overturned when new disruptive technologies emerge, such as
the biotech revolution in pharma, the digital revolution in information and communication
technologies, and the electric motor and autonomous driving revolution in car
manufacturing. Such disruption of incumbent positions creates space for new R&D leading
‘Greater concentration in high-tech sectors where technological change is more rapid raises the question of whether technology is the lever superstar firms use to win market share.’
3 Policy Contribution | Issue n˚06 | April 2018
firms, riding on the latest technological waves, displacing incumbents1.
To measure the trends in concentration of corporate R&D, we use the EU Industrial R&D
Investment Scoreboard2 of the world’s largest R&D spenders. By tracing the corporate R&D
leaders in the EU Industrial R&D Investment Scoreboard over the period 2005 to 2015, we can
assess whether the top R&D spenders are incumbents or new leading R&D firms. We can also
see which countries and regions produce the leading R&D firms, comparing Europe with the
US and Asia, including China3.
To the best of our knowledge, there are virtually no studies that look at the concentra-
tion of corporate R&D globally. What is well documented is the high concentration of R&D
expenditure in a few firms within individual countries. For instance, the OECD (2017) shows
that the top 50 R&D spenders represent as much as 70 percent of all corporate R&D in small
countries like Denmark and Belgium. In large countries like Germany, France and Japan, and
even in the US, the top 50 account for more than half or close to half of all corporate R&D. Evi-
dence on the trends in concentration of the R&D landscape within countries is only available
for Germany. Rammer and Schubert (2017) and Hünermund and Rammer (2017) find that
innovation has become more concentrated over time in Germany. At the same time, they find
that the group of firms with the largest R&D budgets in Germany is highly stable.
It is important to note that the EU Industrial R&D Investment Scoreboard only covers
the largest R&D spenders worldwide, which means that we will only be characterising the
R&D distribution among the biggest spenders, thus underestimating the overall inequality of
corporate R&D. But these largest spenders in the Scoreboard are responsible for more than 80
percent of total corporate R&D4.
3 A very concentrated global corporate R&D landscape
In 2015, the most recent year covered in the 2016-17 edition of the R&D Investment Score-
board, the distribution of Scoreboard firms’ R&D expenditures was highly skewed (Table
1). The top 10 percent biggest of spenders (ie the top 250 Scoreboard firms) accounted for
71 percent of all Scoreboard R&D spending. The top 1 percent (ie the top 25) accounted for
more than a quarter. Sales and employment of Scoreboard firms are also highly concentrated,
though to a lesser extent than their R&D expenditures.
US companies took up the greatest share of the 2500 Scoreboard spots in 2015 (Figure 1),
and the greatest share of top 10 percent spots. The US weight in the top 10 percent is even
greater than its overall weight among all 2500 Scoreboard firms.
With 664 firms, Europe came second in the overall 2015 Scoreboard. With 75 places,
Europe also has a higher share of the top decile of R&D spenders than its overall share of the
Scoreboard. In 2015, there were 2.5 times more Chinese companies than German companies
in the Scoreboard, but Chinese scoreboard firms were still less likely to be among the top
1 As Schumpeter predicted in his Mark I model, in The theory of economic development (Theorie der wirtschaftlichen
Entwicklung, 1911). In this model, “the doing of new things or the doing of things that are already being done in
a new way” comes from the entrepreneurs, or wild spirits. By contrast, in Capitalism, socialism and democracy
(1942), Schumpeter’s Mark II model identified the large corporation as the driver of innovation, arguably predict-
ing a greater concentration of corporate R&D.
2 Published annually by the European Commission, http://iri.jrc.ec.europa.eu/scoreboard.html.
3 Scoreboard firms are allocated to countries/regions on the basis of the location of their headquarters.
4 In this Policy Contribution we report the major results of our analysis. More detailed results can be found in Veu-
gelers and Kalcik (2018).
4 Policy Contribution | Issue n˚06 | April 2018
decile of R&D spenders. Nevertheless, Chinese firms occupied in 2015 as many top decile
spots in the Scoreboard as German firms (20 places each).
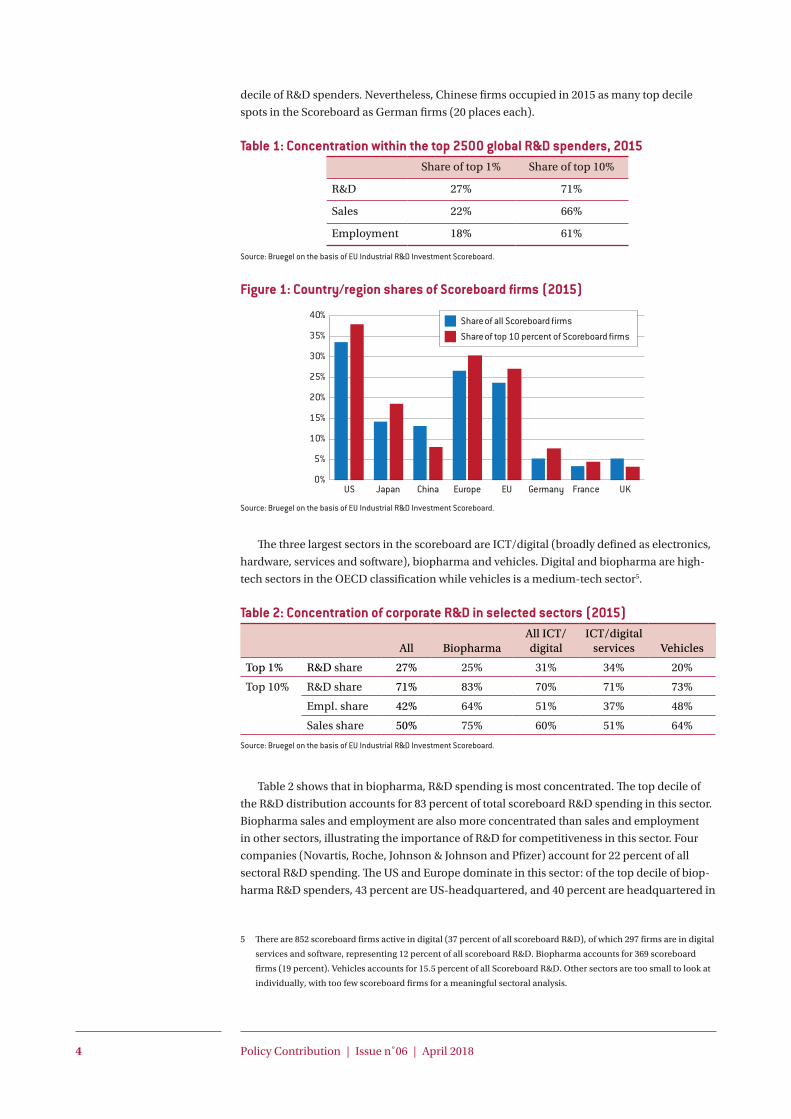
Table 1: Concentration within the top 2500 global R&D spenders, 2015Share of top 1% Share of top 10%
R&D 27% 71%
Sales 22% 66%
Employment 18% 61%
Source: Bruegel on the basis of EU Industrial R&D Investment Scoreboard.
Figure 1: Country/region shares of Scoreboard firms (2015)
Source: Bruegel on the basis of EU Industrial R&D Investment Scoreboard.
The three largest sectors in the scoreboard are ICT/digital (broadly defined as electronics,
hardware, services and software), biopharma and vehicles. Digital and biopharma are high-
tech sectors in the OECD classification while vehicles is a medium-tech sector5.
Table 2: Concentration of corporate R&D in selected sectors (2015)
All BiopharmaAll ICT/digital
ICT/digital services Vehicles
Top 1% R&D share 27% 25% 31% 34% 20%
Top 10% R&D share 71% 83% 70% 71% 73%
Empl. share 42% 64% 51% 37% 48%
Sales share 50% 75% 60% 51% 64%
Source: Bruegel on the basis of EU Industrial R&D Investment Scoreboard.
Table 2 shows that in biopharma, R&D spending is most concentrated. The top decile of
the R&D distribution accounts for 83 percent of total scoreboard R&D spending in this sector.
Biopharma sales and employment are also more concentrated than sales and employment
in other sectors, illustrating the importance of R&D for competitiveness in this sector. Four
companies (Novartis, Roche, Johnson & Johnson and Pfizer) account for 22 percent of all
sectoral R&D spending. The US and Europe dominate in this sector: of the top decile of biop-
harma R&D spenders, 43 percent are US-headquartered, and 40 percent are headquartered in
5 There are 852 scoreboard firms active in digital (37 percent of all scoreboard R&D), of which 297 firms are in digital
services and software, representing 12 percent of all scoreboard R&D. Biopharma accounts for 369 scoreboard
firms (19 percent). Vehicles accounts for 15.5 percent of all Scoreboard R&D. Other sectors are too small to look at
individually, with too few scoreboard firms for a meaningful sectoral analysis.
0%
5%
10%
15%
20%
25%
30%
35%
40%
US Japan China Europe EU Germany France UK
Share of all Scoreboard firms
Share of top 10 percent of Scoreboard firms
5 Policy Contribution | Issue n˚06 | April 2018
Europe including Switzerland.
The ICT/digital sectors are often portrayed as being ‘winners take all’, especially the
services/software sectors. Indeed, the distribution of R&D spending among ICT/digital firms
is more concentrated than average. The top 10 percent of R&D spending firms represent 70
percent of total sector spending (Table 2). Six companies (Samsung, Intel, Alphabet, Micro-
soft, Huawei and Apple) account for 24 percent.
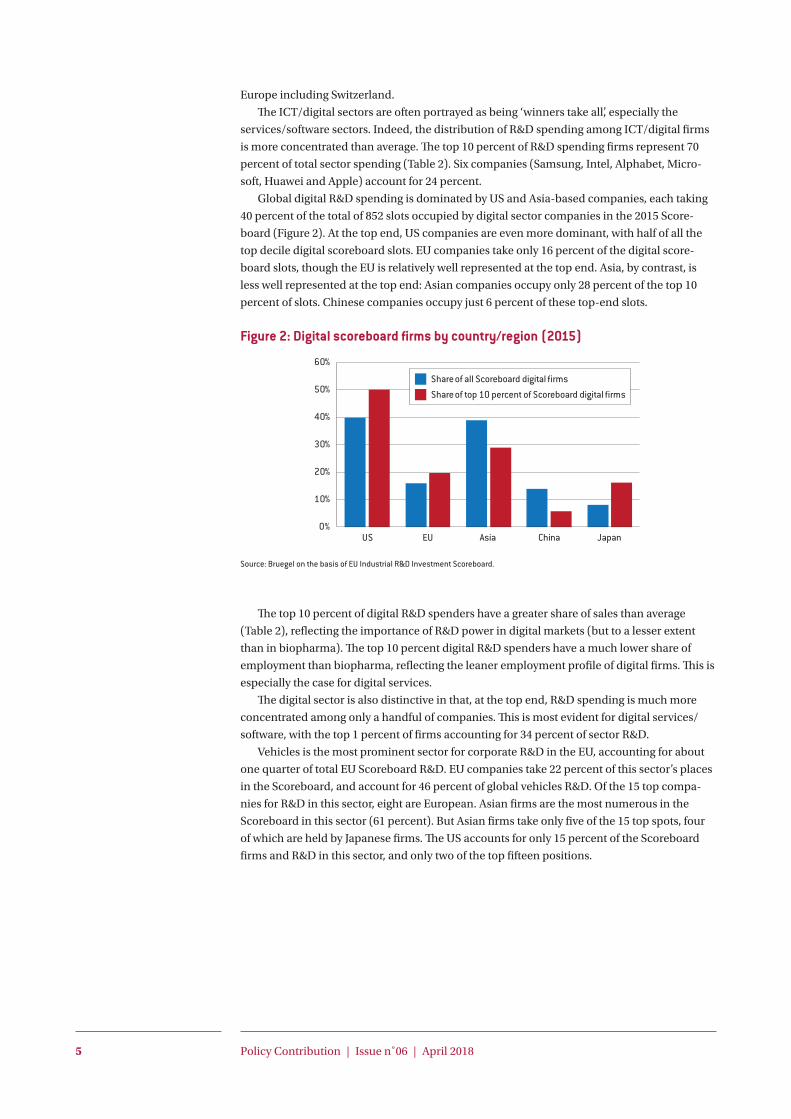
Global digital R&D spending is dominated by US and Asia-based companies, each taking
40 percent of the total of 852 slots occupied by digital sector companies in the 2015 Score-
board (Figure 2). At the top end, US companies are even more dominant, with half of all the
top decile digital scoreboard slots. EU companies take only 16 percent of the digital score-
board slots, though the EU is relatively well represented at the top end. Asia, by contrast, is
less well represented at the top end: Asian companies occupy only 28 percent of the top 10
percent of slots. Chinese companies occupy just 6 percent of these top-end slots.
Figure 2: Digital scoreboard firms by country/region (2015)
Source: Bruegel on the basis of EU Industrial R&D Investment Scoreboard.
The top 10 percent of digital R&D spenders have a greater share of sales than average
(Table 2), reflecting the importance of R&D power in digital markets (but to a lesser extent
than in biopharma). The top 10 percent digital R&D spenders have a much lower share of
employment than biopharma, reflecting the leaner employment profile of digital firms. This is
especially the case for digital services.
The digital sector is also distinctive in that, at the top end, R&D spending is much more
concentrated among only a handful of companies. This is most evident for digital services/
software, with the top 1 percent of firms accounting for 34 percent of sector R&D.
Vehicles is the most prominent sector for corporate R&D in the EU, accounting for about
one quarter of total EU Scoreboard R&D. EU companies take 22 percent of this sector’s places
in the Scoreboard, and account for 46 percent of global vehicles R&D. Of the 15 top compa-
nies for R&D in this sector, eight are European. Asian firms are the most numerous in the
Scoreboard in this sector (61 percent). But Asian firms take only five of the 15 top spots, four
of which are held by Japanese firms. The US accounts for only 15 percent of the Scoreboard
firms and R&D in this sector, and only two of the top fifteen positions.
0%
10%
20%
30%
40%
50%
60%
US EU Asia China Japan
Share of all Scoreboard digital firms
Share of top 10 percent of Scoreboard digital firms
6 Policy Contribution | Issue n˚06 | April 2018
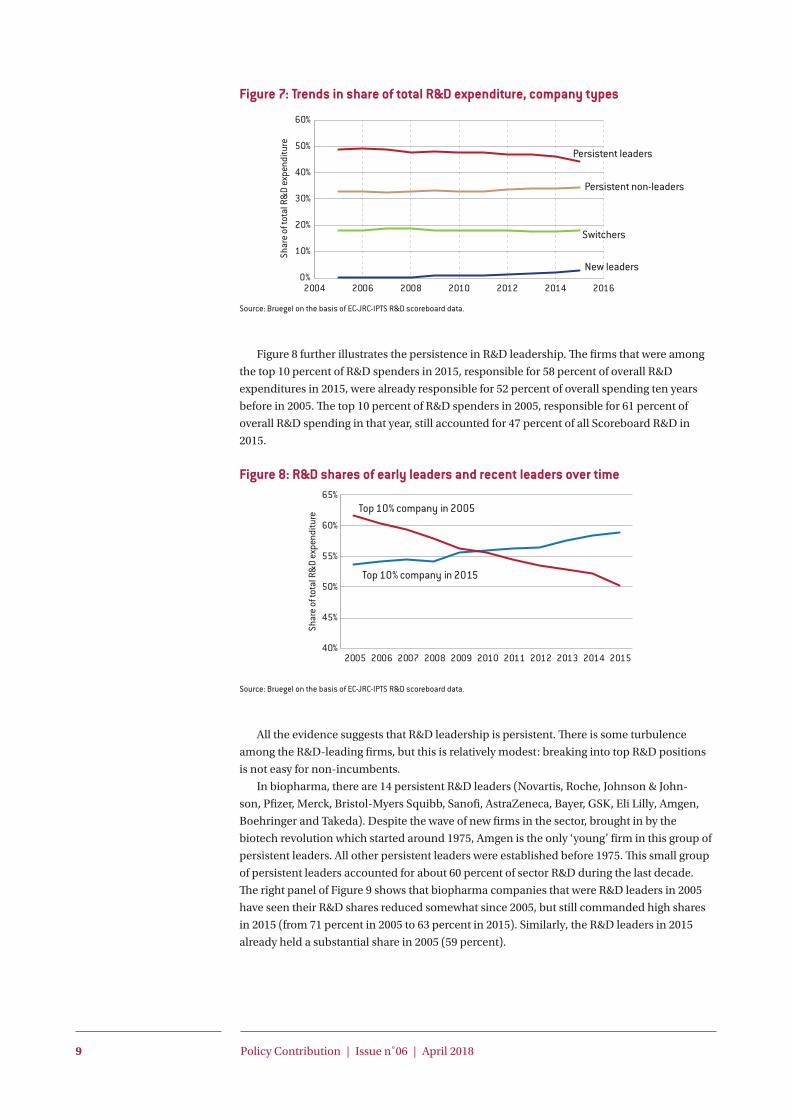
4 Trends in concentration of corporate R&DThe Scoreboard data allows changes in the concentration of corporate R&D to be tracked
over time, from 2005 to 2015. As the number of global firms covered by the Scoreboard has
changed over time, we work with the same number of firms for each year6.
Contrary to expectations, our evidence does not show a trend of rising R&D concentration,
at least not on average. The concentration of R&D expenditure, as measured by the share of
total R&D spending accounted for by the top 10 percent of spenders (Figure 3, right panel),
has declined over time, although only slowly and concentration remains high. A similar trend
is seen in terms of concentration of employment by Scoreboard firms. However, the concen-
tration of the sales of Scoreboard firms, while declining before the crisis, increased post-crisis,
dipping again in 2015.
While the top 10 percent’s share of overall R&D expenditures has declined, the share taken
by the top 1 percent has since 2012 started to increase (Figure 3, left panel).
Figure 3: Trends in shares of Scoreboard employment, sales and R&D by, top 1 percent and top 10 percent of firms
Source: Bruegel on the basis of EC-JRC-IPTS R&D scoreboard data.
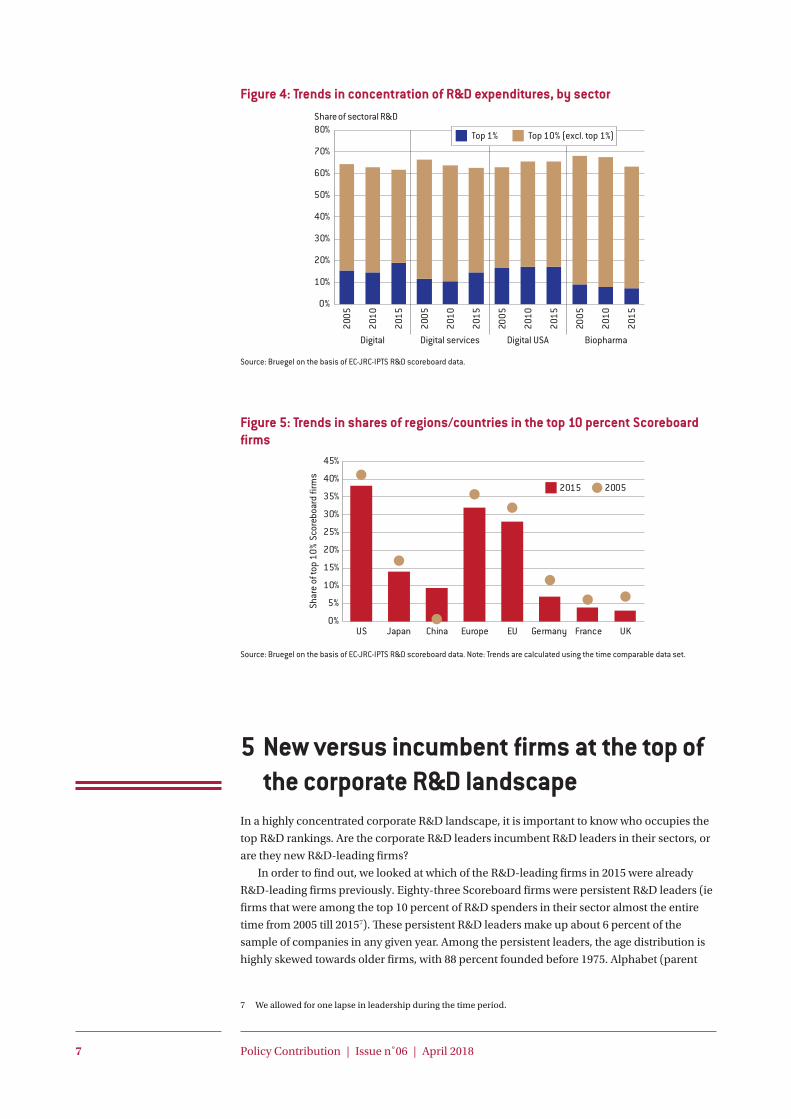
Figure 4 zooms in on the trends in the two major sectors in the Scoreboard: biopharma
and digital. For biopharma, the time-comparable sample contains 213 Scoreboard firms.
For this sample, the R&D share of the top 10 percent (as well as of the top 1 percent), has
gone down, particularly more recently, but it is still considerable. For the digital sector, the
time comparable sample contains 475 Scoreboard firms. For this set, R&D concentration,
measured by the share accounted for by the top decile of R&D spending firms, declined only
slightly. By contrast, the share of the top 1 percent of digital firms went up from 15 percent
to 19 percent. This increasing share for the top 1 percent of R&D spenders has been realised
without increasing shares of sales or employment (Veugelers and Kalcik, 2018) and reflects an
increasing focus on R&D on the part of the uppermost level of digital companies. This recent
increasing concentration in the top 1 percent is most evident for the US and in digital services.
Figure 5 shows how the share of R&D spending of Chinese firms has grown. While only
one top 10 percent firm in 2005 was Chinese (PetroChina), by 2015, 12 were. All other coun-
tries/regions lost share at the top. Germany suffered relatively the most, with German firms
taking 15 top 10 percent slots in 2005, declining to nine in 2015.
6 The 2015 Scoreboard included 1337 firms that could be tracked over time. This subsample accounts for 94 percent
of total 2015 Scoreboard R&D expenditure. By focusing on this time-comparable sample, we are excluding smaller
firms included in the Scoreboard, resulting in lower concentration compared to the full sample in every year
(except for 2005).
10%
12%
14%
16%
18%
20%
22%
2004
2006
2008
2010
2012
2014
2016
50%52%54%56%58%60%62%64%66%68%
2004
2006
2008
2010
2012
2014
2016
R&D
Sales
Employment
R&D
Sales
Employment
Top 1% Top 10%
7 Policy Contribution | Issue n˚06 | April 2018
Figure 4: Trends in concentration of R&D expenditures, by sector
Source: Bruegel on the basis of EC-JRC-IPTS R&D scoreboard data.
Figure 5: Trends in shares of regions/countries in the top 10 percent Scoreboard firms
Source: Bruegel on the basis of EC-JRC-IPTS R&D scoreboard data. Note: Trends are calculated using the time comparable data set.
5 New versus incumbent firms at the top of the corporate R&D landscape
In a highly concentrated corporate R&D landscape, it is important to know who occupies the
top R&D rankings. Are the corporate R&D leaders incumbent R&D leaders in their sectors, or
are they new R&D-leading firms?
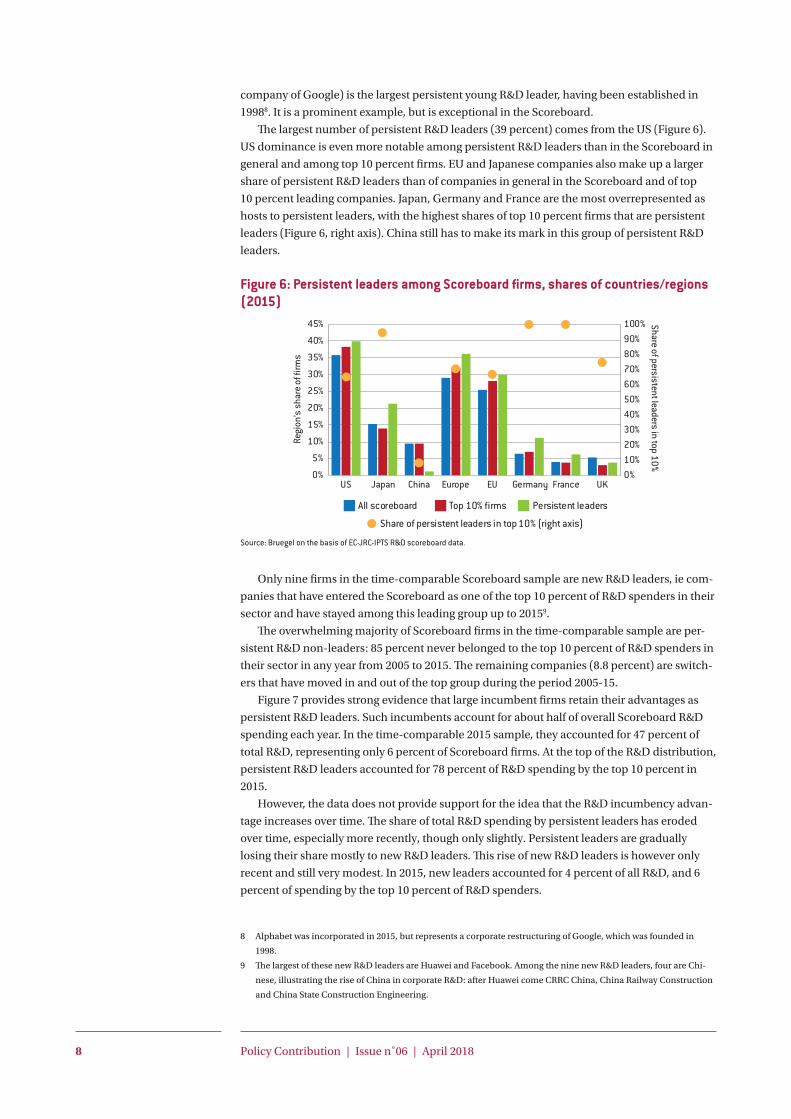
In order to find out, we looked at which of the R&D-leading firms in 2015 were already
The top 10 percent of R&D-spending firms in biopharma are more or less equally divided
between the Europe and the US, and have been since 2005. The first 10 places in the 2015 rank-
ing were taken by old, incumbent firms from Europe and the US. Of the top 10 percent of R&D
spenders in this sector, about one quarter are firms established after 1975 as part of the biotech
wave. These ‘young’ firms accounted for 17.5 percent of R&D spending by the top decile of R&D
spenders in the sector in 2015.
The largest young biotech R&D spenders are all from the US: AbbVie (ranked 11th in 2015)10,
Amgen (13), Celgene (14) and Gilead Sciences (16).
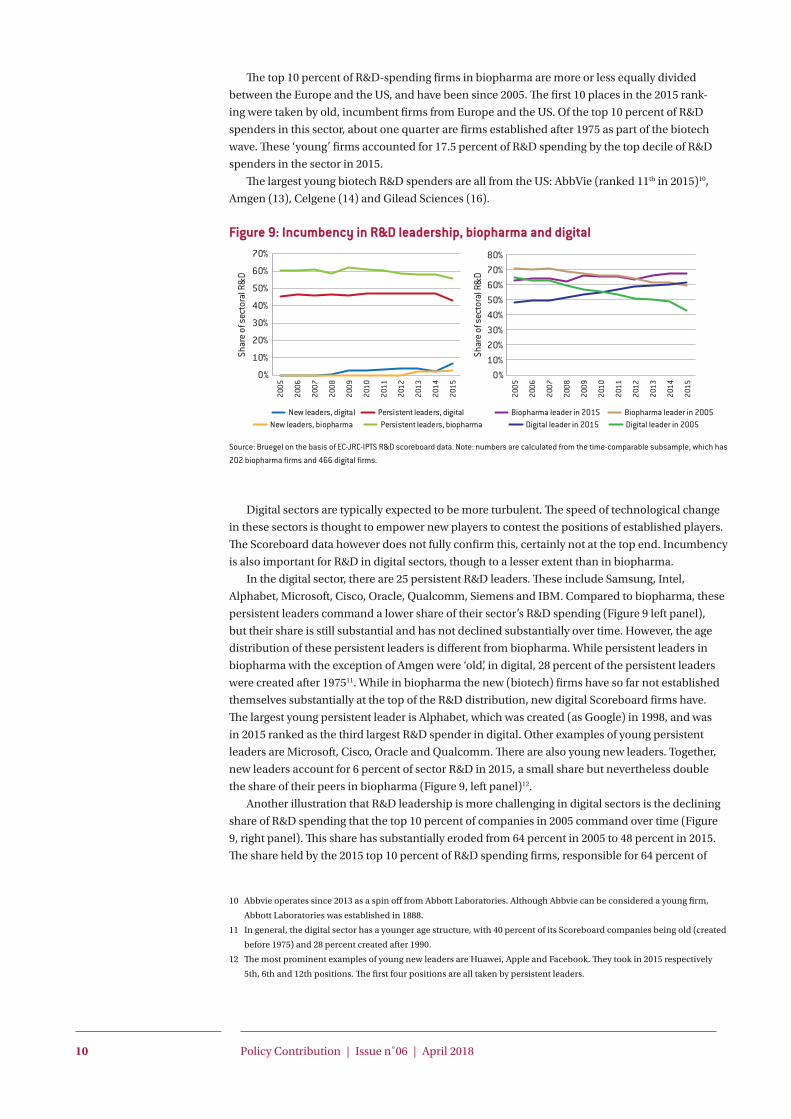
Figure 9: Incumbency in R&D leadership, biopharma and digital
Source: Bruegel on the basis of EC-JRC-IPTS R&D scoreboard data. Note: numbers are calculated from the time-comparable subsample, which has 202 biopharma firms and 466 digital firms.
Digital sectors are typically expected to be more turbulent. The speed of technological change
in these sectors is thought to empower new players to contest the positions of established players.
The Scoreboard data however does not fully confirm this, certainly not at the top end. Incumbency
is also important for R&D in digital sectors, though to a lesser extent than in biopharma.
In the digital sector, there are 25 persistent R&D leaders. These include Samsung, Intel,
Alphabet, Microsoft, Cisco, Oracle, Qualcomm, Siemens and IBM. Compared to biopharma, these
persistent leaders command a lower share of their sector’s R&D spending (Figure 9 left panel),
but their share is still substantial and has not declined substantially over time. However, the age
distribution of these persistent leaders is different from biopharma. While persistent leaders in
biopharma with the exception of Amgen were ‘old’, in digital, 28 percent of the persistent leaders
were created after 197511. While in biopharma the new (biotech) firms have so far not established
themselves substantially at the top of the R&D distribution, new digital Scoreboard firms have.
The largest young persistent leader is Alphabet, which was created (as Google) in 1998, and was
in 2015 ranked as the third largest R&D spender in digital. Other examples of young persistent
leaders are Microsoft, Cisco, Oracle and Qualcomm. There are also young new leaders. Together,
new leaders account for 6 percent of sector R&D in 2015, a small share but nevertheless double
the share of their peers in biopharma (Figure 9, left panel)12.
Another illustration that R&D leadership is more challenging in digital sectors is the declining
share of R&D spending that the top 10 percent of companies in 2005 command over time (Figure
9, right panel). This share has substantially eroded from 64 percent in 2005 to 48 percent in 2015.
The share held by the 2015 top 10 percent of R&D spending firms, responsible for 64 percent of
10 Abbvie operates since 2013 as a spin off from Abbott Laboratories. Although Abbvie can be considered a young firm,
Abbott Laboratories was established in 1888.
11 In general, the digital sector has a younger age structure, with 40 percent of its Scoreboard companies being old (created
before 1975) and 28 percent created after 1990.
12 The most prominent examples of young new leaders are Huawei, Apple and Facebook. They took in 2015 respectively
5th, 6th and 12th positions. The first four positions are all taken by persistent leaders.
0%10%20%30%40%50%60%70%80%
Shar
e of
sec
tora
l R&
D
0%
10%
20%
30%
40%
50%
60%
70%
2005
2006
2007
2008
2009
2010
2011
2012
2013
2014
2015
New leaders, digital Persistent leaders, digitalNew leaders, biopharma Persistent leaders, biopharma
Shar
e of
sec
tora
l R&
D
2005
2006
2007
2008
2009
2010
2011
2012
2013
2014
2015
Biopharma leader in 2015 Biopharma leader in 2005Digital leader in 2015 Digital leader in 2005
11 Policy Contribution | Issue n˚06 | April 2018
sector R&D in 2015, was only 43 percent in 2005, illustrating their more recent prominence as
R&D leaders.
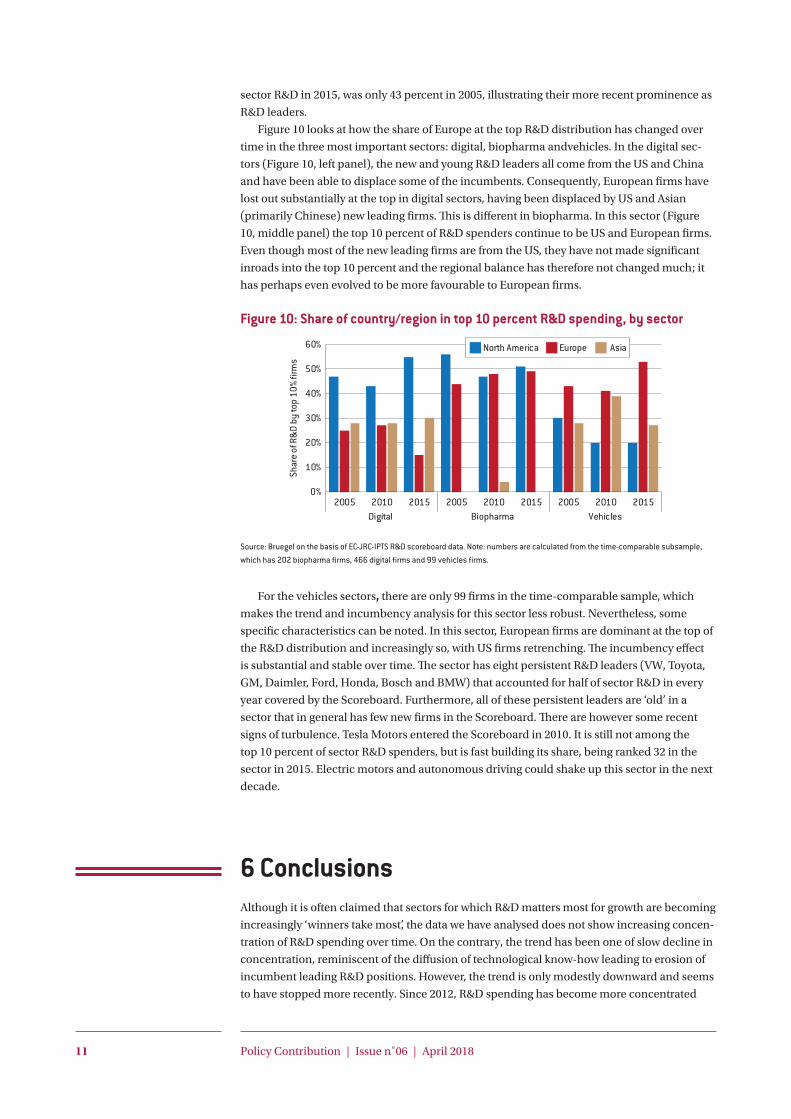
Figure 10 looks at how the share of Europe at the top R&D distribution has changed over
time in the three most important sectors: digital, biopharma andvehicles. In the digital sec-
tors (Figure 10, left panel), the new and young R&D leaders all come from the US and China
and have been able to displace some of the incumbents. Consequently, European firms have
lost out substantially at the top in digital sectors, having been displaced by US and Asian
(primarily Chinese) new leading firms. This is different in biopharma. In this sector (Figure
10, middle panel) the top 10 percent of R&D spenders continue to be US and European firms.
Even though most of the new leading firms are from the US, they have not made significant
inroads into the top 10 percent and the regional balance has therefore not changed much; it
has perhaps even evolved to be more favourable to European firms.
Figure 10: Share of country/region in top 10 percent R&D spending, by sector
Source: Bruegel on the basis of EC-JRC-IPTS R&D scoreboard data. Note: numbers are calculated from the time-comparable subsample, which has 202 biopharma firms, 466 digital firms and 99 vehicles firms.
For the vehicles sectors, there are only 99 firms in the time-comparable sample, which
makes the trend and incumbency analysis for this sector less robust. Nevertheless, some
specific characteristics can be noted. In this sector, European firms are dominant at the top of
the R&D distribution and increasingly so, with US firms retrenching. The incumbency effect
is substantial and stable over time. The sector has eight persistent R&D leaders (VW, Toyota,
GM, Daimler, Ford, Honda, Bosch and BMW) that accounted for half of sector R&D in every
year covered by the Scoreboard. Furthermore, all of these persistent leaders are ‘old’ in a
sector that in general has few new firms in the Scoreboard. There are however some recent
signs of turbulence. Tesla Motors entered the Scoreboard in 2010. It is still not among the
top 10 percent of sector R&D spenders, but is fast building its share, being ranked 32 in the
sector in 2015. Electric motors and autonomous driving could shake up this sector in the next
decade.
6 ConclusionsAlthough it is often claimed that sectors for which R&D matters most for growth are becoming
increasingly ‘winners take most’, the data we have analysed does not show increasing concen-
tration of R&D spending over time. On the contrary, the trend has been one of slow decline in
concentration, reminiscent of the diffusion of technological know-how leading to erosion of
incumbent leading R&D positions. However, the trend is only modestly downward and seems
to have stopped more recently. Since 2012, R&D spending has become more concentrated
among the top 1 percent of R&D spenders. The US is most strongly represented at the top, but
together with Europe and Japan has been losing ground to China.
The data shows that persistent leaders take up most of the top rankings for R&D spend-
ing and account for the major share of sectoral R&D. Companies that were among the R&D
leaders in the past are still responsible for a high share of their sector’s R&D currently. The US
is home to most of these persistent R&D leaders, particularly in ICT/digital sectors. But the
EU is also relatively well represented as the home base for persistent R&D leaders, particularly
in biopharma and vehicles.
Global biopharma R&D in particular is highly concentrated among a few persistent R&D
leaders from the US and Europe. The biotech revolution in the 1970s saw the creation of new
companies that are now part of the EU Industrial R&D Investment Scoreboard, but few of
these companies have made it into or close to the top decile of sectoral R&D spenders. Those
that have succeeded are all US based. Over time, concentration in this sector has lessened,
but only slowly. The large incumbent R&D spenders in this sector, from both the US and
Europe, seem to have been successful in addressing the biotech challenge.
In ICT/digital sectors, R&D concentration and persistence in R&D leadership are high. But
compared to biopharma, there is more turbulence and churn in R&D leadership positions,
with new R&D leaders emerging. In digital services in particular, new firms are taking over
top 10 percent slots. But more recently, concentration of R&D spending in the top 1 percent of
spenders has risen and turbulence at the top has cooled. As the new and young leading R&D
firms in digital sectors are all from US and Asia (particularly China), Europe has lost out in
terms of top R&D shares.
Further analysis is clearly needed to answer whether this concentration of R&D among
few incumbent firms reflects the R&D advantages large incumbents have or reflects the barri-
ers new firms face in growing into R&D superstars. The evidence of declining concentration is
a positive sign, but continued dominance of the incumbents and the slow pace and unsteady
momentum of the declining concentration trend require further monitoring and analysis to
understand their implications for the overall performance of the corporate R&D system to
deliver innovation-based growth to the world economy.
Nevertheless, some issues for policy can be highlighted at this stage. For innovation policy,
it is important to recognise that overall corporate R&D performance depends on a handful of
firms. Getting to know who these few leading R&D firms are and how their R&D position in
their sector develops over time will matter crucially for the overall innovative performance of
countries, regions and the world at large. Understanding the innovation efficiencies incum-
bent leaders and/or new leading firms might enjoy will matter for assessing the power of
innovation to generate growth.
For competition policy, it is important to understand whether the highly concentrated
R&D landscape and trends therein are associated with leading R&D firms enjoying innova-
tive advantages, how contestable existing leading positions are, how R&D leaders can turn
their R&D weight into market power and how that might impact long-term overall consumer
welfare. It is important to know if leading firms use their dominant R&D positions to raise
entry barriers against more efficient new innovators. This will involve a more vigorous anti-
trust analysis and merger analysis, assessing dynamic efficiency advantages when incumbent
R&D leaders are pursuing potential acquisitions. Perhaps most important in this respect are
merger cases in which incumbent R&D leaders take over currently still small, but potentially
new R&D leaders. These merger cases are currently typically too small to be on the radar for
EU competition policy authorities. They should not be.
For EU policymakers in particular, this analysis contains a wake-up call. Although the
EU seems to fare relatively well in hosting large incumbent R&D leaders, it seems to be
less well placed to host entrepreneurial talents riding on new technology shifts to displace
incumbents and take up new leading R&D positions. With the US, and more recently China,
hosting most of the new R&D leaders, especially in digital sectors but also in other sectors,
the weaker creative-destruction power of the EU corporate R&D system could contribute to a
‘The EU seems to fare relatively well in hosting large incumbent R&D leaders but is less well placed to host entrepreneurial talents riding on new technology shifts.’
13 Policy Contribution | Issue n˚06 | April 2018
shifting regional R&D pattern to Europe’s detriment. As technological progress continues to
send shock waves through the global R&D landscape, the EU needs to beef up its capacity to
activate its entrepreneurial spirits to generate the next generation of new leading firms. At the
same time, it will also be important for the EU that its large incumbent R&D leaders respond
rapidly to the challenges from new technology waves to leverage their cumulated advantages.
The redirection of corporate R&D in the vehicles sector from the classic combustion engine to
electric and digital technologies will be a critical test for the EU.
ReferencesAutor, D., D. Dorn, L.F. Katz, C. Patterson and J. Van Reenen (2016) ‘The Fall of the Labor Share and the
Rise of Superstar Firms’, Working Paper, Massachusetts Institute of Technology
Bloom, N. (2017) ‘Corporations in the age of inequality’, Harvard Business Review, available at https://hbr.