RAND Health Executive Summary of Analyses for the Initial Implementation of the Inpatient Rehabilitation Facility Prospective Payment System Grace M. Carter, Joan L. Buchanan, Melinda Beeuwkes Buntin, Orla Hayden, Susan Paddock, Daniel A. Relles, Greg Ridgeway, Mark Totten, Barbara Wynn Prepared for the Centers for Medicare and Medicaid Services Approved for public release; distribution unlimited R
Transcript
RAND Health
Executive Summary of Analysesfor the Initial Implementation ofthe Inpatient RehabilitationFacility Prospective PaymentSystem
Grace M. Carter, Joan L. Buchanan, Melinda Beeuwkes Buntin, Orla Hayden, Susan Paddock, Daniel A. Relles, Greg Ridgeway,Mark Totten, Barbara Wynn
Prepared for the Centers for Medicare and Medicaid Services
Approved for public release; distribution unlimited
R
- iii -
PREFACE
This report describes the research that RAND performed to support the efforts of the Health Care
Financing Administration (HCFA) to design, develop, and implement a Prospective Payment System (PPS)
for inpatient rehabilitation. It presents recommendations concerning the payment system and also discusses
our plans for further research on the monitoring and refinement of the PPS.
In the Balanced Budget Act of 1997, Congress mandated that HCFA implement a PPS for inpatient
rehabilitation. The Centers for Medicare and Medicaid Services (CMS, the successor agency to HCFA)
issued the final rule governing such a PPS on August 7, 2001. The PPS will start on January 1, 2002. This
rule reflects policy analyses and decisions that took into account other contextual analyses and the
experience of other PPSs as well as the research presented here. This report is a research document, not a
policy document, and should be viewed as a contribution to understanding inpatient rehabilitation.
This is an executive summary of research reported more fully in four other volumes. They are:
Carter, G. M., M. Beeuwkes Buntin, O. Hayden, J. Kawata, S. M. Paddock, D. A. Relles, G. K.Ridgeway, M. E. Totten, and B. O. Wynn (2001). Analyses for the Initial Implementation of theInpatient Rehabilitation Facility Prospective Payment System. Santa Monica, CA: RAND, MR-1500-CMS.
Buchanan, J. L., P. Andres, S. Haley, S. M. Paddock, D. C. Young, and A. Zaslavsky (2002). FinalReport on Assessment Instruments for PPS. Santa Monica, CA: RAND, MR-1501-CMS.
Relles, D. A., and G. M. Carter (2002). Linking Medicare and Rehabilitation Hospital Records toSupport Development of a Rehabilitation Hospital Prospective Payment System. Santa Monica,CA: RAND, MR-1502-CMS.
Carter, G. M., D. A. Relles, B. O. Wynn, J. Kawata, S. M. Paddock, N. Sood, and M. E. Totten(2002). Interim Report on an Inpatient Rehabilitation Facility Prospective Payment System. SantaMonica, CA: RAND, MR-1503-CMS.
The second volume listed above evaluates two alternative data instruments that had been proposed
as a means of gathering case mix data from hospitals. The first volume provides analyses related to all other
aspects of the new payment system. The Relles et al. report provides additional information on our
database, especially about the methodology used to link multiple sources of data describing the same
discharge. The last volume is a preliminary report that HCFA used to help prepare the Notice of Proposed
Rule Making during the summer and fall of 2000.
Together, these documents constitute the final report for phase I of our study of the design,
development, monitoring, and refinement of an Inpatient Rehabilitation Facility Prospective Payment
System.
- iv -
This research has been supported by HCFA through contract 500-95-0056. The Buchanan et al.
study was performed largely at Harvard, through a subcontract, with funding coming through the same
HCFA-RAND contract.
- v -
CONTENTS
Preface ................................................................................................................................................................... iii
Figures .................................................................................................................................................................. vii
Tables .................................................................................................................................................................. viii
Acknowledgments................................................................................................................................................. ix
Members of Technical Expert Panel on the Inpatient Rehabilitation FacilityProspective Payment System..................................................................................................................... xi
Acronyms ............................................................................................................................................................ xiii
INTRODUCTION.................................................................................................................................................. 1Payment Under the IRF PPS............................................................................................................. 1Approach............................................................................................................................................ 2
DATA ..................................................................................................................................................................... 2DEVELOPING NEW FUNCTION-RELATED GROUPS ................................................................................. 4
Rehabilitation Impairment Categories.............................................................................................. 4Classifying by Function and Age...................................................................................................... 4Evaluating Groups ............................................................................................................................. 5
Payment for Transfer Cases .............................................................................................................. 8Payment for Deaths and Atypical Short-Stay Cases ........................................................................ 9Bundling............................................................................................................................................. 9
OUTLIER PAYMENTS...................................................................................................................................... 14RELATIONSHIP BETWEEN HOSPITAL PAYMENT AND COST IN THE IRF PPS................................ 14CONVERSION FACTOR................................................................................................................................... 15ASSESSMENT INSTRUMENTS FOR PPS...................................................................................................... 16
Coding the Impairment that is the Primary Reason for Admission............................................... 16Estimating FIM Scales from MDS-PAC Data ............................................................................... 17Estimating CMGs ............................................................................................................................ 18Reliability and Accuracy................................................................................................................. 18Administration Cost ........................................................................................................................ 19Overview of Instrument Analyses .................................................................................................. 19
1. Actual and Predicted FRG Means..................................................................................................... 6
- viii -
TABLES
1. Size of Universe and Percent in Analysis Sample,by Calendar Year................................................................................................................................ 3
2. Conditions in Each Comorbidity Tier ............................................................................................... 8
3. Percent of Variance in Facilities’ Cost Explained by theIRF PPS ............................................................................................................................................ 15
A.1 Definitions of CMGs........................................................................................................................ 23
- ix -
ACKNOWLEDGMENTS
We thank our CMS project officer, Carolyn Rimes, for her continued support throughout the project
and for her rapid response to our requests for data and review of this draft report. Her suggestions and
comments on the research were always useful. She also arranged frequent, very helpful telephone
conversations with various CMS staff. We would particularly like to thank Nora Hoban and Robert Kuhl
for their willing participation in these calls, which helped us understand HCFA’s analyses needs and
HCFA’s data.
We thank Dr. Margaret Stineman of the University of Pennsylvania and Dr. Laurie Feinberg of
CMS for helpful discussions concerning impairment groups and comorbidities.
We thank Carl Granger and Dick Linn of UDSmr (Uniform Data System for medical rehabilitation),
Jill Engholm of Caredata.com, and Jean Davis of HealthSouth for the use of their data and for their help in
data interpretation.
We are grateful to Jose Escarce of RAND Health for many suggestions for improvements to an
earlier draft of this report.
The members of our Technical Expert Panel (TEP) reviewed our interim report and this final report.
During these reviews and in subsequent discussions and correspondence they made many suggestions that
have been incorporated into the analyses that are presented here. We thank each of the TEP members,
whose names are listed on the next page, for their time and effort.
We thank Donna White for her assistance throughout this project, including her careful preparation
of multiple versions of this manuscript.
- xi -
Members of Technical Expert Panel on the Inpatient Rehabilitation Facility
Prospective Payment System
Ken Aitchison Robert KaneKessler Institute for Rehabilitation University of Minnesota
Joan August Sally KaplanCedars-Sinai Medical Center MedPAC
James Ball Richard LinnCatholic Health Services State University of New York
Jean Davis John MelvinHealth South Corp. Moss Rehabilitation Group
Susan Dean-Baar John MorrisUniversity of Wisconsin Hebrew Rehab. Center for Aged
Research & Training InstituteFrank GainerGreater Southeast Community Hospital Paul Rao
National Rehabilitation HospitalNorbert Goldfield3MHIS Pam Roberts
Cedars Sinai Medical CenterStuart GutermanCongressional Budget Office Elliot Roth
Northwestern University MedicalKurt Hoppe SchoolIowa Health System
Barry SmithBrad Hutchins Baylor Health SystemsOral Health America
Margaret StinemanAlan Jette University of PennsylvaniaBoston University
Carolyn ZollarAMRPA
- xiii -
ACRONYMS
CART Classification and Regression Trees
CMG Case Mix Group
CMI Case Mix Index
CMS Centers for Medicare and Medicaid Services (successor
agency to HCFA)
COS Clinical Outcomes Systems
CY Calendar year
FIM Functional Independence Measure
FRG Function Related Group
FRGC Function Related Group with comorbidities
FY Fiscal year
GAM Generalized Additive Models
HCFA Health Care Financing Administration
HSRV Hospital Specific Relative Value
IRF Inpatient Rehabilitation Facility
LE Lower extremity
LOS Length of stay
MART Multiple Adaptive Regression Trees
MDS-PAC Minimum Data Set–Post Acute Care
MEDPAR Medicare Provider Analysis and Review
MMT Major multiple trauma
NPRM Notice of Proposed Rule Making
PAC Post-acute care
PAI Patient assessment instrument
PPS Prospective Payment System
RIC Rehabilitation Impairment Category
SSI Supplemental Security Income
TEFRA Tax Equity and Fiscal Responsibility Act
TEP Technical Expert Panel
- 1 -
INTRODUCTION
In the Balanced Budget Act of 1997, Congress mandated that the Health Care Financing
Administration (HCFA) implement a Prospective Payment System (PPS) for inpatient rehabilitation under
Medicare. This new PPS will be implemented beginning January 1, 2002. This report describes the research
that RAND performed to support HCFA’s efforts to design, develop, and implement this Inpatient
Rehabilitation Facility PPS, or IRF PPS. It presents recommendations concerning the payment system and
also discusses our plans for further research on the monitoring and refinement of the PPS.
The new PPS will apply to rehabilitation hospitals and to distinct rehabilitation units of acute care
hospitals that were excluded from the acute care PPS. Medicare patients in such facilities must receive
intensive therapy (generally at least three hours per day). In addition, 75 percent of each facility’s patients
must have one of ten specified problems related to neurological or musculoskeletal disorders or burns.
Since 1982, Medicare payment for these rehabilitation facilities has been made under the Tax
Equity and Fiscal Responsibility Act (TEFRA). The payment amount depends on a per-case target amount
that is calculated from historical costs at the facility trended forward and on the hospital’s actual cost per
case. Under TEFRA, there is no adjustment for changes in a hospital’s case mix or for outlier cases. This
lack of adjustment creates incentives for providers to specialize in relatively less-expensive cases and, as a
result, might limit beneficiary access. TEFRA pays for discharges that do not include a full course of
rehabilitation (e.g., short stays for evaluation, transfer cases) as full cases. These payments in excess of
costs may have both quality and cost-control implications.
TEFRA was widely perceived to be unfair to older hospitals. Until the Balanced Budget Act of
1997, newer hospitals were not subject to the same incentives for efficiency and indeed were rewarded for
incurring higher costs in their base year(s).
The initial design of the IRF PPS was first presented in a Notice of Proposed Rule Making (NPRM)
(HCFA, 2000). Our interim report, Carter et al. (2002), presented analyses that HCFA used to help make its
decisions in the NPRM. In this report, we update these analyses using more-recent data. We also improve
the analysis and our recommendations to the Centers for Medicare and Medicaid Services (CMS, the
successor agency to HCFA) by taking into account comments made by our Technical Expert Panel (TEP)
in its review of our interim report, as well as suggestions made by HCFA staff in response to public
comments on the NPRM. This is a report of research. The final decisions made by CMS and the rationale
for those decisions may be found in the rule governing the IRF PPS (CMS, 2001).
Payment Under the IRF PPS
The unit of payment in the IRF PPS will be a Medicare-covered hospital stay, beginning with an
admission to the rehabilitation hospital or unit and ending with discharge from that facility. Each case will
be classified into a Case Mix Group, or CMG. The CMGs are based on impairment, functional status as
- 2 -
measured by items from the Functional Independence Measure (FIM), age, and comorbidities. The CMGs
will be assigned based on information in a new patient assessment instrument (the IRF PAI). Additional
groups for deaths and atypically short stay cases will be assigned based on claims data.
The IRF PPS payment for a discharge in hospital i in CMG k is given by
F = R * Ai * Wk ,
where R is the national conversion factor, Ai is the facility payment adjustment, and Wk is the CMG
relative weight. This payment will be increased for outlier cases. Also, short-stay transfer cases will receive
a payment for each day in the hospital plus a case-level payment equal to one-half of one day’s payment.
Two-thirds of the IRF PPS payment amount plus one-third of the amount that would be paid under
TEFRA will be paid in fiscal year (FY) 2002. Facilities may choose to be paid entirely under the IRF PPS
in FY 2002. In the following years, all payments to all IRFs will be made under the IRF PPS. The initial
value of R was chosen to meet the statutory budget neutrality constraint that payment under the new PPS
should equal what payment would have been under TEFRA, as estimated by the CMS’s Office of the
Actuary.
Approach
To ensure access to quality care for all Medicare patients, the PPS must identify patient groups that
need different levels of resources and then pay for each group in proportion to cost. The system should be
fair to hospitals by paying for costs that are outside the control of hospital administrators, such as area wage
levels or a population that is disproportionately poor. The payment system must allow CMS to control its
budget for post-acute care. It must provide incentives for hospitals to provide quality care and limit
incentives for “gaming the system.”
In order to meet these criteria, all major system parameters are calculated from data describing
rehabilitation facilities’ case mix and cost. We began our work using only 1996 and 1997 data and made
recommendations for HCFA’s use in developing the NPRM. In this final report, we have extended our
analyses and updated them with 1998 and 1999 data.
Finally, we analyzed options for each of the elements of the PPS. This executive summary presents
the major findings from these analyses and our recommendations to CMS.
DATA
Our primary data source is a file that provides case mix data on Medicare discharges from inpatient
rehabilitation facilities. We also used annual Medicare cost reports and a file constructed by the CMS
Office of the Actuary that projects the cost report data into FY 2002. We constructed a file of hospital
characteristics, which we used to analyze hospital costs and the likely outcome of policy alternatives.
- 3 -
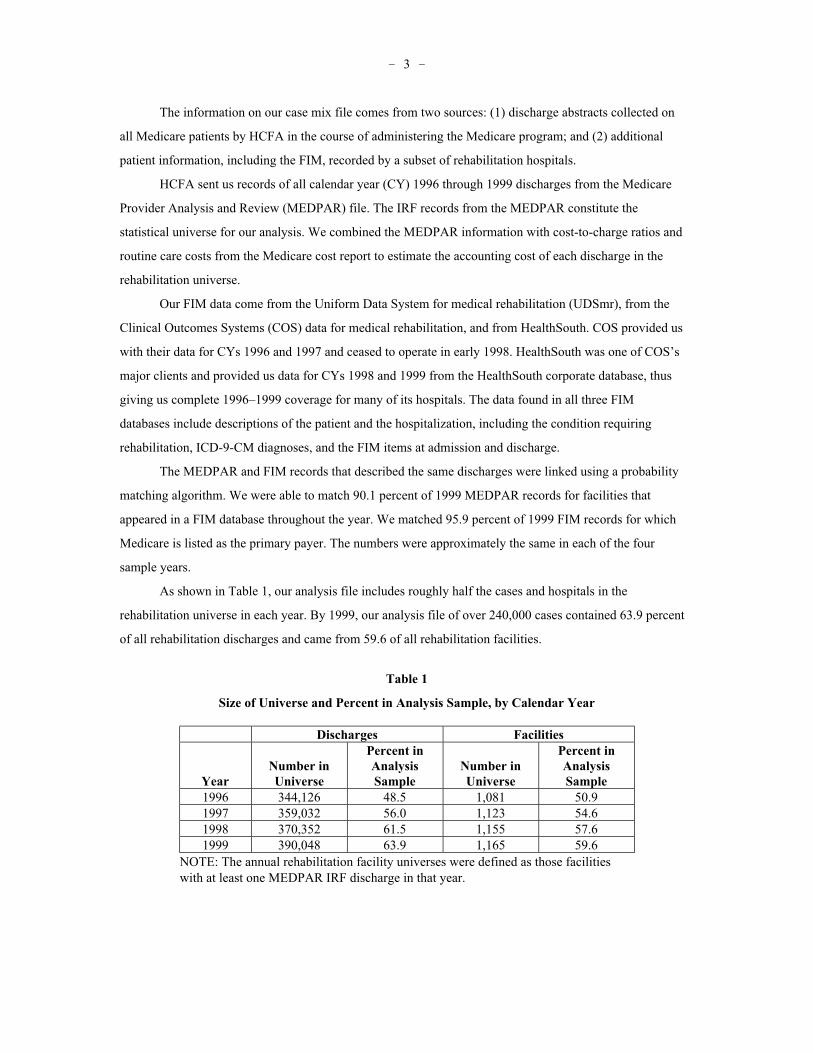
The information on our case mix file comes from two sources: (1) discharge abstracts collected on
all Medicare patients by HCFA in the course of administering the Medicare program; and (2) additional
patient information, including the FIM, recorded by a subset of rehabilitation hospitals.
HCFA sent us records of all calendar year (CY) 1996 through 1999 discharges from the Medicare
Provider Analysis and Review (MEDPAR) file. The IRF records from the MEDPAR constitute the
statistical universe for our analysis. We combined the MEDPAR information with cost-to-charge ratios and
routine care costs from the Medicare cost report to estimate the accounting cost of each discharge in the
rehabilitation universe.
Our FIM data come from the Uniform Data System for medical rehabilitation (UDSmr), from the
Clinical Outcomes Systems (COS) data for medical rehabilitation, and from HealthSouth. COS provided us
with their data for CYs 1996 and 1997 and ceased to operate in early 1998. HealthSouth was one of COS’s
major clients and provided us data for CYs 1998 and 1999 from the HealthSouth corporate database, thus
giving us complete 1996–1999 coverage for many of its hospitals. The data found in all three FIM
databases include descriptions of the patient and the hospitalization, including the condition requiring
rehabilitation, ICD-9-CM diagnoses, and the FIM items at admission and discharge.
The MEDPAR and FIM records that described the same discharges were linked using a probability
matching algorithm. We were able to match 90.1 percent of 1999 MEDPAR records for facilities that
appeared in a FIM database throughout the year. We matched 95.9 percent of 1999 FIM records for which
Medicare is listed as the primary payer. The numbers were approximately the same in each of the four
sample years.
As shown in Table 1, our analysis file includes roughly half the cases and hospitals in the
rehabilitation universe in each year. By 1999, our analysis file of over 240,000 cases contained 63.9 percent
of all rehabilitation discharges and came from 59.6 of all rehabilitation facilities.
Table 1
Size of Universe and Percent in Analysis Sample, by Calendar Year
Trees (MART). These powerful predictive models produce complicated functions. Although very accurate,
the functions are not amenable to creating a readily understood classification system for payment.
Rehabilitation Impairment Categories
The first step in the development of FRGs is to partition the data into clinically similar groups,
called Rehabilitation Impairment Categories (RICs), based on the primary reason for the rehabilitation
admission. In our interim report, we evaluated many alternative ways to group impairment codes to predict
new RICs. We found only two improvements over the grouping that was used in version 2 of the FRGs
(Stineman et al, 1997).
• We defined a new RIC for burns.
• We grouped “status post major multiple fractures” in the “major multiple trauma without brain orspinal cord injury” RIC.
In the NPRM, HCFA used our recommended definitions for 21 RICs. Throughout this report, we also use
the same definitions.
Classifying by Function and Age
The second step in the creation of FRGs is to partition the cases within each RIC into groups that
are relatively homogeneous with respect to cost. CART does so by repeated binary splits on the
independent variables that enter the model. In the original FRGs developed by Stineman et al., the
independent variables consisted of age and the FIM motor and cognitive scales. Each of the scales is the
sum of responses to individual FIM items.
- 5 -
For each functional item, increasing functional independence should be correlated with decreasing
cost. We found two items that did not meet this expectation. First, transfer to tub/shower was incorrectly
(i.e., positively) correlated with cost (after controlling for other FIM items) within almost all RICs. A
comparison of the regular motor score with one that drops this item shows that the modified scale was a
better predictor of costs in gold standard models in all data years. Within CART, the modified motor score
also produced slightly better predictions. Further, the response to this item depends on the situation being
scored—either tub or shower and with or without assistive devices. Thus it is only a relative measure of
independence rather than an absolute one. In addition, this item is not reliably coded in our database
because it is frequently not assessed at admission. Consequently, we recommended defining FRGs using a
modified motor scale that does not contain this item.
The second item that was not correlated with cost as expected is comprehension. Eliminating this
item results in even smaller improvements in performance than dropping transfer to tub. The cognitive
scale is used only occasionally in the definition of FRGs. When it is used, the other four items in the
cognitive scale determine the direction of the cognitive effect, so that a higher cognitive score results in a
lower payment. Thus, eliminating the comprehension item raises issues related to incentives and fairness. If
we take the comprehension item out of the cognitive index, the system will provide no extra incentives to
treat patients with lowered comprehension. If some hospitals do spend extra to treat such patients, they will
not be compensated for the extra resources expended. Consequently, we recommended keeping this item.
We also examined various sub-scales of the motor and cognitive scales. Although these sub-scales
improve the predictive ability of the gold standard models, CART was unable to produce trees with a
manageable number of nodes from these indices.
Evaluating Groups
We found that FRGs built using CART on the FIM data can predict cost reasonably well. They
offer a parsimonious payment formula while maintaining prediction accuracy. The CART model creates
about 100 FRGs that explain roughly 81 to 85 percent of the variance explained by the gold standard
models that use the most detailed scales, depending on year. If we compare the CART model with the gold
standard models that use only the same indices as CART (instead of more information), we explain over 90
percent of the “explainable variance.”
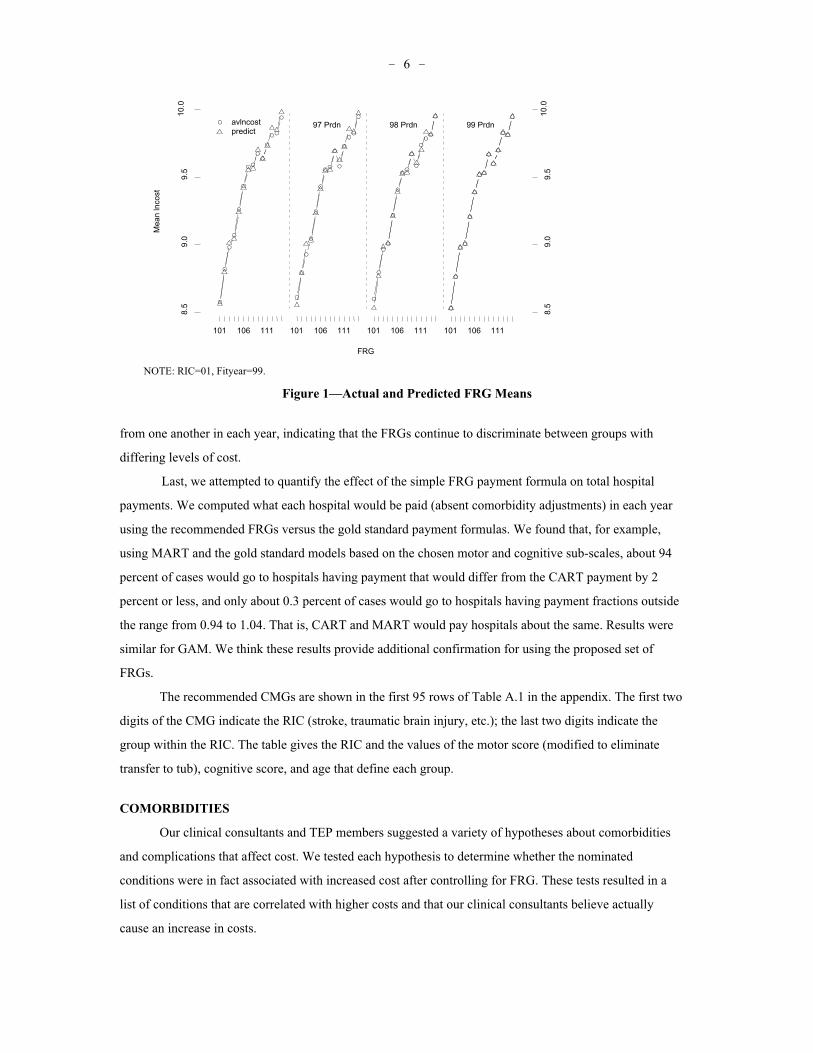
Our recommended FRGs contain 95 groups and are the basis of the Case Mix Groups used in
CMS’s final rule. These groups, although defined on the 1999 data, fit well in all years. We compared
actual and predicted FRG means for non-fitting years in each RIC. Figure 1 shows the data for RIC 1 as an
example. (Similar figures for all RICs are presented in the full report, [Carter et al., 2001].) The actual and
predicted mean log costs are quite close. The actual means in adjacent FRGs seem to be well separated
- 6 -
FRG
Mea
n ln
cost
8.5
9.0
9.5
10.0
8.5
9.0
9.5
10.0
101 106 111 101 106 111 101 106 111 101 106 111
96 Prdn 97 Prdn 98 Prdn 99 Prdn avlncost predict
NOTE: RIC=01, Fityear=99.
Figure 1—Actual and Predicted FRG Means
from one another in each year, indicating that the FRGs continue to discriminate between groups with
differing levels of cost.
Last, we attempted to quantify the effect of the simple FRG payment formula on total hospital
payments. We computed what each hospital would be paid (absent comorbidity adjustments) in each year
using the recommended FRGs versus the gold standard payment formulas. We found that, for example,
using MART and the gold standard models based on the chosen motor and cognitive sub-scales, about 94
percent of cases would go to hospitals having payment that would differ from the CART payment by 2
percent or less, and only about 0.3 percent of cases would go to hospitals having payment fractions outside
the range from 0.94 to 1.04. That is, CART and MART would pay hospitals about the same. Results were
similar for GAM. We think these results provide additional confirmation for using the proposed set of
FRGs.
The recommended CMGs are shown in the first 95 rows of Table A.1 in the appendix. The first two
digits of the CMG indicate the RIC (stroke, traumatic brain injury, etc.); the last two digits indicate the
group within the RIC. The table gives the RIC and the values of the motor score (modified to eliminate
transfer to tub), cognitive score, and age that define each group.
COMORBIDITIES
Our clinical consultants and TEP members suggested a variety of hypotheses about comorbidities
and complications that affect cost. We tested each hypothesis to determine whether the nominated
conditions were in fact associated with increased cost after controlling for FRG. These tests resulted in a
list of conditions that are correlated with higher costs and that our clinical consultants believe actually
cause an increase in costs.
- 7 -
We examined a series of alternative ways of incorporating extra payments for cases with relevant
comorbidities into the payment system. We evaluated these alternatives with respect to the extent to which
they match payments to cost, their stability over time, and the threat they pose to budget neutrality.
Based on this analysis, we recommended using three tiers to pay for relevant comorbidities in the
initial year(s) of the IRF PPS. We found that some infrequent comorbidities cost substantially more than
other comorbidities. We believe the difference is large enough that payment should be matched to cost in
order to avoid problems with access and to provide adequate resources for these expensive patients. These
expensive comorbidities, each of which increase cost by more than 15 percent on average, constitute tier 1.
The remaining relevant comorbidities that affect cost were divided based on the size of their effect on cost.
Comorbidities with a regression coefficient between 11 and 15 percent constitute tier 2, and comorbidities
with a coefficient between 4 and 10 percent constitute tier 3 (see Table 2). The facility would receive a
payment according to the most expensive tier for which the patient qualifies.
We also recommended that the amount of the additional payment for each tier be calculated based
on RIC-specific data. The effects of the RIC are statistically important and have been consistent in every
model we tried. Within each RIC, cost effects consistently vary with the tiers as we defined them based on
their performance over all RICs.
There are reasons to be concerned about the quality of ICD-9-CM coding in our database. These
fields have not been used routinely for analyses; the number of fields available on the FIM instrument to
note comorbidities varied by source. Because comorbidities are probably undercoded in our data, we
believe that paying a separate amount for each comorbidity might seriously threaten budget neutrality and
could conceivably lead to upcoding. Further, paying a different amount for each comorbidity would cause
payment amounts to vary from year to year and would add very little accuracy to the prediction of cost.
This comorbidity recommendation was used by CMS in its final rule. Although we are very
confident that the rule will lead to reasonable payment amounts, there are several ways in which we would
like to pursue refinement in the coming years, when we will have a more representative and better-coded
database. First, we would like to systematically address all ICD-9-CM codes, rather than just the ones
hypothesized by our clinical experts. Second, we would like to pursue the possibility of a complexity
adjustment that better takes into account the cost of cases with multiple comorbidities (as well as multiple
impairments). Third, we would like to integrate the analysis of comorbidities with the creation of FRGs to
develop a single algorithm that produces Function Related Groups with comorbidities (FRGCs).
UNUSUAL CASES
The FRGC system whose development was described in the previous section is appropriate only for
typical cases—the approximately 80 percent of cases discharged to the community following completion of
their rehabilitation program. We also analyzed options for paying for the remaining cases.
- 8 -
Table 2
Conditions in Each Comorbidity Tier
Condition TierVentilator 1Miscellaneous throat problems 1Candidiasis (selected) 1Tracheostomy 1Vocal cord paralysis 1Malnutrition 1Intestinal infection, clostridium 2Dialysis 2Pseudonomas 2Other infections 2Cachexia 2Dysphagia 2Gangrene 2Meningitis and encephalitis 2Renal complications of diabetes 3Hemiplegia 3Aplastic anemia and selected anemias 3“Major” comorbidities in acute care 3Obesity 3Esophageal conditions 3Pneumonia 3Non-renal complications of diabetes 3Amputation of lower extremity 3NOTE: The ICD-9-CM codes that define each conditionare found in Carteret al. (2001).
Payment for Transfer Cases
Short-stay transfers are defined as cases transferred, before the mean length of stay (LOS) for their
FRGC, to hospitals or institutions that are paid as nursing homes by Medicare or Medicaid. If short stay
transfer cases were to receive a full FRGC payment, most of these cases would be substantially overpaid
relative to typical cases. The average payment-to-cost ratio for short stay transfer cases would be about 1.7.
The payment-to-cost ratio for transfers to hospitals would be 2.0.
The potential profit from these cases might provide incentives for abuse. In order to avoid these
incentives, it is prudent to implement a reduced payment for short stay transfers. It would not be prudent to
reduce the payment for such cases much below expected cost. We do not want to discourage appropriate
transfers that provide beneficiaries with needed services. Further, too-low payments for transfer cases or
very short stay cases might have the unwanted effect of reducing access to inpatient rehabilitation for
patients with a good, but not certain, chance to complete inpatient rehabilitation and return to the
community.
Based on our model of the cost of transfer cases, the payment system that would best match
payments to cost would be a per diem payment equal to the average payment for a day in the FRGC plus an
- 9 -
additional case-level payment of one-half of the per diem, and we recommend such a payment. This
recommendation was accepted in the final rule.
Payment for Deaths and Atypical Short Stay Cases
In our matched data set, 1.9 percent of discharges are not transfers and yet stay less than three days
and cost much less than other cases. Even fewer cases die in the hospital—about one-half of one percent.
On average, in-hospital death cases also cost less than typical cases in the same FRGC. The final set of
CMGs includes a single group for atypical short stay cases. The death cases are subdivided by whether they
were assigned to an orthopedic RIC and by LOS. These are the last CMGs in Table A.1.
Bundling
A patient’s rehabilitation program is sometimes interrupted for a short period of time, usually
because the patient has an episode of acute illness. Our analysis addresses the results of bundling two
rehabilitation stays whenever the interruption ends with the patient returning to the same IRF within a short
period of time. Only 29 percent of patients whose program is interrupted for less than a calendar day are
discharged. Paying for each of these discharges would raise issues of fairness, so it seems very reasonable
to bundle these cases. They would be slightly overpaid if each part of the stay received a full discharge
payment. There are very few such cases, so it is unlikely to pose a substantial problem to any hospital.
Beyond the same-day interruptions, there is no analytical reason to choose any one particular period
as the bundling criterion. We find discharges for over 80 percent of all recorded interruptions up to 30 days
in length, so we expect that hospitals discharge patients with any interruption of more than 24 hours. For
any period up to 10 days we would pay about the same 70 percent of costs as we do for the interval
proposed in the NPRM that includes three calendar days. Using a per discharge payment, including a per
diem payment for transfer cases, accurately matches payments to cost.
Based on these payment-to-cost ratios, we recommended that discharges for an interruption of more
than 24 hours not be bundled. However, CMS chose to bundle two successive discharges if the patient
returned to the same rehabilitation program within three days (i.e., on the day of discharge or either of the
following two calendar days).
WEIGHTS
For any particular hospital, the payment for each case will be proportional to the relative weight
assigned to the patient’s CMG. To ensure that beneficiaries in all CMGs will have access to care and to
encourage efficiency, we want to calculate weights that are proportional to the resources needed by a
typical case in the CMG. So, for example, cases in a CMG with weight of 2 will typically cost twice as
much as cases in a CMG with a weight of 1.
- 10 -
The average of the relative weights for a set of cases is called the case mix index, or CMI. The CMI
is the statistic that adjusts hospital payment for differences in case mix. The CMIs for cases at different
hospitals can be compared in order to describe the relative costliness of each hospital’s case mix.
We expect that the variation in costs across hospitals (especially between newer and older hospitals)
is in part an artifact of TEFRA. One of our empirical findings from the interim report is that controlling for
hospital costs using individual hospital identity results in estimates of the effect of comorbidity that are
more precise than using either standardized cost or standardized charges. In this report, therefore, we
updated the weight calculations using the Hospital Specific Relative Value (HSRV) method chosen in the
interim report (and in the NPRM) and using new data and our new definitions of CMG.
In the resulting weight regression, the effects of our comorbidity tiers are highly significant, very
precise in large RICs, reasonably precise in all RICs, and almost always monotonic. The small deviations in
monotonicity were corrected by averaging.
The HSRV weights, however, exhibit CMI compression—i.e., hospitals with a high case mix index
have costs that are higher relative to their CMI than hospitals with lower CMIs. The improved FRG and
comorbidity definitions have only a small effect on measured compression. We show evidence that strongly
suggests that part of the compression problem arises from the bundling of variable ancillary services into
the routine per diem. Insofar as this is true, the hospital cost-per-case estimates are more accurate than the
patient-level cost estimates. Therefore it makes sense to “decompress” the weights using the relationship
between hospital cost per case and the CMI. This adjustment to the weights results in only a small change
to individual weights and an even smaller change to the CMI at any hospital. Over half of hospitals would
have changes of 1 percent or less in the CMI. A hospital at the 95th percentile would see its CMI increase
by 2.4 percent.
We compared simulations using the HSRV (compressed weights) and the decompressed weights.
We found the compressed weights overpaid hospitals in the lowest CMI quartile—a payment-to-cost ratio
of 1.04—but that the decompressed weights cut this ratio to 1.02. The decompressed weights had a
payment-to-cost ratio of 1.00 for the hospitals in the highest CMI quartile. There was no noticeable
difference between the ratios for any other class of hospitals. Thus these simulations reinforce the value of
the decompression algorithm.
FACILITY-LEVEL ADJUSTMENTS
We analyzed potential facility-level adjustments to the national payment amounts. These are factors
that may account for systematic cost differences that are beyond the control of facility management and
may be appropriate to recognize in the payment system. In addition to the statutorily mandated wage index,
our interim report recommended that adjustments be made for serving low-income patients and for location
in a rural area (i.e., outside a Metropolitan Statistical Area). This report updates the analyses in the interim
- 11 -
report using more-recent data and improved measures for factors that may account for systematic cost
differences.
Methodology
We updated and refined the explanatory variables that we used in the interim report. Next, we
performed multivariate regression analyses to measure the effects of the factors on facility costs and
establish potential payment adjustments. In “fully specified” regressions, we included a comprehensive set
of explanatory regressions in order to understand the various factors that might affect cost per case. In our
“payment” regressions, we limited the explanatory variables to those that are beyond the control of facility
management and might be appropriate to recognize in the payment system. Within the payment
regressions, we explored alternative ways of specifying the size of the facility’s low-income population.
We used the coefficients from the payment regressions to determine potential adjustment factors for
payment variables. We then simulated payments using the 1999 cases in our analysis file and determined
the payment-to-cost ratios for different classes of hospitals for specific combinations of payment policies.
We also undertook supplemental analyses to understand some of the regression and simulation results.
Low-Income Variable
Since the log of 0 cannot be taken, we added a constant to the low-income ratios in our regressions.
The payment adjustment recommended in the interim report and used in the NPRM was based on the log
(0.0001 + DSH) form of the low-income variable, where DSH is the percentage of Medicare patients who
are entitled to SSI plus the percentage of all inpatients who are eligible for Medicaid.1 Here we considered
other variables using DSH (e.g., log (1 + DSH)) and replacing DSH with other descriptions of the low-
income population.
The statistical performances of most alternatives were roughly similar. There is about a 5 percent
increase in costs for each 10 percentage point increase in a facility’s DSH ratio. A variable using the
percentage of all patients who are either Medicare beneficiaries entitled to SSI or are non-Medicare patients
eligible for Medicaid has similar results to the DSH percentage. A variable using only the percentage of
Medicare patients who are entitled to SSI does not have as much explanatory power.
If we use the log (0.0001 + DSH) form that was used in the NPRM, the slope of the low-income
patient adjustment is quite steep at the lowest DSH ratio—i.e., the low income patient adjustments for
facilities with very low DSH ratios increase rapidly with small increases in the DSH ratio. Another problem
1The name of the variable, DSH, was originally derived from “disproportionate share.” The same
variable is calculated within the acute care PPS. In the acute PPS, DSH is treated as if it were 0 belowspecific thresholds, and thus DSH payments are made only to hospitals with a “disproportionate share” oflow income patients. In the IRF PPS, low-income patient adjustments go to all hospitals with any low-income patients and thus the adjustment is called a low-income patient (LIP) adjustment in the final rule(CMS, 2001).
- 12 -
with this form is that normalizing the adjustment factor to 1.0 for a facility with a 0 DSH ratio created
misunderstanding regarding the size of the low-income patient adjustment relative to total payment. In fact,
the payments for hospitals across the range of DSH values where most hospitals are concentrated would be
very similar using either the log (0.0001 + DSH) or log (1 + DSH) form.
It is possible to mitigate the slope problem at the low DSH ratios by using a threshold so that all
hospitals with a DSH ratio below the threshold have a low-income patient adjustment factor of 1.0.
However, the exact location of the threshold would be arbitrary. If the threshold were high enough to
eliminate the slope problem, the payment formula would perform very similarly to that from the log (1 +
DSH) form, except in the region containing the few hospitals with the highest DSH values. For these
hospitals the log (1 + DSH) form produces a larger payment adjustment. Using the log (1 + DSH) form, the
payment-to-cost ratio for hospitals with a DSH ratio of 0.30 or higher is 1.07 compared with 1.025 using
the log (0.0001 + DSH) form with a 5 percent threshold. Although the 0.0001 + DSH form fits the data
better in this region (and has a slightly higher R-square overall), the higher payment-to-cost ratio for the
highest DSH hospitals using the log (1 + DSH) form may not be a policy concern. CMS chose to adopt the
log (1 + DSH) adjustment in the final rule implementing IRF PPS.
Geographic Areas
The payment regression shows that rural hospitals are almost 19 percent more costly than other
hospitals. Large urban hospitals are almost 4 percent less costly than other urban hospitals. The rural
finding is highly significant while the large urban coefficient is only slightly significant and may be
attributable to “outlier” hospitals.
The payment simulations indicate that a rural adjustment works well. The payment-to-cost ratios for
both rural and urban facilities are close to 1.00. The average payment-to-cost ratio for facilities in large
urban areas (1.01) is only slightly higher than for other urban hospitals (0.99) and rural hospitals (0.99). We
recommended making an adjustment for hospitals located in rural areas but not for hospitals located in
large urban areas (which would be negative) at this time. CMS adopted our recommendation in the final
IRF PPS rule.
Differences in practice patterns do not appear to be contributing to the higher costs of care in rural
hospitals. The lengths of stay and transfer rates in rural hospitals are similar to predicted values based on
patient mix. With regard to large urban facilities, their average LOS is also close to predicted values. The
transfer rates to hospitals—both total and short-stay—are slightly higher than expected and could be a
possible factor in explaining the lower costs per case of large urban hospitals. In addition, other urban
hospitals report a lower proportion of cases with comorbidities and have a slightly longer than expected
average LOS. It is not clear whether this is attributable to differences in practice patterns and/or coding
practices. We believe this issue should be reexamined after data from IRF PPS become available.
- 13 -
One issue raised by the interim report was whether the facility adjustment for rural hospitals should
instead be an adjustment for serving rural patients, so that urban hospitals that serve a substantial number of
rural beneficiaries would also receive a payment adjustment. We found that rural patients in urban hospitals
are about 1 percent more costly than their urban counterparts in the same hospital. About 4 percent of urban
facilities draw more than half of their patients from rural areas. While these hospitals might be at a slight
disadvantage, the magnitude of the disadvantage is very small and we do not believe an adjustment would
be appropriate. Urban patients who are in rural hospitals are also more costly than their rural counterparts.
Thus, the underlying issue may be whether or not patients who travel out of area for inpatient care are more
costly. Refinements in the patient classification system would be preferable to a facility adjustment for
these small numbers of patients.
Other Hospital Characteristics
Key findings from the regressions include the following:
• In the fully specified regressions using a comprehensive set of explanatory variables, the following
variables are significant in explaining variation in cost per case: case mix, wage index, the
proportion of low-income patients, type of facility (freestanding hospital or unit), certification
date, size, and geographic location. In the interim report, teaching and type of ownership were also
significant in the fully specified regression.
• Teaching is not significant in either the fully specified or payment regressions using any of several
different measures of teaching intensity. However, problems measuring interns and residents may
have affected our results. We found inconsistencies between the resident counts and the allocation
of resident salaries, and between the ratio of residents to average daily census and the Residency
Review Committee requirements related to patient load.
• The wage index is compressed when we define it as an independent variable. This result, which is
different from our interim report finding, implies that the wage index may overstate the resources
required in low-wage areas and understate the resources required in high-wage areas. We believe
that this compression is attributable to a small number of influential “outlier” hospitals. When
these hospitals are controlled for in the regression, the wage index is less compressed.
The issue of whether patterns of care contribute to the higher costs of freestanding hospitals is
clouded by uncertainty over coding reliability. Freestanding hospitals report fewer comorbidities in each
tier and have an LOS that is about 16 percent longer than the expected LOS for the patient mix. This issue
should be examined after IRF PPS is implemented and hospitals have responded to the payment incentives
to improve coding practices and to deliver care more efficiently.
We remain concerned about the small number of hospitals with the greatest teaching intensity
because they appear to be underpaid relative to costs. Resolution of this problem, however, must wait for
better data on interns and residents who serve in IRFs.
- 14 -
OUTLIER PAYMENTS
Outlier payments are additional payments, beyond the normal CMG payment, made for very
expensive cases. Such payments can reduce hospitals’ financial risk from a PPS and should reduce the PPS
incentive for hospitals to underserve very expensive cases. Also, because they are targeted to cases where
the CMG payment is much lower than cost, outlier payments may help mitigate problems with the
classification system. Because outlier cases are not paid at full cost, these payments cannot completely fix
problems with the classification system; they can only provide limited compensation.
There are several drawbacks to outlier payments: Because payments are tied to costs, outlier
payments may encourage hospitals to provide care that has less value than its cost. Further, because charges
are used to measure costs, it might be possible for some hospitals to game their charging structure to obtain
an unwarranted portion of the outlier payments. Finally, because hospital behavior may change after
implementation of the IRF PPS, there is uncertainty about the relationship between the outlier parameters
and the total amount of funds that will be spent on outlier payments. Thus, the more outlier payments that
are planned, the larger the possible difference between realized total payment and the budget neutrality
target.
We simulated payments to evaluate quantifiable outcomes of different targets for the amount of
outlier payments: from no outlier payments to 5 percent of total payments in 1 percent increments. The
outcomes we evaluated include financial risk and the match of payments to costs at each hospital and at
groups of hospitals. The findings from these simulations of payment on 1999 cases are very similar to those
on the 1997 data presented in our interim report:
• Increasing the amount of outlier payments decreases financial risk, but the rate of improvement
decreases.
• Increasing the amount of outlier payments also increases the match between payment and cost at
the hospital level—but also at a decreasing rate.
• Increasing the amount of outlier payments has little effect on the payment-to-cost ratio of groups
of hospitals.
We then attempted to weigh the measured effects against other unquantified effects in order to reach
a recommendation and found no reason to change the recommendation in our interim report—the outlier
target should be set at 3 percent of total IRF PPS payments. CMS chose the same 3 percent value in the
final rule.
RELATIONSHIP BETWEEN HOSPITAL PAYMENT AND COST IN THE IRF PPS
The simulations also allow us to summarize the performance of a PPS that incorporates each of our
major recommendations for policy: the classification system; payment for short-stay transfer cases; HSRV
weights; the facility payment adjustment that uses the hospital wage index, rural location, and DSH
- 15 -
percentage; and the 3 percent level of outlier payment. The classification system used for unusual cases was
described earlier and includes bundling.
The accuracy of the system at the hospital level is summarized by the standard deviation of the
difference between average payment and average cost. As shown in Table 3, the average payment per case
at each hospital explains 57.1 percent of the variance across hospitals in cost per case.
Table 3
Percent of Variance in Facilities’ Cost Explained by the IRF PPS
Standard deviation of cost per case $3,651Standard deviation of difference between payment and costper case
$2,390
Percent of the variance in cost explained by payment (EfronR-Square)
57.1%
The report also presents the payment-to-cost ratio for various groups of hospitals. For most
characteristics that we examined, the ratios are within 3 percent of 1.00. The smallest ratio is for very small
freestanding hospitals that may lack economies of scale.
CONVERSION FACTOR
Congress mandated that the payment system in FY 2002 must be designed to be budget
neutral—that is, estimated IRF PPS payments per case in FY 2002 must equal the estimated amount of
TEFRA payments per case.2 We assessed alternative methods for determining the national conversion
factor. Each of the methods assumes that the cases at each hospital in FY 2002 will be similar to the
hospital’s cases in 1999. Our computation accounts for facility adjustments and outlier payments. Since the
conversion factor multiplies all IRF PPS case payments, it is a key to meeting the congressional budget
neutrality requirement.
We assessed the accuracy of the method proposed in the NPRM, along with four alternatives. The
NPRM method was the only one available at the time and uses only case data from the matched FIM-
MEDPAR sample. However, we actually know a lot about the non-sample hospitals—in particular we
know their TEFRA payment, their facility adjustment factor, and their characteristics such as rural location
and freestanding status. Further, we know something about their case mix. We know the number of cases
whose rehabilitation followed a hospitalization for stroke, the number of cases that followed a joint
replacement, and so on. Diagnoses on the MEDPAR rehabilitation record tell us more about case mix.
Further, the LOS and the discharge destination for the case can help predict its case weight.
2It was mandated that the budget neutrality calculation ignore hospital decisions to move entirely to
the IRF PPS in FY 2002.
- 16 -
In addition to sample data, our four alternative models used hospital characteristics and case
characteristics of the non-sample MEDPAR cases to estimate the CMI of non-sample hospitals and cases.
We then combined these CMI estimates with known information about TEFRA payments and the IRF PPS
facility adjustment to estimate the conversion factor. We evaluated these alternatives using four tenfold
cross-validation runs.
We found that all of the models are substantially more accurate than the NPRM method. Thus we
would be better off using our data to estimate the CMI at hospitals. Further, a model based on case-level
data appeared to be the most accurate. It reduced the typical error in the conversion factor from a 10
percent validation sample by slightly more than half of the error in the conversion factor from the NPRM
method.
We then estimated the actual conversion factor using each of these models. We did so by combining
the actual data for the sample cases with CMI predictions from the models for other hospitals and/or cases.
The model that we believe is most accurate results in a conversion factor of $11,977, which is 1 percent
greater than the conversion factor from the NPRM method. The majority of this increase occurs because
hospitals are less likely to report very short stay cases to the FIM databases.
Our estimate assumes no behavioral response to the PPS. The CMS Actuary calculated a behavioral
offset to this conversion factor based on historical experience with new payment systems. The calculation
reflected reduced cost (and therefore reduced TEFRA payment) achieved by transfers to home health care
and long-stay transfers to institutions. Thus the national conversion factor used in the final rule was
$11,838, which is 1.16 percent lower than the conversion factor we calculated under the assumption of no
change in behavior.
ASSESSMENT INSTRUMENTS FOR PPS
This project analyzed whether the use of the Minimum Data Set–Post Acute Care (MDS-PAC) as
proposed in the NPRM would adversely affect system performance, patients, or hospitals. FIM and PAC
data on more than 3,000 cases from 50 hospitals were collected. Three calibration teams re-rated the FIM
and the PAC on more than 200 of these cases.
Coding the Impairment That Is the Primary Reason for Admission
The study found that there were problems and notable disagreement with impairment group code
selection regardless of which instrument was used. When data collectors were required to record an
impairment code (without the benefit of having a menu to select from), codes were missing or invalid
(meaningless) 10–11 percent of the time. When the calibration teams were asked to score the same cases
that institutional data collectors had scored, 27–29 percent of the time either one or both of the teams used
an invalid code or, when both used valid codes, the codes mapped into different rehabilitation impairment
- 17 -
categories. This finding indicates a need for additional rules and clarifying instructions governing
rehabilitation impairment group selection.
Estimating FIM Scales from MDS-PAC Data
In order to classify patients into CMGs using the MDS-PAC, motor and cognitive scales similar to
those in the FIM were created from items in the PAC. For the cognitive scale we used a translation
developed by Dr. John Morris; for the motor items we built on and revised his initial work.
While parsimonious in length, the FIM actually has a fairly complex set of scoring rules. Some of
these rules differed explicitly from those in the PAC; others merely could not be replicated. One of the
most obvious issues was the difference in the assessment periods: The PAC looked back at the first three
days after admission and the FIM looked back over 24 hours anytime during the first three days. Further,
distinguishing independence from modified independence was often difficult. Information on use of
devices was frequently inadequate to score modified independence due to use of devices. The FIM also
scored patients who would otherwise be independent but who took more than a reasonable amount of time,
or those for whom there was a safety concern, as having modified independence. None of these distinctions
was captured in the PAC or its item scoring. The scoring for total assistance (dependence) was substantially
different for the two instruments. In the FIM, patients were scored as requiring total assistance when they
performed fewer than 25 percent of the subtasks or work associated with the item. The MDS-PAC coded
total assistance when the patient did not participate in the activity and required full staff performance.
We evaluated our “revised” translation and demonstrated that it did, in fact, reduce the mean
difference in motor scores between the FIM and the PAC by 50 percent from the original Morris
translation. Despite the improvement, we found that the agreement between the instruments as measured by
kappa statistics was poor to moderate. Comparing the levels of instrument agreement between the
institutional teams and our calibration teams, we found that the calibration teams had notably higher levels
of agreement between the FIM and the PAC.
Although much of the difference in motor scores was due to differences in the scoring rules, some
resulted from scoring error in both the MDS-PAC and the FIM. For example, the fact that some of the
scoring rules were counterintuitive may have lead to increased scoring error. The MDS-PAC’s activities of
daily living (ADL) assist codes instructed coders to score one person doing weight-bearing assistance with
one limb as a “1” but to combine all other one-person assists (torso, multiple limb, and non-weight-bearing)
with the no-assistance group. Another example occurred in the scoring of bowel and bladder appliance
support for patients on medication. When a nurse handed an otherwise independently functioning patient a
medication, coders were instructed to score the MDS-PAC’s appliance support item as maximum
assistance. Since hospital policy required that the nurse hand the patient the medication unless patients
were on special medication programs (which was unlikely at admission), these patients were all scored as
- 18 -
highly dependent on the MDS-PAC. The situation was exacerbated by including Metamucil, a fiber
enhancement given to most hospitalized patients, on the medication list.
We anticipated that differences in the assessment periods between the instruments contributed to the
mean difference in motor scores, and we found, in fact, that it did, but not in the simple ways we expected.
Patients whose FIM motor exams were completed on day 2 had significantly larger differences than those
whose exams were completed on day 1 or day 3. The size of the PAC scoring team also influenced the
difference: Two- and three-person teams had less bias than one-person teams and those with four or more.
After controlling explicitly for all the variables that we could, we found that a test of random effects for
hospitals was highly significant. The latter implied that hospitals were systematic in their scoring
differences, but this was not explained by the independent variables. We also tested for random slope
effects with patient-level variables and found that some of these were also significant. “Significant
differences” here means that different hospitals scored particular types of patients differently. Together,
these findings suggest that more training is needed to adequately standardize the assessment process.
Estimating CMGs
Next, we mapped FIM and “pseudo-FIM” motor and cognitive scores into CMGs and tried several
different approaches to improve the match between the mappings. We found that the FIM and the MDS-
PAC mapped into the same CMG 53 percent of the time initially. We improved the level of agreement to
57 percent by using a regression mapping of “pseudo-FIM” items onto the FIM scores and by dropping the
facility with the worst-matching rate. Although this level of CMG agreement between instruments (53–57
percent) was low, scoring reliability within both instruments was also poor and led to low levels of
agreement, 50 percent for the FIM and 55 percent for the PAC (when the CMGs from calibration team
responses were compared with institutional team responses on the same instrument).
Despite poor classification agreement, mean payment differences between the two instruments were
small, averaging –$46, and not significantly different from zero. At the facility level, mean per-case
differences increased to $82. Although these differences are not large, we found that more than 20 percent
of the facilities experienced revenue differences of 10 percent or more. Our multivariate analysis of
payment differences showed significant differences across hospitals, but these were not associated with
patient or hospital characteristics.
Reliability and Accuracy
When we compared the scoring concordance (reliabilities) on the two instruments, we found that
the FIM had somewhat higher kappas and levels of absolute agreement than the PAC. However, our
reliability measures for the FIM motor scale, the cognitive scale, and 11 of 13 motor items were
substantially less than those reported in the literature (see the meta-analysis of 11 studies in Ottenbacher et
al. (1996)). The meta-analysis did not provide information on how actual FIM assessments were performed
- 19 -
in those studies. Our calibration teams were made up of observers and information gatherers who did not
actually do any physical assessment (at times, they were trying to gather information that was as much as
three days old), so procedural differences may have contributed to lower reliabilities. However, one could
also argue that their greater dependence on information from treating clinicians makes their individual
judgment less important and should have increased agreement.
The simplicity of the FIM scoring sheets was deceptive because the actual scoring rules were
actually quite complicated. Two examples of explicit questions on the MDS-PAC allowed us to observe
how FIM scorers had overlooked scoring nuances. In the “Eating” item, FIM rules instructed that patients
with chewing problems, and those on modified diets for swallowing problems who were otherwise
independent in eating, should be scored as having modified independence. Assuming that the PAC items
were measured without error, patients with chewing problems or those on modified diets were scored
correctly only 43 percent of the time. Fortunately, chewing problems and/or diet modifications occur in
only 6 percent of otherwise independent eaters. Another example is the FIM locomotion item, which
required (with one exception) that patients walk at least 150 feet to score above maximum assistance.
Again, assuming that the explicit distance response in the MDS-PAC was correct, we observed that FIM
scorers overlooked the distance requirements 16 percent of the time. Among patients who were unable to
walk 150 feet, 24 percent were scored incorrectly. Including these elements explicitly should improve
scoring accuracy.
Administration Cost
By far the biggest difference between the instruments was their length. Conceptually, the PAC is a
much broader instrument. An important limitation of this study is that we have yet to look at the benefits of
this expanded conceptual base. The PAC required 147 minutes on average to complete, compared with 25
minutes for the FIM—a sixfold difference. We found a clear learning curve during the study (the average
completion time for the first two weeks of the study of 184 minutes fell to 120 minutes for weeks 7 and 8),
which could continue to reduce times beyond those reported here. The size of the data collection team also
influenced data completion times significantly: The larger the team, the longer the time. By the end of the
study, one-person teams had times that were consistent with those reported in the NPRM (85–90 minutes).
Overview of Instrument Analyses
In summary, the instrument study’s most important findings were the following:
• Scoring concordance (reliabilities), while somewhat higher on the FIM than the PAC, were not as high
as desired for payment.
• The best translations and mappings of the PAC into CMGs agreed with the FIM only 53–57 percent of
the time.
• Despite this poor agreement, overall payment differences between the instruments were small.
- 20 -
• Twenty percent of the hospitals could have revenue differences of 10 percent or more, depending upon
which instrument is used.
• All of our multivariate analyses showed strong random effects for hospitals with few other significant
variables, suggesting that additional training could help standardize responses and remove hospital-
specific differences.
• The administrative burden associated with the MDS-PAC, 120 minutes compared with 23 minutes for
the FIM by the end of the study, was substantial.
CMS created a new assessment instrument for use with the IRF PPS. It includes the FIM items, but
modifies the scoring rules when an activity has not been observed. Further, the new instrument requires that
the hospital record additional information about each of the FIM items that were found here to be
particularly complex.
MONITORING
A major focus of our ongoing work will be the development of a system to monitor the impact and
performance of the IRF PPS. This system will perform two primary functions. First, it will monitor the care
delivered by IRFs before and after IRF PPS implementation. It will do this by tracking changes in patient
access to care, costs of care, Medicare payments for care, the financial status of IRFs, and the outcomes of
IRF care. We will use this information to assess the positive and negative effects of the IRF PPS and to
determine if the PPS is meeting its intended goals. We will hypothesize about potential problems with the
IRF PPS and monitor whether or not these problems materialize. This effort will involve analyzing regional
and national trends in IRF care and identifying unusual hospitals. (No data that could be used to identify
individual hospitals will be publicly released.) The monitoring system will also be used to determine areas
where the IRF PPS needs refinement.
Second, the system will monitor changes in the care delivered across post-acute care settings. This
function is important because the financial incentives created by the IRF PPS may affect the number and
mix of patients using other types of post-acute care and because changes in the payment systems for other
types of care may affect the patients admitted to IRFs. We will thus track changes in the number and types
of patients seeking care across the range of post-acute care settings. We will then assess the implications of
these care patterns for costs to beneficiaries, providers, and the Medicare program as a whole. We will also
assess trends in the outcomes of post-acute care, including mortality rates and hospital readmissions.
The monitoring system will be designed with input from the TEP and from CMS and will draw on
analyses conducted during phase I. Baseline measures of cost, access, and quality will be developed over
the next year. Post-implementation data will be analyzed and evaluated starting in fall 2002.
- 21 -
APPENDIX
Table A.1
Definitions of CMGs
CMGNumber Rehabilitation Impairment Category Functional Status and Age0101 Stroke Motor score 69–84 and cognitive score 23–350102 Stroke Motor score 59–68 and cognitive score 23–350103 Stroke Motor score 59–84 and cognitive score 5–220104 Stroke Motor score 53–580105 Stroke Motor score 47–520106 Stroke Motor score 42–460107 Stroke Motor score 39–410108 Stroke Motor score 34–38 and patient is 83 years old or older0109 Stroke Motor score 34–38 and patient is 82 years old or younger0110 Stroke Motor score 12–33 and patient is 89 years old or older0111 Stroke Motor score 27–33 and patient is between 82 and 88 years0112 Stroke Motor score 12–26 and patient is between 82 and 88 years0113 Stroke Motor score 27–33 and patient is 81 years old or younger0114 Stroke Motor score 12–26 and patient is 81 years old or younger0201 Traumatic brain injury Motor score 52–84 and cognitive score 24–350202 Traumatic brain injury Motor score 40–51 and cognitive score 24–350203 Traumatic brain injury Motor score 40–84 and cognitive score 5–230204 Traumatic brain injury Motor score 30–390205 Traumatic brain injury Motor score 12–290301 Non-traumatic brain injury Motor score 51–840302 Non-traumatic brain injury Motor score 41–500303 Non-traumatic brain injury Motor score 25–400304 Non-traumatic brain injury Motor score 12–240401 Traumatic spinal cord injury Motor score 50–840402 Traumatic spinal cord injury Motor score 36–490403 Traumatic spinal cord injury Motor score 19–350404 Traumatic spinal cord injury Motor score 12–180501 Non-traumatic spinal cord injury Motor score 51–84 and cognitive score 30–350502 Non-traumatic spinal cord injury Motor score 51–84 and cognitive score 5–290503 Non-traumatic spinal cord injury Motor score 41–500504 Non-traumatic spinal cord injury Motor score 34–400505 Non-traumatic spinal cord injury Motor score 12–330601 Neurological Motor score 56–840602 Neurological Motor score 47–550603 Neurological Motor score 36–460604 Neurological Motor score 12–350701 Fracture of lower extremity (LE) Motor score 52–840702 Fracture of lower extremity (LE) Motor score 46–510703 Fracture of lower extremity (LE) Motor score 42–450704 Fracture of lower extremity (LE) Motor score 38–410705 Fracture of lower extremity (LE) Motor score 12–370801 Replacement of LE joint Motor score 58–840802 Replacement of LE joint Motor score 55–570803 Replacement of LE joint Motor score 47–540804 Replacement of LE joint Motor score 12–46 and cognitive score 32–350805 Replacement of LE joint Motor score 40–46 and cognitive score 5–31
- 22 -
Table A.1 (continued)
0806 Replacement of LE joint Motor score 12-39 and cognitive score 5–310901 Other orthopedic Motor score 54–840902 Other orthopedic Motor score 47–530903 Other orthopedic Motor score 38–460904 Other orthopedic Motor score 12–371001 Amputation, LE Motor score 61–841002 Amputation, LE Motor score 52–601003 Amputation, LE Motor score 46–511004 Amputation, LE Motor score 39–451005 Amputation, LE Motor score 12–381101 Amputation, other than LE Motor score 52–841102 Amputation, other than LE Motor score 38–511103 Amputation, other than LE Motor score 12–371201 Osteoarthritis Motor score 55–84 and cognitive score 34–351202 Osteoarthritis Motor score 55–84 and cognitive score 5–331203 Osteoarthritis Motor score 48–541204 Osteoarthritis Motor score 39–471205 Osteoarthritis Motor score 12–381301 Rheumatoid, other arthritis Motor score 54–841302 Rheumatoid, other arthritis Motor score 47–531303 Rheumatoid, other arthritis Motor score 36–461304 Rheumatoid, other arthritis Motor score 12–351401 Cardiac Motor score 56–841402 Cardiac Motor score 48–551403 Cardiac Motor score 38–471404 Cardiac Motor score 12–371501 Pulmonary Motor score 61–841502 Pulmonary Motor score 48–601503 Pulmonary Motor score 36–471504 Pulmonary Motor score 12–351601 Pain syndrome Motor score 45–841602 Pain syndrome Motor score 12–441701 Major multiple trauma (MMT) without
brain or spinal cord injuryMotor score 46–84
1702 MMT without brain or spinal cord injury Motor score 33–451703 MMT without brain or spinal cord injury Motor score 12–321801 MMT with brain or spinal cord injury Motor score 45–84 and cognitive score 33–351802 MMT with brain or spinal cord injury Motor score 45–84 and cognitive score 5–321803 MMT with brain or spinal cord injury Motor score 26–441804 MMT with brain or spinal cord injury Motor score 12–251901 Guillian-Barré Motor score 47–841902 Guillian-Barré Motor score 31–461903 Guillian-Barré Motor score 12–302001 Miscellaneous Motor score 54–842002 Miscellaneous Motor score 45–532003 Miscellaneous Motor score 33–442004 Miscellaneous Motor score 12–32 and patient is 82 years old or older2005 Miscellaneous Motor score 12–32 and patient is 81 years old or younger2101 Burns Motor score 46–842102 Burns Motor score 12–455001 Atypical short stays LOS is 3 days or fewer5101 In-hospital death Orthopedic, LOS is 13 days or fewer5102 In-hospital death Orthopedic, LOS is 14 days or more5103 In-hospital death Not orthopedic, LOS is 15 days or fewer5104 In-hospital death Not orthopedic, LOS is 16 days or more
- 23 -
REFERENCES
Buchanan, J. L., P. Andres, S. Haley, S. M. Paddock, D. C. Young, and A. Zaslavsky (2002). Final Reporton Assessment Instruments for PPS. Santa Monica, CA: RAND, MR-1501-CMS.
Carter, G. M., M. Beeuwkes Buntin, O. Hayden, J. Kawata, S. M. Paddock, D. A. Relles, G. K. Ridgeway,M. E. Totten, and B. O. Wynn (2001). Analyses for the Initial Implementation of the InpatientRehabilitation Facility Prospective Payment System. Santa Monica, CA: RAND, MR-1500-CMS.
Carter, G. M., D. A. Relles, B. O. Wynn, J. Kawata, S. M. Paddock, N. Sood, and M. E. Totten (2002).Interim Report on an Inpatient Rehabilitation Facility Prospective Payment System. Santa Monica, CA:RAND, MR-1503-CMS.
Centers for Medicare and Medicaid Services (2001). “Medicare Program; Prospective Payment System forInpatient Rehabilitation Facilities; Final Rule,” Federal Register, Vol. 66, No. 152, Tuesday, August 7,2001, pp. 41315–41430.
Health Care Financing Administration (2000). “Medicare Program; Prospective Payment System forInpatient Rehabilitation Facilities.” Federal Register, Notice of Proposed Rule Making, November 3,2000.
Ottenbacher, K. J., Y. Hsu, C. V. Granger, and R. C. Fiedler (1996). “The Reliability of the FunctionalIndependence Measure: A Quantitative Review,” Archives of Physical Medicine and Rehabilitation,Vol. 77, No. 12, pp. 1226–1232.
Relles, D. A., and Carter, G. M. (2002). Linking Medicare and Rehabilitation Hospital Records to SupportDevelopment of a Rehabilitation Hospital Prospective Payment System. Santa Monica, CA: RAND,MR-1502-CMS.
Stineman, M. G., J. E. Goin, B. B. Hamilton, and C. V. Granger (1994). A Case-Mix Classification Systemfor Medical Rehabilitation, Medical Care, Vol. 32, No. 4, pp. 366–379.
Stineman, M. G., C. J. Tassoni, J. J. Escarce, J. E. Goin, C. V. Granger, R. C. Fiedler, and S. V. Williams(1997). “Development of Function-Related Groups, Version 2.0: A Classification System for MedicalRehabilitation,” Health Services Research, Vol. 32, No. 4, pp. 529-548.