42
Tennessee Valley Authority Reservoir Operations Study – Final Programmatic EIS Executive Summary
| Date post: | 03-May-2018 |
| Category: |
Documents |
| Upload: | vuongtuong |
| View: | 216 times |
| Download: | 1 times |
Tennessee Valley Authority
Reservoir Operations Study – Final Programmatic EIS
Executive Summary

This page intentionally left blank.
Executive Summary
Tennessee Valley Authority ES-1 Reservoir Operations Study − Final Programmatic EIS
ES.1 Introduction
The Tennessee Valley Authority (TVA) has conducted a comprehensive Reservoir Operations Study (ROS) to determine whether changes in how it operates the Tennessee River system would produce greater overall public value for the people of the Tennessee Valley. TVA, the U.S. Army Corps of Engineers (USACE), and the U.S. Fish and Wildlife Service (USFWS) have cooperated to prepare this Final Programmatic Environmental Impact Statement (FEIS) for the ROS. Representatives of other agencies and members of the public participated in this process by attending public meetings and providing comments on the scope of the document and the Draft Programmatic Environmental Impact Statement (DEIS). TVA also established two groups—a 17-member Interagency Team and a 13-member Public Review Group (IAT/PRG)—to ensure that agencies and members of the public were actively and continuously involved throughout the study. As the lead agency, TVA was primarily responsible for the preparation of this document.
Following public and agency review and comment on the DEIS, TVA has prepared a response to comments and a set of recommendations—the Preferred Alternative—which is included in this FEIS. After receiving comments on this FEIS, the TVA Board of Directors (Board) will decide whether TVA’s reservoir operations policy will be changed and the nature of the change. In making its decision, the Board will consider the recommendations of TVA staff, this FEIS, public comments, and other factors. The Board will make a decision following the Notice of Availability of this FEIS and after consideration of public comments on the FEIS. The final decision will be documented in a Record of Decision and made available to the public. Decisions made by other federal agencies would be appropriately documented by the respective agency.
ES.2 Background
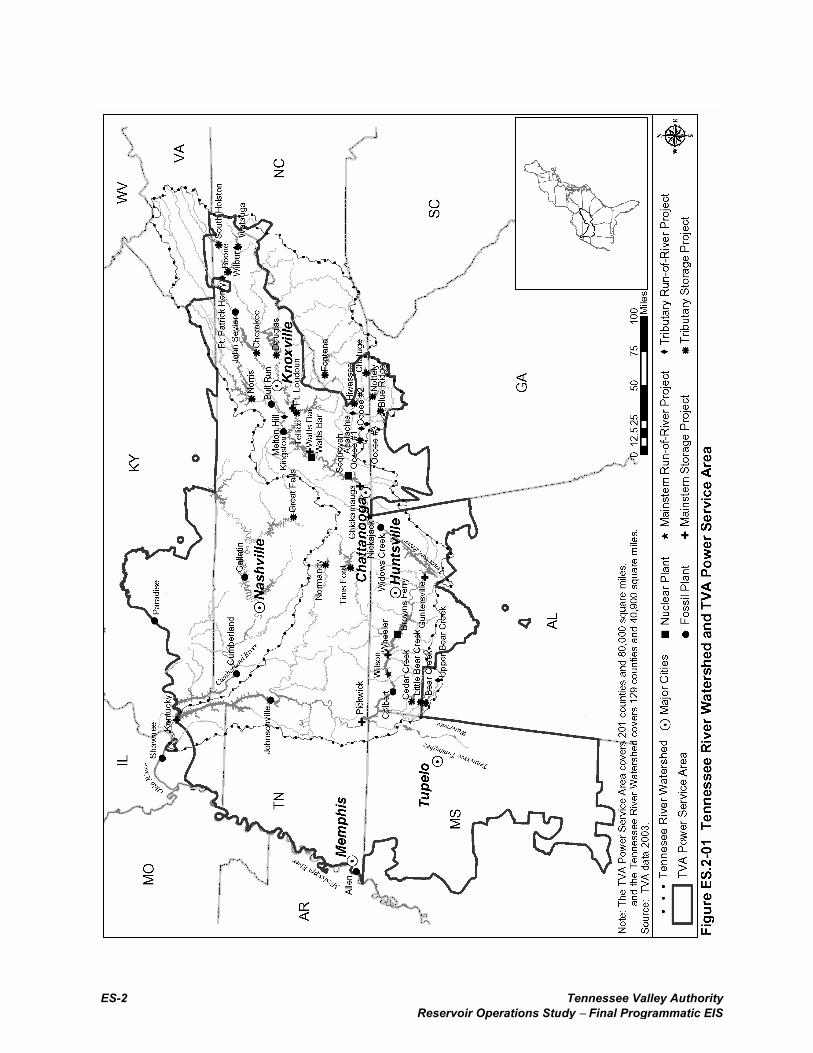
The Tennessee Valley Authority is a multi-purpose federal corporation responsible for managing a range of programs in the Tennessee River Valley (the Valley) for the use, conservation, and development of the water resources related to the Tennessee River. In carrying out this mission, TVA operates a system of dams and reservoirs with associated facilities—its water control system (Figure ES.2-01). As directed by the TVA Act, TVA uses this system to manage the water resources of the Tennessee River for the purposes of navigation, flood control, power production. Consistent with those purposes, TVA uses this system to improve water quality and water supply, and provide recreational opportunities and a wide range of other public benefits.
Public participation in the ROS EIS began in January 2002, when TVA mailed letters describing the ROS to over 60,000 stakeholders across the Valley and TVA Power Service Area, including representatives of agencies and Indian tribes that might be affected or interested. On February 25, 2002, TVA published a notice in the Federal Register, indicating the agency’s intent to prepare a programmatic EIS on its reservoir operations policy and inviting interested parties to comment on its scope.
ES-2 Tennessee Valley Authority Reservoir Operations Study − Final Programmatic EIS
Executive Summary
Tennessee Valley Authority ES-3 Reservoir Operations Study − Final Programmatic EIS
During the 2-month comment period, more than 1,300 members of the public attended 21 community workshops held across the region; and several thousand wrote letters or submitted comments to TVA by mail, e-mail, fax, or telephone. When the comment period closed on April 26, 2002, TVA had received more than 6,000 individual comments, copies of form letters from approximately 4,200 individuals, and petitions signed by over 5,400 individuals. In addition, 3,600 residents in the TVA Power Service Area responded to a random telephone survey conducted by an independent research firm. The telephone survey was designed to sample a representative cross section of the populace served by TVA. TVA posted a copy of the DEIS on its web site and distributed approximately 1,500 copies to affected tribal governments, agencies, organizations, and individuals in July 2003. The Notice of Availability of the DEIS was published in the Federal Register on July 3, 2003. The comment period closed on September 4, 2003, but TVA continued to accept comments through mid-October from tribes and persons informing the agency that their comments would be late.
Including form letters and petitions, TVA received a total of 2,320 sets of comments on the DEIS. These sets of comments included input from almost 7,000 individuals, 7 federal agencies, 14 state agencies, 1 tribal government, and other groups and organizations. TVA has carefully reviewed and responded to all of the substantive comments on the DEIS, and used this input to improve the content of the FEIS.
ES.3 Purpose and Need
The purpose of the ROS is to enable TVA to review and evaluate its reservoir operations policy to determine whether changes in the policy would produce greater public value. TVA’s reservoir operations policy guides the day-to-day operation of the Tennessee River system. It affects how much reservoir levels rise and fall, when changes in reservoir levels occur, and the amount of water flowing through the reservoir system at different times of the year. The policy sets the balance of trade-offs among competing uses of the water in the system.
Changing TVA’s reservoir operations policy would modify the present balance among the various operating objectives for the system. These modifications would involve changing the existing reservoir system operating guidelines. In addition, because TVA receives no appropriations (money) from Congress, changes to its operations policy that require additional capital or operating expenditures would need to be funded by TVA or others.
TVA has periodically changed and adjusted its reservoir operations policy to achieve greater overall value for the public. Past policy changes reflected factors such as the public’s changing needs and concerns, requests from citizens and regional groups, environmental quality issues, changes in the power industry, and TVA’s own mission and planning needs. The reservoir operations policy also reflects a growing experience and understanding of the challenges and limitations imposed by annual variations in rainfall and runoff, especially during droughts and floods.
The last major evaluation of the environmental and socioeconomic impacts of TVA’s reservoir operations policy was included in the Tennessee River and Reservoir System Operation and
Executive Summary
ES-4 Tennessee Valley Authority Reservoir Operations Study − Final Programmatic EIS
Planning Review EIS, also known as the Lake Improvement Plan, which was completed in 1990. In 1991, the Board approved changes that included extending reservoir levels on 10 tributary reservoirs to August 1 in order to increase recreational opportunities. TVA also increased minimum flow requirements for many of its mainstem and tributary projects, and began a program to increase dissolved oxygen (DO) concentrations in the releases from 16 TVA dams. Following that evaluation, TVA continued to receive requests for changes to reservoir levels and other operations. As more and more users requested studies for their particular reservoir or tailwater, TVA decided that a piecemeal approach raised questions of fairness in how each reservoir would be treated. A comprehensive review was needed to examine the effects of changes in the reservoir operations policy on all of the operating objectives for the system across the entire TVA region.
ES.4 Scope of the ROS
TVA owns or operates 49 dams and reservoirs (called projects) in the Tennessee River and Cumberland River watersheds. The scope of the ROS EIS included evaluating the operations of 35 of these projects—projects for which TVA schedules water releases and reservoir levels in accordance with its reservoir operations policy. The remaining 14 projects not included in the ROS are one pumped storage project and several small water retention dams that are essentially self-regulating. These projects have little impact on the operation of TVA’s water control system. In addition, physical removal of or major structural modifications to TVA dams and power plants was not included in the scope of the EIS.
The geographic area potentially affected by changes in the reservoir operations policy includes the Tennessee River watershed and the larger TVA Power Service Area. This area covers almost all of Tennessee and parts of Alabama, Kentucky, Georgia, Mississippi, North Carolina, and Virginia. The Tennessee River watershed includes 129 counties and encompasses 40,900 square miles; TVA’s Power Service Area comprises 201 counties and covers approximately 80,000 square miles. Analyses of some resource areas (e.g., Navigation and Air Quality) included parts of the Ohio and Mississippi River systems and other areas outside the Valley and TVA Power Service Area to ensure a comprehensive analysis.
As is typical of water resource planning and management studies of this type, the ROS and this EIS used a long-range planning horizon (to the year 2030).
Executive Summary
Tennessee Valley Authority ES-5 Reservoir Operations Study − Final Programmatic EIS
ES.5 Issues Considered
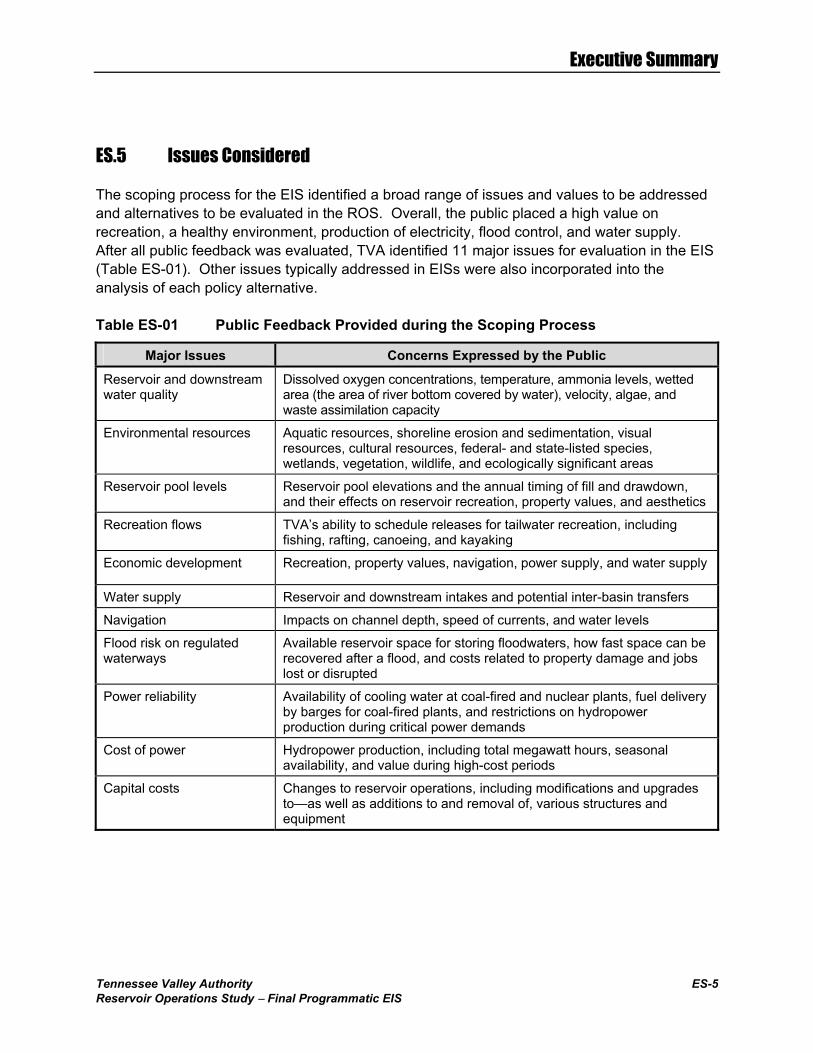
The scoping process for the EIS identified a broad range of issues and values to be addressed and alternatives to be evaluated in the ROS. Overall, the public placed a high value on recreation, a healthy environment, production of electricity, flood control, and water supply. After all public feedback was evaluated, TVA identified 11 major issues for evaluation in the EIS (Table ES-01). Other issues typically addressed in EISs were also incorporated into the analysis of each policy alternative.
Table ES-01 Public Feedback Provided during the Scoping Process
Major Issues Concerns Expressed by the Public
Reservoir and downstream water quality
Dissolved oxygen concentrations, temperature, ammonia levels, wetted area (the area of river bottom covered by water), velocity, algae, and waste assimilation capacity
Environmental resources Aquatic resources, shoreline erosion and sedimentation, visual resources, cultural resources, federal- and state-listed species, wetlands, vegetation, wildlife, and ecologically significant areas
Reservoir pool levels Reservoir pool elevations and the annual timing of fill and drawdown, and their effects on reservoir recreation, property values, and aesthetics
Recreation flows TVA’s ability to schedule releases for tailwater recreation, including fishing, rafting, canoeing, and kayaking
Economic development Recreation, property values, navigation, power supply, and water supply
Water supply Reservoir and downstream intakes and potential inter-basin transfers
Navigation Impacts on channel depth, speed of currents, and water levels
Flood risk on regulated waterways
Available reservoir space for storing floodwaters, how fast space can be recovered after a flood, and costs related to property damage and jobs lost or disrupted
Power reliability Availability of cooling water at coal-fired and nuclear plants, fuel delivery by barges for coal-fired plants, and restrictions on hydropower production during critical power demands
Cost of power Hydropower production, including total megawatt hours, seasonal availability, and value during high-cost periods
Capital costs Changes to reservoir operations, including modifications and upgrades to—as well as additions to and removal of, various structures and equipment
Executive Summary
ES-6 Tennessee Valley Authority Reservoir Operations Study − Final Programmatic EIS
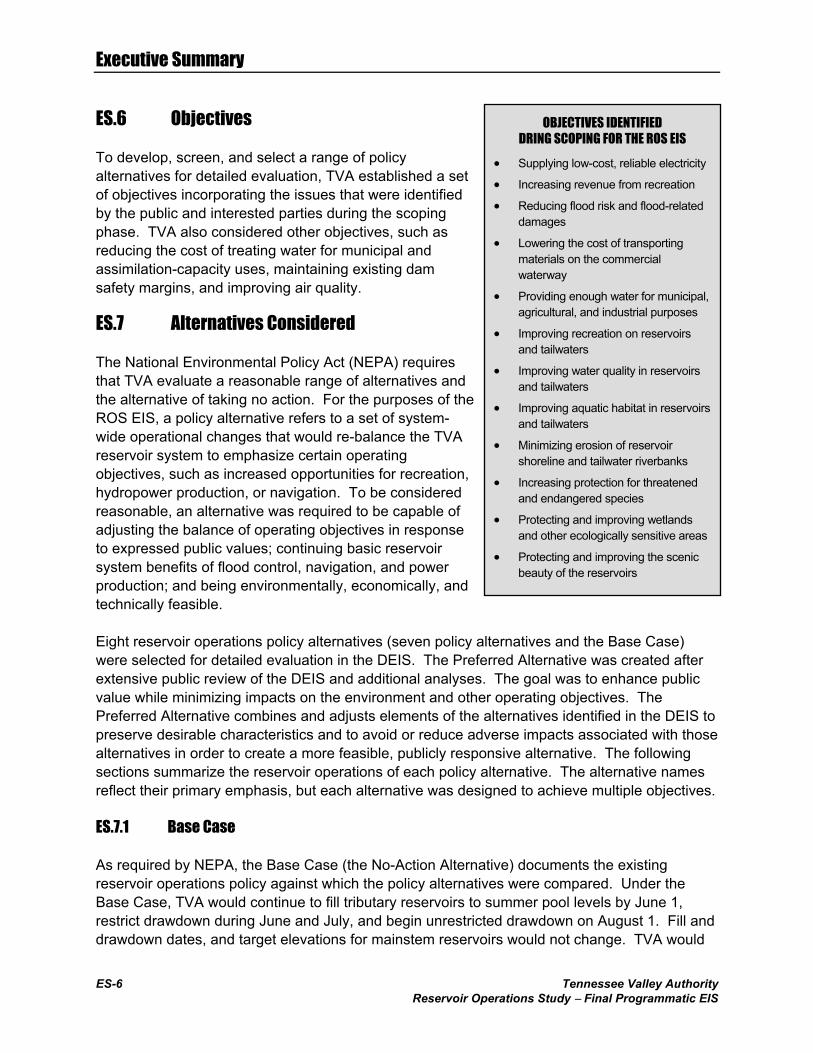
OBJECTIVES IDENTIFIED DRING SCOPING FOR THE ROS EIS
• Supplying low-cost, reliable electricity
• Increasing revenue from recreation
• Reducing flood risk and flood-related damages
• Lowering the cost of transporting materials on the commercial waterway
• Providing enough water for municipal, agricultural, and industrial purposes
• Improving recreation on reservoirs and tailwaters
• Improving water quality in reservoirs and tailwaters
• Improving aquatic habitat in reservoirs and tailwaters
• Minimizing erosion of reservoir shoreline and tailwater riverbanks
• Increasing protection for threatened and endangered species
• Protecting and improving wetlands and other ecologically sensitive areas
• Protecting and improving the scenic beauty of the reservoirs
ES.6 Objectives
To develop, screen, and select a range of policy alternatives for detailed evaluation, TVA established a set of objectives incorporating the issues that were identified by the public and interested parties during the scoping phase. TVA also considered other objectives, such as reducing the cost of treating water for municipal and assimilation-capacity uses, maintaining existing dam safety margins, and improving air quality.
ES.7 Alternatives Considered
The National Environmental Policy Act (NEPA) requires that TVA evaluate a reasonable range of alternatives and the alternative of taking no action. For the purposes of the ROS EIS, a policy alternative refers to a set of system-wide operational changes that would re-balance the TVA reservoir system to emphasize certain operating objectives, such as increased opportunities for recreation, hydropower production, or navigation. To be considered reasonable, an alternative was required to be capable of adjusting the balance of operating objectives in response to expressed public values; continuing basic reservoir system benefits of flood control, navigation, and power production; and being environmentally, economically, and technically feasible.
Eight reservoir operations policy alternatives (seven policy alternatives and the Base Case) were selected for detailed evaluation in the DEIS. The Preferred Alternative was created after extensive public review of the DEIS and additional analyses. The goal was to enhance public value while minimizing impacts on the environment and other operating objectives. The Preferred Alternative combines and adjusts elements of the alternatives identified in the DEIS to preserve desirable characteristics and to avoid or reduce adverse impacts associated with those alternatives in order to create a more feasible, publicly responsive alternative. The following sections summarize the reservoir operations of each policy alternative. The alternative names reflect their primary emphasis, but each alternative was designed to achieve multiple objectives.
ES.7.1 Base Case
As required by NEPA, the Base Case (the No-Action Alternative) documents the existing reservoir operations policy against which the policy alternatives were compared. Under the Base Case, TVA would continue to fill tributary reservoirs to summer pool levels by June 1, restrict drawdown during June and July, and begin unrestricted drawdown on August 1. Fill and drawdown dates, and target elevations for mainstem reservoirs would not change. TVA would
Executive Summary
Tennessee Valley Authority ES-7 Reservoir Operations Study − Final Programmatic EIS
maintain the 2-foot normal winter operating range on mainstem reservoirs. Established minimum flows, including 13,000 cubic feet per second (cfs) bi-weekly average minimum flows at Chickamauga Reservoir from June to August, would continue. TVA would also continue recreation releases below Watauga/Wilbur, Apalachia, Tims Ford, Ocoee #2, and Ocoee #3 Reservoirs.
The Base Case also involves a number of other actions that would occur regardless of changes in the reservoir operations policy. These actions include existing water use patterns, taking into account increasing water supply demand in the future (through 2030); modernization and automation of TVA’s hydro plants; operation of Browns Ferry Unit 1 and continued operation and uprate of Units 2 and 3; and operation of the Tennessee−Tombigbee Waterway at full capacity.
ES.7.2 Reservoir Recreation Alternative A
Reservoir Recreation Alternative A would extend the summer pool period and delay unrestricted drawdown on 10 tributary reservoirs (Blue Ridge, Chatuge, Cherokee, Douglas, Fontana, Hiwassee, Nottely, Norris, South Holston, and Watauga) until Labor Day (a month longer than under the Base Case). For Great Falls, the summer fill period would be completed by Memorial Day. On six mainstem reservoirs (Chickamauga, Guntersville, Kentucky/Barkley, Pickwick, Watts Bar, and Wheeler), the summer pool period would be extended to August 1 and then reduced by 1 foot from August 1 through Labor Day.
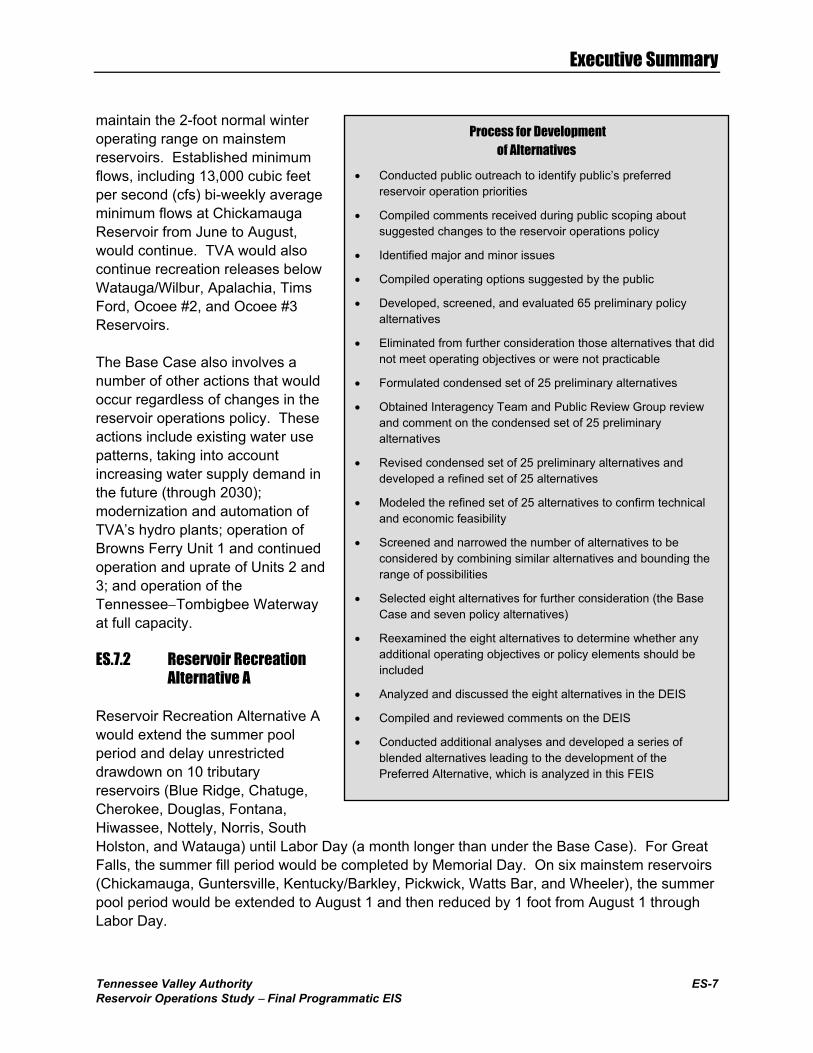
Process for Development of Alternatives
• Conducted public outreach to identify public’s preferred reservoir operation priorities
• Compiled comments received during public scoping about suggested changes to the reservoir operations policy
• Identified major and minor issues
• Compiled operating options suggested by the public
• Developed, screened, and evaluated 65 preliminary policy alternatives
• Eliminated from further consideration those alternatives that did not meet operating objectives or were not practicable
• Formulated condensed set of 25 preliminary alternatives
• Obtained Interagency Team and Public Review Group review and comment on the condensed set of 25 preliminary alternatives
• Revised condensed set of 25 preliminary alternatives and developed a refined set of 25 alternatives
• Modeled the refined set of 25 alternatives to confirm technical and economic feasibility
• Screened and narrowed the number of alternatives to be considered by combining similar alternatives and bounding the range of possibilities
• Selected eight alternatives for further consideration (the Base Case and seven policy alternatives)
• Reexamined the eight alternatives to determine whether any additional operating objectives or policy elements should be included
• Analyzed and discussed the eight alternatives in the DEIS
• Compiled and reviewed comments on the DEIS
• Conducted additional analyses and developed a series of blended alternatives leading to the development of the Preferred Alternative, which is analyzed in this FEIS
Executive Summary
ES-8 Tennessee Valley Authority Reservoir Operations Study − Final Programmatic EIS
To maintain summer pool levels, reservoir releases during the summer pool period would be generally limited to those necessary to meet project and system minimum flow requirements1 and to maintain flood storage allocation. However, the bi-weekly average releases from Chickamauga Reservoir would be increased and limited to 25,000 cfs weekly average from August 1 to Labor Day, providing sufficient flow throughout the reservoir system to minimize additional derating of nuclear and fossil power plants located on the reservoirs.
Under Reservoir Recreation Alternative A, the winter flood guide levels would be increased on 10 tributary reservoirs (Blue Ridge, Chatuge, Cherokee, Douglas, Hiwassee, Nottely, Norris, South Holston, Tims Ford, and Watauga) to the pool level targeted to be reached by March 15 under the Base Case. On five mainstem reservoirs (Fort Loudoun, Watts Bar, Chickamauga, Wheeler, and Pickwick), the minimum winter elevation would be raised by 2 feet, and the typical 2-foot winter fluctuating zone under the Base Case would be reduced to 1 foot for these five mainstem reservoirs under Reservoir Recreation Alternative A.
ES.7.3 Reservoir Recreation Alternative B
Reservoir Recreation Alternative B is similar to Reservoir Recreation Alternative A. Targeted summer pool levels would be extended to Labor Day on 10 tributary reservoirs (Blue Ridge, Chatuge, Cherokee, Douglas, Fontana, Hiwassee, Nottely, Norris, South Holston, and Watauga) by delaying the beginning of unrestricted drawdown to Labor Day. On six mainstem reservoirs (Chickamauga, Fort Loudoun, Guntersville, Kentucky/Barkley, Pickwick, Wheeler, and Watts Bar), the summer pool elevations would be extended to Labor Day (as compared to August 1 under Reservoir Recreation Alternative A). In contrast to Reservoir Recreation Alternative A, Reservoir Recreation Alternative B would have no allowance for mainstem drawdown between August 1 and Labor Day.
For Reservoir Recreation Alternative B, the method of flood storage allocation would be changed to provide adequate storage for the 7-day, 500-year inflow2. Reservoir releases would be limited to only minimum flows from June 1 to Labor Day. Chickamauga Reservoir minimum releases would remain at 13,000 cfs (the Base Case).
1 System minimum flows are indicators of total flow through the system to meet specific system requirements for navigation, water supply, waste assimilation, and other benefits—including the assurance that adequate cooling water is provided to reduce derates at TVA’s nuclear and coal-fired plants. System minimum flows are measured at the Chickamauga, Kentucky, and Pickwick Dams, and other locations. These flows include a bi-weekly average minimum flow in summer and a daily average minimum flow in winter. If the total of the project minimum flows plus any additional runoff from the watershed is insufficient to meet these system minimum flows, additional water must be released from upstream reservoirs to make up the difference. 2 The 7-day, 500-year flood storage allocation for a given reservoir is the flood storage volume required to store the maximum 7-day average local inflow for a storm with a probability of occurrence in any given year of 0.002 (commonly referred to as the 500-year flood). The storage volume required for a specific reservoir assumes no releases from upstream projects.
Executive Summary
Tennessee Valley Authority ES-9 Reservoir Operations Study − Final Programmatic EIS
In most cases, winter reservoir levels on tributary reservoirs would be higher, but by an amount that would vary among reservoirs depending on storage needed for the 7-day, 500-year inflow. On mainstem reservoirs, the minimum winter elevation would be raised 2 feet where possible. The typical 2-foot winter fluctuating zone under the Base Case would be reduced to 1 foot for these mainstem reservoirs under Reservoir Recreation Alternative B.
ES.7.4 Summer Hydropower Alternative
Under the Summer Hydropower Alternative, unrestricted drawdown would begin immediately after June 1 to increase power production and flood storage volume on both tributary and mainstem reservoirs.
Under the Summer Hydropower Alternative, the method of flood storage allocation would be revised to provide adequate storage for inflow for the 7-day, 500-year storm—allowing flood guides on tributary reservoirs to be raised in some cases. Weekly average releases from Chickamauga Reservoir would be increased to 35,000 cfs (compared to 13,000 cfs bi-weekly average under the Base Case). The only scheduled tailwater releases would occur at Ocoee #2 Reservoir.
ES.7.5 Equalized Summer/Winter Flood Risk Alternative
The principal changes to system operations under the Equalized Summer/Winter Flood Risk Alternative would involve establishing year-round flood guides for tributary and mainstem reservoirs that would vary by reservoir and month, depending on the anticipated runoff. These flood guides would be based on a reservoir’s capacity to store inflow from the critical-period, 500-year storm3 and would equalize the level of flood risk in all seasons. For tributary projects, a year-round flood guide would generally result in higher winter reservoir levels and lower summer reservoir levels, compared to the Base Case. For mainstem projects, the guide curves were modified to begin fill on April 1 and reach summer pool elevation by the end of May. A year-round flood guide would generally result in increased winter reservoir levels and reduced summer reservoir levels, in comparison to the Base Case.
Reservoir releases from June 1 to Labor Day would be limited to only those necessary to maintain minimum flows. Releases from Chickamauga Reservoir would be increased from the 13,000-cfs bi-weekly average under the Base Case to a 25,000-cfs weekly average from August 1 to Labor Day under the Equalized Summer/Winter Flood Risk Alternative.
ES.7.6 Commercial Navigation Alternative
Under the Commercial Navigation Alternative, changes to operations would primarily affect mainstem reservoirs. Raising the winter flood guides by 2 feet on mainstem reservoirs, where
3 The critical-period, 500-year storage for a given reservoir is the maximum storage volume required to store the inflow from a storm, with a probability occurrence in any given year of 0.002 (commonly referred to as the 500-year storm). The storage volume required for a specific reservoir also takes into account the reservoir’s natural inflow/discharge and inflows from upstream projects.
Executive Summary
ES-10 Tennessee Valley Authority Reservoir Operations Study − Final Programmatic EIS
possible, would increase the navigation channel depth to 13 feet (providing an 11-foot navigation channel with a 2-foot overdraft). The mainstem winter operating range would be modified to allow only a 1-foot fluctuation on those mainstem reservoirs raised 2 feet in winter.
To further support navigation operations, minimum flows would be increased at several key projects with major navigation locks. Specific instantaneous minimum flows, would be provided at Kentucky, Pickwick, and Wilson Dams to reduce the difficulty of navigation at certain locations. At Pickwick and Wilson Dams, these flows would also be tied to pool elevation. A limitation on maximum flow (except in flood control situations) would be imposed at Barkley Reservoir, when practical, to reduce high-flow navigation hindrances.
ES.7.7 Tailwater Recreation Alternative
Under the Tailwater Recreation Alternative, tailwater recreation releases would have higher priority than maintaining water levels for reservoir recreation. This alternative would include extending the summer pool period to Labor Day; changing winter tributary flood guides to the 7-day, 500-year storm inflow; and raising winter mainstem reservoir levels by 2 feet, where possible. From June 1 to Labor Day, two types of reservoir releases would occur. Releases would be made to maintain minimum flows, and additional releases would be scheduled to increase tailwater recreational opportunities at a five projects (Apalachia, Norris, Ocoee #1, South Holston, and Watauga/Wilbur).
ES.7.8 Tailwater Habitat Alternative
Under the Tailwater Habitat Alternative, the principal change to system operations would involve releasing Base Case minimum flows or 25 percent of the inflow—whichever is greater—as a relatively continuous minimum flow with no turbine peaking. Hydroturbine pulsing would continue to be used to provide minimum flows. Minimum Operations Guides (MOGs) would be eliminated on tributary reservoirs. Tributary and mainstem reservoirs would use operating guide curves similar to the ones used under Reservoir Recreation Alternative A. Mainstem winter operating ranges would be limited to 1 foot for those projects raised 2 feet in winter.
Under this alternative, reservoir releases into tailwaters would produce flows, water depths, and velocities throughout the year that would be more similar to natural seasonal variability. Actual flows, limits, and changes would be determined by the inflow conditions. During high inflows, water would be released to keep elevations below the flood guides. During low inflows, existing project minimum flows would be met. In the intermediate inflow ranges, 25 percent of the inflow would be passed. Hydropower operations would occur when water is released from the dams.
ES.7.9 Preferred Alternative
Under the Preferred Alternative, each project would meet its own Base Case minimum flow requirements and share the responsibility for meeting increased system minimum flow requirements. After meeting those requirements, elevations on 10 tributary reservoirs (Blue Ridge, Chatuge, Cherokee, Douglas, Fontana, Nottely, Hiwassee, Norris, South Holston, and Watauga) would be maintained as close as possible to the summer flood guide from June 1
Executive Summary
Tennessee Valley Authority ES-11 Reservoir Operations Study − Final Programmatic EIS
through Labor Day, resulting in restricted drawdown during this period. When rainfall and runoff are insufficient to meet system flow requirements, the needed water would be released from the upstream tributary reservoirs to augment the natural inflows, resulting in some drawdown of all of these projects. This would be expected to occur in about 90 percent of the years.
Reservoir balancing guides established for each tributary storage reservoir would be used under the Preferred Alternative to ensure that the proportional water releases for downstream system needs are drawn from the tributary reservoirs equitably. A balancing guide is a seasonal reservoir pool elevation that defines the relative drawdown at each tributary reservoir when downstream flow augmentation is required. Subject to variations in rainfall and runoff across the projects, and the necessity to ensure at least minimal hydropower capacity at each tributary project (up to a water equivalent of 17 hours of use per week at best turbine efficiency from July 1 through Labor Day), water would be drawn from each tributary reservoir so that elevation of each reservoir would be similar relative to its position between the flood guide and the balancing guide. Summer operating zones would be maintained through Labor Day at four additional mainstem projects (Chickamauga, Guntersville, Pickwick, and Wheeler). Base Case minimum flows, except for the increases noted below, and the DO targets adopted following completion of the 1990 Lake Improvement Plan would continue to be met.
Subject to flood control operations or extreme drought conditions, scheduled releases would be provided at five additional tributary projects (Ocoee #1, Apalachia, Norris, Watauga/Wilbur, and South Holston) to increase tailwater recreational opportunities. Under the Base Case, recreational releases are not formally scheduled at these five projects and are made only after other operating requirements have been met.
Under the Preferred Alternative, the weekly average system flow requirement from June 1 through Labor Day measured at Chickamauga Dam would be determined by the volume of water in storage at 10 upstream tributary reservoirs relative to a system Minimum Operations Guide (MOG). This guide is a seasonal storage guide that defines the combined storage volume for those 10 tributary reservoirs (Blue Ridge, Chatuge, Cherokee, Douglas, Fontana, Nottely, Hiwassee, Norris, South Holston, and Watauga). If the volume of water in storage is more than the system MOG, the weekly average system flow requirement would be increased each week from 14,000 cfs the first week of June to 25,000 cfs the last week of July. Beginning August 1 and continuing through Labor Day, the weekly average flow requirement would be 29,000 cfs. If the volume of water in storage is less than the system MOG, only 13,000 cfs weekly average flows would be released between June 1 and July 31, and only 25,000 cfs weekly average flows would be released from August 1 through Labor Day. During normal operations June through Labor Day, weekly average system flows would not be lower than the amounts specified to ensure adequate flow through the system. Also, they would not be higher than the specified amounts to maintain pool levels as close as possible to the flood guides on 10 tributary reservoirs. After periods of high inflow, higher flows would be released as necessary to recover allocated flood storage space. Continuous minimum flows would be provided in the Apalachia Bypass reach from June 1 through November 1.
Executive Summary
ES-12 Tennessee Valley Authority Reservoir Operations Study − Final Programmatic EIS
The winter flood guide levels would be raised on 10 tributary reservoirs (Boone, Chatuge, Cherokee, Douglas, Fontana, Hiwassee, Norris, Nottely, South Holston, and Watauga) based on the results of the flood risk analysis. On Wheeler Reservoir, the minimum winter elevation would be raised by 0.5 foot to better ensure an 11-foot minimum depth in the navigation channel. Steady water releases up to 25,000 cfs of flow would be provided as necessary at Kentucky Dam to maintain a tailwater elevation of 301 feet. Great Falls Reservoir would be filled earlier to reach full summer pool by Memorial Day. On Fort Loudoun, Watts Bar, and Chickamauga Reservoirs, the fill period would follow the Base Case fill schedule during the first week in April. Then, the fill schedule would be delayed to reach summer operating zone by mid-May.
ES.8 Other Actions Considered
TVA considered a number of other possible actions during formulation of the policy alternatives. They included actions that exist or could be implemented independent of changes in reservoir operations policy, such as continuing operation of the Bear Creek and Normandy Projects under existing guide curves, changes in hydroturbine ramping rates, and operations to support fish spawning and improve habitat and biodiversity. TVA also considered but did not include a number of other actions, including major structural modifications to dams, levee construction, maintaining summer reservoir levels year-round, reducing minimum flows from tributary dams or filling tributary reservoirs by March 1, and delaying drawdown until after October. Other actions considered but not included in any of the policy alternatives were reducing the navigation channel to 9 feet or dredging the navigation channel, strengthening TVA’s regulatory authority, and constructing or relying on new alternative energy sources and incentives for energy and water conservation. Some of these actions were not within the overall scope of the ROS, were not feasible, would clearly result in unacceptable environmental impacts, or have been considered in previous TVA studies.
ES.9 Potential Impacts and Comparison of Alternatives
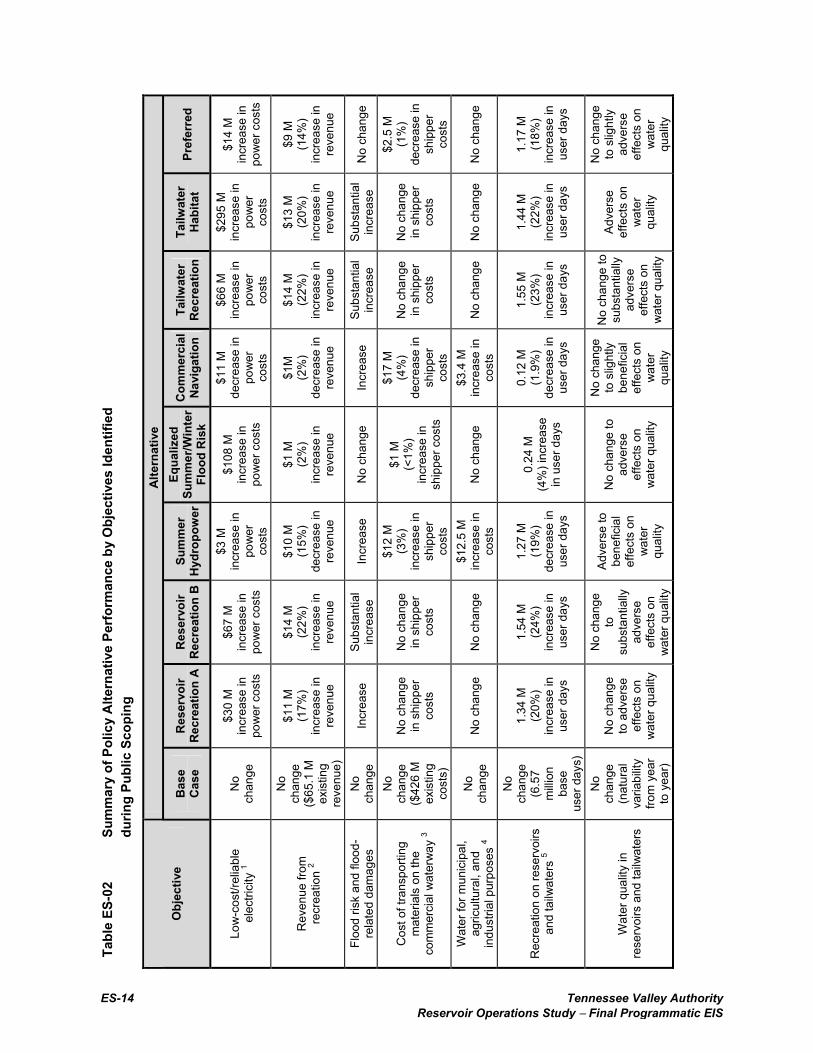
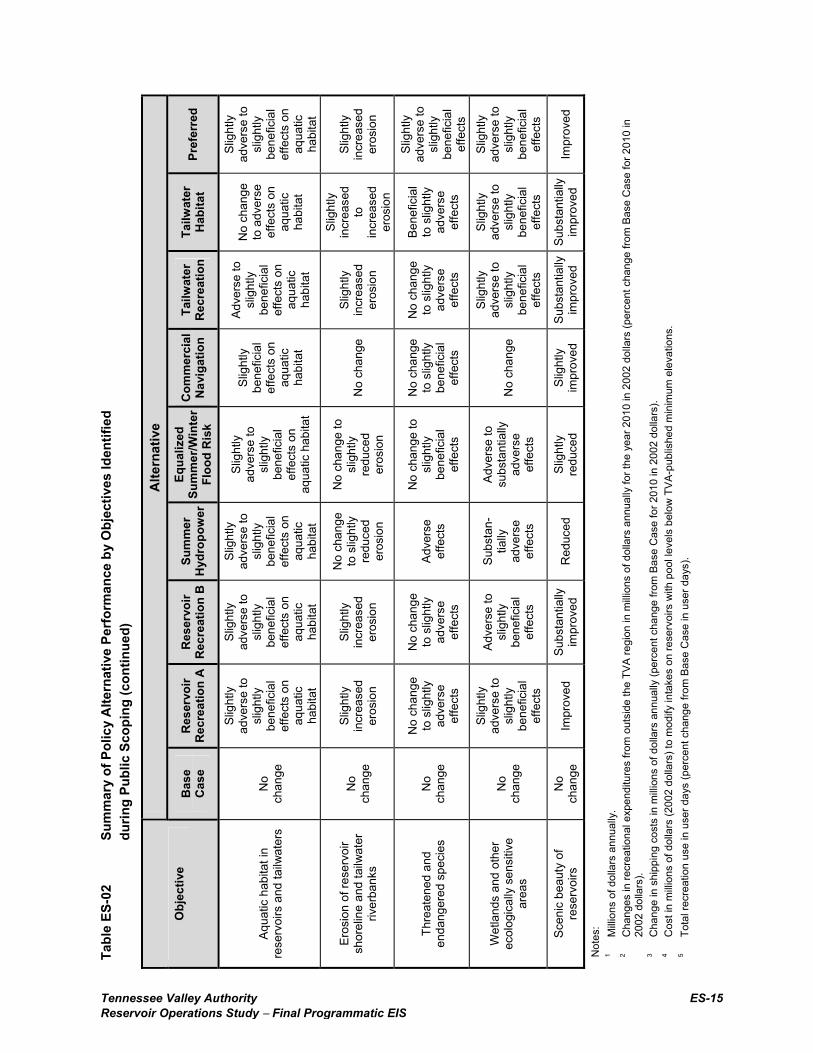
Identifying and quantifying the trade-offs between competing reservoir operating objectives were essential to evaluating the policy alternatives. TVA performed a comprehensive environmental and economic evaluation of each of the policy alternatives. Three separate evaluations were performed—one with respect to the objectives identified during from the public scoping process (see Table ES-02), a second to evaluate impacts on each of the environmental resources (see Table ES-03), and a third to calculate regional economic benefits (see Table ES-04).
ES.9.1 Objectives Identified during Scoping
TVA conducted an extensive scoping process to obtain public input on future operations of the water control system. The 12 operating objectives identified during scoping are identified in Section ES.6. Table ES-02 shows the performance for each of the policy alternatives selected for evaluation in relation to those objectives. This table shows how well each policy alternative performed in relation to reservoir operating objectives important to the public. Changes in power costs and flood damage are predicted to be in the range of 1 percent or less. Other
Executive Summary
Tennessee Valley Authority ES-13 Reservoir Operations Study − Final Programmatic EIS
sectors, however, may experience greater changes. The one sector of direct economic effects that would increase for most alternatives is the change in recreation revenue. All of the alternatives that include increased recreation benefits would increase revenue approximately 20 percent. The Summer Hydropower Alternative and the Commercial Navigation Alternative would result in negative recreation revenues. In another category, shipper savings may be increased by 4 percent under the Commercial Navigation Alternative.
ES.9.2 Impacts on Resource Areas
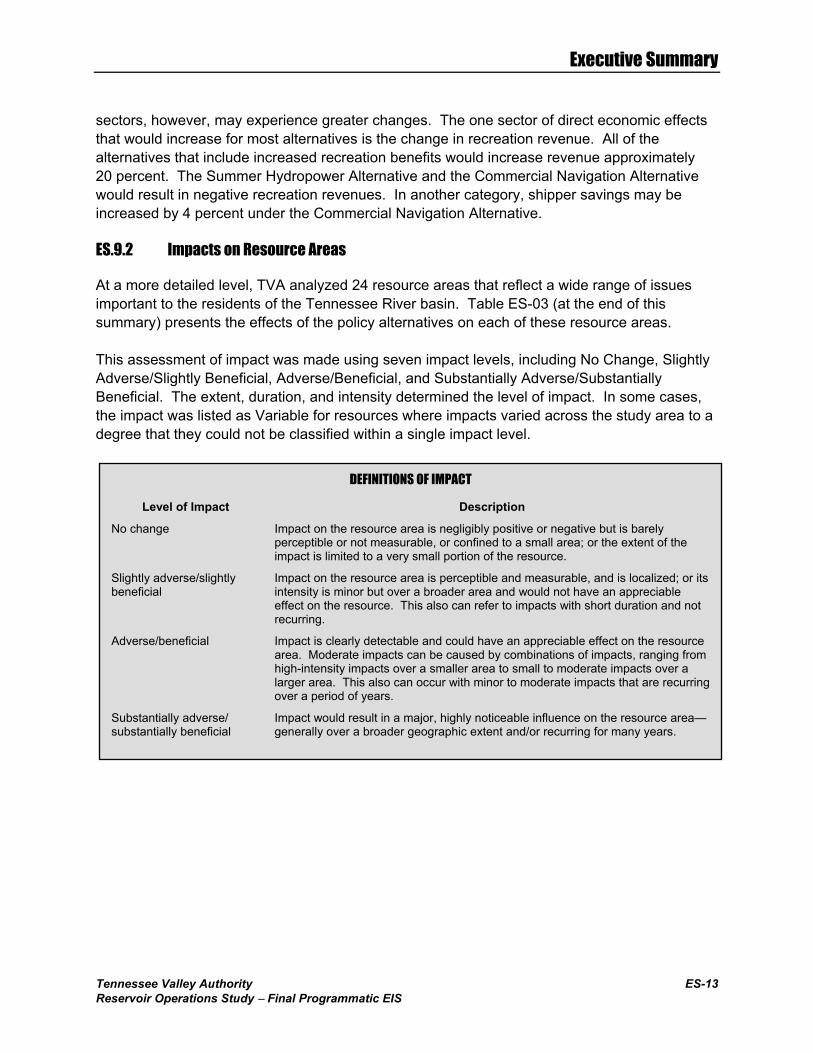
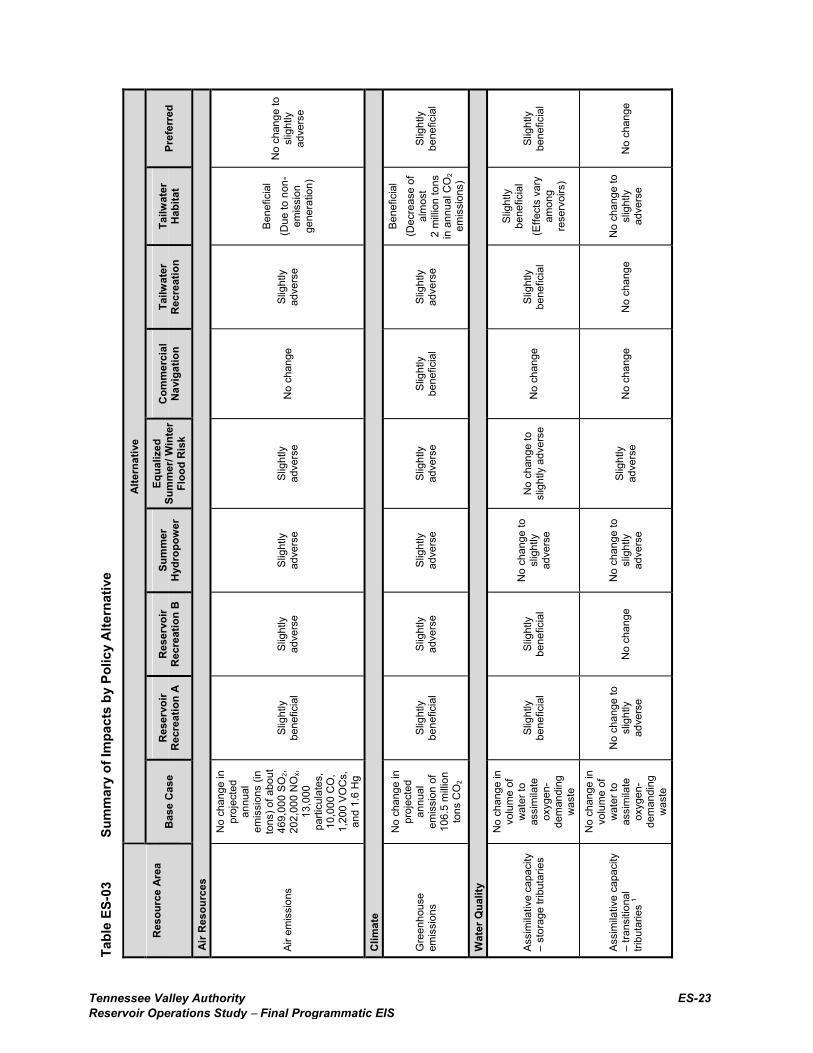
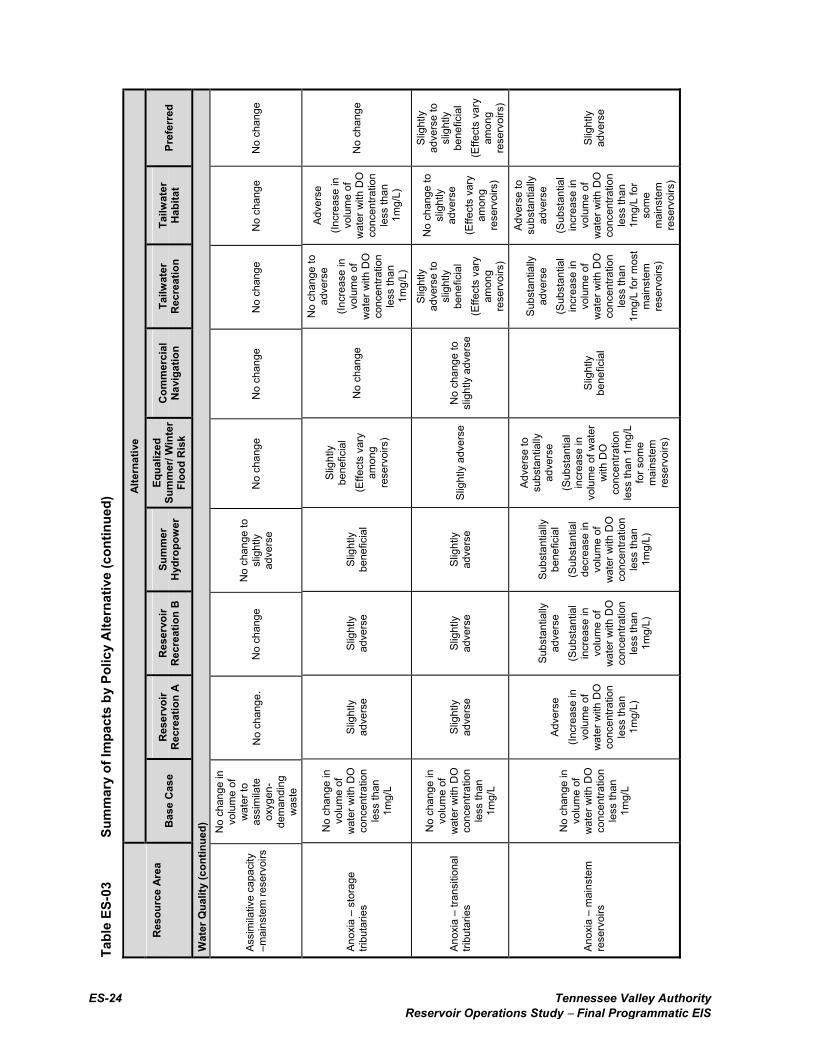
At a more detailed level, TVA analyzed 24 resource areas that reflect a wide range of issues important to the residents of the Tennessee River basin. Table ES-03 (at the end of this summary) presents the effects of the policy alternatives on each of these resource areas.
This assessment of impact was made using seven impact levels, including No Change, Slightly Adverse/Slightly Beneficial, Adverse/Beneficial, and Substantially Adverse/Substantially Beneficial. The extent, duration, and intensity determined the level of impact. In some cases, the impact was listed as Variable for resources where impacts varied across the study area to a degree that they could not be classified within a single impact level.
DEFINITIONS OF IMPACT
Level of Impact Description
No change Impact on the resource area is negligibly positive or negative but is barely perceptible or not measurable, or confined to a small area; or the extent of the impact is limited to a very small portion of the resource.
Slightly adverse/slightly beneficial
Impact on the resource area is perceptible and measurable, and is localized; or its intensity is minor but over a broader area and would not have an appreciable effect on the resource. This also can refer to impacts with short duration and not recurring.
Adverse/beneficial Impact is clearly detectable and could have an appreciable effect on the resource area. Moderate impacts can be caused by combinations of impacts, ranging from high-intensity impacts over a smaller area to small to moderate impacts over a larger area. This also can occur with minor to moderate impacts that are recurring over a period of years.
Substantially adverse/ substantially beneficial
Impact would result in a major, highly noticeable influence on the resource area— generally over a broader geographic extent and/or recurring for many years.
ES-14 Tennessee Valley Authority Reservoir Operations Study − Final Programmatic EIS
Tabl
e ES
-02
Sum
mar
y of
Pol
icy
Alte
rnat
ive
Perf
orm
ance
by
Obj
ectiv
es Id
entif
ied
durin
g Pu
blic
Sco
ping
Alte
rnat
ive
Obj
ectiv
e B
ase
Cas
e R
eser
voir
Rec
reat
ion
AR
eser
voir
Rec
reat
ion
BSu
mm
er
Hyd
ropo
wer
Equa
lized
Su
mm
er/W
inte
r Fl
ood
Ris
k C
omm
erci
al
Nav
igat
ion
Tailw
ater
R
ecre
atio
n Ta
ilwat
er
Hab
itat
Pref
erre
d
Low
-cos
t/rel
iabl
e el
ectri
city
1 N
o ch
ange
$30
M
incr
ease
in
pow
er c
osts
$67
M
incr
ease
in
pow
er c
osts
$3 M
in
crea
se in
po
wer
co
sts
$108
M
incr
ease
in
pow
er c
osts
$11
M
decr
ease
in
pow
er
cost
s
$66
M
incr
ease
in
pow
er
cost
s
$295
M
incr
ease
in
pow
er
cost
s
$14
M
incr
ease
in
pow
er c
osts
Rev
enue
from
re
crea
tion
2
No
chan
ge
($65
.1 M
ex
istin
g re
venu
e)
$11
M
(17%
) in
crea
se in
re
venu
e
$14
M
(22%
) in
crea
se in
re
venu
e
$10
M
(15%
) de
crea
se in
re
venu
e
$1 M
(2
%)
incr
ease
in
reve
nue
$1M
(2
%)
decr
ease
in
reve
nue
$14
M
(22%
) in
crea
se in
re
venu
e
$13
M
(20%
) in
crea
se in
re
venu
e
$9 M
(1
4%)
incr
ease
in
reve
nue
Floo
d ris
k an
d flo
od-
rela
ted
dam
ages
N
o ch
ange
In
crea
se
Subs
tant
ial
incr
ease
In
crea
se
No
chan
ge
Incr
ease
Su
bsta
ntia
l in
crea
se
Subs
tant
ial
incr
ease
N
o ch
ange
Cos
t of t
rans
porti
ng
mat
eria
ls o
n th
e co
mm
erci
al w
ater
way
3
No
chan
ge
($42
6 M
ex
istin
g co
sts)
No
chan
ge
in s
hipp
er
cost
s
No
chan
ge
in s
hipp
er
cost
s
$12
M
(3%
) in
crea
se in
sh
ippe
r co
sts
$1 M
(<
1%)
incr
ease
in
ship
per c
osts
$17
M
(4%
) de
crea
se in
sh
ippe
r co
sts
No
chan
ge
in s
hipp
er
cost
s
No
chan
ge
in s
hipp
er
cost
s
$2.5
M
(1%
) de
crea
se in
sh
ippe
r co
sts
Wat
er fo
r mun
icip
al,
agric
ultu
ral,
and
indu
stria
l pur
pose
s 4
No
chan
ge
No
chan
ge
No
chan
ge
$12.
5 M
in
crea
se in
co
sts
No
chan
ge
$3.4
M
incr
ease
in
cost
s N
o ch
ange
N
o ch
ange
N
o ch
ange
Rec
reat
ion
on re
serv
oirs
an
d ta
ilwat
ers
5
No
chan
ge
(6.5
7 m
illion
ba
se
user
day
s)
1.34
M
(20%
) in
crea
se in
us
er d
ays
1.54
M
(24%
) in
crea
se in
us
er d
ays
1.27
M
(19%
) de
crea
se in
us
er d
ays
0.24
M
(4%
) inc
reas
e in
use
r day
s
0.12
M
(1.9
%)
decr
ease
in
user
day
s
1.55
M
(23%
) in
crea
se in
us
er d
ays
1.44
M
(22%
) in
crea
se in
us
er d
ays
1.17
M
(18%
) in
crea
se in
us
er d
ays
Wat
er q
ualit
y in
re
serv
oirs
and
tailw
ater
s
No
chan
ge
(nat
ural
va
riabi
lity
from
yea
r to
yea
r)
No
chan
ge
to a
dver
se
effe
cts
on
wat
er q
ualit
y
No
chan
ge
to
subs
tant
ially
ad
vers
e ef
fect
s on
w
ater
qua
lity
Adve
rse
to
bene
ficia
l ef
fect
s on
w
ater
qu
ality
No
chan
ge to
ad
vers
e ef
fect
s on
w
ater
qua
lity
No
chan
ge
to s
light
ly
bene
ficia
l ef
fect
s on
w
ater
qu
ality
No
chan
ge to
su
bsta
ntia
lly
adve
rse
effe
cts
on
wat
er q
ualit
y
Adve
rse
effe
cts
on
wat
er
qual
ity
No
chan
ge
to s
light
ly
adve
rse
effe
cts
on
wat
er
qual
ity
Tennessee Valley Authority ES-15Reservoir Operations Study − Final Programmatic EIS
Tabl
e ES
-02
Sum
mar
y of
Pol
icy
Alte
rnat
ive
Perf
orm
ance
by
Obj
ectiv
es Id
entif
ied
durin
g Pu
blic
Sco
ping
(con
tinue
d)
Alte
rnat
ive
Obj
ectiv
e B
ase
Cas
e R
eser
voir
Rec
reat
ion
AR
eser
voir
Rec
reat
ion
BSu
mm
er
Hyd
ropo
wer
Equa
lized
Su
mm
er/W
inte
r Fl
ood
Ris
k C
omm
erci
al
Nav
igat
ion
Tailw
ater
R
ecre
atio
n Ta
ilwat
er
Hab
itat
Pref
erre
d
Aqua
tic h
abita
t in
rese
rvoi
rs a
nd ta
ilwat
ers
N
o ch
ange
Slig
htly
ad
vers
e to
sl
ight
ly
bene
ficia
l ef
fect
s on
aq
uatic
ha
bita
t
Slig
htly
ad
vers
e to
sl
ight
ly
bene
ficia
l ef
fect
s on
aq
uatic
ha
bita
t
Slig
htly
ad
vers
e to
sl
ight
ly
bene
ficia
l ef
fect
s on
aq
uatic
ha
bita
t
Slig
htly
ad
vers
e to
sl
ight
ly
bene
ficia
l ef
fect
s on
aq
uatic
hab
itat
Slig
htly
be
nefic
ial
effe
cts
on
aqua
tic
habi
tat
Adve
rse
to
slig
htly
be
nefic
ial
effe
cts
on
aqua
tic
habi
tat
No
chan
ge
to a
dver
se
effe
cts
on
aqua
tic
habi
tat
Slig
htly
ad
vers
e to
sl
ight
ly
bene
ficia
l ef
fect
s on
aq
uatic
ha
bita
t
Eros
ion
of re
serv
oir
shor
elin
e an
d ta
ilwat
er
river
bank
s
No
chan
ge
Slig
htly
in
crea
sed
eros
ion
Slig
htly
in
crea
sed
eros
ion
No
chan
ge
to s
light
ly
redu
ced
eros
ion
No
chan
ge to
sl
ight
ly
redu
ced
eros
ion
No
chan
ge
Slig
htly
in
crea
sed
eros
ion
Slig
htly
in
crea
sed
to
incr
ease
d er
osio
n
Slig
htly
in
crea
sed
eros
ion
Thre
aten
ed a
nd
enda
nger
ed s
peci
es
No
chan
ge
No
chan
ge
to s
light
ly
adve
rse
effe
cts
No
chan
ge
to s
light
ly
adve
rse
effe
cts
Adve
rse
effe
cts
No
chan
ge to
sl
ight
ly
bene
ficia
l ef
fect
s
No
chan
ge
to s
light
ly
bene
ficia
l ef
fect
s
No
chan
ge
to s
light
ly
adve
rse
effe
cts
Bene
ficia
l to
slig
htly
ad
vers
e ef
fect
s
Slig
htly
ad
vers
e to
sl
ight
ly
bene
ficia
l ef
fect
s
Wet
land
s an
d ot
her
ecol
ogic
ally
sen
sitiv
e
area
s
No
chan
ge
Slig
htly
ad
vers
e to
sl
ight
ly
bene
ficia
l ef
fect
s
Adve
rse
to
slig
htly
be
nefic
ial
effe
cts
Subs
tan-
tially
ad
vers
e ef
fect
s
Adve
rse
to
subs
tant
ially
ad
vers
e ef
fect
s
No
chan
ge
Slig
htly
ad
vers
e to
sl
ight
ly
bene
ficia
l ef
fect
s
Slig
htly
ad
vers
e to
sl
ight
ly
bene
ficia
l ef
fect
s
Slig
htly
ad
vers
e to
sl
ight
ly
bene
ficia
l ef
fect
s
Scen
ic b
eaut
y of
re
serv
oirs
N
o ch
ange
Im
prov
ed
Subs
tant
ially
im
prov
ed
Red
uced
Sl
ight
ly
redu
ced
Slig
htly
im
prov
ed
Subs
tant
ially
im
prov
ed
Subs
tant
ially
im
prov
ed
Impr
oved
Not
es:
1
Milli
ons
of d
olla
rs a
nnua
lly.
2 C
hang
es in
recr
eatio
nal e
xpen
ditu
res
from
out
side
the
TVA
regi
on in
milli
ons
of d
olla
rs a
nnua
lly fo
r the
yea
r 201
0 in
200
2 do
llars
(per
cent
cha
nge
from
Bas
e C
ase
for 2
010
in
2002
dol
lars
). 3
Cha
nge
in s
hipp
ing
cost
s in
milli
ons
of d
olla
rs a
nnua
lly (p
erce
nt c
hang
e fro
m B
ase
Cas
e fo
r 201
0 in
200
2 do
llars
).
4 C
ost i
n m
illion
s of
dol
lars
(200
2 do
llars
) to
mod
ify in
take
s on
rese
rvoi
rs w
ith p
ool l
evel
s be
low
TVA
-pub
lishe
d m
inim
um e
leva
tions
. 5
Tota
l rec
reat
ion
use
in u
ser d
ays
(per
cent
cha
nge
from
Bas
e C
ase
in u
ser d
ays)
.
Executive Summary
ES-16 Tennessee Valley Authority Reservoir Operations Study − Final Programmatic EIS
Tables ES-02 and ES-03 present different but closely related information. Table ES-02 focuses on the specific objectives identified by the public. Table ES-03 summarizes the results of technical analyses of the 24 resource areas by specialists, using more detailed metrics, modeling, and analysis. Table ES-02 is not derived directly from the more detailed results presented in Table ES-03.
Reservoir Recreation Alternative AReservoir Recreation Alternative BTailwater Recreation AlternativeTailwater Habitat Alternative
These alternatives are similar in that they would produce benefits for recreational use of the reservoirs, substantially increased visual quality, and other beneficial resource improvements. However, these alternatives would also result in water quality impacts that would affect some aquatic resources, increase erosion and related impacts on cultural resources, and adversely affect the treatment of water supply. As a group, they represent a mixed set of impacts on environmental resources.
This group of alternatives would change, to various degrees, reservoir levels and flows through the reservoir system and their seasonal timing. These are the major factors driving the level of beneficial or adverse impacts on aquatic systems, wetland systems, and shoreline conditions, and the frequency and duration of thermal plant derates. Higher reservoir levels and reduced flows through the system would result in a suite of adverse and beneficial changes to the reservoir system. These would include some complex, inter-connected changes in the environment.
Holding summer pool levels higher later into summer and fall would result in increased thermal stratification in some reservoirs and in decreased water quality, low DO conditions, and anoxia—depending on the reservoir. Decreased water quality would adversely affect some aquatic resources and, at specific locations, threatened and endangered species. It would be costly to mitigate the water quality impacts resulting in low DO in project releases, and some impacts may be unavoidable.
Within this group of alternatives, Reservoir Recreation Alternative B, Tailwater Recreation Alternative, and the Tailwater Habitat Alternative would result in the most adverse impact on water quality because they would maintain summer pool levels longer and/or reduce flow through the system in summer to a greater extent. Reservoir Recreation Alternative A would achieve recreational and aesthetic benefits without the more substantial water quality impacts that accompany the other alternatives in this group. Maintaining summer pool levels longer would result in greater potential for shoreline erosion, with associated adverse effects on cultural resources and some shoreline habitats. Under all these alternatives, increased erosion would occur; erosion would be greatest under the Tailwater Habitat Alternative. Impacts on cultural resources under these alternatives would be slightly adverse to substantially adverse.
The alternatives in this group would result in variable and adverse impacts on wetlands overall because they would change the timing of inundation of various wetland, lowland, and shallow-water habitats.
Executive Summary
Tennessee Valley Authority ES-17 Reservoir Operations Study − Final Programmatic EIS
Summer Hydropower Alternative and Equalized Summer/Winter Flood Risk Alternative
These alternatives are similar in the fact that they would produce few beneficial or substantially beneficial environmental resource impacts overall within the TVA reservoir system but would result in a number of substantially adverse environmental effects. The Equalized Summer/Winter Flood Risk Alternative would produce benefits for private recreational use of the reservoirs but little change is projected for public and commercial recreation use. It would have slightly adverse impacts on scenic integrity. The Summer Hydropower Alternative would produce substantially adverse impacts on private recreational use of the reservoirs and slightly adverse impacts on public and commercial recreation use. It would have adverse impacts on scenic integrity.
A suite of environmental resources would be adversely affected, especially under the Summer Hydropower Alternative. Both the Summer Hydropower Alternative and the Equalized Summer/Winter Flood Risk Alternative would result in substantial impacts on wetland resources. The Summer Hydropower Alternative would result in additional adverse environmental impacts on water quality in some tributary reservoirs, adverse impacts on several threatened and endangered species, and water supply withdrawal structures and pumping costs.
Base Case and Commercial Navigation Alternative
These alternatives are similar in the fact that they would produce few changes in the balance of beneficial or substantially beneficial impacts overall within the TVA system but also would result in fewer adverse environmental effects than the other alternatives. The Commercial Navigation Alternative would increase shipper savings, result in some slightly adverse impacts on wetland plant communities, terrestrial ecology (use of flats and some bottomland hardwood wetlands), and cultural resources. In general, the Commercial Navigation Alternative would not result in any adverse effects on protected species and would provide beneficial effects on summer water temperatures, minimum mainstem water levels, and increased stability of wetland habitats in comparison to the Base Case.
Preferred Alternative
After extensive public review of the DEIS and additional analyses, TVA developed a Preferred Alternative. This alternative combines and adjusts elements of the alternatives identified in the DEIS to preserve desirable characteristics and to avoid or reduce adverse impacts associated with those alternatives. The Preferred Alternative establishes a balance of reservoir system operating objectives that is more responsive to public values expressed during the ROS and consistent with the operating priorities established by the TVA Act. Adjusting project flood guides and delaying the complete filling of upper mainstem projects until May 15 would reduce potential flood damage compared to all other alternatives except the Base Case. Based on computer simulations, the Preferred Alternative would not result in increased flood damages associated with flood events up to a 500-year magnitude at any critical location within the Tennessee Valley, including Chattanooga. A flood event with a 500-year magnitude has a 1 in 500 chance of happening in any given year. Resolving flood risk issues was a central

Executive Summary
ES-18 Tennessee Valley Authority Reservoir Operations Study − Final Programmatic EIS
component in formulating the Preferred Alternative because reducing flood damage is one of the most valuable benefits provided by the system. Except for the Base Case, all of the alternatives evaluated in the DEIS would result in unacceptable increases in the risk of flooding at one or more critical locations. The Preferred Alternative would also provide a more equitable way of balancing pool levels among the tributary reservoirs, increase the minimum depth of the Tennessee River navigation channel at two locations, and maintain power system reliability while lessening impacts on delivered cost of power.
Under the Preferred Alternative, providing a longer duration of higher pool levels during summer (June 1 through Labor Day) would result in a beneficial increase in recreational opportunities and use of the reservoirs and tailwaters. Substantial beneficial increase in user days is anticipated for private access sites, with a slightly beneficial increase in public user days. It would also provide for more reliable recreational releases. Less fluctuation and longer duration of higher pool elevations on tributary reservoirs would substantially increase the scenic integrity of the reservoir system. The resulting reservoir pool elevations would produce slightly adverse impacts on shoreline erosion and associated slightly adverse effects on cultural resources.
Under the Preferred Alternative, reservoir pool levels would be maintained in a manner that continues to support wetlands extent, distribution, and habitat connectivity at levels similar to conditions under the Base Case. The Preferred Alternative would reduce some of the adverse impacts on flats, scrub/shrub, and forested wetlands that are associated with water levels being held too long during the growing season, and would ensure timely seasonal exposure of flats habitats important to migratory shorebirds and waterfowl at some of the more important mainstem reservoirs. However, it would result in slightly adverse impacts on certain wetland types and locations. In some cases, impacts may vary from year to year—depending on the reservoir, annual rainfall conditions, and other factors. The Preferred Alternative would result in slightly adverse effects on some protected species that occur in wetland habitats on most reservoirs, but would result in effects similar to the Base Case with regard to protected species on Kentucky Reservoir.
Compared to the Base Case, higher system flows would be required under the Preferred Alternative June through Labor Day when the volume of water in storage is above the system MOG. During normal operations in this period, weekly average system flows would not be higher than these minimum requirements to maintain pool levels as close as possible to the flood guides on 10 tributary reservoirs. Therefore, actual flows would be lower most of the time during this period. The Preferred Alternative would have little effect on water quality in tributary reservoirs. Effects would vary among mainstem reservoirs—some would have volumes of low DO water similar to the Base Case and others a substantially larger volume. Effects on water quality would be slightly adverse. The Preferred Alternative would maintain tailwater minimum flows and DO targets while reducing impacts on reservoir water quality, as compared to some of the other alternatives that hold summer pool levels longer, and would provide for more balanced tributary reservoir levels across the system.
Executive Summary
Tennessee Valley Authority ES-19 Reservoir Operations Study − Final Programmatic EIS
ES.9.3 Regional Economic Effects
The geographic scope of this study consists of the 201-county area bounded by the TVA Power Service Area and the Tennessee River Watershed. In 2000, the ROS area population was 9.2 million, total employment was 5.4 million jobs, total personal income was $235 billion, and gross regional product (GRP) was $275 billion (2002 dollars). The region attained these levels after strong growth over the 1990s, outpacing national economic growth. Gross regional product, population, employment, and income in the region grew at a faster rate than their national counterparts during the same period.
Under the Base Case, regional economic growth is projected to continue to outpace national economic growth over the rest of the decade. Overall, the region is projected to experience a GRP increase of 3.2 percent per year, compared to 3.0 percent nationally, from 2000 to 2010. Total employment is forecasted to grow at 1.2 percent while increasing at 1.0 percent nationally. With this job growth and with the region remaining a desirable place to live, regional population is also expected to continue to outpace national growth, increasing at 1.1 percent per year versus 1.0 percent for the nation.
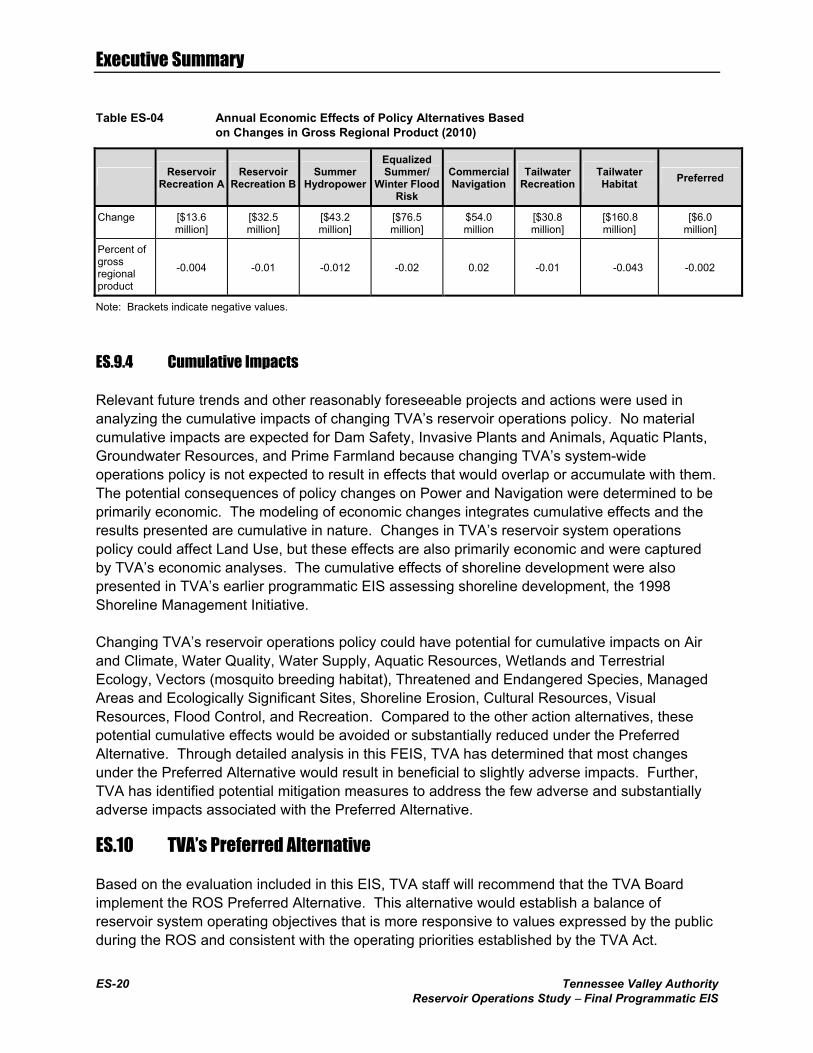
To determine the economic effects of an alternative reservoir operations policy as compared to the Base Case, TVA evaluated several economic parameters. This evaluation integrated changes to the cost of power, revenues from recreation, shipper savings from river transportation, cost of municipal water supplies, and changes in property values into a measure of overall effects on the regional economy. Table ES-04 shows the effect of each of the reservoir operations policy alternatives as measured by change (from the Base Case) in the GRP, which is the sum dollar value of all goods and services in the economy that is commonly used as a broad measure of economic activity. The GRP includes direct economic effects, such as changes in power costs, and also includes the ripple effect of changed power costs on other economic sectors.
As measured by the GRP, only the Commercial Navigation Alternative is expected to positively affect the regional economy. All other action alternatives are expected to result in a negative regional economic effect. The actual magnitude of these effects, either negative or positive, would be small as a percent of the GRP. Effects for 2010 are shown in Table ES-04. The impacts for 2010 represent the effects after changes to the operations policy have been absorbed into the regional economy.
Executive Summary
ES-20 Tennessee Valley Authority Reservoir Operations Study − Final Programmatic EIS
Table ES-04 Annual Economic Effects of Policy Alternatives Based on Changes in Gross Regional Product (2010)
Reservoir Recreation A
Reservoir Recreation B
Summer Hydropower
Equalized Summer/
Winter Flood Risk
Commercial Navigation
Tailwater Recreation
Tailwater Habitat Preferred
Change [$13.6 million]
[$32.5 million]
[$43.2 million]
[$76.5 million]
$54.0 million
[$30.8 million]
[$160.8 million]
[$6.0 million]
Percent of gross regional product
-0.004 -0.01 -0.012 -0.02 0.02 -0.01 -0.043 -0.002
Note: Brackets indicate negative values.
ES.9.4 Cumulative Impacts
Relevant future trends and other reasonably foreseeable projects and actions were used in analyzing the cumulative impacts of changing TVA’s reservoir operations policy. No material cumulative impacts are expected for Dam Safety, Invasive Plants and Animals, Aquatic Plants, Groundwater Resources, and Prime Farmland because changing TVA’s system-wide operations policy is not expected to result in effects that would overlap or accumulate with them. The potential consequences of policy changes on Power and Navigation were determined to be primarily economic. The modeling of economic changes integrates cumulative effects and the results presented are cumulative in nature. Changes in TVA’s reservoir system operations policy could affect Land Use, but these effects are also primarily economic and were captured by TVA’s economic analyses. The cumulative effects of shoreline development were also presented in TVA’s earlier programmatic EIS assessing shoreline development, the 1998 Shoreline Management Initiative.
Changing TVA’s reservoir operations policy could have potential for cumulative impacts on Air and Climate, Water Quality, Water Supply, Aquatic Resources, Wetlands and Terrestrial Ecology, Vectors (mosquito breeding habitat), Threatened and Endangered Species, Managed Areas and Ecologically Significant Sites, Shoreline Erosion, Cultural Resources, Visual Resources, Flood Control, and Recreation. Compared to the other action alternatives, these potential cumulative effects would be avoided or substantially reduced under the Preferred Alternative. Through detailed analysis in this FEIS, TVA has determined that most changes under the Preferred Alternative would result in beneficial to slightly adverse impacts. Further, TVA has identified potential mitigation measures to address the few adverse and substantially adverse impacts associated with the Preferred Alternative.
ES.10 TVA’s Preferred Alternative
Based on the evaluation included in this EIS, TVA staff will recommend that the TVA Board implement the ROS Preferred Alternative. This alternative would establish a balance of reservoir system operating objectives that is more responsive to values expressed by the public during the ROS and consistent with the operating priorities established by the TVA Act.
Executive Summary
Tennessee Valley Authority ES-21 Reservoir Operations Study − Final Programmatic EIS
The Preferred Alternative would increase reservoir and tailwater recreation opportunities and visual quality. Based on computer simulations, the Preferred Alternative would not result in increased flood damage associated with flood events up to a 500-year magnitude at any critical location within the Tennessee Valley, including Chattanooga. A flood event with a 500-year magnitude has a 1 in 500 chance of happening in any given year. The Preferred Alternative would provide a more equitable way of balancing pool levels among tributary reservoirs. The Preferred Alternative would increase the minimum depth of the Tennessee River navigation channel at two locations and would maintain power system reliability while lessening impacts on the delivered cost of power compared to other alternatives.
The Preferred Alternative would maintain tailwater minimum flows and DO targets. Additionally, it would lessen impacts on reservoir water quality, as well as shoreline erosion and its associated adverse effects on cultural resources and some shoreline habitats—as compared to Reservoir Recreation Alternative A, Reservoir Recreation Alternative B, the Tailwater Recreation Alternative, and the Tailwater Habitat Alternative. Responding to flood control, wetland, and wildlife concerns expressed by the USACE, the USFWS, state agencies, and some members of the public, no changes in seasonal water levels on Kentucky Reservoir were included in the Preferred Alternative.
Once the formulation of the Preferred Alternative was complete, TVA initiated consultations on this proposed action with the USFWS regarding the Endangered Species Act and with the seven State Historic Preservation Officers regarding the National Historic Preservation Act. Results of the Endangered Species Act consultation (presented in Appendix G) indicate that adoption of the Preferred Alternative would not jeopardize the continued existence of any listed or candidate federal threatened or endangered species. The National Historic Preservation Act consultations resulted in development of a Programmatic Agreement (presented in Appendix H) that covers the identification and protection or mitigation of historic properties that could be affected by adoption of the Preferred Alternative.
ES.11 Potential Mitigation Measures
A mix of monitoring and adaptive response is an important component of TVA’s programmatic approach to mitigating potentially adverse to substantially adverse impacts under the Preferred Alternative. TVA would continue its existing monitoring activities under its Reservoir Release Improvement and Vital Signs Monitoring Programs to look for water quality and ecological changes; with additional DO and temperature sampling at selected tailwater locations as determined by Vital Signs monitoring. A Wetlands Monitoring Program would be established to determine whether shifts of wetland plant communities occur as a result of extended water levels. TVA would extend the existing Vector Monitoring Program to identify any increase in the number of days that reservoir mosquito breeding habitat exists due to the extended time the mainstem reservoirs are held up.
If analysis or monitoring indicates that DO concentrations are declining below DO target levels, TVA would upgrade aeration equipment and operations at appropriate locations as necessary to meet the DO target levels established by the Lake Improvement Plan. This could include

Executive Summary
ES-22 Tennessee Valley Authority Reservoir Operations Study − Final Programmatic EIS
increased oxygenation, upgrading existing equipment, or installing additional equipment. Such measures would be initiated and completed within 1 year at Watts Bar and within 3 years at other locations where established targets are not being met. If holding mainstem reservoir levels up longer increases the number of days that reservoir mosquito breeding habitat exists TVA would extend the duration of reservoir level fluctuations for mosquito control.
Tennessee Valley Authority ES-23Reservoir Operations Study − Final Programmatic EIS
Tabl
e ES
-03
Sum
mar
y of
Impa
cts
by P
olic
y A
ltern
ativ
e
Alte
rnat
ive
Res
ourc
e Ar
ea
Bas
e C
ase
Res
ervo
ir R
ecre
atio
n A
Res
ervo
ir R
ecre
atio
n B
Su
mm
er
Hyd
ropo
wer
Eq
ualiz
ed
Sum
mer
/ Win
ter
Floo
d R
isk
Com
mer
cial
N
avig
atio
n Ta
ilwat
er
Rec
reat
ion
Tailw
ater
H
abita
t Pr
efer
red
Air R
esou
rces
Air e
mis
sion
s
No
chan
ge in
pr
ojec
ted
annu
al
emis
sion
s (in
to
ns) o
f abo
ut
469,
000
SO2,
202,
000
NO
x, 13
,000
pa
rticu
late
s,
10,0
00 C
O,
1,20
0 VO
Cs,
an
d 1.
6 H
g
Slig
htly
be
nefic
ial
Slig
htly
ad
vers
e Sl
ight
ly
adve
rse
Sl
ight
ly
adve
rse
No
chan
ge
Slig
htly
ad
vers
e
Bene
ficia
l (D
ue to
non
-em
issi
on
gene
ratio
n)
No
chan
ge to
sl
ight
ly
adve
rse
Clim
ate
Gre
enho
use
emis
sion
s
No
chan
ge in
pr
ojec
ted
annu
al
emis
sion
of
106.
5 m
illion
to
ns C
O2
Slig
htly
be
nefic
ial
Slig
htly
ad
vers
e Sl
ight
ly
adve
rse
Slig
htly
ad
vers
e Sl
ight
ly
bene
ficia
l Sl
ight
ly
adve
rse
Bene
ficia
l (D
ecre
ase
of
alm
ost
2 m
illion
tons
in
ann
ual C
O2
emis
sion
s)
Slig
htly
be
nefic
ial
Wat
er Q
ualit
y
Assi
mila
tive
capa
city
–
stor
age
tribu
tarie
s
No
chan
ge in
vo
lum
e of
w
ater
to
assi
mila
te
oxyg
en-
dem
andi
ng
was
te
Slig
htly
be
nefic
ial
Slig
htly
be
nefic
ial
No
chan
ge to
sl
ight
ly
adve
rse
No
chan
ge to
sl
ight
ly a
dver
se
No
chan
ge
Slig
htly
be
nefic
ial
Slig
htly
be
nefic
ial
(Effe
cts
vary
am
ong
rese
rvoi
rs)
Slig
htly
be
nefic
ial
Assi
mila
tive
capa
city
–
trans
ition
al
tribu
tarie
s 1
No
chan
ge in
vo
lum
e of
w
ater
to
assi
mila
te
oxyg
en-
dem
andi
ng
was
te
No
chan
ge to
sl
ight
ly
adve
rse
N
o ch
ange
N
o ch
ange
to
slig
htly
ad
vers
e
Slig
htly
ad
vers
e N
o ch
ange
N
o ch
ange
N
o ch
ange
to
slig
htly
ad
vers
e
No
chan
ge
ES-24 Tennessee Valley Authority Reservoir Operations Study − Final Programmatic EIS
Tabl
e ES
-03
Sum
mar
y of
Impa
cts
by P
olic
y A
ltern
ativ
e (c
ontin
ued)
Alte
rnat
ive
Res
ourc
e Ar
ea
Bas
e C
ase
Res
ervo
ir R
ecre
atio
n A
Res
ervo
ir R
ecre
atio
n B
Su
mm
er
Hyd
ropo
wer
Eq
ualiz
ed
Sum
mer
/ Win
ter
Floo
d R
isk
Com
mer
cial
N
avig
atio
n Ta
ilwat
er
Rec
reat
ion
Tailw
ater
H
abita
t Pr
efer
red
Wat
er Q
ualit
y (c
ontin
ued)
Assi
mila
tive
capa
city
–m
ains
tem
rese
rvoi
rs
No
chan
ge in
vo
lum
e of
w
ater
to
assi
mila
te
oxyg
en-
dem
andi
ng
was
te
No
chan
ge.
No
chan
ge
No
chan
ge to
sl
ight
ly
adve
rse
No
chan
ge
No
chan
ge
No
chan
ge
No
chan
ge
No
chan
ge
Anox
ia –
sto
rage
tri
buta
ries
No
chan
ge in
vo
lum
e of
w
ater
with
DO
co
ncen
tratio
n le
ss th
an
1mg/
L
Slig
htly
ad
vers
e
Slig
htly
ad
vers
e
Slig
htly
be
nefic
ial
Slig
htly
be
nefic
ial
(Effe
cts
vary
am
ong
rese
rvoi
rs)
No
chan
ge
No
chan
ge to
ad
vers
e (In
crea
se in
vo
lum
e of
w
ater
with
DO
co
ncen
tratio
n le
ss th
an
1mg/
L)
Adve
rse
(Incr
ease
in
volu
me
of
wat
er w
ith D
O
conc
entra
tion
less
than
1m
g/L)
No
chan
ge
Anox
ia –
tran
sitio
nal
tribu
tarie
s
No
chan
ge in
vo
lum
e of
w
ater
with
DO
co
ncen
tratio
n le
ss th
an
1mg/
L
Slig
htly
ad
vers
e
Slig
htly
ad
vers
e
Slig
htly
ad
vers
e
Slig
htly
adv
erse
N
o ch
ange
to
slig
htly
adv
erse
Slig
htly
ad
vers
e to
sl
ight
ly
bene
ficia
l (E
ffect
s va
ry
amon
g re
serv
oirs
)
No
chan
ge to
sl
ight
ly
adve
rse
(Effe
cts
vary
am
ong
rese
rvoi
rs)
Slig
htly
ad
vers
e to
sl
ight
ly
bene
ficia
l (E
ffect
s va
ry
amon
g re
serv
oirs
)
Anox
ia –
mai
nste
m
rese
rvoi
rs
No
chan
ge in
vo
lum
e of
w
ater
with
DO
co
ncen
tratio
n le
ss th
an
1mg/
L
Adve
rse
(Incr
ease
in
volu
me
of
wat
er w
ith D
O
conc
entra
tion
less
than
1m
g/L)
Subs
tant
ially
ad
vers
e (S
ubst
antia
l in
crea
se in
vo
lum
e of
w
ater
with
DO
co
ncen
tratio
n le
ss th
an
1mg/
L)
Subs
tant
ially
be
nefic
ial
(Sub
stan
tial
decr
ease
in
volu
me
of
wat
er w
ith D
O
conc
entra
tion
less
than
1m
g/L)
Adve
rse
to
subs
tant
ially
ad
vers
e (S
ubst
antia
l in
crea
se in
vo
lum
e of
wat
er
with
DO
co
ncen
tratio
n le
ss th
an 1
mg/
L fo
r som
e m
ains
tem
re
serv
oirs
)
Slig
htly
be
nefic
ial
Subs
tant
ially
ad
vers
e (S
ubst
antia
l in
crea
se in
vo
lum
e of
w
ater
with
DO
co
ncen
tratio
n le
ss th
an
1mg/
L fo
r mos
t m
ains
tem
re
serv
oirs
)
Adve
rse
to
subs
tant
ially
ad
vers
e (S
ubst
antia
l in
crea
se in
vo
lum
e of
w
ater
with
DO
co
ncen
tratio
n le
ss th
an
1mg/
L fo
r so
me
mai
nste
m
rese
rvoi
rs)
Slig
htly
ad
vers
e
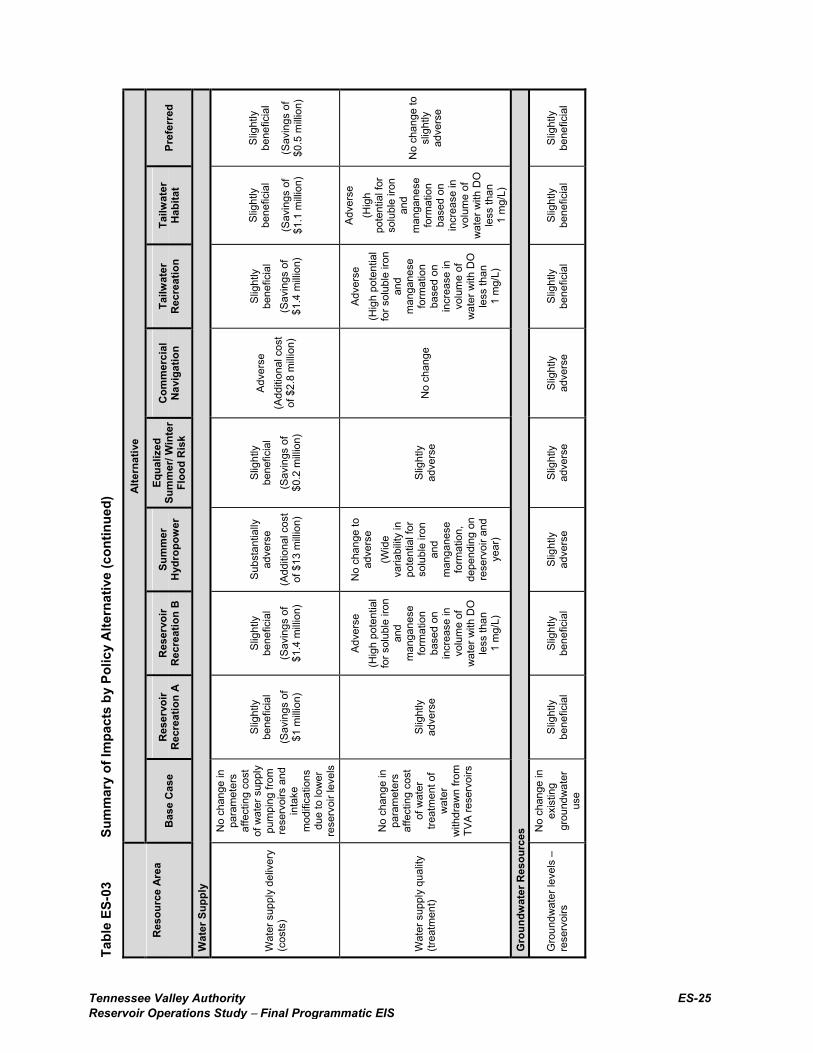
Tennessee Valley Authority ES-25Reservoir Operations Study − Final Programmatic EIS
Tabl
e ES
-03
Sum
mar
y of
Impa
cts
by P
olic
y A
ltern
ativ
e (c
ontin
ued)
Alte
rnat
ive
Res
ourc
e Ar
ea
Bas
e C
ase
Res
ervo
ir R
ecre
atio
n A
Res
ervo
ir R
ecre
atio
n B
Su
mm
er
Hyd
ropo
wer
Eq
ualiz
ed
Sum
mer
/ Win
ter
Floo
d R
isk
Com
mer
cial
N
avig
atio
n Ta
ilwat
er
Rec
reat
ion
Tailw
ater
H
abita
t Pr
efer
red
Wat
er S
uppl
y
Wat
er s
uppl
y de
liver
y (c
osts
)
No
chan
ge in
pa
ram
eter
s af
fect
ing
cost
of
wat
er s
uppl
y pu
mpi
ng fr
om
rese
rvoi
rs a
nd
inta
ke
mod
ifica
tions
du
e to
low
er
rese
rvoi
r lev
els
Slig
htly
be
nefic
ial
(Sav
ings
of
$1 m
illion
)
Slig
htly
be
nefic
ial
(Sav
ings
of
$1.4
milli
on)
Subs
tant
ially
ad
vers
e
(Add
ition
al c
ost
of $
13 m
illion
)
Slig
htly
be
nefic
ial
(Sav
ings
of
$0.2
milli
on)
Adve
rse
(Add
ition
al c
ost
of $
2.8
milli
on)
Slig
htly
be
nefic
ial
(Sav
ings
of
$1.4
milli
on)
Slig
htly
be
nefic
ial
(Sav
ings
of
$1.1
milli
on)
Slig
htly
be
nefic
ial
(Sav
ings
of
$0.5
milli
on)
Wat
er s
uppl
y qu
ality
(tr
eatm
ent)
No
chan
ge in
pa
ram
eter
s af
fect
ing
cost
of
wat
er
treat
men
t of
wat
er
with
draw
n fro
m
TVA
rese
rvoi
rs
Slig
htly
ad
vers
e
Adve
rse
(Hig
h po
tent
ial
for s
olub
le ir
on
and
man
gane
se
form
atio
n ba
sed
on
incr
ease
in
volu
me
of
wat
er w
ith D
O
less
than
1
mg/
L)
No
chan
ge to
ad
vers
e (W
ide
varia
bilit
y in
po
tent
ial f
or
solu
ble
iron
and
man
gane
se
form
atio
n,
depe
ndin
g on
re
serv
oir a
nd
year
)
Slig
htly
ad
vers
e
No
chan
ge
Adve
rse
(Hig
h po
tent
ial
for s
olub
le ir
on
and
man
gane
se
form
atio
n ba
sed
on
incr
ease
in
volu
me
of
wat
er w
ith D
O
less
than
1
mg/
L)
Adve
rse
(H
igh
pote
ntia
l for
so
lubl
e iro
n an
d m
anga
nese
fo
rmat
ion
base
d on
in
crea
se in
vo
lum
e of
w
ater
with
DO
le
ss th
an
1 m
g/L)
No
chan
ge to
sl
ight
ly
adve
rse
Gro
undw
ater
Res
ourc
es
Gro
undw
ater
leve
ls –
re
serv
oirs
No
chan
ge in
ex
istin
g gr
ound
wat
er
use
Slig
htly
be
nefic
ial
Slig
htly
be
nefic
ial
Slig
htly
ad
vers
e Sl
ight
ly
adve
rse
Slig
htly
ad
vers
e Sl
ight
ly
bene
ficia
l Sl
ight
ly
bene
ficia
l Sl
ight
ly
bene
ficia
l
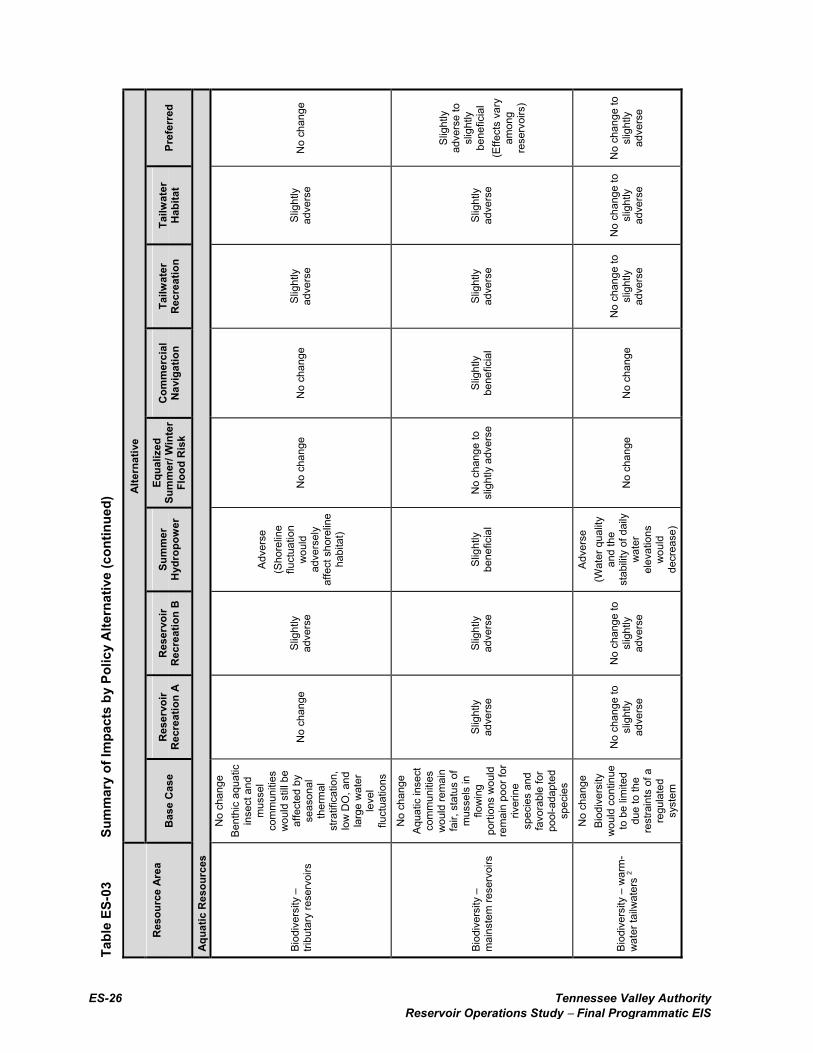
ES-26 Tennessee Valley Authority Reservoir Operations Study − Final Programmatic EIS
Tabl
e ES
-03
Sum
mar
y of
Impa
cts
by P
olic
y A
ltern
ativ
e (c
ontin
ued)
Alte
rnat
ive
Res
ourc
e Ar
ea
Bas
e C
ase
Res
ervo
ir R
ecre
atio
n A
Res
ervo
ir R
ecre
atio
n B
Su
mm
er
Hyd
ropo
wer
Eq
ualiz
ed
Sum
mer
/ Win
ter
Floo
d R
isk
Com
mer
cial
N
avig
atio
n Ta
ilwat
er
Rec
reat
ion
Tailw
ater
H
abita
t Pr
efer
red
Aqua
tic R
esou
rces
Biod
iver
sity
–
tribu
tary
rese
rvoi
rs
No
chan
ge
Bent
hic
aqua
tic
inse
ct a
nd
mus
sel
com
mun
ities
w
ould
stil
l be
affe
cted
by
seas
onal
th
erm
al
stra
tific
atio
n,
low
DO
, and
la
rge
wat
er
leve
l flu
ctua
tions
No
chan
ge
Slig
htly
ad
vers
e
Adve
rse
(Sho
relin
e flu
ctua
tion
wou
ld
adve
rsel
y af
fect
sho
relin
e ha
bita
t)
No
chan
ge
No
chan
ge
Slig
htly
ad
vers
e Sl
ight
ly
adve
rse
No
chan
ge
Biod
iver
sity
–
mai
nste
m re
serv
oirs
No
chan
ge
Aqua
tic in
sect
co
mm
uniti
es
wou
ld re
mai
n fa
ir, s
tatu
s of
m
usse
ls in
flo
win
g po
rtion
s w
ould
re
mai
n po
or fo
r riv
erin
e sp
ecie
s an
d fa
vora
ble
for
pool
-ada
pted
sp
ecie
s
Slig
htly
ad
vers
e Sl
ight
ly
adve
rse
Slig
htly
be
nefic
ial
No
chan
ge to
sl
ight
ly a
dver
se
Slig
htly
be
nefic
ial
Slig
htly
ad
vers
e Sl
ight
ly
adve
rse
Slig
htly
ad
vers
e to
sl
ight
ly
bene
ficia
l (E
ffect
s va
ry
amon
g re
serv
oirs
)
Biod
iver
sity
– w
arm
-w
ater
tailw
ater
s 2
No
chan
ge
Biod
iver
sity
w
ould
con
tinue
to
be
limite
d du
e to
the
rest
rain
ts o
f a
regu
late
d sy
stem
No
chan
ge to
sl
ight
ly
adve
rse
No
chan
ge to
sl
ight
ly
adve
rse
Adve
rse
(Wat
er q
ualit
y an
d th
e st
abilit
y of
dai
ly
wat
er
elev
atio
ns
wou
ld
decr
ease
)
No
chan
ge
No
chan
ge
No
chan
ge to
sl
ight
ly
adve
rse
No
chan
ge to
sl
ight
ly
adve
rse
No
chan
ge to
sl
ight
ly
adve
rse
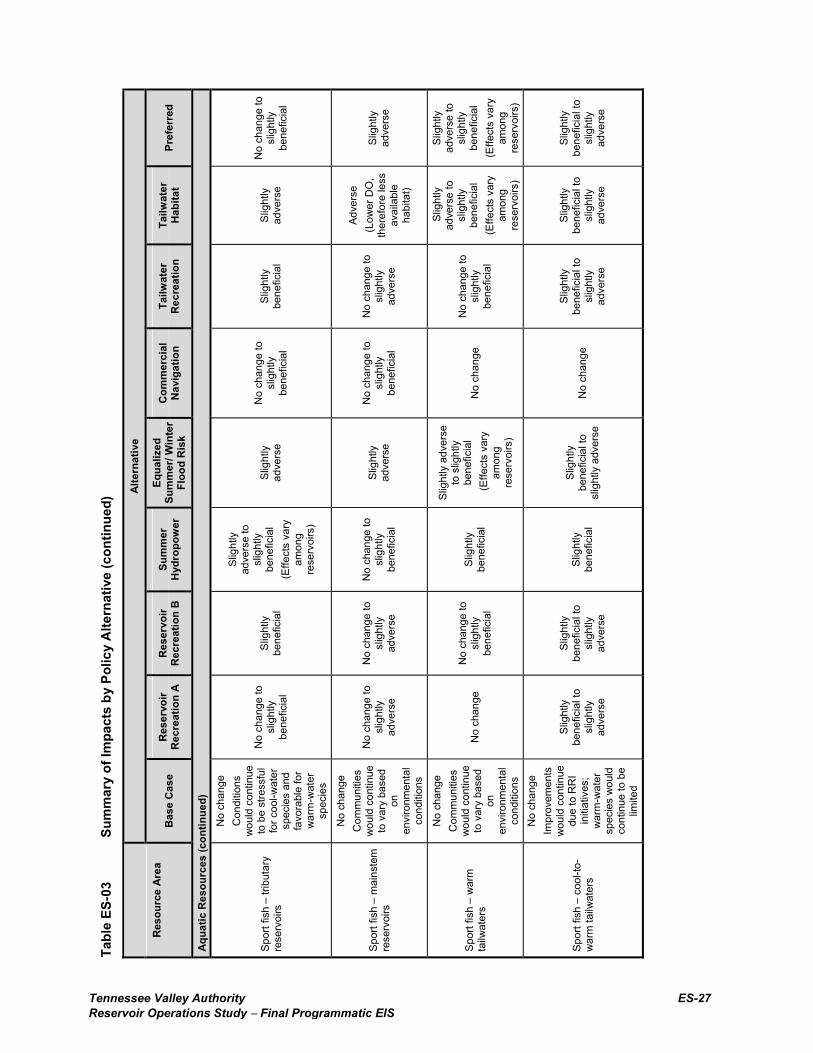
Tennessee Valley Authority ES-27Reservoir Operations Study − Final Programmatic EIS
Tabl
e ES
-03
Sum
mar
y of
Impa
cts
by P
olic
y A
ltern
ativ
e (c
ontin
ued)
Alte
rnat
ive
Res
ourc
e Ar
ea
Bas
e C
ase
Res
ervo
ir R
ecre
atio
n A
Res
ervo
ir R
ecre
atio
n B
Su
mm
er
Hyd
ropo
wer
Eq
ualiz
ed
Sum
mer
/ Win
ter
Floo
d R
isk
Com
mer
cial
N
avig
atio
n Ta
ilwat
er
Rec
reat
ion
Tailw
ater
H
abita
t Pr
efer
red
Aqua
tic R
esou
rces
(con
tinue
d)
Spor
t fis
h –
tribu
tary
re
serv
oirs
No
chan
ge
Con
ditio
ns
wou
ld c
ontin
ue
to b
e st
ress
ful
for c
ool-w
ater
sp
ecie
s an
d fa
vora
ble
for
war
m-w
ater
sp
ecie
s
No
chan
ge to
sl
ight
ly
bene
ficia
l
Slig
htly
be
nefic
ial
Slig
htly
ad
vers
e to
sl
ight
ly
bene
ficia
l (E
ffect
s va
ry
amon
g re
serv
oirs
)
Slig
htly
ad
vers
e
No
chan
ge to
sl
ight
ly
bene
ficia
l
Slig
htly
be
nefic
ial
Slig
htly
ad
vers
e
No
chan
ge to
sl
ight
ly
bene
ficia
l
Spor
t fis
h –
mai
nste
m
rese
rvoi
rs
No
chan
ge
Com
mun
ities
w
ould
con
tinue
to
var
y ba
sed
on
envi
ronm
enta
l co
nditi
ons
No
chan
ge to
sl
ight
ly
adve
rse
No
chan
ge to
sl
ight
ly
adve
rse
No
chan
ge to
sl
ight
ly
bene
ficia
l
Slig
htly
ad
vers
e
No
chan
ge to
sl
ight
ly
bene
ficia
l
No
chan
ge to
sl
ight
ly
adve
rse
Adve
rse
(Low
er D
O,
ther
efor
e le
ss
avai
labl
e ha
bita
t)
Slig
htly
ad
vers
e
Spor
t fis
h –
war
m
tailw
ater
s
No
chan
ge
Com
mun
ities
w
ould
con
tinue
to
var
y ba
sed
on
envi
ronm
enta
l co
nditi
ons
No
chan
ge
No
chan
ge to
sl
ight
ly
bene
ficia
l
Slig
htly
be
nefic
ial
Slig
htly
adv
erse
to
slig
htly
be
nefic
ial
(Effe
cts
vary
am
ong
rese
rvoi
rs)
No
chan
ge
No
chan
ge to
sl
ight
ly
bene
ficia
l
Slig
htly
ad
vers
e to
sl
ight
ly
bene
ficia
l (E
ffect
s va
ry
amon
g re
serv
oirs
)
Slig
htly
ad
vers
e to
sl
ight
ly
bene
ficia
l (E
ffect
s va
ry
amon
g re
serv
oirs
)
Spor
t fis
h –
cool
-to-
war
m ta
ilwat
ers
No
chan
ge
Impr
ovem
ents
w
ould
con
tinue
du
e to
RR
I in
itiat
ives
; w
arm
-wat
er
spec
ies
wou
ld
cont
inue
to b
e lim
ited
Slig
htly
be
nefic
ial t
o sl
ight
ly
adve
rse
Slig
htly
be
nefic
ial t
o sl
ight
ly
adve
rse
Slig
htly
be
nefic
ial
Slig
htly
be
nefic
ial t
o sl
ight
ly a
dver
se
No
chan
ge
Slig
htly
be
nefic
ial t
o sl
ight
ly
adve
rse
Slig
htly
be
nefic
ial t
o sl
ight
ly
adve
rse
Slig
htly
be
nefic
ial t
o sl
ight
ly
adve
rse
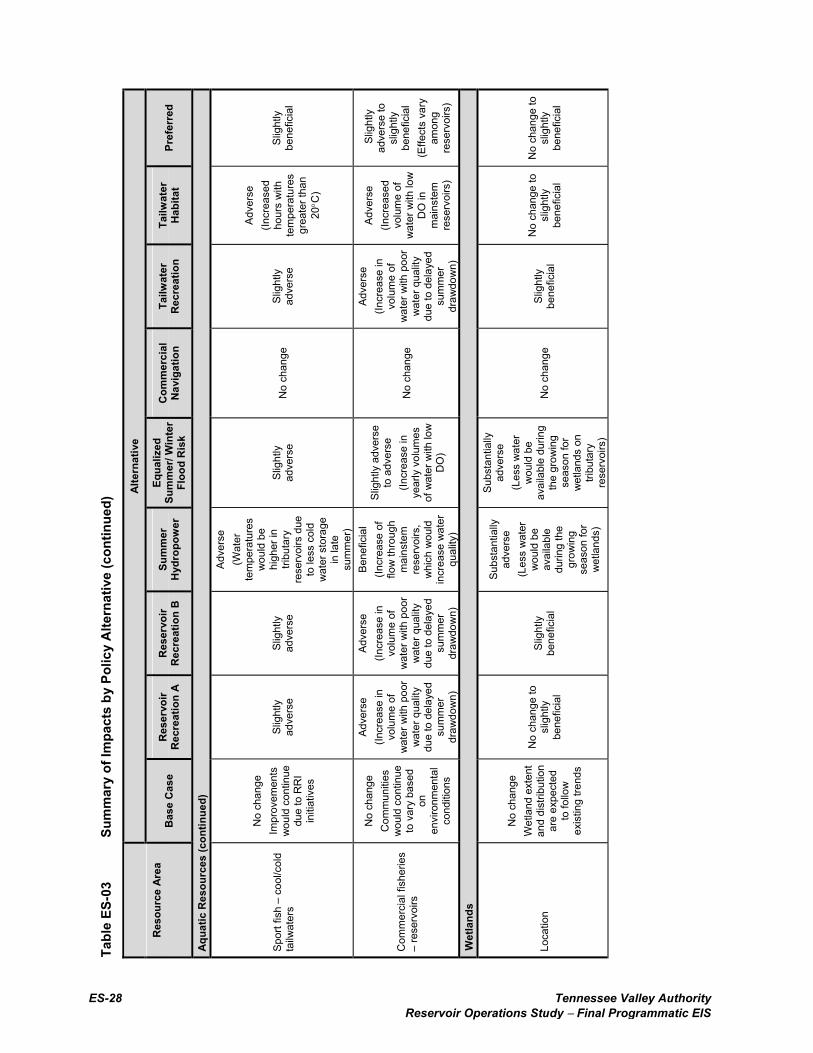
ES-28 Tennessee Valley Authority Reservoir Operations Study − Final Programmatic EIS
Tabl
e ES
-03
Sum
mar
y of
Impa
cts
by P
olic
y A
ltern
ativ
e (c
ontin
ued)
Alte
rnat
ive
Res
ourc
e Ar
ea
Bas
e C
ase
Res
ervo
ir R
ecre
atio
n A
Res
ervo
ir R
ecre
atio
n B
Su
mm
er
Hyd
ropo
wer
Eq
ualiz
ed
Sum
mer
/ Win
ter
Floo
d R
isk
Com
mer
cial
N
avig
atio
n Ta
ilwat
er
Rec
reat
ion
Tailw
ater
H
abita
t Pr
efer
red
Aqua
tic R
esou
rces
(con
tinue
d)
Spor
t fis
h –
cool
/col
d ta
ilwat
ers
No
chan
ge
Impr
ovem
ents
w
ould
con
tinue
du
e to
RR
I in
itiat
ives
Slig
htly
ad
vers
e Sl
ight
ly
adve
rse
Adve
rse
(W
ater
te
mpe
ratu
res
wou
ld b
e hi
gher
in
tribu
tary
re
serv
oirs
due
to
less
col
d w
ater
sto
rage
in
late
su
mm
er)
Slig
htly
ad
vers
e N
o ch
ange
Sl
ight
ly
adve
rse
Adve
rse
(Incr
ease
d ho
urs
with
te
mpe
ratu
res
grea
ter t
han
20°C
)
Slig
htly
be
nefic
ial
Com
mer
cial
fish
erie
s –
rese
rvoi
rs
No
chan
ge
Com
mun
ities
w
ould
con
tinue
to
var
y ba
sed
on
envi
ronm
enta
l co
nditi
ons
Adve
rse
(Incr
ease
in
volu
me
of
wat
er w
ith p
oor
wat
er q
ualit
y du
e to
del
ayed
su
mm
er
draw
dow
n)
Adve
rse
(Incr
ease
in
volu
me
of
wat
er w
ith p
oor
wat
er q
ualit
y du
e to
del
ayed
su
mm
er
draw
dow
n)
Bene
ficia
l (In
crea
se o
f flo
w th
roug
h m
ains
tem
re
serv
oirs
, w
hich
wou
ld
incr
ease
wat
er
qual
ity)
Slig
htly
adv
erse
to
adv
erse
(In
crea
se in
ye
arly
vol
umes
of
wat
er w
ith lo
w
DO
)
No
chan
ge
Adve
rse
(Incr
ease
in
volu
me
of
wat
er w
ith p
oor
wat
er q
ualit
y du
e to
del
ayed
su
mm
er
draw
dow
n)
Adve
rse
(Incr
ease
d vo
lum
e of
w
ater
with
low
D
O in
m
ains
tem
re
serv
oirs
)
Slig
htly
ad
vers
e to
sl
ight
ly
bene
ficia
l (E
ffect
s va
ry
amon
g re
serv
oirs
)
Wet
land
s
Loca
tion
No
chan
ge
Wet
land
ext
ent
and
dist
ribut
ion
are
expe
cted
to
follo
w
exis
ting
trend
s
No
chan
ge to
sl
ight
ly
bene
ficia
l
Slig
htly
be
nefic
ial
Subs
tant
ially
ad
vers
e
(Les
s w
ater
w
ould
be
avai
labl
e du
ring
the
grow
ing
seas
on fo
r w
etla
nds)
Subs
tant
ially
ad
vers
e (L
ess
wat
er
wou
ld b
e av
aila
ble
durin
g th
e gr
owin
g se
ason
for
wet
land
s on
tri
buta
ry
rese
rvoi
rs)
No
chan
ge
Slig
htly
be
nefic
ial
No
chan
ge to
sl
ight
ly
bene
ficia
l
No
chan
ge to
sl
ight
ly
bene
ficia
l
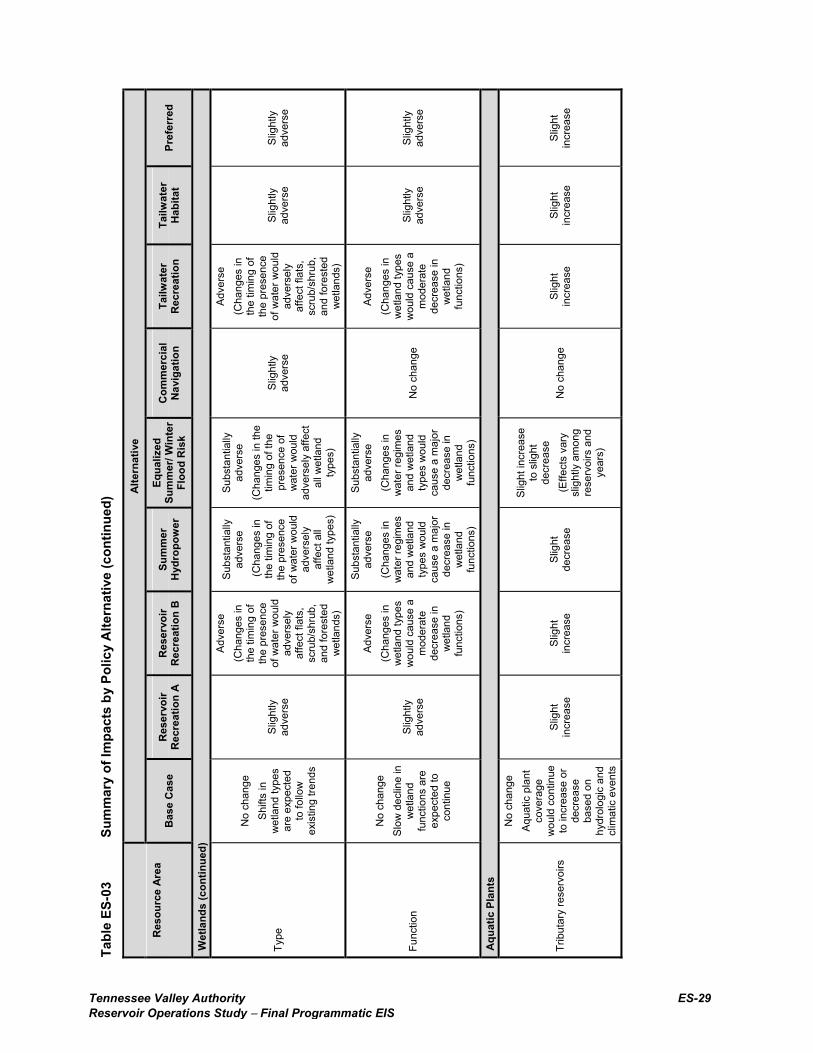
Tennessee Valley Authority ES-29Reservoir Operations Study − Final Programmatic EIS
Tabl
e ES
-03
Sum
mar
y of
Impa
cts
by P
olic
y A
ltern
ativ
e (c
ontin
ued)
Alte
rnat
ive
Res
ourc
e Ar
ea
Bas
e C
ase
Res
ervo
ir R
ecre
atio
n A
Res
ervo
ir R
ecre
atio
n B
Su
mm
er
Hyd
ropo
wer
Eq
ualiz
ed
Sum
mer
/ Win
ter
Floo
d R
isk
Com
mer
cial
N
avig
atio
n Ta
ilwat
er
Rec
reat
ion
Tailw
ater
H
abita
t Pr
efer
red
Wet
land
s (c
ontin
ued)
Type
No
chan
ge
Shift
s in
w
etla
nd ty
pes
are
expe
cted
to
follo
w
exis
ting
trend
s
Slig
htly
ad
vers
e
Adve
rse
(C
hang
es in
th
e tim
ing
of
the
pres
ence
of
wat
er w
ould
ad
vers
ely
affe
ct fl
ats,
sc
rub/
shru
b,
and
fore
sted
w
etla
nds)
Subs
tant
ially
ad
vers
e (C
hang
es in
th
e tim
ing
of
the
pres
ence
of
wat
er w
ould
ad
vers
ely
affe
ct a
ll w
etla
nd ty
pes)
Subs
tant
ially
ad
vers
e (C
hang
es in
the
timin
g of
the
pres
ence
of
wat
er w
ould
ad
vers
ely
affe
ct
all w
etla
nd
type
s)
Slig
htly
ad
vers
e
Adve
rse
(C
hang
es in
th
e tim
ing
of
the
pres
ence
of
wat
er w
ould
ad
vers
ely
affe
ct fl
ats,
sc
rub/
shru
b,
and
fore
sted
w
etla
nds)
Slig
htly
ad
vers
e
Slig
htly
ad
vers
e
Func
tion
No
chan
ge
Slow
dec
line
in
wet
land
fu
nctio
ns a
re
expe
cted
to
cont
inue
Slig
htly
ad
vers
e
Adve
rse
(C
hang
es in
w
etla
nd ty
pes
wou
ld c
ause
a
mod
erat
e de
crea
se in
w
etla
nd
func
tions
)
Subs
tant
ially
ad
vers
e (C
hang
es in
w
ater
regi
mes
an
d w
etla
nd
type
s w
ould
ca
use
a m
ajor
de
crea
se in
w
etla
nd
func
tions
)
Subs
tant
ially
ad
vers
e (C
hang
es in
w
ater
regi
mes
an
d w
etla
nd
type
s w
ould
ca
use
a m
ajor
de
crea
se in
w
etla
nd
func
tions
)
No
chan
ge
Adve
rse
(Cha
nges
in
wet
land
type
s w
ould
cau
se a
m
oder
ate
decr
ease
in
wet
land
fu
nctio
ns)
Slig
htly
ad
vers
e
Slig
htly
ad
vers
e
Aqua
tic P
lant
s
Trib
utar
y re
serv
oirs
No
chan
ge
Aqua
tic p
lant
co
vera
ge
wou
ld c
ontin
ue
to in
crea
se o
r de
crea
se
base
d on
hy
drol
ogic
and
cl
imat
ic e
vent
s
Slig
ht
incr
ease
Sl
ight
in
crea
se
Slig
ht
decr
ease
Slig
ht in
crea
se
to s
light
de
crea
se
(Effe
cts
vary
sl
ight
ly a
mon
g re
serv
oirs
and
ye
ars)
No
chan
ge
Slig
ht
incr
ease
Sl
ight
in
crea
se
Slig
ht
incr
ease
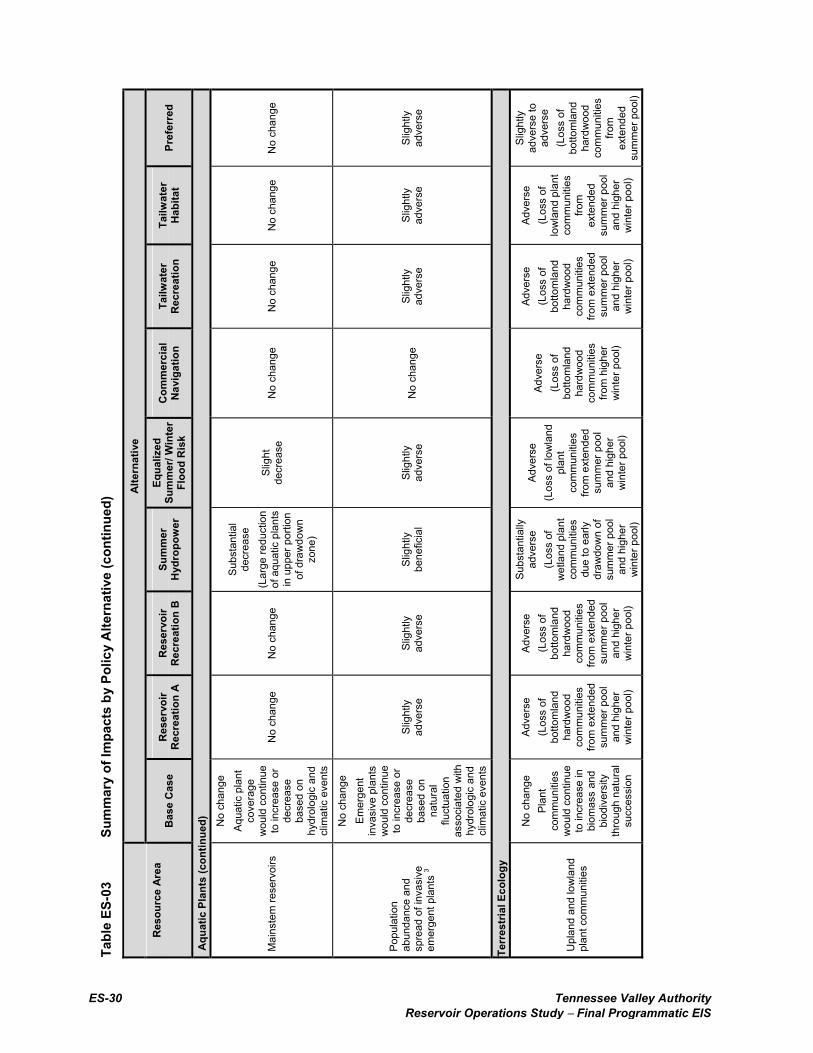
ES-30 Tennessee Valley Authority Reservoir Operations Study − Final Programmatic EIS
Tabl
e ES
-03
Sum
mar
y of
Impa
cts
by P
olic
y A
ltern
ativ
e (c
ontin
ued)
Alte
rnat
ive
Res
ourc
e Ar
ea
Bas
e C
ase
Res
ervo
ir R
ecre
atio
n A
Res
ervo
ir R
ecre
atio
n B
Su
mm
er
Hyd
ropo
wer
Eq
ualiz
ed
Sum
mer
/ Win
ter
Floo
d R
isk
Com
mer
cial
N
avig
atio
n Ta
ilwat
er
Rec
reat
ion
Tailw
ater
H
abita
t Pr
efer
red
Aqua
tic P
lant
s (c
ontin
ued)
Mai
nste
m re
serv
oirs
No
chan
ge
Aqua
tic p
lant
co
vera
ge
wou
ld c
ontin
ue
to in
crea
se o
r de
crea
se
base
d on
hy
drol
ogic
and
cl
imat
ic e
vent
s
No
chan
ge
No
chan
ge
Subs
tant
ial
decr
ease
(L
arge
redu
ctio
n of
aqu
atic
pla
nts
in u
pper
por
tion
of d
raw
dow
n zo
ne)
Slig
ht
decr
ease
N
o ch
ange
N
o ch
ange
N
o ch
ange
N
o ch
ange
Popu
latio
n ab
unda
nce
and
spre
ad o
f inv
asiv
e em
erge
nt p
lant
s 3
No
chan
ge
Emer
gent
in
vasi
ve p
lant
s w
ould
con
tinue
to
incr
ease
or
decr
ease
ba
sed
on
natu
ral
fluct
uatio
n as
soci
ated
with
hy
drol
ogic
and
cl
imat
ic e
vent
s
Slig
htly
ad
vers
e Sl
ight
ly
adve
rse
Slig
htly
be
nefic
ial
Slig
htly
ad
vers
e N
o ch
ange
Sl
ight
ly
adve
rse
Slig
htly
ad
vers
e Sl
ight
ly
adve
rse
Terr
estr
ial E
colo
gy
Upl
and
and
low
land
pl
ant c
omm
uniti
es
No
chan
ge
Plan
t co
mm
uniti
es
wou
ld c
ontin
ue
to in
crea
se in
bi
omas
s an
d bi
odiv
ersi
ty
thro
ugh
natu
ral
succ
essi
on
Adve
rse
(L
oss
of
botto
mla
nd
hard
woo
d co
mm
uniti
es
from
ext
ende
d su
mm
er p
ool
and
high
er
win
ter p
ool)
Adve
rse
(L
oss
of
botto
mla
nd
hard
woo
d co
mm
uniti
es
from
ext
ende
d su
mm
er p
ool
and
high
er
win
ter p
ool)
Subs
tant
ially
ad
vers
e
(Los
s of
w
etla
nd p
lant
co
mm
uniti
es
due
to e
arly
dr
awdo
wn
of
sum
mer
poo
l an
d hi
gher
w
inte
r poo
l)
Adve
rse
(Los
s of
low
land
pl
ant
com
mun
ities
fro
m e
xten
ded
sum
mer
poo
l an
d hi
gher
w
inte
r poo
l)
Adve
rse
(Los
s of
bo
ttom
land
ha
rdw
ood
com
mun
ities
fro
m h
ighe
r w
inte
r poo
l)
Adve
rse
(Los
s of
bo
ttom
land
ha
rdw
ood
com
mun
ities
fro
m e
xten
ded
sum
mer
poo
l an
d hi
gher
w
inte
r poo
l)
Adve
rse
(Los
s of
lo
wla
nd p
lant
co
mm
uniti
es
from
ex
tend
ed
sum
mer
poo
l an
d hi
gher
w
inte
r poo
l)
Slig
htly
ad
vers
e to
ad
vers
e (L
oss
of
botto
mla
nd
hard
woo
d co
mm
uniti
es
from
ex
tend
ed
sum
mer
poo
l)
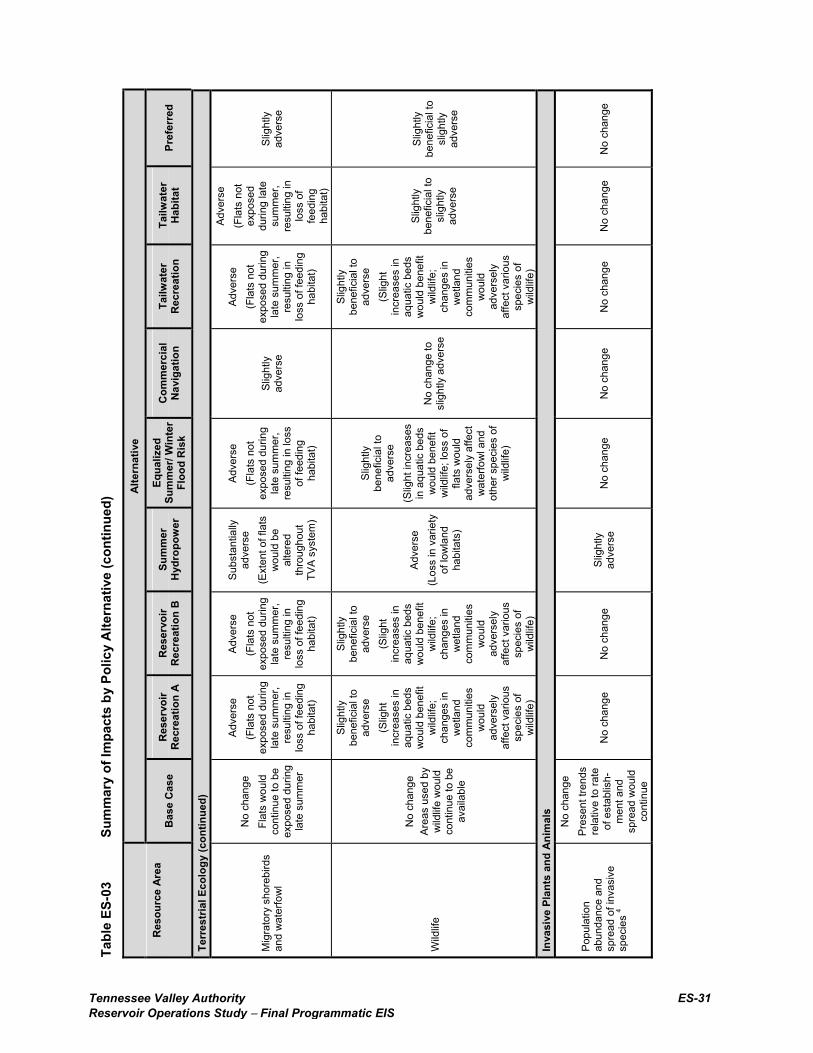
Tennessee Valley Authority ES-31Reservoir Operations Study − Final Programmatic EIS
Tabl
e ES
-03
Sum
mar
y of
Impa
cts
by P
olic
y A
ltern
ativ
e (c
ontin
ued)
Alte
rnat
ive
Res
ourc
e Ar
ea
Bas
e C
ase
Res
ervo
ir R
ecre
atio
n A
Res
ervo
ir R
ecre
atio
n B
Su
mm
er
Hyd
ropo
wer
Eq
ualiz
ed
Sum
mer
/ Win
ter
Floo
d R
isk
Com
mer
cial
N
avig
atio
n Ta
ilwat
er
Rec
reat
ion
Tailw
ater
H
abita
t Pr
efer
red
Terr
estr
ial E
colo
gy (c
ontin
ued)
Mig
rato
ry s
hore
bird
s an
d w
ater
fow
l
No
chan
ge
Flat
s w
ould
co
ntin
ue to
be
expo
sed
durin
g la
te s
umm
er
Adve
rse
(F
lats
not
ex
pose
d du
ring
late
sum
mer
, re
sulti
ng in
lo
ss o
f fee
ding
ha
bita
t)
Adve
rse
(F
lats
not
ex
pose
d du
ring
late
sum
mer
, re
sulti
ng in
lo
ss o
f fee
ding
ha
bita
t)
Subs
tant
ially
ad
vers
e
(Ext
ent o
f fla
ts
wou
ld b
e al
tere
d th
roug
hout
TV
A sy
stem
)
Adve
rse
(F
lats
not
ex
pose
d du
ring
late
sum
mer
, re
sulti
ng in
loss
of
feed
ing
habi
tat)
Slig
htly
ad
vers
e
Adve
rse
(F
lats
not
ex
pose
d du
ring
late
sum
mer
, re
sulti
ng in
lo
ss o
f fee
ding
ha
bita
t)
Adve
rse
(F
lats
not
ex
pose
d du
ring
late
su
mm
er,
resu
lting
in
loss
of
feed
ing
habi
tat)
Slig
htly
ad
vers
e
Wild
life
No
chan
ge
Area
s us
ed b
y w
ildlif
e w
ould
co
ntin
ue to
be
avai
labl
e
Slig
htly
be
nefic
ial t
o ad
vers
e
(Slig
ht
incr
ease
s in
aq
uatic
bed
s w
ould
ben
efit
wild
life;
ch
ange
s in
w
etla
nd
com
mun
ities
w
ould
ad
vers
ely
affe
ct v
ario
us
spec
ies
of
wild
life)
Slig
htly
be
nefic
ial t
o ad
vers
e (S
light
in
crea
ses
in
aqua
tic b
eds
wou
ld b
enef
it w
ildlif
e;
chan
ges
in
wet
land
co
mm
uniti
es
wou
ld
adve
rsel
y af
fect
var
ious
sp
ecie
s of
w
ildlif
e)
Adve
rse
(L
oss
in v
arie
ty
of lo
wla
nd
habi
tats
)
Slig
htly
be
nefic
ial t
o ad
vers
e
(Slig
ht in
crea
ses
in a
quat
ic b
eds
wou
ld b
enef
it w
ildlif
e; lo
ss o
f fla
ts w
ould
ad
vers
ely
affe
ct
wat
erfo
wl a
nd
othe
r spe
cies
of
wild
life)
No
chan
ge to
sl
ight
ly a
dver
se
Slig
htly
be
nefic
ial t
o ad
vers
e (S
light
in
crea
ses
in
aqua
tic b
eds
wou
ld b
enef
it w
ildlif
e;
chan
ges
in
wet
land
co
mm
uniti
es
wou
ld
adve
rsel
y af
fect
var
ious
sp
ecie
s of
w
ildlif
e)
Slig
htly
be
nefic
ial t
o sl
ight
ly
adve
rse
Slig
htly
be
nefic
ial t
o sl
ight
ly
adve
rse
Inva
sive
Pla
nts
and
Anim
als
Popu
latio
n ab
unda
nce
and
spre
ad o
f inv
asiv
e sp
ecie
s 4
No
chan
ge
Pres
ent t
rend
s re
lativ
e to
rate
of
est
ablis
h-m
ent a
nd
spre
ad w
ould
co
ntin
ue
No
chan
ge
No
chan
ge
Slig
htly
ad
vers
e N
o ch
ange
N
o ch
ange
N
o ch
ange
N
o ch
ange
N
o ch
ange
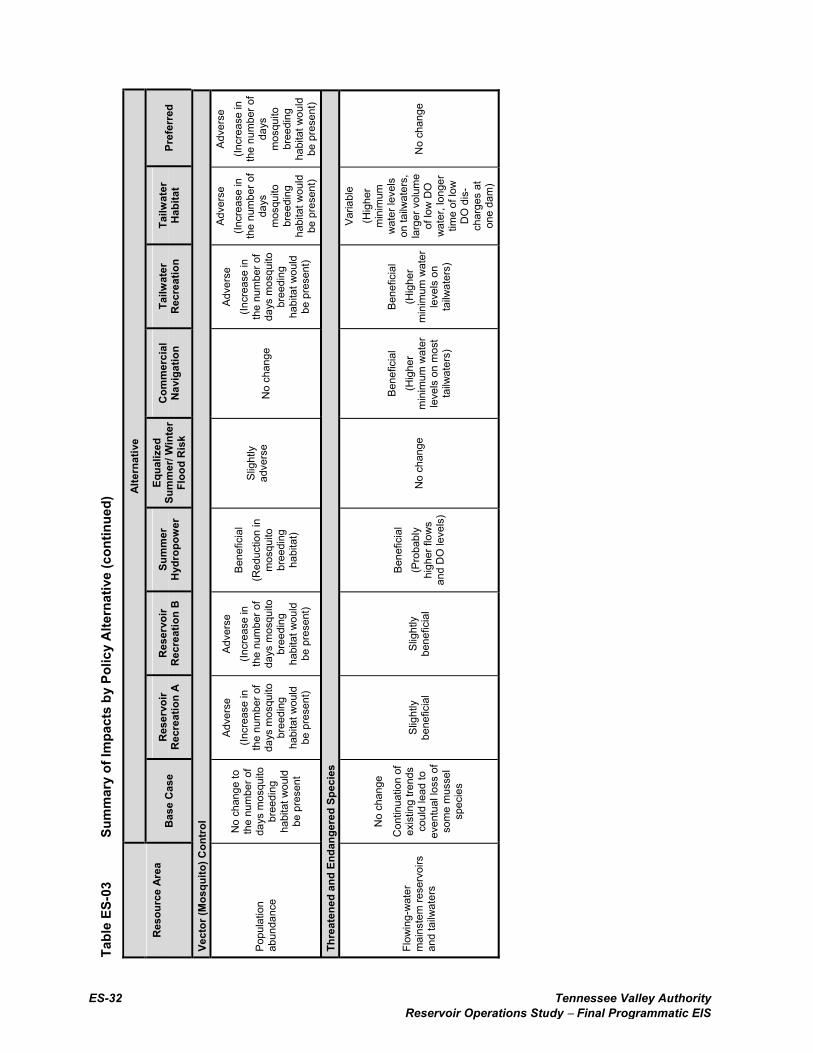
ES-32 Tennessee Valley Authority Reservoir Operations Study − Final Programmatic EIS
Tabl
e ES
-03
Sum
mar
y of
Impa
cts
by P
olic
y A
ltern
ativ
e (c
ontin
ued)
Alte
rnat
ive
Res
ourc
e Ar
ea
Bas
e C
ase
Res
ervo
ir R
ecre
atio
n A
Res
ervo
ir R
ecre
atio
n B
Su
mm
er
Hyd
ropo
wer
Eq
ualiz
ed
Sum
mer
/ Win
ter
Floo
d R
isk
Com
mer
cial
N
avig
atio
n Ta
ilwat
er
Rec
reat
ion
Tailw
ater
H
abita
t Pr
efer
red
Vect
or (M
osqu
ito) C
ontr
ol
Popu
latio
n ab
unda
nce
No
chan
ge to
th
e nu
mbe
r of
days
mos
quito
br
eedi
ng
habi
tat w
ould
be
pre
sent
Adve
rse
(Incr
ease
in
the
num
ber o
f da
ys m
osqu
ito
bree
ding
ha
bita
t wou
ld
be p
rese
nt)
Adve
rse
(In
crea
se in
th
e nu
mbe
r of
days
mos
quito
br
eedi
ng
habi
tat w
ould
be
pre
sent
)
Bene
ficia
l (R
educ
tion
in
mos
quito
br
eedi
ng
habi
tat)
Slig
htly
ad
vers
e
No
chan
ge
Adve
rse
(Incr
ease
in
the
num
ber o
f da
ys m
osqu
ito
bree
ding
ha
bita
t wou
ld
be p
rese
nt)
Adve
rse
(In
crea
se in
th
e nu
mbe
r of
days
m
osqu
ito
bree
ding
ha
bita
t wou
ld
be p
rese
nt)
Adve
rse
(In
crea
se in
th
e nu
mbe
r of
days
m
osqu
ito
bree
ding
ha
bita
t wou
ld
be p
rese
nt)
Thre
aten
ed a
nd E
ndan
gere
d Sp
ecie
s
Flow
ing-
wat
er
mai
nste
m re
serv
oirs
an
d ta
ilwat
ers
No
chan
ge
Con
tinua
tion
of
exis
ting
trend
s co
uld
lead
to
even
tual
loss
of
som
e m
usse
l sp
ecie
s
Slig
htly
be
nefic
ial
Slig
htly
be
nefic
ial
Bene
ficia
l (P
roba
bly
high
er fl
ows
and
DO
leve
ls)
No
chan
ge
Bene
ficia
l (H
ighe
r m
inim
um w
ater
le
vels
on
mos
t ta
ilwat
ers)
Bene
ficia
l (H
ighe
r m
inim
um w
ater
le
vels
on
tailw
ater
s)
Varia
ble
(Hig
her
min
imum
w
ater
leve
ls
on ta
ilwat
ers,
la
rger
vol
ume
of lo
w D
O
wat
er, l
onge
r tim
e of
low
D
O d
is-
char
ges
at
one
dam
)
No
chan
ge
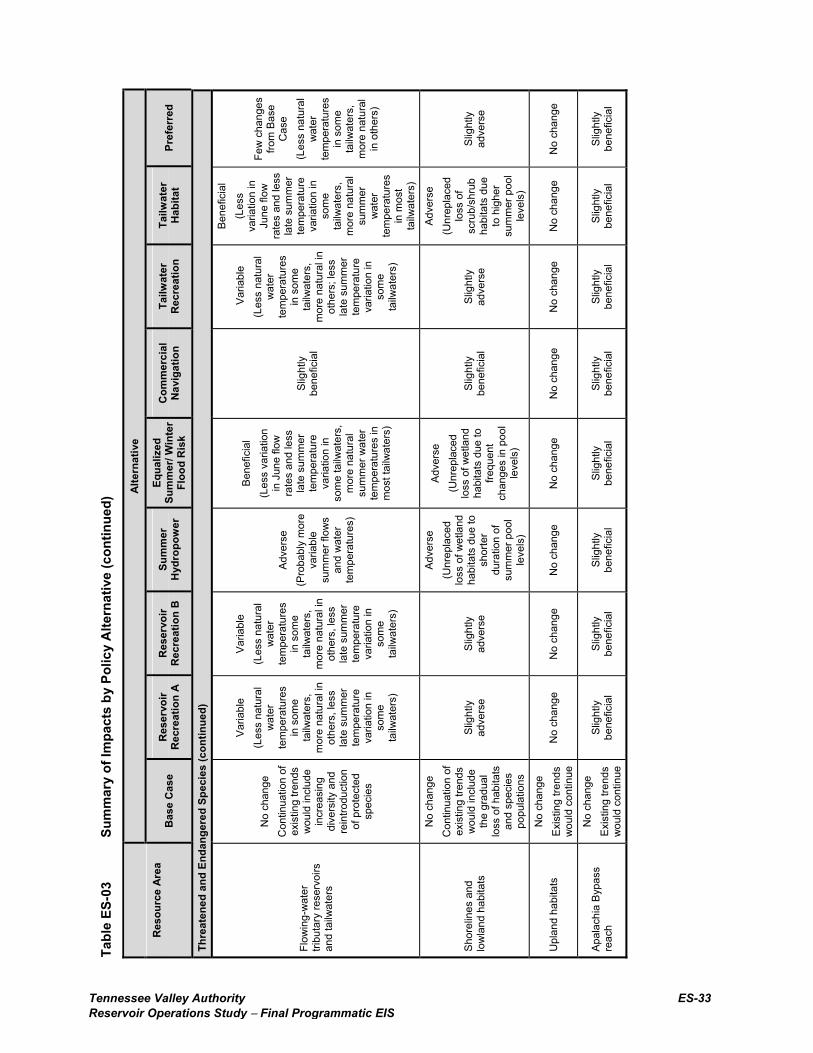
Tennessee Valley Authority ES-33Reservoir Operations Study − Final Programmatic EIS
Tabl
e ES
-03
Sum
mar
y of
Impa
cts
by P
olic
y A
ltern
ativ
e (c
ontin
ued)
Alte
rnat
ive
Res
ourc
e Ar
ea
Bas
e C
ase
Res
ervo
ir R
ecre
atio
n A
Res
ervo
ir R
ecre
atio
n B
Su
mm
er
Hyd
ropo
wer
Eq
ualiz
ed
Sum
mer
/ Win
ter
Floo
d R
isk
Com
mer
cial
N
avig
atio
n Ta
ilwat
er
Rec
reat
ion
Tailw
ater
H
abita
t Pr
efer
red
Thre
aten
ed a
nd E
ndan
gere
d Sp
ecie
s (c
ontin
ued)
Flow
ing-
wat
er
tribu
tary
rese
rvoi
rs
and
tailw
ater
s
No
chan
ge
Con
tinua
tion
of
exis
ting
trend
s w
ould
incl
ude
incr
easi
ng
dive
rsity
and
re
intro
duct
ion
of p
rote
cted
sp
ecie
s
Varia
ble
(Les
s na
tura
l w
ater
te
mpe
ratu
res
in s
ome
tailw
ater
s,
mor
e na
tura
l in
othe
rs, l
ess
late
sum
mer
te
mpe
ratu
re
varia
tion
in
som
e ta
ilwat
ers)
Varia
ble
(Les
s na
tura
l w
ater
te
mpe
ratu
res
in s
ome
tailw
ater
s,
mor
e na
tura
l in
othe
rs, l
ess
late
sum
mer
te
mpe
ratu
re
varia
tion
in
som
e ta
ilwat
ers)
Adve
rse
(Pro
babl
y m
ore
varia
ble
sum
mer
flow
s an
d w
ater
te
mpe
ratu
res)
Bene
ficia
l (L
ess
varia
tion
in J
une
flow
ra
tes
and
less
la
te s
umm
er
tem
pera
ture
va
riatio
n in
so
me
tailw
ater
s,
mor
e na
tura
l su
mm
er w
ater
te
mpe
ratu
res
in
mos
t tai
lwat
ers)
Slig
htly
be
nefic
ial
Var
iabl
e (L
ess
natu
ral
wat
er
tem
pera
ture
s in
som
e ta
ilwat
ers,
m
ore
natu
ral i
n ot
hers
; les
s la
te s
umm
er
tem
pera
ture
va
riatio
n in
so
me
tailw
ater
s)
Bene
ficia
l (L
ess
varia
tion
in
June
flow
ra
tes
and
less
la
te s
umm
er
tem
pera
ture
va
riatio
n in
so
me
tailw
ater
s,
mor
e na
tura
l su
mm
er
wat
er
tem
pera
ture
s in
mos
t ta
ilwat
ers)
Few
cha
nges
fro
m B
ase
Cas
e (L
ess
natu
ral
wat
er
tem
pera
ture
s in
som
e ta
ilwat
ers,
m
ore
natu
ral
in o
ther
s)
Shor
elin
es a
nd
low
land
hab
itats
No
chan
ge
Con
tinua
tion
of
exis
ting
trend
s w
ould
incl
ude
the
grad
ual
loss
of h
abita
ts
and
spec
ies
popu
latio
ns
Slig
htly
ad
vers
e Sl
ight
ly
adve
rse
Adve
rse
(Unr
epla
ced
loss
of w
etla
nd
habi
tats
due
to
shor
ter
dura
tion
of
sum
mer
poo
l le
vels
)
Adve
rse
(Unr
epla
ced
loss
of w
etla
nd
habi
tats
due
to
frequ
ent
chan
ges
in p
ool
leve
ls)
Slig
htly
be
nefic
ial
Slig
htly
ad
vers
e
Adve
rse
(Unr
epla
ced
loss
of
scru
b/sh
rub
habi
tats
due
to
hig
her
sum
mer
poo
l le
vels
)
Slig
htly
ad
vers
e
Upl
and
habi
tats
N
o ch
ange
Ex
istin
g tre
nds
wou
ld c
ontin
ue
No
chan
ge
No
chan
ge
No
chan
ge
No
chan
ge
No
chan
ge
No
chan
ge
No
chan
ge
No
chan
ge
Apal
achi
a By
pass
re
ach
No
chan
ge
Exis
ting
trend
s w
ould
con
tinue
Slig
htly
be
nefic
ial
Slig
htly
be
nefic
ial
Slig
htly
be
nefic
ial
Slig
htly
be
nefic
ial
Slig
htly
be
nefic
ial
Slig
htly
be
nefic
ial
Slig
htly
be
nefic
ial
Slig
htly
be
nefic
ial
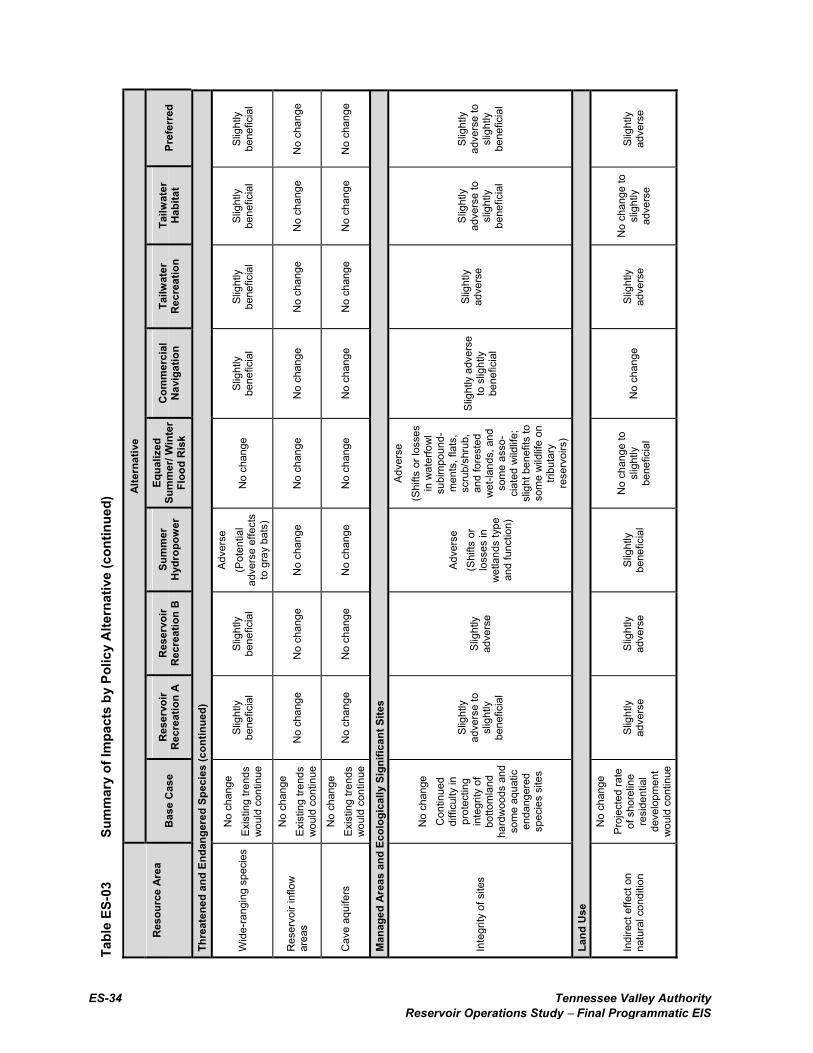
ES-34 Tennessee Valley Authority Reservoir Operations Study − Final Programmatic EIS
Tabl
e ES
-03
Sum
mar
y of
Impa
cts
by P
olic
y A
ltern
ativ
e (c
ontin
ued)
Alte
rnat
ive
Res
ourc
e Ar
ea
Bas
e C
ase
Res
ervo
ir R
ecre
atio
n A
Res
ervo
ir R
ecre
atio
n B
Su
mm
er
Hyd
ropo
wer
Eq
ualiz
ed
Sum
mer
/ Win
ter
Floo
d R
isk
Com
mer
cial
N
avig
atio
n Ta
ilwat
er
Rec
reat
ion
Tailw
ater
H
abita
t Pr
efer
red
Thre
aten
ed a
nd E
ndan
gere
d Sp
ecie
s (c
ontin
ued)
Wid
e-ra
ngin
g sp
ecie
s N
o ch
ange
Ex
istin
g tre
nds
wou
ld c
ontin
ue
Slig
htly
be
nefic
ial
Slig
htly
be
nefic
ial
Adve
rse
(Pot
entia
l ad
vers
e ef
fect
s to
gra
y ba
ts)
No
chan
ge
Slig
htly
be
nefic
ial
Slig
htly
be
nefic
ial
Slig
htly
be
nefic
ial
Slig
htly
be
nefic
ial
Res
ervo
ir in
flow
ar
eas
No
chan
ge
Exis
ting
trend
s w
ould
con
tinue
N
o ch
ange
N
o ch
ange
N
o ch
ange
N
o ch
ange
N
o ch
ange
N
o ch
ange
N
o ch
ange
N
o ch
ange
Cav
e aq
uife
rs
No
chan
ge
Exis
ting
trend
s w
ould
con
tinue
N
o ch
ange
N
o ch
ange
N
o ch
ange
N
o ch
ange
N
o ch
ange
N
o ch
ange
N
o ch
ange
N
o ch
ange
Man
aged
Are
as a
nd E
colo
gica
lly S
igni
fican
t Site
s
Inte
grity
of s
ites
No
chan
ge
Con
tinue
d di
fficu
lty in
pr
otec
ting
inte
grity
of
botto
mla
nd
hard
woo
ds a
nd
som
e aq
uatic
en
dang
ered
sp
ecie
s si
tes
Slig
htly
ad
vers
e to
sl
ight
ly
bene
ficia
l
Slig
htly
ad
vers
e
Adve
rse
(S
hifts
or
loss
es in
w
etla
nds
type
an
d fu
nctio
n)
Adve
rse
(Shi
fts o
r los
ses
in w
ater
fow
l su
bim
poun
d-m
ents
, fla
ts,
scru
b/sh
rub,
an
d fo
rest
ed
wet
-land
s, a
nd
som
e as
so-
ciat
ed w
ildlif
e;
slig
ht b
enef
its to
so
me
wild
life
on
tribu
tary
re
serv
oirs
)
Slig
htly
adv
erse
to
slig
htly
be
nefic
ial
Slig
htly
ad
vers
e
Slig
htly
ad
vers
e to
sl
ight
ly
bene
ficia
l
Slig
htly
ad
vers
e to
sl
ight
ly
bene
ficia
l
Land
Use
Indi
rect
effe
ct o
n na
tura
l con
ditio
n
No
chan
ge
Proj
ecte
d ra
te
of s
hore
line
resi
dent
ial
deve
lopm
ent
wou
ld c
ontin
ue
Slig
htly
ad
vers
e Sl
ight
ly
adve
rse
Slig
htly
be
nefic
ial
No
chan
ge to
sl
ight
ly
bene
ficia
l N
o ch
ange
Sl
ight
ly
adve
rse
No
chan
ge to
sl
ight
ly
adve
rse
Slig
htly
ad
vers
e
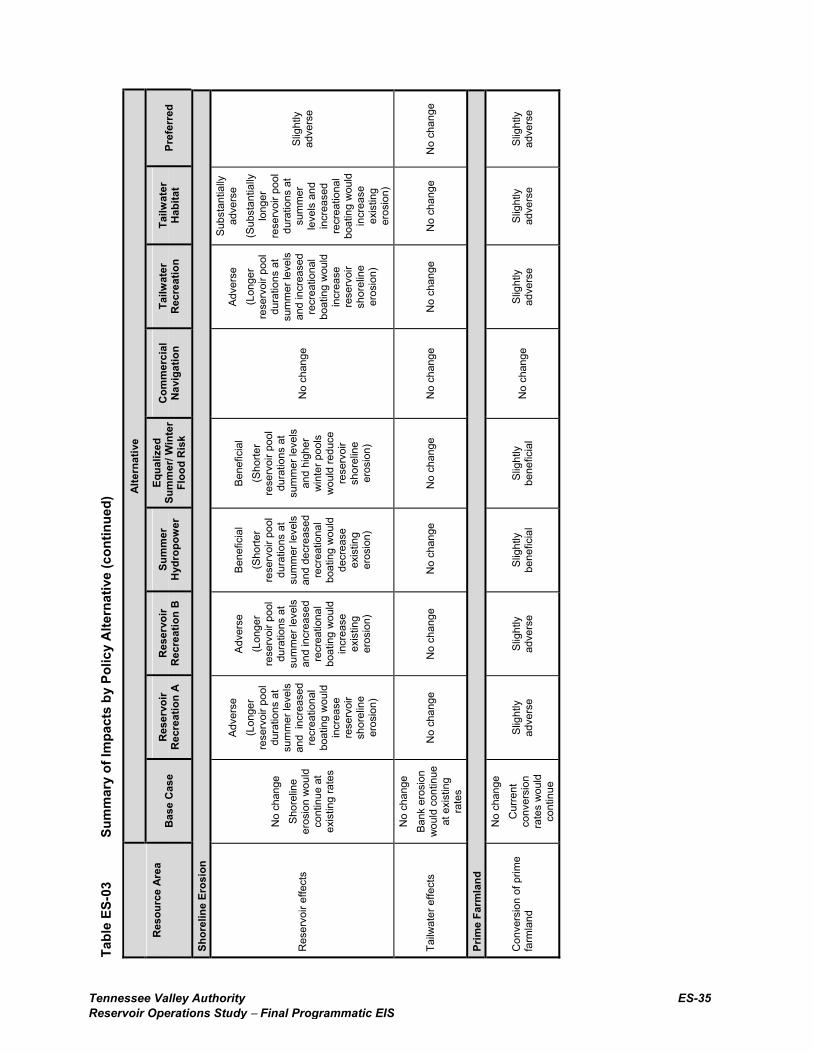
Tennessee Valley Authority ES-35Reservoir Operations Study − Final Programmatic EIS
Tabl
e ES
-03
Sum
mar
y of
Impa
cts
by P
olic
y A
ltern
ativ
e (c
ontin
ued)
Alte
rnat
ive
Res
ourc
e Ar
ea
Bas
e C
ase
Res
ervo
ir R
ecre
atio
n A
Res
ervo
ir R
ecre
atio
n B
Su
mm
er
Hyd
ropo
wer
Eq
ualiz
ed
Sum
mer
/ Win
ter
Floo
d R
isk
Com
mer
cial
N
avig
atio
n Ta
ilwat
er
Rec
reat
ion
Tailw
ater
H
abita
t Pr
efer
red
Shor
elin
e Er
osio
n
Res
ervo
ir ef
fect
s
No
chan
ge
Shor
elin
e er
osio
n w
ould
co
ntin
ue a
t ex
istin
g ra
tes
Adve
rse
(L
onge
r re
serv
oir p
ool
dura
tions
at
sum
mer
leve
ls
and
incr
ease
d re
crea
tiona
l bo
atin
g w
ould
in
crea
se
rese
rvoi
r sh
orel
ine
eros
ion)
Adve
rse
(L
onge
r re
serv
oir p
ool
dura
tions
at
sum
mer
leve
ls
and
incr
ease
d re
crea
tiona
l bo
atin
g w
ould
in
crea
se
exis
ting
eros
ion)
Bene
ficia
l (S
horte
r re
serv
oir p
ool
dura
tions
at
sum
mer
leve
ls
and
decr
ease
d re
crea
tiona
l bo
atin
g w
ould
de
crea
se
exis
ting
eros
ion)
Bene
ficia
l (S
horte
r re
serv
oir p
ool
dura
tions
at
sum
mer
leve
ls
and
high
er
win
ter p
ools
w
ould
redu
ce
rese
rvoi
r sh
orel
ine
eros
ion)
No
chan
ge
Adve
rse
(L
onge
r re
serv
oir p
ool
dura
tions
at
sum
mer
leve
ls
and
incr
ease
d re
crea
tiona
l bo
atin
g w
ould
in
crea
se
rese
rvoi
r sh
orel
ine
eros
ion)
Subs
tant
ially
ad
vers
e
(Sub
stan
tially
lo
nger
re
serv
oir p
ool
dura
tions
at
sum
mer
le
vels
and
in
crea
sed
recr
eatio
nal
boat
ing
wou
ld
incr
ease
ex
istin
g er
osio
n)
Slig
htly
ad
vers
e
Tailw
ater
effe
cts
No
chan
ge
Bank
ero
sion
w
ould
con
tinue
at
exi
stin
g ra
tes
No
chan
ge
No
chan
ge
No
chan
ge
No
chan
ge
No
chan
ge
No
chan
ge
No
chan
ge
No
chan
ge
Prim
e Fa
rmla
nd
Con
vers
ion
of p
rime
farm
land
No
chan
ge
Cur
rent
co
nver
sion
ra
tes
wou
ld
cont
inue
Slig
htly
ad
vers
e Sl
ight
ly
adve
rse
Slig
htly
be
nefic
ial
Slig
htly
be
nefic
ial
No
chan
ge
Slig
htly
ad
vers
e Sl
ight
ly
adve
rse
Slig
htly
ad
vers
e
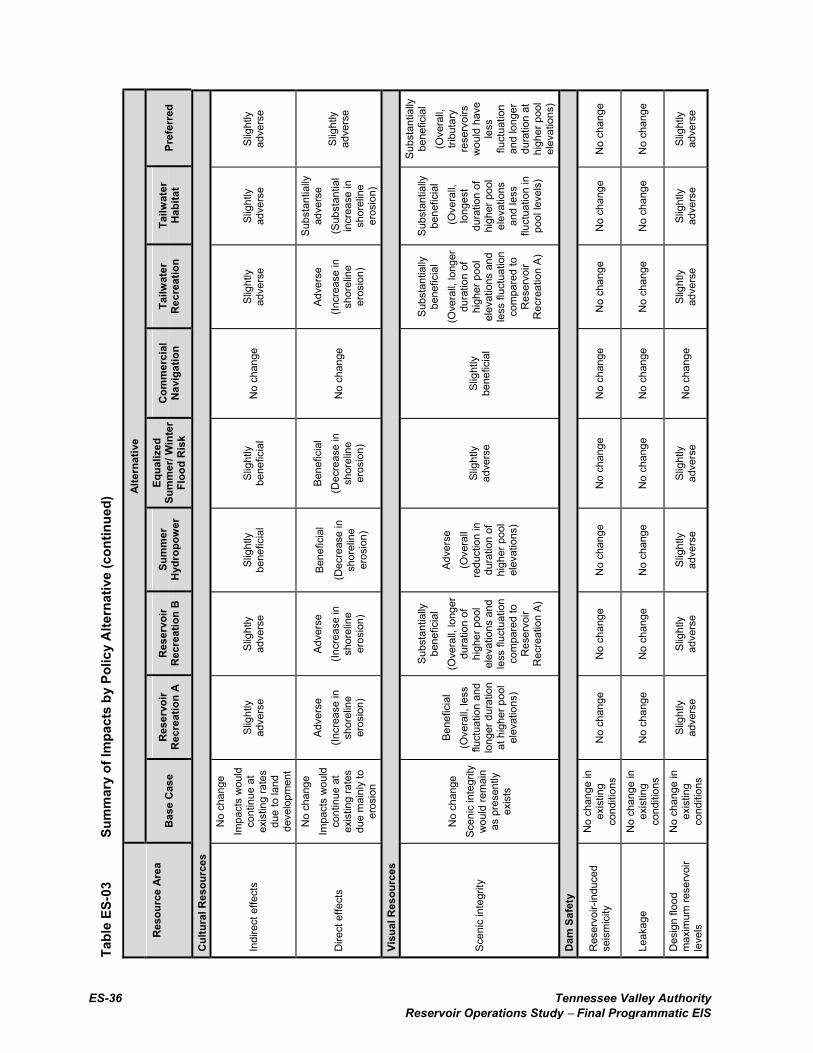
ES-36 Tennessee Valley Authority Reservoir Operations Study − Final Programmatic EIS
Tabl
e ES
-03
Sum
mar
y of
Impa
cts
by P
olic
y A
ltern
ativ
e (c
ontin
ued)
Alte
rnat
ive
Res
ourc
e Ar
ea
Bas
e C
ase
Res
ervo
ir R
ecre
atio
n A
Res
ervo
ir R
ecre
atio
n B
Su
mm
er
Hyd
ropo
wer
Eq
ualiz
ed
Sum
mer
/ Win
ter
Floo
d R
isk
Com
mer
cial
N
avig
atio
n Ta
ilwat
er
Rec
reat
ion
Tailw
ater
H
abita
t Pr
efer
red
Cul
tura
l Res
ourc
es
Indi
rect
effe
cts
No
chan
ge
Impa
cts
wou
ld
cont
inue
at
exis
ting
rate
s du
e to
land
de
velo
pmen
t
Slig
htly
ad
vers
e Sl
ight
ly
adve
rse
Slig
htly
be
nefic
ial
Slig
htly
be
nefic
ial
No
chan
ge
Slig
htly
ad
vers
e Sl
ight
ly
adve
rse
Slig
htly
ad
vers
e
Dire
ct e
ffect
s
No
chan
ge
Impa
cts
wou
ld
cont
inue
at
exis
ting
rate
s du
e m
ainl
y to
er
osio
n
Adve
rse
(Incr
ease
in
shor
elin
e er
osio
n)
Adve
rse
(In
crea
se in
sh
orel
ine
eros
ion)
Bene
ficia
l
(Dec
reas
e in
sh
orel
ine
eros
ion)
Bene
ficia
l (D
ecre
ase
in
shor
elin
e er
osio
n)
No
chan
ge
Adve
rse
(In
crea
se in
sh
orel
ine
eros
ion)
Subs
tant
ially
adve
rse
(Sub
stan
tial
incr
ease
in
shor
elin
e er
osio
n)
Slig
htly
ad
vers
e
Visu
al R
esou
rces
Scen
ic in
tegr
ity
No
chan
ge
Scen
ic in
tegr
ity
wou
ld re
mai
n as
pre
sent
ly
exis
ts
Bene
ficia
l
(Ove
rall,
less
flu
ctua
tion
and
long
er d
urat
ion
at h
ighe
r poo
l el
evat
ions
)
Subs
tant
ially
be
nefic
ial
(Ove
rall,
long
er
dura
tion
of
high
er p
ool
elev
atio
ns a
nd
less
fluc
tuat
ion
com
pare
d to
R
eser
voir
Rec
reat
ion
A)
Adve
rse
(O
vera
ll re
duct
ion
in
dura
tion
of
high
er p
ool
elev
atio
ns)
Slig
htly
ad
vers
e Sl
ight
ly
bene
ficia
l
Subs
tant
ially
bene
ficia
l (O
vera
ll, lo
nger
du
ratio
n of
hi
gher
poo
l el
evat
ions
and
le
ss fl
uctu
atio
n co
mpa
red
to
Res
ervo
ir R
ecre
atio
n A)
Subs
tant
ially
be
nefic
ial
(Ove
rall,
lo
nges
t du
ratio
n of
hi
gher
poo
l el
evat
ions
an
d le
ss
fluct
uatio
n in
po
ol le
vels
)
Subs
tant
ially
be
nefic
ial
(Ove
rall,
tri
buta
ry
rese
rvoi
rs
wou
ld h
ave
less
flu
ctua
tion
and
long
er
dura
tion
at
high
er p
ool
elev
atio
ns)
Dam
Saf
ety
Res
ervo
ir-in
duce
d se
ism
icity
No
chan
ge in
ex
istin
g co
nditi
ons
No
chan
ge
No
chan
ge
No
chan
ge
No
chan
ge
No
chan
ge
No
chan
ge
No
chan
ge
No
chan
ge
Leak
age
No
chan
ge in
ex
istin
g co
nditi
ons
N
o ch
ange
N
o ch
ange
N
o ch
ange
N
o ch
ange
N
o ch
ange
N
o ch
ange
N
o ch
ange
N
o ch
ange
Des
ign
flood
m
axim
um re
serv
oir
leve
ls
No
chan
ge in
ex
istin
g co
nditi
ons
Slig
htly
ad
vers
e Sl
ight
ly
adve
rse
Slig
htly
ad
vers
e Sl
ight
ly
adve
rse
No
chan
ge
Slig
htly
ad
vers
e Sl
ight
ly
adve
rse
Slig
htly
ad
vers
e
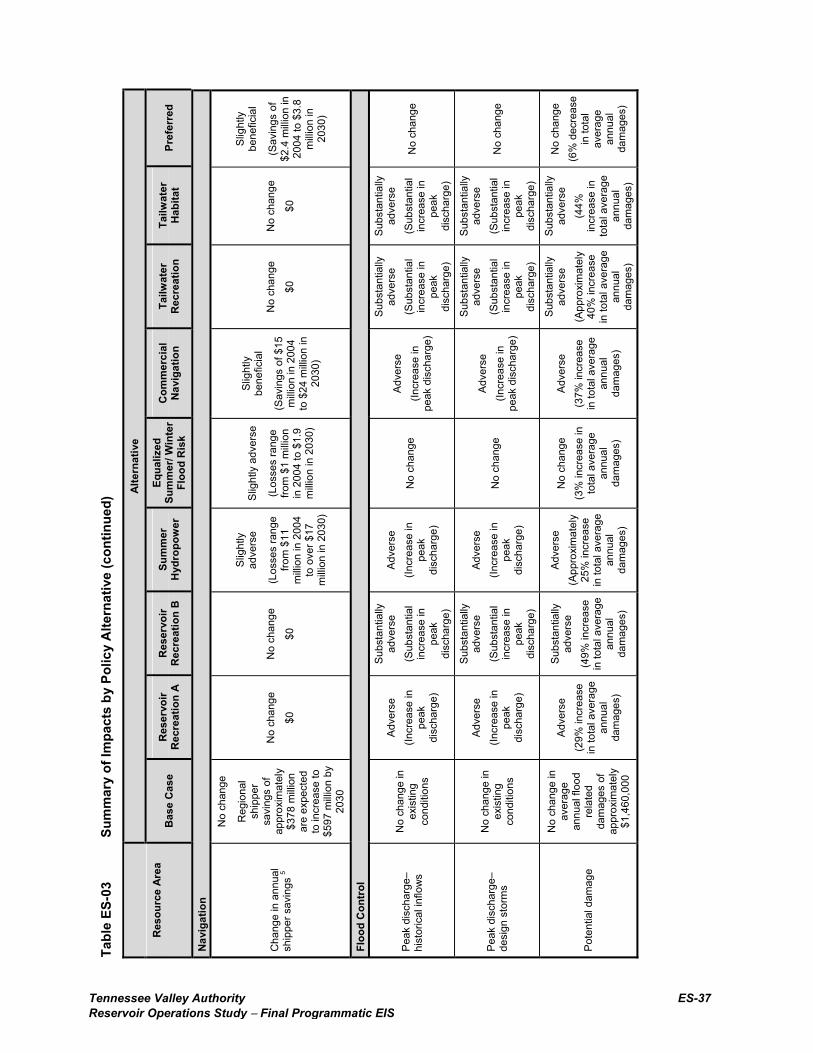
Tennessee Valley Authority ES-37Reservoir Operations Study − Final Programmatic EIS
Tabl
e ES
-03
Sum
mar
y of
Impa
cts
by P
olic
y A
ltern
ativ
e (c
ontin
ued)
Alte
rnat
ive
Res
ourc
e Ar
ea
Bas
e C
ase
Res
ervo
ir R
ecre
atio
n A
Res
ervo
ir R
ecre
atio
n B
Su
mm
er
Hyd
ropo
wer
Eq
ualiz
ed
Sum
mer
/ Win
ter
Floo
d R
isk
Com
mer
cial
N
avig
atio
n Ta
ilwat
er
Rec
reat
ion
Tailw
ater
H
abita
t Pr
efer
red
Nav
igat
ion
Cha
nge
in a
nnua
l sh
ippe
r sav
ings
5
No
chan
ge
Reg
iona
l sh
ippe
r sa
ving
s of
ap
prox
imat
ely
$378
milli
on
are
expe
cted
to
incr
ease
to
$597
milli
on b
y 20
30
No
chan
ge
$0
No
chan
ge
$0
Slig
htly
ad
vers
e
(Los
ses
rang
e fro
m $
11
milli
on in
200
4 to
ove
r $17
m
illion
in 2
030)
Slig
htly
adv
erse
(Los
ses
rang
e fro
m $
1 m
illion
in
200
4 to
$1.
9 m
illion
in 2
030)
Slig
htly
be
nefic
ial
(Sav
ings
of $
15
milli
on in
200
4 to
$24
milli
on in
20
30)
No
chan
ge
$0
No
chan
ge
$0
Slig
htly
be
nefic
ial
(Sav
ings
of
$2.4
milli
on in
20
04 to
$3.
8 m
illion
in
2030
)
Floo
d C
ontr
ol
Peak
dis
char
ge–
hist
oric
al in
flow
s
No
chan
ge in
ex
istin
g co
nditi
ons
Adve
rse
(Incr
ease
in
peak
di
scha
rge)
Subs
tant
ially
ad
vers
e (S
ubst
antia
l in
crea
se in
pe
ak
disc
harg
e)
Adve
rse
(Incr
ease
in
peak
di
scha
rge)
No
chan
ge
Adve
rse
(Incr
ease
in
peak
dis
char
ge)
Subs
tant
ially
ad
vers
e (S
ubst
antia
l in
crea
se in
pe
ak
disc
harg
e)
Subs
tant
ially
ad
vers
e (S
ubst
antia
l in
crea
se in
pe
ak
disc
harg
e)
No
chan
ge
Peak
dis
char
ge–
desi
gn s
torm
s
No
chan
ge in
ex
istin
g co
nditi
ons
Adve
rse
(Incr
ease
in
peak
di
scha
rge)
Subs
tant
ially
ad
vers
e (S
ubst
antia
l in
crea
se in
pe
ak
disc
harg
e)
Adve
rse
(Incr
ease
in
peak
di
scha
rge)
No
chan
ge
Adve
rse
(Incr
ease
in
peak
dis
char
ge)
Subs
tant
ially
ad
vers
e (S
ubst
antia
l in
crea
se in
pe
ak
disc
harg
e)
Subs
tant
ially
ad
vers
e (S
ubst
antia
l in
crea
se in
pe
ak
disc
harg
e)
No
chan
ge
Pote
ntia
l dam
age
No
chan
ge in
av
erag
e an
nual
floo
d re
late
d da
mag
es o
f ap
prox
imat
ely
$1,4
60,0
00
Adve
rse
(2
9% in
crea
se
in to
tal a
vera
ge
annu
al
dam
ages
)
Subs
tant
ially
ad
vers
e
(49%
incr
ease
in
tota
l ave
rage
an
nual
da
mag
es)
Adve
rse
(A
ppro
xim
atel
y 25
% in
crea
se
in to
tal a
vera
ge
annu
al
dam
ages
)
No
chan
ge
(3%
incr
ease
in
tota
l ave
rage
an
nual
da
mag
es)
Adve
rse
(37%
incr
ease
in
tota
l ave
rage
an
nual
da
mag
es)
Subs
tant
ially
ad
vers
e
(App
roxi
mat
ely
40%
incr
ease
in
tota
l ave
rage
an
nual
da
mag
es)
Subs
tant
ially
ad
vers
e
(44%
in
crea
se in
to
tal a
vera
ge
annu
al
dam
ages
)
No
chan
ge
(6%
dec
reas
e in
tota
l av
erag
e an
nual
da
mag
es)
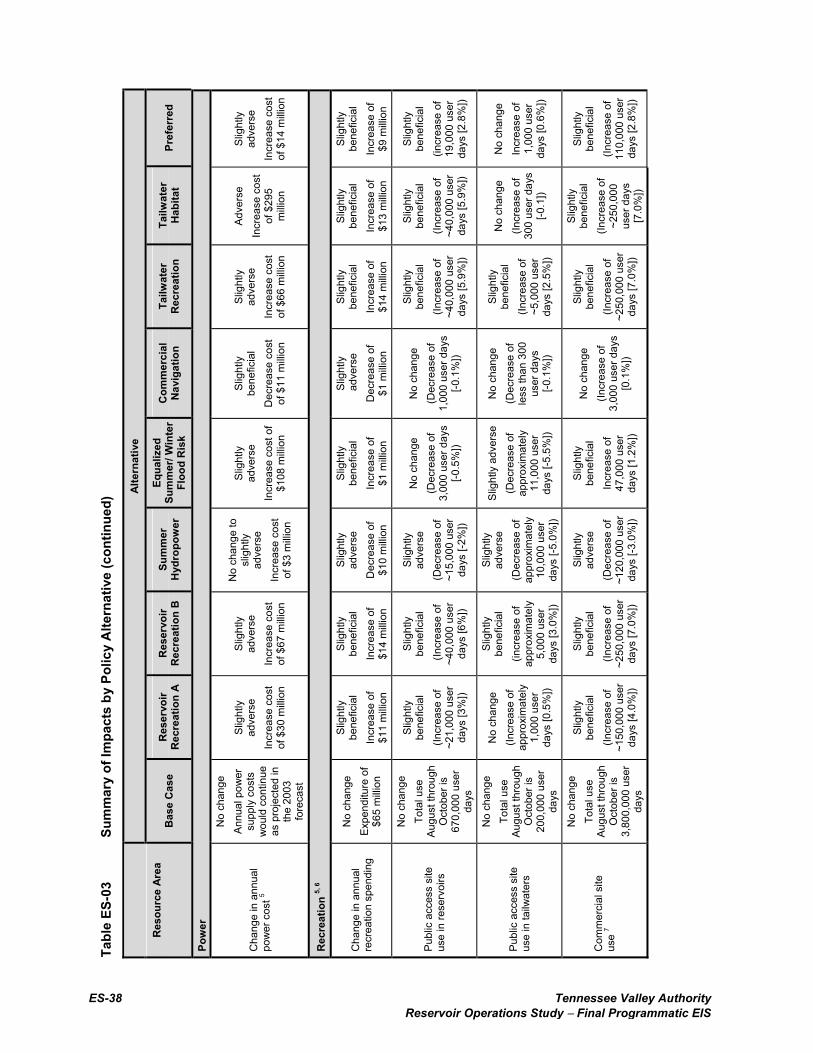
ES-38 Tennessee Valley Authority Reservoir Operations Study − Final Programmatic EIS
Tabl
e ES
-03
Sum
mar
y of
Impa
cts
by P
olic
y A
ltern
ativ
e (c
ontin
ued)
Alte
rnat
ive
Res
ourc
e Ar
ea
Bas
e C
ase
Res
ervo
ir R
ecre
atio
n A
Res
ervo
ir R
ecre
atio
n B
Su
mm
er
Hyd
ropo
wer
Eq
ualiz
ed
Sum
mer
/ Win
ter
Floo
d R
isk
Com
mer
cial
N
avig
atio
n Ta
ilwat
er
Rec
reat
ion
Tailw
ater
H
abita
t Pr
efer
red
Pow
er
Cha
nge
in a
nnua
l po
wer
cos
t 5
No
chan
ge
Annu
al p
ower
su
pply
cos
ts
wou
ld c
ontin
ue
as p
roje
cted
in
the
2003
fo
reca
st
Slig
htly
ad
vers
e In
crea
se c
ost
of $
30 m
illion
Slig
htly
ad
vers
e In
crea
se c
ost
of $
67 m
illion
No
chan
ge to
sl
ight
ly
adve
rse
Incr
ease
cos
t of
$3
milli
on
Slig
htly
ad
vers
e In
crea
se c
ost o
f $1
08 m
illion
Slig
htly
be
nefic
ial
Dec
reas
e co
st
of $
11 m
illion
Slig
htly
ad
vers
e In
crea
se c
ost
of $
66 m
illion
Adve
rse
Incr
ease
cos
t of
$29
5 m
illion
Slig
htly
ad
vers
e In
crea
se c
ost
of $
14 m
illion
Rec
reat
ion
5, 6
Cha
nge
in a
nnua
l re
crea
tion
spen
ding
No
chan
ge
Expe
nditu
re o
f $6
5 m
illion
Slig
htly
be
nefic
ial
Incr
ease
of
$11
milli
on
Slig
htly
be
nefic
ial
Incr
ease
of
$14
milli
on
Slig
htly
ad
vers
e D
ecre
ase
of
$10
milli
on
Slig
htly
be
nefic
ial
Incr
ease
of
$1 m
illion
Slig
htly
a
dver
se
Dec
reas
e of
$1
milli
on
Slig
htly
be
nefic
ial
Incr
ease
of
$14
milli
on
Slig
htly
be
nefic
ial
Incr
ease
of
$13
milli
on
Slig
htly
be
nefic
ial
Incr
ease
of
$9 m
illion
Publ
ic a
cces
s si
te
use
in re
serv
oirs
No
chan
ge
Tota
l use
Au
gust
thro
ugh
Oct
ober
is
670,
000
user
da
ys
Slig
htly
be
nefic
ial
(Incr
ease
of
~21,
000
user
da
ys [3
%])
Slig
htly
be
nefic
ial
(Inc
reas
e of
~4
0,00
0 us
er
days
[6%
])
Slig
htly
ad
vers
e (D
ecre
ase
of
~15,
000
user
da
ys [-
2%])
No
chan
ge
(Dec
reas
e of
3,
000
user
day
s [-0
.5%
])
No
chan
ge
(Dec
reas
e of
1,
000
user
day
s [-0
.1%
])
Slig
htly
be
nefic
ial
(Incr
ease
of
~40,
000
user
da
ys [5
.9%
])
Slig
htly
be
nefic
ial
(Incr
ease
of
~40,
000
user
da
ys [5
.9%
])
Slig
htly
be
nefic
ial
(incr
ease
of
19,0
00 u
ser
days
[2.8
%])
Publ
ic a
cces
s si
te
use
in ta
ilwat
ers
No
chan
ge
Tota
l use
Au
gust
thro
ugh
Oct
ober
is
200,
000
user
da
ys
No
chan
ge
(Incr
ease
of
appr
oxim
atel
y 1,
000
user
da
ys [0
.5%
])
Slig
htly
be
nefic
ial
(incr
ease
of
appr
oxim
atel
y 5,
000
user
da
ys [3
.0%
])
Slig
htly
ad
vers
e (D
ecre
ase
of
appr
oxim
atel
y 10
,000
use
r da
ys [-
5.0%
])
Slig
htly
adv
erse
(D
ecre
ase
of
appr
oxim
atel
y 11
,000
use
r da
ys [-
5.5%
])
No
chan
ge
(Dec
reas
e of
le
ss th
an 3
00
user
day
s [-0
.1%
])
Slig
htly
be
nefic
ial
(Incr
ease
of
~5,0
00 u
ser
days
[2.5
%])
No
chan
ge
(Incr
ease
of
300
user
day
s [-0
.1])
No
chan
ge
Incr
ease
of
1,00
0 us
er
days
[0.6
%])
Com
mer
cial
site
us
e 7
No
chan
ge
Tota
l use
Au
gust
thro
ugh
Oct
ober
is
3,80
0,00
0 us
er
days
Slig
htly
be
nefic
ial
(Incr
ease
of
~150
,000
use
r da
ys [4
.0%
])
Slig
htly
be
nefic
ial
(Incr
ease
of
~250
,000
use
r da
ys [7
.0%
])
Slig
htly
ad
vers
e (D
ecre
ase
of
~120
,000
use
r da
ys [-
3.0%
])
Slig
htly
be
nefic
ial
Incr
ease
of
47,0
00 u
ser
days
[1.2
%])
No
chan
ge
(Incr
ease
of
3,00
0 us
er d
ays
[0.1
%])
Slig
htly
be
nefic
ial
(Incr
ease
of
~250
,000
use
r da
ys [7
.0%
])
Slig
htly
be
nefic
ial
(Incr
ease
of
~250
,000
us
er d
ays
[7.0
%])
Slig
htly
be
nefic
ial
(Incr
ease
of
110,
000
user
da
ys [2
.8%
])
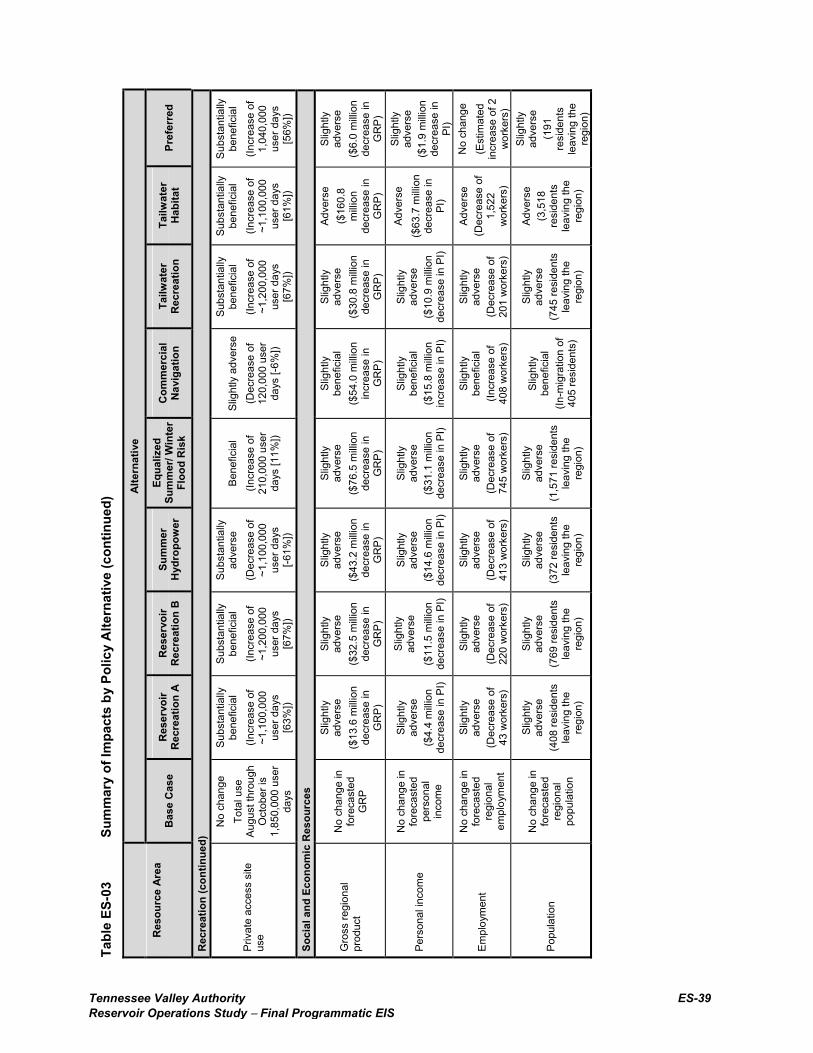
Tennessee Valley Authority ES-39Reservoir Operations Study − Final Programmatic EIS
Tabl
e ES
-03
Sum
mar
y of
Impa
cts
by P
olic
y A
ltern
ativ
e (c
ontin
ued)
Alte
rnat
ive
Res
ourc
e Ar
ea
Bas
e C
ase
Res
ervo
ir R
ecre
atio
n A
Res
ervo
ir R
ecre
atio
n B
Su
mm
er
Hyd
ropo
wer
Eq
ualiz
ed
Sum
mer
/ Win
ter
Floo
d R
isk
Com
mer
cial
N
avig
atio
n Ta
ilwat
er
Rec
reat
ion
Tailw
ater
H
abita
t Pr
efer
red
Rec
reat
ion
(con
tinue
d)
Priv
ate
acce
ss s
ite
use
No
chan
ge
Tota
l use
Au
gust
thro
ugh
Oct
ober
is
1,85
0,00
0 us
er
days
Subs
tant
ially
be
nefic
ial
(Incr
ease
of
~1,1
00,0
00
user
day
s [6
3%])
Subs
tant
ially
be
nefic
ial
(Incr
ease
of
~1,2
00,0
00
user
day
s [6
7%])
Subs
tant
ially
ad
vers
e (D
ecre
ase
of
~1,1
00,0
00
user
day
s [-6
1%])
Bene
ficia
l (In
crea
se o
f 21
0,00
0 us
er
days
[11%
])
Slig
htly
adv
erse
(D
ecre
ase
of
120,
000
user
da
ys [-
6%])
Subs
tant
ially
be
nefic
ial
(Incr
ease
of
~1,2
00,0
00
user
day
s [6
7%])
Subs
tant
ially
be
nefic
ial
(Incr
ease
of
~1,1
00,0
00
user
day
s [6
1%])
Subs
tant
ially
be
nefic
ial
(Incr
ease
of
1,04
0,00
0 us
er d
ays
[56%
])
Soci
al a
nd E
cono
mic
Res
ourc
es
Gro
ss re
gion
al
prod
uct
No
chan
ge in
fo
reca
sted
G
RP
Slig
htly
ad
vers
e ($
13.6
milli
on
decr
ease
in
GR
P)
Slig
htly
ad
vers
e ($
32.5
milli
on
decr
ease
in
GR
P)
Slig
htly
ad
vers
e
($43
.2 m
illion
de
crea
se in
G
RP)
Slig
htly
ad
vers
e ($
76.5
milli
on
decr
ease
in
GR
P)
Slig
htly
be
nefic
ial
($54
.0 m
illion
in
crea
se in
G
RP)
Slig
htly
ad
vers
e ($
30.8
milli
on
decr
ease
in
GR
P)
Adve
rse
($
160.
8 m
illion
de
crea
se in
G
RP)
Slig
htly
ad
vers
e ($
6.0
milli
on
decr
ease
in
GR
P)
Pers
onal
inco
me
No
chan
ge in
fo
reca
sted
pe
rson
al
inco
me
Slig
htly
ad
vers
e ($
4.4
milli
on
decr
ease
in P
I)
Slig
htly
ad
vers
e ($
11.5
milli
on
decr
ease
in P
I)
Slig
htly
ad
vers
e ($
14.6
milli
on
decr
ease
in P
I)
Slig
htly
ad
vers
e
($31
.1 m
illion
de
crea
se in
PI)
Slig
htly
be
nefic
ial
($15
.8 m
illion
in
crea
se in
PI)
Slig
htly
ad
vers
e ($
10.9
milli
on
decr
ease
in P
I)
Adve
rse
($63
.7 m
illion
de
crea
se in
PI
)
Slig
htly
ad
vers
e ($
1.9
milli
on
decr
ease
in
PI)
Empl
oym
ent
No
chan
ge in
fo
reca
sted
re
gion
al
empl
oym
ent
Slig
htly
ad
vers
e (D
ecre
ase
of
43 w
orke
rs)
Slig
htly
ad
vers
e (D
ecre
ase
of
220
wor
kers
)
Slig
htly
ad
vers
e (D
ecre
ase
of
413
wor
kers
)
Slig
htly
ad
vers
e (D
ecre
ase
of
745
wor
kers
)
Slig
htly
be
nefic
ial
(Incr
ease
of
408
wor
kers
)
Slig
htly
ad
vers
e (D
ecre
ase
of
201
wor
kers
)
Adve
rse
(Dec
reas
e of
1,
522
wor
kers
)
No
chan
ge
(Est
imat
ed
incr
ease
of 2
w
orke
rs)
Popu
latio
n
No
chan
ge in
fo
reca
sted
re
gion
al
popu
latio
n
Slig
htly
ad
vers
e (4
08 re
side
nts
leav
ing
the
regi
on)
Slig
htly
ad
vers
e (7
69 re
side
nts
leav
ing
the
regi
on)
Slig
htly
ad
vers
e (3
72 re
side
nts
leav
ing
the
regi
on)
Slig
htly
ad
vers
e (1
,571
resi
dent
s le
avin
g th
e re
gion
)
Slig
htly
be
nefic
ial
(In-m
igra
tion
of
405
resi
dent
s)
Slig
htly
ad
vers
e (7
45 re
side
nts
leav
ing
the
regi
on)
Adve
rse
(3
,518
re
side
nts
leav
ing
the
regi
on)
Slig
htly
ad
vers
e
(191
re
side
nts
leav
ing
the
regi
on)
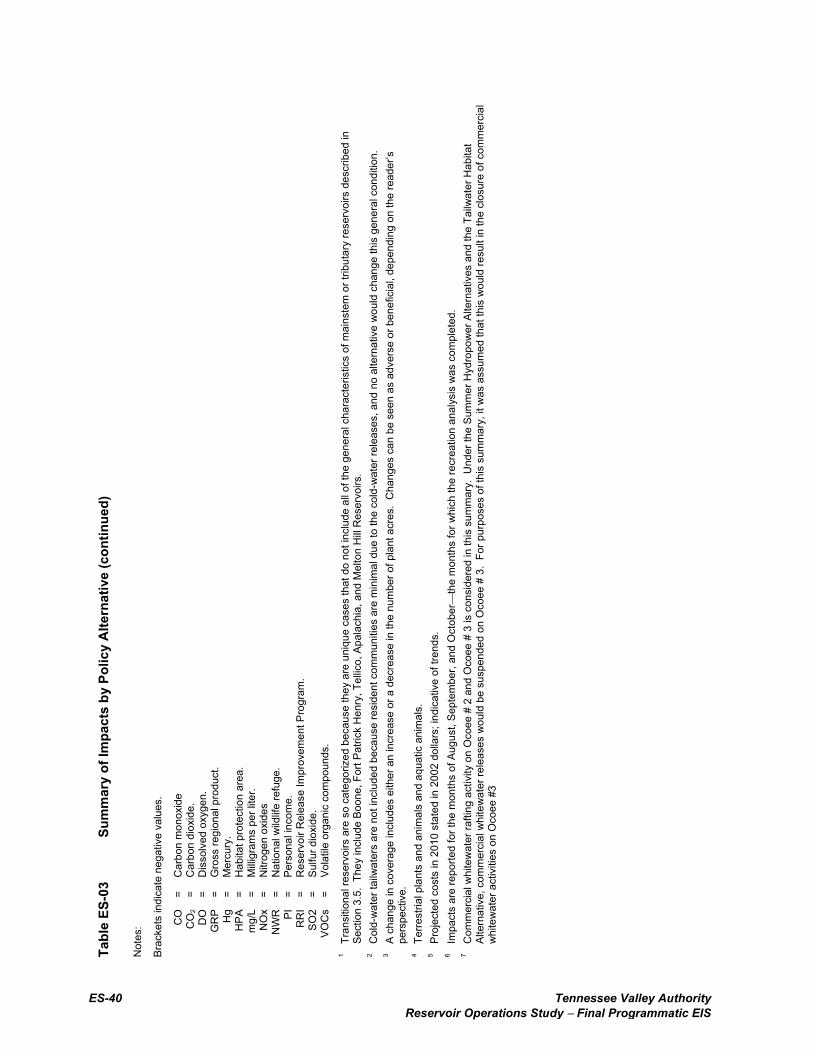
ES-40 Tennessee Valley Authority Reservoir Operations Study − Final Programmatic EIS
Tabl
e ES
-03
Sum
mar
y of
Impa
cts
by P
olic
y A
ltern
ativ
e (c
ontin
ued)
N
otes
:
Brac
kets
indi
cate
neg
ativ
e va
lues
.
C
O
= C
arbo
n m
onox
ide
C
O2
= C
arbo
n di
oxid
e.
D
O
= D
isso
lved
oxy
gen.
GR
P =
Gro
ss re
gion
al p
rodu
ct.
H
g =
Mer
cury
.
HPA
=
Hab
itat p
rote
ctio
n ar
ea.
m
g/L
= M
illigr
ams
per l
iter.
N
Ox
= N
itrog
en o
xide
s
NW
R
= N
atio
nal w
ildlif
e re
fuge
.
PI
= Pe
rson
al in
com
e.
R
RI
= R
eser
voir
Rel
ease
Impr
ovem
ent P
rogr
am.
SO
2 =
Sulfu
r dio
xide
.
VOC
s =
Vola
tile
orga
nic
com
poun
ds.
1 Tr
ansi
tiona
l res
ervo
irs a
re s
o ca
tego
rized
bec
ause
they
are
uni
que
case
s th
at d
o no
t inc
lude
all
of th
e ge
nera
l cha
ract
eris
tics
of m
ains
tem
or t
ribut
ary
rese
rvoi
rs d
escr
ibed
in
Sect
ion
3.5.
The
y in
clud
e Bo
one,
For
t Pat
rick
Hen
ry, T
ellic
o, A
pala
chia
, and
Mel
ton
Hill
Res
ervo
irs.
2
Col
d-w
ater
tailw
ater
s ar
e no
t inc
lude
d be
caus
e re
side
nt c
omm
uniti
es a
re m
inim
al d
ue to
the
cold
-wat
er re
leas
es, a
nd n
o al
tern
ativ
e w
ould
cha
nge
this
gen
eral
con
ditio
n.
3 A
chan
ge in
cov
erag
e in
clud
es e
ither
an
incr
ease
or a
dec
reas
e in
the
num
ber o
f pla
nt a
cres
. C
hang
es c
an b
e se
en a
s ad
vers
e or
ben
efic
ial,
depe
ndin
g on
the
read
er’s
pe
rspe
ctiv
e.
4 Te
rrest
rial p
lant
s an
d an
imal
s an
d aq
uatic
ani
mal
s.
5 Pr
ojec
ted
cost
s in
201
0 st
ated
in 2
002
dolla
rs; i
ndic
ativ
e of
tren
ds.
6 Im
pact
s ar
e re
porte
d fo
r the
mon
ths
of A
ugus
t, Se
ptem
ber,
and
Oct
ober
the
mon
ths
for w
hich
the
recr
eatio
n an
alys
is w
as c
ompl
eted
. 7
Com
mer
cial
whi
tew
ater
rafti
ng a
ctiv
ity o
n O
coee
# 2
and
Oco
ee #
3 is
con
side
red
in th
is s
umm
ary.
Und
er th
e Su
mm
er H
ydro
pow
er A
ltern
ativ
es a
nd th
e Ta
ilwat
er H
abita
t Al
tern
ativ
e, c
omm
erci
al w
hite
wat
er re
leas
es w
ould
be
susp
ende
d on
Oco
ee #
3.
For p
urpo
ses
of th
is s
umm
ary,
it w
as a
ssum
ed th
at th
is w
ould
resu
lt in
the
clos
ure
of c
omm
erci
al
whi
tew
ater
act
iviti
es o
n O
coee
#3


![Food security and nutrition: building a global narrative ... · EXECUTIVE SUMMARY EXECUTIVE SUMMARY EXECUTIVE SUMMARY EXECUTIVE SUMMAR Y [ 2 ] This document contains the Summary and](https://static.documents.pub/doc/80x56/5ff5433612d22125fb06e6b5/food-security-and-nutrition-building-a-global-narrative-executive-summary-executive.jpg)


