154
Review of the Northern Territory Sentencing Amendment (Mandatory Minimum Sentences) Act 2013
Review of the Northern Territory Sentencing Amendment (Mandatory
Minimum Sentences) Act 2013
December 2015

Mandatory Minimum Sentencing Review
“Review of the Northern Territory Sentencing Amendment (Mandatory Minimum Sentences) Act 2013”
Prepared for the Department of the Attorney-General and Justice byCarolyn Whyte, Joe Yick, Dee-Ann Vahlberg and Leonique Swart.
©Northern Territory of Australia, 2015Criminal Justice Research and Statistics UnitDepartment of the Attorney-General and Justice
All rights reserved
While all reasonable care has been taken in the preparation of this paper, the authors do not warrant or represent that it is free from errors or omissions.
The views expressed in this paper are not necessarily those of the Northern Territory Government.
Suggested citation:
Whyte, C, Yick, J, Vahlberg, D & Swart, L. 2015. Review of the Northern Territory Sentencing Amendment (Mandatory Minimum Sentences) Act 2013. Department of the Attorney-General and Justice, Darwin.
i
Acknowledgements
The authors would like to thank the officers in the Department of the Attorney-General and Justice, the Northern Territory Police and the Department of Correctional Services who were involved in developing the review framework, identifying relevant measures and issues and providing feedback on the draft report, and to the officers of the Criminal Justice Research and Statistics Unit who checked and reviewed the document.
A limited round of consultation on the draft report was undertaken within the justice sector, and the authors thank those who provided feedback, including submissions on sentencing and crime reduction policy. These submissions have been referred to the Legal Policy Unit of the Department of the Attorney-General and Justice for further consideration.
ii
Contents1. Executive Summary...........................................................................................................1
1.1 Background................................................................................................................1
1.2 Changes likely to be associated with mandatory sentencing.....................................1
1.3 Areas where no conclusive impacts seen as a result of mandatory sentencing........1
1.4 Conclusions................................................................................................................2
2. Definitions.........................................................................................................................4
3. Introduction......................................................................................................................6
3.1 Legislation..................................................................................................................6
3.2 Evidence base............................................................................................................8
3.3 Context.................................................................................................................... 10
3.4 Scope....................................................................................................................... 12
4. Methodology...................................................................................................................13
4.1 Program logic...........................................................................................................13
4.2 Data......................................................................................................................... 13
4.3 Counting rules..........................................................................................................14
5. Results.............................................................................................................................15
5.1 To what extent has mandatory minimum sentencing resulted in a reduction in violent offending?.............................................................................................................. 15
5.2 To what extent has mandatory minimum sentencing resulted in a reduction in violent re-offending?..........................................................................................................23
5.3 To what extent have mandatory minimum imprisonment sentences been imposed for violent offences?...........................................................................................................33
5.4 To what extent has mandatory minimum sentencing contributed to a consistent standard of sentencing for violent offences?.....................................................................40
5.5 To what extent has mandatory minimum sentencing caused impacts on the operations or processes of prosecutions, courts, and corrections?...................................52
6. Discussion....................................................................................................................... 64
6.1 Offending and re-offending.....................................................................................64
6.2 Sentencing...............................................................................................................65
6.3 Justice system operations........................................................................................67
6.4 Context.................................................................................................................... 68
iii
7. References...................................................................................................................... 71
8. Appendix 1......................................................................................................................75
9. Appendix 2......................................................................................................................76
9.1 Assumptions............................................................................................................ 76
9.2 Outcomes.................................................................................................................76
9.3 Program logic model................................................................................................78
10. Appendix 3...................................................................................................................79
10.1 Sentence length...................................................................................................79
10.2 Re-offending.........................................................................................................81
11. Appendix 4...................................................................................................................83
iv
Mandatory Minimum Sentencing Review
1. Executive Summary
1.1 Background
The Sentencing Amendment (Mandatory Minimum Sentences) Act 2013 was implemented on 1 May 2013.
The Act introduced mandatory minimum prison terms for certain violent offences. This document reviews administrative data recorded through the Northern Territory
justice system (NT Police, Department of the Attorney-General and Department of Correctional Services) to examine the impact of the legislation on offending, re-offending, sentencing and justice operations in the Northern Territory.
1.2 Changes likely to be associated with mandatory sentencing
There was a small increase in the percentage of first-time violent offenders who received fixed-term imprisonment sentences following the introduction of the new provisions (Figure 21).
There was an immediate and sustained shift towards fixed-term imprisonment sentences rather than partially suspended sentences for repeat violent offenders (Figure 22).
The average full-term and minimum prison sentence lengths for repeat violent offenders who were sentenced in the Court of Summary Jurisdiction increased by 15% and 29%, respectively, in the two years following the introduction of mandatory minimum sentences (Figure 25).
The sentencing outcome, measured as the percentage of offenders sentenced to fixed-term and partially suspended imprisonment, became more consistent for Indigenous and non-Indigenous male offenders and for Indigenous male and female offenders, although the percentages only fully converged for Indigenous and non-Indigenous male repeat violent offenders (Figure 27 and Figure 28).
The average length of sentences given to Indigenous and non-Indigenous male repeat offenders became less consistent (diverged) in the period immediately following mandatory sentencing, although more recently the sentence lengths for the two groups appear to be reconverging (Figure 36 to Figure 37).
The average time to finalise adult violent offence defendants pleading guilty in the Court of Summary Jurisdiction increased by an average of 19 days (30%) in the year following mandatory sentencing (Figure 44).
1
1.3 Areas where no conclusive impacts seen as a result of mandatory sentencing
While a substantial decrease in violent offences recorded by Police occurred several months following mandatory sentencing, this is thought to be the result of another initiative (Figure 2 to Figure 4).
A significant decrease in violent reoffending occurred for male Indigenous offenders released from prison after serving time for assault offences committed in the new mandatory sentencing regime (Figure 12). However, as with the decline in offending, this decline is thought to be the result of another initiative.
Mandatory sentencing did not result in an increase in the overall percentage of first-time violent offenders sent to prison, due to an ongoing and apparently unrelated drop in the percentage of these offenders receiving partially suspended sentences (Figure 21).
The percentage of repeat violent offenders sentenced to prison was 96 per cent in the two years prior to mandatory sentencing and unchanged in the 15 months following mandatory sentencing (Figure 22).
Mandatory sentencing had no apparent impact on average sentence lengths for first-time violent offenders sentenced in the Court of Summary Jurisdiction (Figure 26), or for violent offenders sentenced in the Supreme Court (Figure 24).
The time to finalise violent defendants in the Supreme Court did not show a material change following mandatory sentencing (Figure 46).
Prisoner numbers did not rise following the implementation of mandatory sentencing. The number of prisoners in custody for assault fell below its projected level two months prior to mandatory sentencing. While prisoner numbers temporarily returned to the projected level several months after mandatory sentencing was implemented, they did not rise above the projected values as was expected (Figure 54).
1.4 Conclusions
Offending and re-offending dropped following the introduction of mandatory minimum prison terms for violent offences, but this is thought to be due to another crime reduction initiative.
The introduction of mandatory minimum prison terms:o did not increase the overall percentage of violent offenders sentenced to prison,
although it did result in changes to the type of imprisonment option used;o led to an increase in sentence length for repeat violent offenders sentenced in
the Court of Summary Jurisdiction, but not for first-time violent offenders or offenders sentenced in the Supreme Court;
o was followed by an increase in the consistency of sentence outcome and sentence length for repeat violent offenders, but had relatively little impact on consistency of outcomes for first-time offenders;
2
o resulted in an increase in the length of time and number of court appearances required to finalise defendants who pled guilty, and may have contributed to a decrease in the percentage of defendants with a final plea of guilty;
o did not lead to an increase in the number of prisoners held for assault offences (the majority of violent offences).
The Northern Territory already mandated actual imprisonment for serious violent offences and for repeat violent offenders; the new law added minimum prison terms for particular situations. The results seen in this review are specific to the Northern Territory context, and the offending and sentencing landscapes should be considered when assessing whether similar results might occur in another jurisdiction.
3
2. Definitions
For the purposes of this report, the following definitions apply.
“actual imprisonment” has the meaning outlined in section 78DG of the Sentencing Act, which is that the court:
(a) must record a conviction against the offender; and(b) must sentence the offender to a term of imprisonment; and(c) may make an order under section 40 or 44 of the Sentencing Act in relation to part,
but not the whole of, the term of imprisonment.
In practical terms, this means that part, but not the whole, of the imprisonment term may be suspended. If no minimum term applies, the length of the unsuspended term may be as short as one day and may only include time spent in custody in police or court cells.
“finalisation time” means the number of days from the first court appearance for a defendant until the defendant’s offences are finalised (e.g. guilt is determined and the sentence, if guilty, given), but excludes any subsequent time involved in appeals.
“fixed-term imprisonment” refers to imprisonment for a specified length of time, without suspension of part of that term (although parole may be given).
“full term” refers to the maximum prison time to which an offender is sentenced for all violent offences in a sentencing occasion. The full term may not be served if an offender is offered parole or given a partially suspended sentence.
“minimum term” refers to the minimum prison time an offender must serve for all violent offences in a sentencing occasion. The minimum time to serve may represent the non-parole period of a fixed-term sentence or the non-suspended part of a partially suspended sentence. Otherwise, the minimum term equals the full term.
“most serious offence” refers to the offence classified as the “most serious” for a defendant, offender or prisoner, who may have several offences for which s/he is charged, sentenced or imprisoned. For defendants and remand prisoners, the most serious offence is determined using the National Offence Index (Australian Bureau of Statistics 2009). For sentenced offenders, the most serious offence is determined based on the offence attracting the highest penalty, and then the National Offence Index.
“physical harm” has the meaning defined in section 78C of the Sentencing Act, namely that in relation to a person, physical harm means a physical injury that interferes with the person’s health.
4
“prior conviction” for a violent offence refers to any prior conviction for a violent offence, whenever the offence was committed (as stated in Division 6A of the Sentencing Act), including offences committed as a youth or in another jurisdiction. For the purposes of this analysis, “prior conviction” includes only convictions recorded in the Northern Territory Integrated Justice Information System (IJIS), which has reasonably complete data back to approximately 1994 and some data prior to that. This means that there may be some offenders with very old prior convictions, or prior convictions in other jurisdictions, who were treated as repeat offenders for sentencing, but who are treated as first-time offenders in this report. A finding of guilt where a conviction was not recorded is not counted as a prior conviction.
“sentencing occasion” for a defendant refers to a date on which one or more charges for a defendant are finalised, whether or not guilt or conviction is recorded. The charges may belong to one or several cases.
“violent offence” has the meaning defined in section 78C of the Sentencing Act, namely:
(a) an offence against a provision of the Criminal Code listed in Schedule 2 of the Sentencing Act; or
(b) an offence substantially corresponding to an offence mentioned in paragraph (a) against:
(i) a law that has been repealed; or(ii) a law of another jurisdiction (including a jurisdiction outside Australia).
See Appendix 1.
5
3. Introduction
3.1 Legislation
Mandatory minimum custodial sentences for certain violent offences were introduced in the Northern Territory in May 2013 through the Sentencing Amendment (Mandatory Minimum Sentences) Act 2013 (the Act).
The Act added to existing mandatory imprisonment provisions for violent offences in section 78BA of the Sentencing Act, which specified that a conviction and a term of actual imprisonment must be given to a person found guilty of a serious violent offence, or found guilty of a violent offence if the offender had been previously convicted of a violent offence. Other mandatory imprisonment provisions in current Northern Territory legislation include:
Section 157 of the Criminal Code Act (mandatory life imprisonment for an offender found guilty of murder);
Section 78F of the Sentencing Act (mandatory term of imprisonment for an offender found guilty of a sexual offence);
Section 37(2)-(3) of the Misuse of Drugs Act (actual imprisonment of not less than 28 days for certain offences);
Sections 121 and 122 of the Domestic and Family Violence Act (imprisonment for at least 7 days for persons found guilty of contravening a domestic violence order if the person has previously been found guilty of such an offence).
In some of these provisions, the minimum imprisonment penalty may not apply if the court is satisfied that it is not appropriate based on the specific circumstances of the case (e.g. section 37(2) of the Misuse of Drugs Act; section 121(3)(b) of the Domestic and Family Violence Act).
The Act imposed mandatory minimum prison sentences for specified violent offences, primarily assaults, and removed the ability of the court to suspend the sentence for the minimum period of time. A provision for exceptional circumstances was included in the Act, which allowed for an exemption from the mandatory minimum prison term, but still required a sentence of actual imprisonment to be imposed.
The intentions of the new provisions, based on the second reading speech, were to:
1. Increase the deterrence of the criminal law process by sending a message to serious and repeat violent offenders that they will serve a mandatory, genuine prison sentence;
2. Demonstrate to victims of serious violent offenders that perpetrators will suffer the consequence of imprisonment for their offences;
3. Maintain a consistent standard for sentencing for violent offences.
6
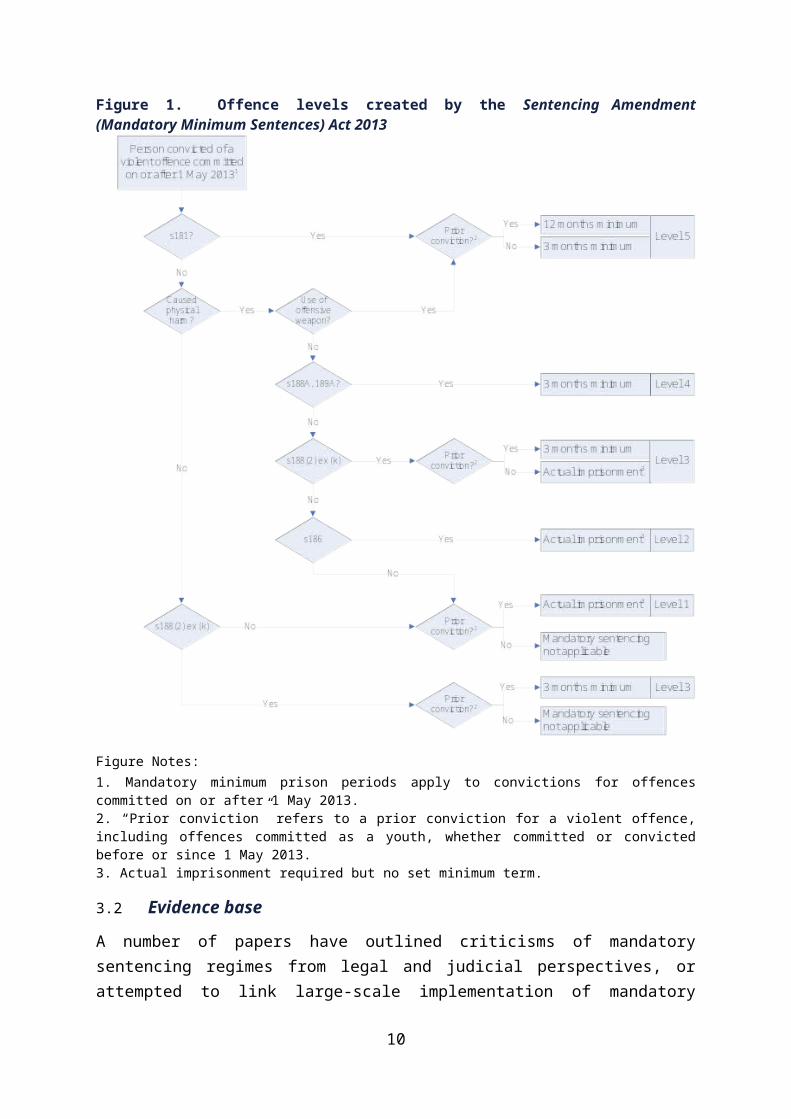
The Act created five levels of violent offences, based on the type of offence, whether the victim experienced physical harm and whether a weapon was used. Offenders previously convicted of a violent offence (including an offence committed as a youth) received a longer mandatory term than first-time violent offenders in some cases, with actual imprisonment but no set minimum term required for lower level offences; some lower level offences committed by a first-time offender were not subject to the new mandatory sentencing provisions. Figure 1 outlines the provisions associated with the five offence levels in the Act (section numbers refer to the Criminal Code Act).
Figure 1. Offence levels created by the Sentencing Amendment (Mandatory Minimum Sentences) Act 2013
Figure Notes:1. Mandatory minimum prison periods apply to convictions for offences committed on or after 1 May 2013. 2. “Prior conviction” refers to a prior conviction for a violent offence, including offences committed as a youth, whether committed or convicted before or since 1 May 2013.
7
3. Actual imprisonment required but no set minimum term.
3.2 Evidence base
A number of papers have outlined criticisms of mandatory sentencing regimes from legal and judicial perspectives, or attempted to link large-scale implementation of mandatory sentencing regimes to large-scale changes in offending. There are fewer studies that have attempted to quantify the deterrent effect of specific mandatory sentencing regimes or the impacts of such regimes on consistency in sentencing and criminal justice operational processes.
For mandatory sentencing to act as a deterrent to offending requires the penalties to be well-known to would-be offenders (Morgan 1999) and for would-be offenders to consciously avoid behaviour that would lead to the imposition of those penalties. The argument against the deterrent effect of mandatory minimum sentences, especially for violent offences, is that a large number of offenders may be considered as “irrational” (e.g. under the influence of alcohol, drugs, cognitive and mental health problems) at the time of offending. Thus, many of the offences are committed impulsively, without a great deal of forethought or understanding of the penalties involved (Law Institute of Victoria 2011).
In the Northern Territory, no deterrent effect on property crime in the community was observed between 1997, when mandatory minimum sentences for property offences were introduced, and 2001, when they were repealed (Office of Crime Prevention 2003). In fact, property offences increased during that period and decreased after the laws were repealed, although this may have been in response to factors that resulted in a reduction in property crime across Australia beginning in early 2001 (see Moffatt, Weatherburn & Donnelly 2005).
However, in other jurisdictions and internationally, there have been instances where the incidence of relevant crimes decreased following the introduction of various forms of mandatory sentencing laws. Views vary, however, as to whether the legislation was solely responsible for the observed changes.
In 1996, Western Australia introduced a “three strikes” mandatory sentencing law for repeat home burglary. The number of home burglaries consistently reduced following the introduction of this legislation (Morgan & Clare 2007). However, the decline appeared to commence before the legislation took effect, and other phenomena such as increased home security, neighbourhood programs and the introduction of initiatives such as the “Burglary Reduction Taskforce” were suspected of contributing to the decline.
Also in Western Australia, the introduction in 2009 of mandatory minimum sentences for police assaults was linked to a 33 per cent reduction in assaults on public officers (including police officers) over a four-year period (WA Government 2014). However these results were questioned as to whether the reduction resulted from the introduction of the legislation or
8
at least in part due to the manner in which offences were handled in the criminal justice system (Western Australian Police Union of Workers 2013).
A study of California’s “three strikes” legislation found that the felony arrest rate for criminals with “two strikes” was 17 to 20 per cent less than for persons tried for two felonies but only convicted for one (Helland & Tabarrok 2007), suggesting a deterrent effect for those closer to hitting the “three strikes” trigger.
Recently, a New South Wales study (Trevena & Weatherburn 2015) found that prison sentences up to 12 months given to persons who had no prior record of being sentenced to prison exerted no more deterrent effect than comparable community orders.
Consistency of sentencing outcomes is another argument put forward in favour of mandatory sentencing regimes. In theory, the mandatory minimum applies equally to everyone. However, other factors in and outside the justice system may result in mandatory sentencing contributing, or being perceived to contribute, to disparities in sentencing.
Starr and Rehavi (2012) found that sentences for African-American males under a mandatory sentencing regime were on average 10 per cent longer than for white males, after taking pre-charge characteristics into account. They attributed at least half of this outcome to prosecutorial bias in laying serious charges (which carried mandatory penalties) more often against African-American males. They argued that discretion still existed under the mandatory sentencing system, but that it had been shifted from the judiciary to the prosecution.
Under the Northern Territory mandatory sentencing regime for property offences (1997-2001), Indigenous adults were approximately 8.6 times as likely as non-Indigenous adults to receive a mandatory prison term (Office of Crime Prevention 2003). Indigenous people represented a greater proportion of sentenced offenders as the number of strikes increased, such 73 per cent of those receiving a first strike penalty, 86 per cent of those receiving a second strike penalty and 95 per cent of those receiving a third strike penalty were Indigenous. The differences stated above are not based on equal rates of Indigenous and non-Indigenous persons entering or re-entering the criminal justice system. Hence, the extent to which the Northern Territory mandatory sentencing scheme exacerbated Indigenous over-representation at sentencing, beyond the existing over-representation of Indigenous persons entering the justice system, is unclear.
Another issue associated with mandatory sentencing is an increase in government costs associated with the operation of the justice system. Court workload may increase as defendants choose to contest cases instead of pleading guilty. There may also be an impact on the appeal process, in that while there continues to be a right to appeal the conviction for an offence, “mandatory sentences prevent substantial review of the penalty” (Law
9
Council of Australia 2014). However, little quantitative evidence exists about these types of impacts on the criminal justice system.
An increase in the prison population is generally expected to occur under mandatory sentencing regimes. This is sometimes viewed as a positive element, in that increased incarceration may reduce crime through incapacitation of offenders (although results from US studies suggest that this effect is likely to be small at best, as summarised in Steman 2007). However, an increased prisoner population is generally not the object of mandatory sentencing regimes but rather an often inevitable outcome, and the high cost of imprisonment is usually seen to outweigh the benefits of temporary incapacitation of offenders.
In the Northern Territory, mandatory sentencing for property offences between 1997 and 2001 was estimated to have resulted in up to a 15 per cent increase to the prison population (Office of Crime Prevention 2003). A comparative study of the early part of the regime (Vahlberg 2000) found significant increases in the proportion of women and Indigenous persons received into prison with mandatory sentences for property offences between equivalent periods in 1997 and 1999, together with a large increase in the number of fine defaulters received into custody. The combination of both phenomena resulted in a significant increase in the number of people, especially Indigenous people, with a short length of stay in custody (less than 31 days) and an increase in the number of prisoners with mental health conditions, diabetes, high blood pressure and alcohol withdrawal.
The 2008 introduction of mandatory prison sentences for certain first-time violent offenders in the Northern Territory was estimated to have resulted in an additional 17 prisoners per day in the first year of operation, many fewer than had been expected (Jackson & Hardy 2010). The Northern Territory average daily prison population was 1,030 in 2008-09 (Department of Justice 2009). Hence, 17 additional prisoners represented less than two per cent of the total prison population of the time. In contrast, California’s 1994 “three strikes” legislation was associated with a 50 per cent increase in the prison population between 1993 and 1999 (Brown 2001).
3.3 Context
The Northern Territory criminal justice system is highly dynamic, with overlapping legislative and operational initiatives aimed at reducing offending or streamlining court procedures. This environment adds to the challenge of identifying changes that can reasonably be attributed to a specific initiative. Three initiatives that will be mentioned later as potential reasons for changes in violent offending or defendant behaviour are listed below.
Project Respect (NT Police), which began in early 2012, enforced a zero tolerance and pro-arrest policy in respect of family violence matters. This reinforced the need to charge an offender with a substantive assault offence where the circumstances warranted.
10
The Evidence (National Uniform Legislation) Act 2011, which took effect from January 2013, introduced a provision for defendants’ spouses or partners to object to giving evidence, and for the court to excuse them from doing so.
Point of Sale Interventions, previously known as Temporary Beat Locations (NT Police), began in 2012 in Alice Springs, although full lockdowns commenced for the first time in September 2013 in Tennant Creek; in Alice Springs in February 2014; and in December 2014 in Katherine. These interventions station officers outside takeaway liquor outlets to restrict the illegal consumption of alcohol either due to restricted areas under legislation or a breach of an order condition (for example, a Bail Order, Domestic Violence Order or an Alcohol Protection Order).
A complementary legislative initiative, the Alcohol Protection Orders Act 2013, was implemented in December 2013, giving Police the ability to place a person charged with committing qualifying alcohol-related offences on an Alcohol Protection Order, which restricts the person from possessing or consuming alcohol, or entering or being in licensed premises. Breaching an order is an offence, and Police are also able to seize and/or destroy alcohol unlawfully in the possession of a person subject to an Alcohol Protection Order. Due to the timing and interaction of the Point of Sale Interventions and Alcohol Protection Orders, it is not possible to distinguish between their potential effects. Where Point of Sale Interventions are mentioned elsewhere in the text, it is understood that these operate in conjunction with Alcohol Protection Orders.
In addition to the initiatives above, numerous programs aimed at improving responses to domestic violence, improving community safety and reducing re-offending in the Northern Territory have been progressively introduced in recent years. These include the:
Department of Correctional Services Violent Offender Treatment Program for high to moderately high risk offenders (2011);
Alice Springs Integrated Response to Family and Domestic Violence Project (2012); Department of Correctional Services “Sentenced to a Job” initiative (late 2012-early
2013); Domestic and Family Violence Strategy “Safety is Everyone’s Right” (2014), which
includes the implementation of Local Reference Groups, the Family Safety Framework, SupportLink, and outreach services;
Alcohol treatment programs, including mandatory alcohol treatment for those taken into Police protective custody three times in three months;
Department of Correctional Services Family Violence program (since 2014 in its current format);
Department of Correctional Services Violent Offender Treatment Program for low to moderate risk offenders (late 2014); and
11
NT Police-led Interagency Tasking and Coordination Groups, which focus on operational responses and proactive initiatives to address social order and community safety issues.
As many of these initiatives influence small groups of people at a time, they would not individually be expected to produce an immediate Territory-wide change in offending behaviour that would appear in the data. Together, however, they may contribute to a general change in violent offending with subsequent flow-on effects to courts and correctional services. The ongoing implementation of programs and initiatives in the Northern Territory to reduce violence and increase community safety should be considered as the underlying context for the analyses presented in this document.
3.4 Scope
The intent of this paper is to determine the extent to which the intentions of the Sentencing Amendment (Mandatory Minimum Sentences) Act 2013 have been realised. This review is statistical in nature, and covers issues able to be assessed through the analysis of administrative data recorded through the operations of the Northern Territory criminal justice system. Issues associated with the policy of mandatory sentencing regimes are outside the scope of the review. Interviews of offenders and victims to determine their understanding of and reaction to the legislation could not be accomplished with existing resources, and so also fell outside the scope of this review. It was noted that longer court cases can exacerbate victim trauma, and that the impact of the new provisions on the time to finalise violent offence cases could serve as a proxy indicator for victim impact.
12
4. Methodology
4.1 Program logic
The program logic model for the review (see Appendix 2) was developed in May 2014 by a multi-disciplinary team with members from the Department of the Attorney-General and Justice, Department of Correctional Services and Northern Territory Police.
Key questions of the review arising from the logic model are:
1. To what extent has mandatory minimum sentencing resulted in a reduction in violent offending?
2. To what extent has mandatory minimum sentencing resulted in a reduction in violent re-offending?
3. To what extent have mandatory minimum imprisonment sentences been imposed for violent offences?
4. To what extent has mandatory minimum sentencing contributed to a consistent standard of sentencing for violent offences?
5. To what extent has mandatory minimum sentencing caused impacts on the operations or processes of prosecutions, courts, and corrections?
The first four questions examine the intended outcomes of the legislation, while the last examines potential unintended outcomes.
4.2 Data
The data for this review were sourced from the Northern Territory Police Real-Time Online Management and Information System (PROMIS); the Integrated Justice Information System (IJIS) of the Department of the Attorney-General and Justice; and the Integrated Offender Management System (IOMS) of the Department of Correctional Services.
The date ranges used in the analyses vary based on the requirements of the analysis undertaken. For most analyses the time period begins with offences committed from May 2011, two years prior to the introduction of mandatory sentencing; the end date for the analysis depends on the processes involved.
For analyses of recorded offences, violent offence cases and prisoner numbers, data through June-August 2015 (the entire dataset available at the time of the analysis) were used. For analyses of court processes in the Court of Summary Jurisdiction, data were used for offences committed through July 2014, as a significant proportion of defendants who committed offences in more recent months had not been finalised at the time of analysis. For analyses of court processes in the Supreme Court, data for offences through May 2014 were used, due to the longer times to finalise defendants. For analysis of re-offending, data
13
could only be used for the first year of mandatory sentencing (through April 2014); two earlier years were added to give a broader picture of the variability in the data.
4.3 Counting rules
4.3.1 Court outcomeIf the defendant was found guilty of one or more charges in a sentencing occasion, the defendant was counted as “found guilty”. If the defendant was not found guilty of any charges and was found not guilty of one or more charges, the defendant was counted as “found not guilty”. If neither of those cases applied and at least one offence was dismissed, discharged, set aside or struck out but not withdrawn by the prosecution, the defendant was counted as “discharged/dismissed”. Defendants were counted as “withdrawn” (having all charges withdrawn by the prosecution) if each violent offence heard in the sentencing occasion received an outcome of withdrawn (or nolle prosequi in the Supreme Court).
4.3.2 Sentence outcomeThe sentence outcome for defendants was assessed for all the violent offence charges finalised in the sentencing occasion, whether those offences occurred in one or multiple cases. The most serious outcome given in the sentencing occasion was used as the outcome for the defendant. Outcomes in order of seriousness were: actual imprisonment (fixed-term or partially suspended sentence); home detention; fully suspended imprisonment; community work order; fine, levy or restitution order; and other orders (such as a good behaviour bond). Where a defendant was sentenced to imprisonment, the terms given in the sentencing occasion were either all fixed-term, all partially suspended or all fully suspended.
The first sentence outcome for each offence was used. If a sentence was later appealed, the appeal result was not included. If an offence resulted in a suspended sentence and the offender was later brought to court and given a restoration of the suspended sentence, due to breach of conditions or commission of another offence, only the initial sentence outcome was considered for the purposes of these analyses, and not the restored sentence.
4.3.3 Sentence lengthAnalysis of sentence length was complicated by the variety of ways in which sentences can be specified and recorded. The full term and minimum term sentence lengths were estimated on an offender basis, for all the violent offences in a sentencing occasion. The details of the methods used to determine sentence length are described in Appendix 3.
4.3.4 Re-offendingFor the purposes of this analysis, re-offending was measured as the percentage of convicted assault offenders who were apprehended for a new Schedule 2 violent offence within a year of release from court or release from prison. Assault offences comprise the majority of
14
violent offences committed in the Northern Territory. Details of the methods for the re-offending analysis are described in Appendix 3.
15
5. Results
5.1 To what extent has mandatory minimum sentencing resulted in a reduction in violent offending?
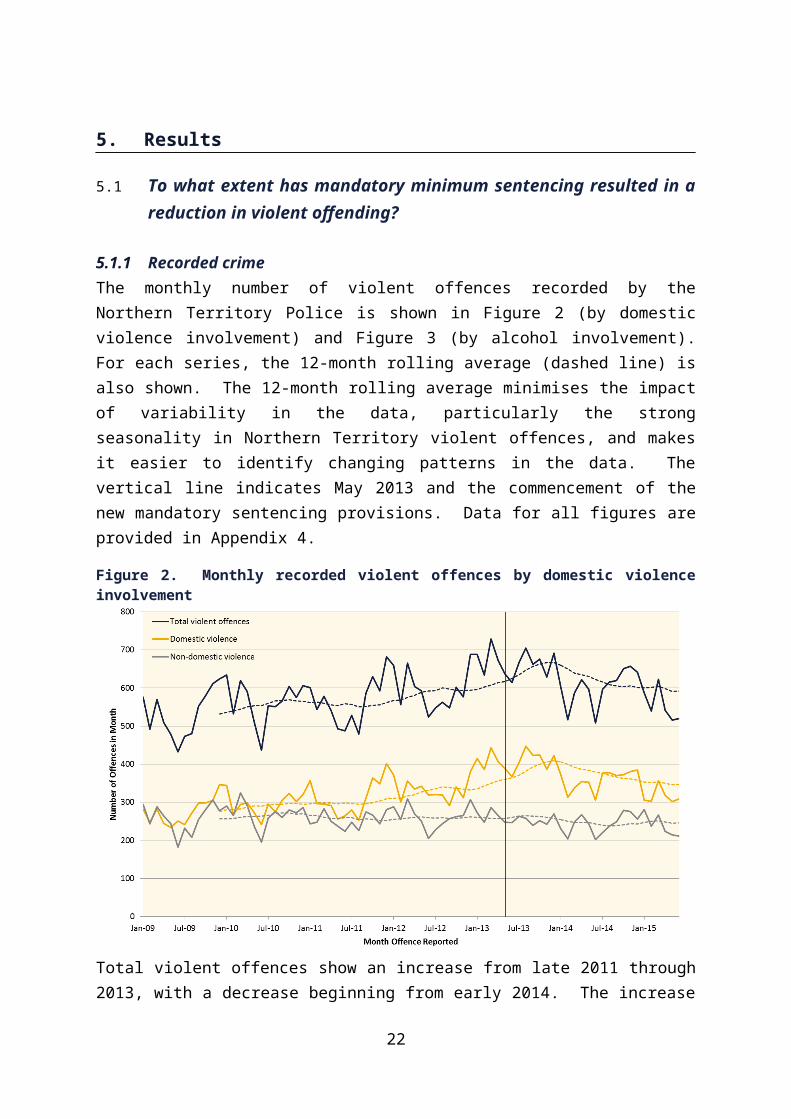
5.1.1 Recorded crimeThe monthly number of violent offences recorded by the Northern Territory Police is shown in Figure 2 (by domestic violence involvement) and Figure 3 (by alcohol involvement). For each series, the 12-month rolling average (dashed line) is also shown. The 12-month rolling average minimises the impact of variability in the data, particularly the strong seasonality in Northern Territory violent offences, and makes it easier to identify changing patterns in the data. The vertical line indicates May 2013 and the commencement of the new mandatory sentencing provisions. Data for all figures are provided in Appendix 4.
Figure 2. Monthly recorded violent offences by domestic violence involvement
Total violent offences show an increase from late 2011 through 2013, with a decrease beginning from early 2014. The increase is apparent in offences associated with domestic violence (Figure 2). This coincides with the timing of the Project Respect initiative. In contrast, non-domestic violence offences during this period remained relatively steady.
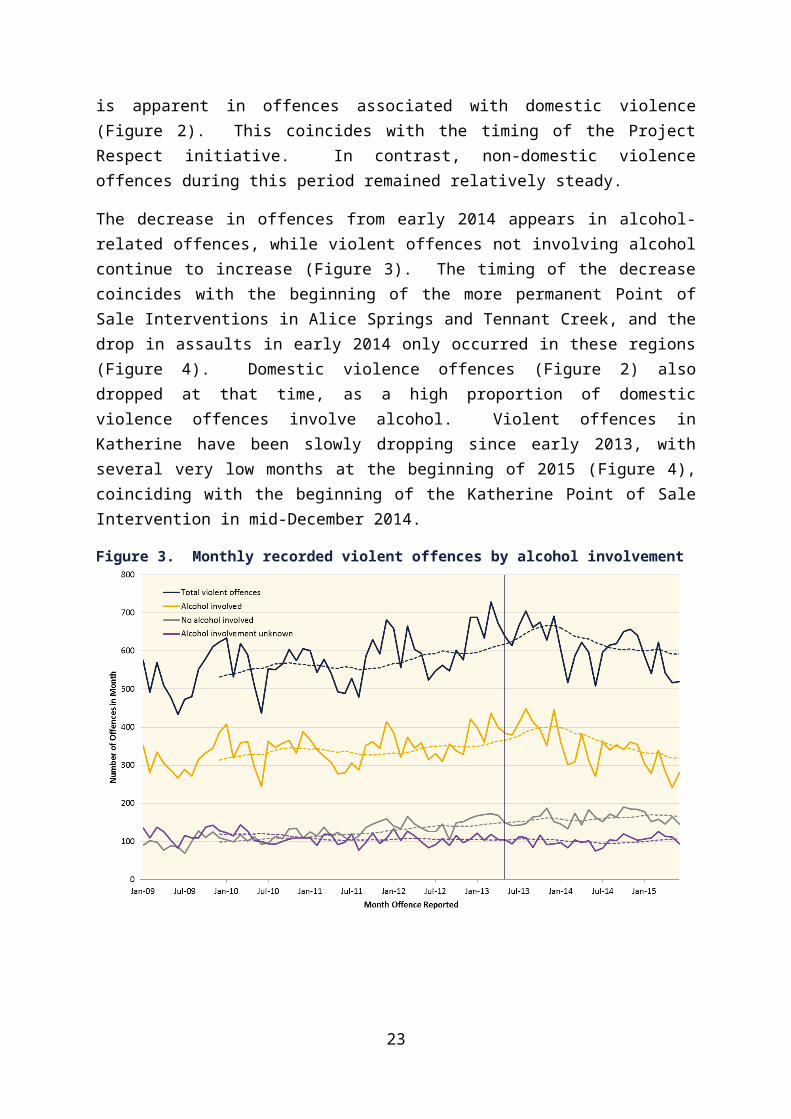
The decrease in offences from early 2014 appears in alcohol-related offences, while violent offences not involving alcohol continue to increase (Figure 3). The timing of the decrease coincides with the beginning of the more permanent Point of Sale Interventions in Alice Springs and Tennant Creek, and the drop in assaults in early 2014 only occurred in these regions (Figure 4). Domestic violence offences (Figure 2) also dropped at that time, as a high
16
proportion of domestic violence offences involve alcohol. Violent offences in Katherine have been slowly dropping since early 2013, with several very low months at the beginning of 2015 (Figure 4), coinciding with the beginning of the Katherine Point of Sale Intervention in mid-December 2014.
Figure 3. Monthly recorded violent offences by alcohol involvement
Figure 4. Monthly recorded violent offences by region committed
Violent offences show a decline from early 2014, particularly in alcohol-related offences and offences in Alice Springs and Tennant Creek.
17
The decline is likely to be associated with the Point of Sale Interventions in Alice Springs and Tennant Creek, rather than the mandatory sentencing provisions.
5.1.2 Offenders before the courtsThe number of violent offence cases started (prosecutions commenced) for adult defendants in the Northern Territory courts is shown in Figure 5. The new mandatory minimum imprisonment periods do not apply to youths, as stated in Section 78DH(2) of the Sentencing Act, and hence the analyses in this report are confined to adults only. Appendix4 includes the number of violent offence cases started for youth defendants; nearly all youth defendants had no prior violent convictions.
Figure 5. Number of violent offence cases started for adult defendants by Indigenous status
As with the offence data, a substantial increase in new violent offence cases occurred from early 2012, coinciding with the NT Police Project Respect initiative. The decrease from 2014 is likely to be associated with the Point of Sale Interventions. Neither Indigenous nor non-Indigenous defendants showed a change in pattern at the time the new mandatory minimum sentences were introduced.
If the new mandatory sentencing provisions do have a deterrent effect, it might be expected to be greatest for persons with no or one prior violent offence conviction. For these groups, the new minimum terms might represent the greatest change from previous sentencing practice: first-time defendants face a greater risk of receiving a material prison term, while defendants with one previous conviction face not only mandated prison time but in most cases a guaranteed minimum term. Defendants with multiple prior convictions are already likely to face a material prison sentence if convicted. Hence, the deterrent effect might manifest itself as a reduction in first- and second-time violent defendants, relative to total
18
defendants. Given that the absolute number of cases shows considerable variation over the period (Figure 5), the data in the subsequent figures have been expressed as percentages of total cases to better show changes in the composition of defendants.
Figure 6 shows the percentage of violent offence cases started for adult defendants having zero, one or two or more prior violent convictions at the time the offence was committed 1. Dashed lines show the 12-month rolling averages for the percentages.
Figure 6. Percentage of violent offence cases for defendants by number of prior violent offence convictions
While there is little change in the percentage of cases for adult defendants with one prior conviction, the percentage of cases for defendants with no prior convictions does show a slight, gradual decrease in the two years following the commencement of the new mandatory sentencing provisions, while the percentage of cases for defendants with two or more prior convictions shows a slight, gradual increase. These data are further examined by Indigenous status and region in the following figures.
1 For the determination of the applicable mandatory sentencing penalty, the presence of a prior conviction is relative to the date of the new conviction (e.g. whether the person has a prior conviction at the time of sentencing). For the analysis of deterrence in this section, however, the number of prior convictions was assessed at the time the offence was committed.
19
Figure 7 shows violent offence cases started for non-Indigenous adult defendants, based on the percentage with no, one or two or more prior violent offence convictions. At the time the new mandatory sentencing provisions commenced, nearly 80 per cent of all cases started for non-Indigenous defendants were for those with no prior violent offence convictions. There is a very slight drop in this percentage in late 2014, but it rose again in early 2015.
Figure 7. Percentage of violent offence cases for non-Indigenous defendants by number of prior violent offence convictions
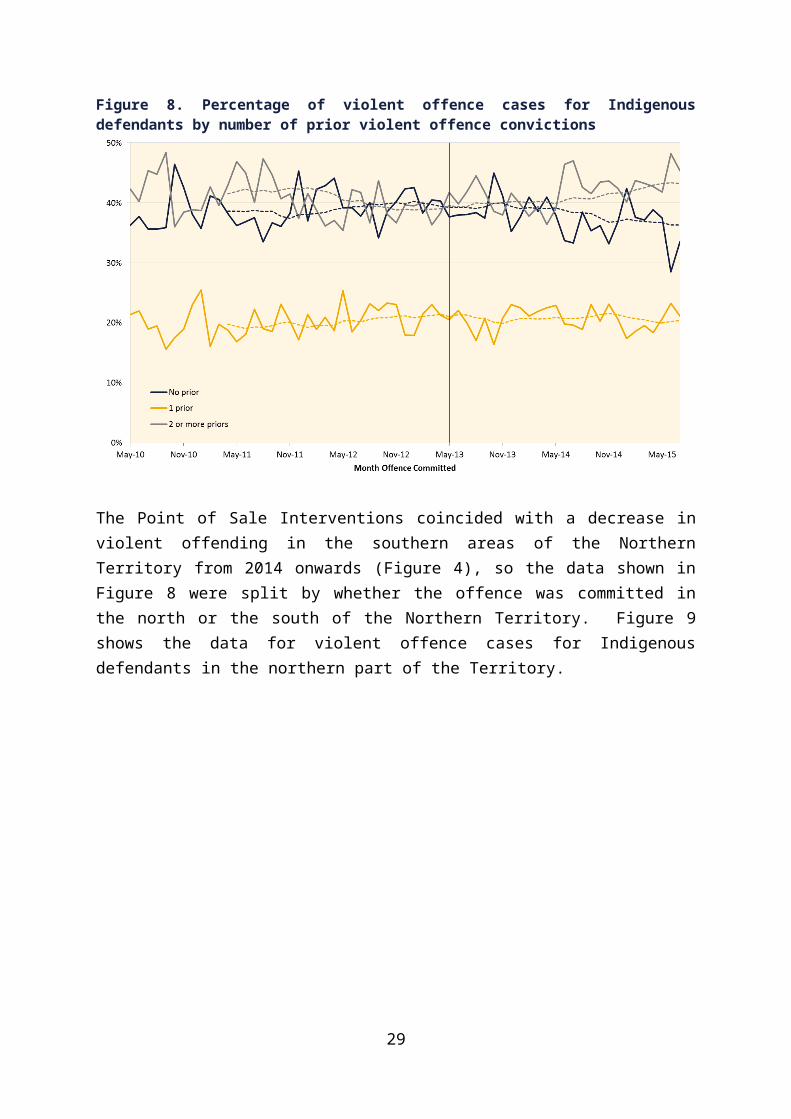
Figure 8 shows the same breakdown for Indigenous adult defendants. Compared with the situation for non-Indigenous defendants, first-time violent offence defendants accounted for a much smaller percentage of cases, while defendants with at least two prior convictions accounted for a much greater percentage. The percentage of cases started for defendants with no prior convictions began to decline slightly around May 2014, with a subsequent slight increase in the percentage of cases for defendants with two or more prior violent offence convictions.
20
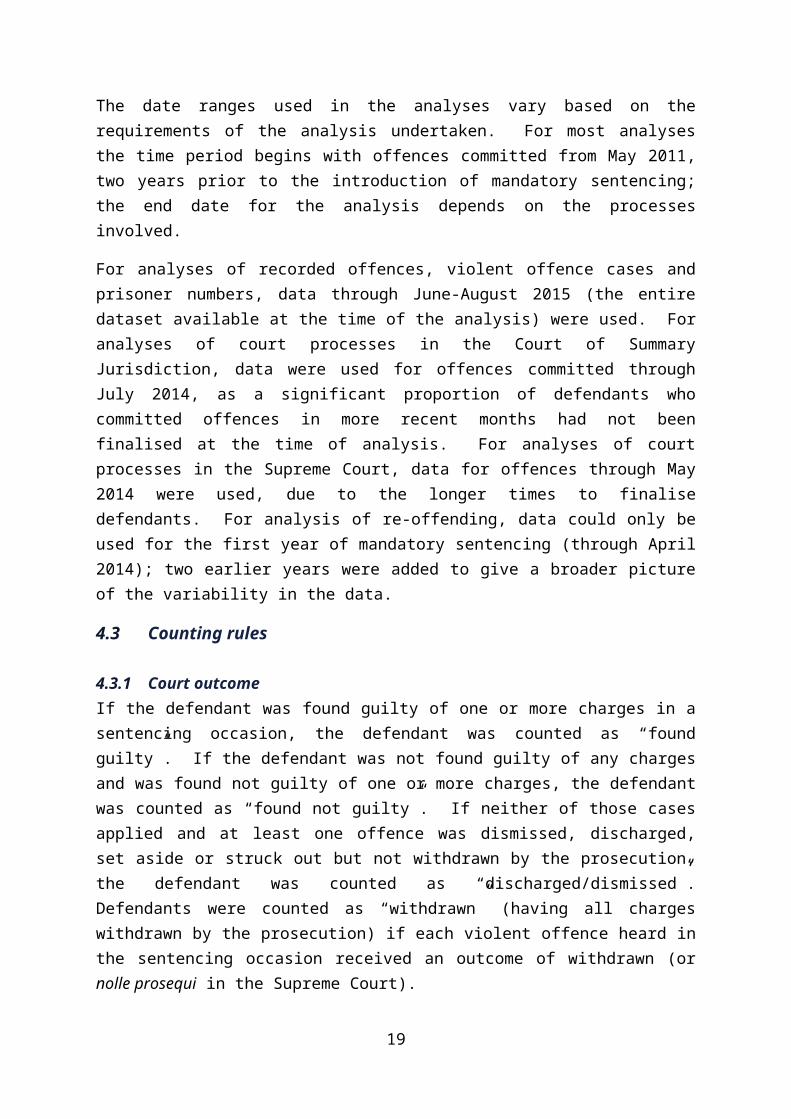
Figure 8. Percentage of violent offence cases for Indigenous defendants by number of prior violent offence convictions
The Point of Sale Interventions coincided with a decrease in violent offending in the southern areas of the Northern Territory from 2014 onwards (Figure 4), so the data shown in Figure 8 were split by whether the offence was committed in the north or the south of the Northern Territory. Figure 9 shows the data for violent offence cases for Indigenous defendants in the northern part of the Territory.
Figure 9. Percentage of violent offence cases for Indigenous defendants with varying numbers of prior violent offence convictions – northern part of the Territory
21

In the north, the percentage of cases beginning for adult Indigenous defendants with one prior violent offence conviction increased during 2012, with an associated decrease in cases for defendants with two or more prior violent offence convictions. Following the commencement of the new mandatory sentencing provisions, cases having defendants with one prior conviction dropped to the previous level (around 20 per cent of total cases). The percentage of cases in which the defendant had no prior conviction shows a gradual increase up to early 2014, with a subsequent decrease after that, and an associated increase in the percentage of cases for defendants with two or more prior convictions. Overall, the percentages of all three categories in mid-2015 are similar to those in 2011.
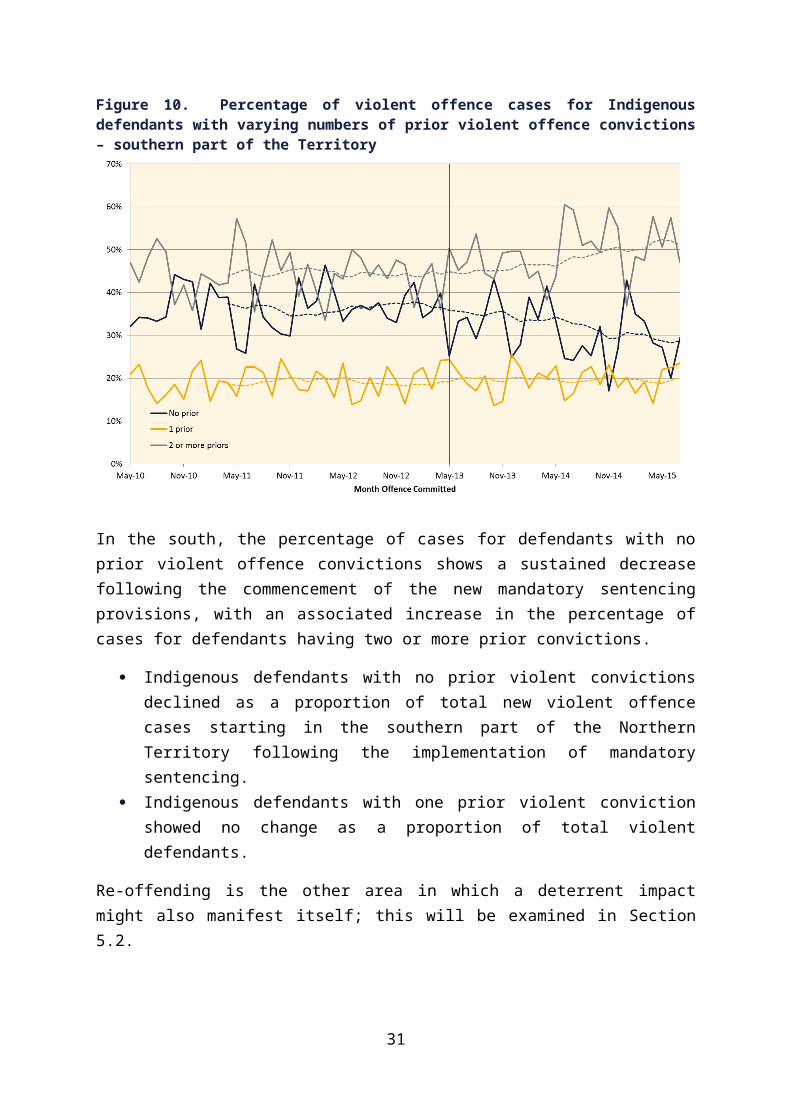
Figure 10 shows the data for violent offence cases started for Indigenous defendants in the southern part of the Territory.
Figure 10. Percentage of violent offence cases for Indigenous defendants with varying numbers of prior violent offence convictions – southern part of the Territory
In the south, the percentage of cases for defendants with no prior violent offence convictions shows a sustained decrease following the commencement of the new mandatory sentencing provisions, with an associated increase in the percentage of cases for defendants having two or more prior convictions.
Indigenous defendants with no prior violent convictions declined as a proportion of total new violent offence cases starting in the southern part of the Northern Territory following the implementation of mandatory sentencing.
Indigenous defendants with one prior violent conviction showed no change as a proportion of total violent defendants.
22

Re-offending is the other area in which a deterrent impact might also manifest itself; this will be examined in Section 5.2.
5.1.3 Summary: violent offending The number of violent offences recorded began to decrease seven months after the
implementation of the new mandatory sentencing provisions; however, this decrease is assumed to be associated with another initiative and unlikely to be related to the mandatory sentencing changes.
There was a noticeable decrease in the percentage of new violent offence cases started for Indigenous defendants with no prior violent offence convictions in the southern part of the Territory. This is one of the groups for which a deterrent effect would be expected as a result of mandatory sentencing. This decrease began at the time the new mandatory minimum sentencing provisions commenced.
No similar change was observed for Indigenous defendants in the northern part of the Territory or for non-Indigenous defendants; neither did defendants with one prior violent offence, a group that also might respond to a deterrent effect of mandatory sentencing, decrease as a percentage of total defendants in new violent offence cases beginning after mandatory sentencing commenced. The change for Indigenous defendants in the southern part of the Territory may have been a response to a local initiative, rather than a deterrent effect of mandatory sentencing.
23
5.2 To what extent has mandatory minimum sentencing resulted in a reduction in violent re-offending?
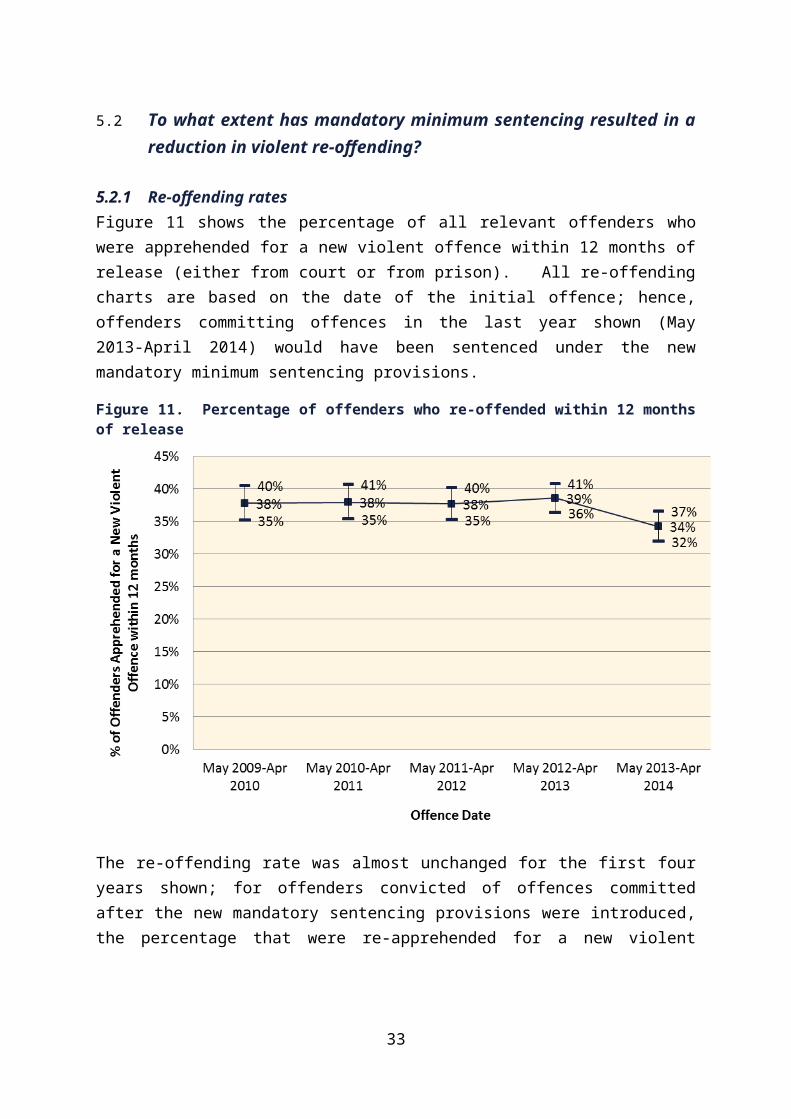
5.2.1 Re-offending ratesFigure 11 shows the percentage of all relevant offenders who were apprehended for a new violent offence within 12 months of release (either from court or from prison). All re-offending charts are based on the date of the initial offence; hence, offenders committing offences in the last year shown (May 2013-April 2014) would have been sentenced under the new mandatory minimum sentencing provisions.
Figure 11. Percentage of offenders who re-offended within 12 months of release
The re-offending rate was almost unchanged for the first four years shown; for offenders convicted of offences committed after the new mandatory sentencing provisions were introduced, the percentage that were re-apprehended for a new violent offence within 12 months of release was significantly2 less than in each of the previous years.
As re-offending rates in the Northern Territory are known to differ by previous criminal history, gender and Indigenous status, the following charts show results for Indigenous and non-Indigenous males, and Indigenous females, based on whether the offenders served
2 Statistical significance in this section means a p-value of 0.05 or less was returned using a chi-square test. The p-value indicates the probability that the difference observed between the re-offending percentages could be a result of random chance. Where the p-value is 0.05 or less, there is at most a 5 per cent chance that the difference in the percentages is due to chance.
24
prison time after their conviction or were released straight from court. There were too few non-Indigenous female offenders to calculate separate re-offending rates.
Figure 12 shows the percentage of male Indigenous offenders released from prison who re-offended within 12 months.
Figure 12. Re-offending by male Indigenous offenders released from prison
Male Indigenous offenders who committed offences in the first four years shown had nearly identical rates of re-offending within a year of release. For those who committed offences from May 2013 to April 2014, the percentage who re-offended within 12 months was significantly less than for those who committed offences in each of the four previous years.
25
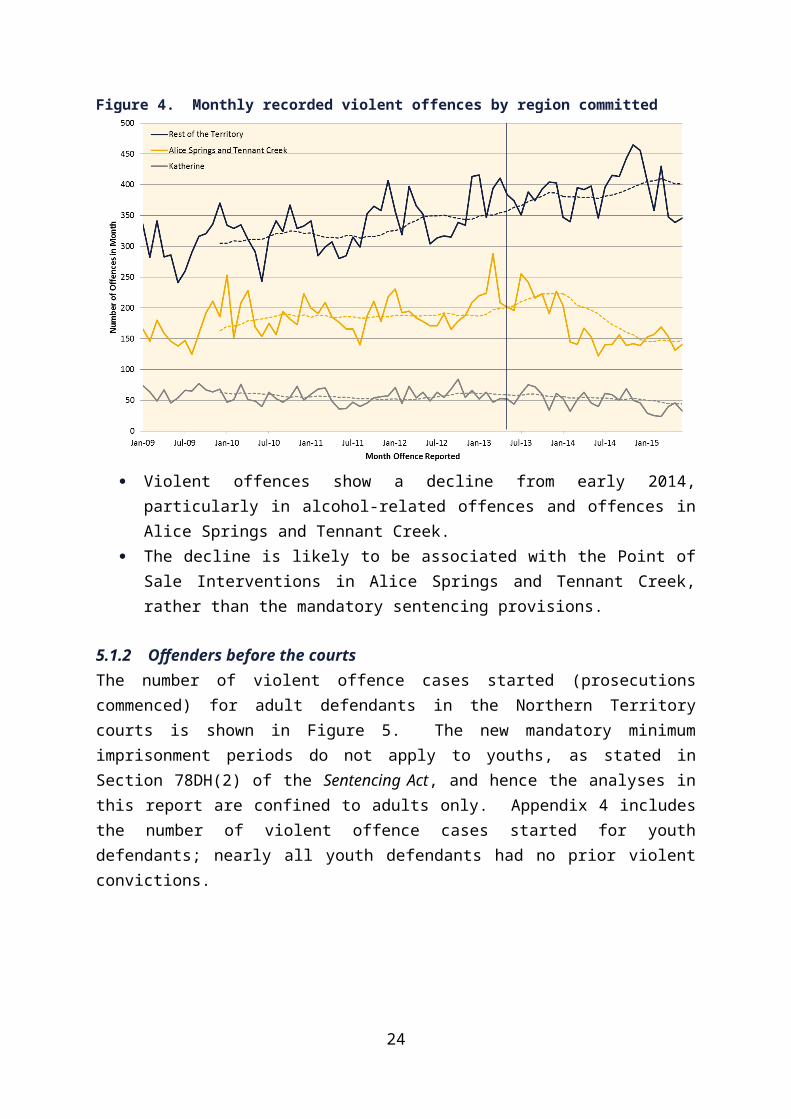
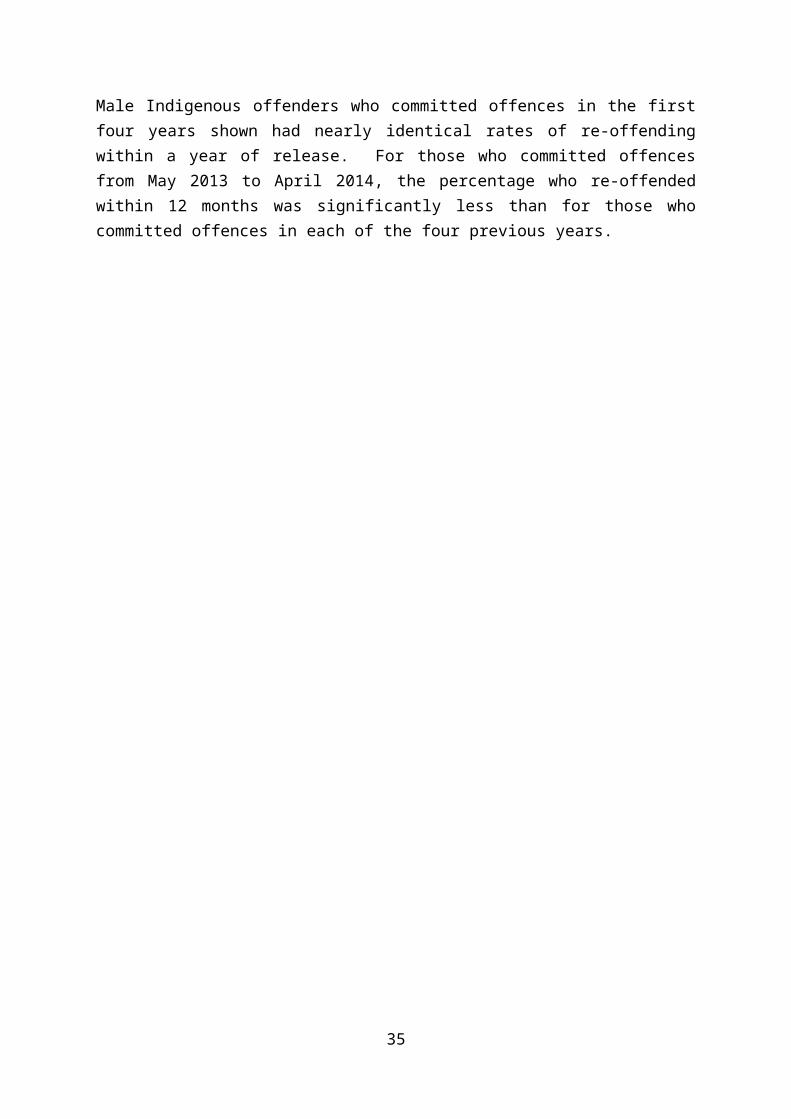
Figure 13 shows the percentage of male Indigenous offenders released from court who re-offended within 12 months.
Figure 13. Re-offending by male Indigenous offenders released from court
Male Indigenous offenders who committed offences from May 2013 to April 2014 had a lower re-offending rate than those who offended in previous years, although the difference was only statistically significant when compared with those who committed offences from May 2010 to April 2011.
Those released from court were significantly less likely to re-offend than those released from prison (Figure 12) in the same year. This should not be interpreted as solely an impact of imprisonment. A higher proportion of repeat offenders than first-time offenders serve prison time for violent offences (discussed later in Section 5.3.1), and re-offending propensity tends to increase with longer criminal histories (e.g. Ross & Guarnieri 1996, as well as observations from unpublished Northern Territory re-offending data). Hence, it makes sense that re-offending by persons released from court, who have a lesser history of violent offences, was less than for those released from prison, who have longer offending histories.
26
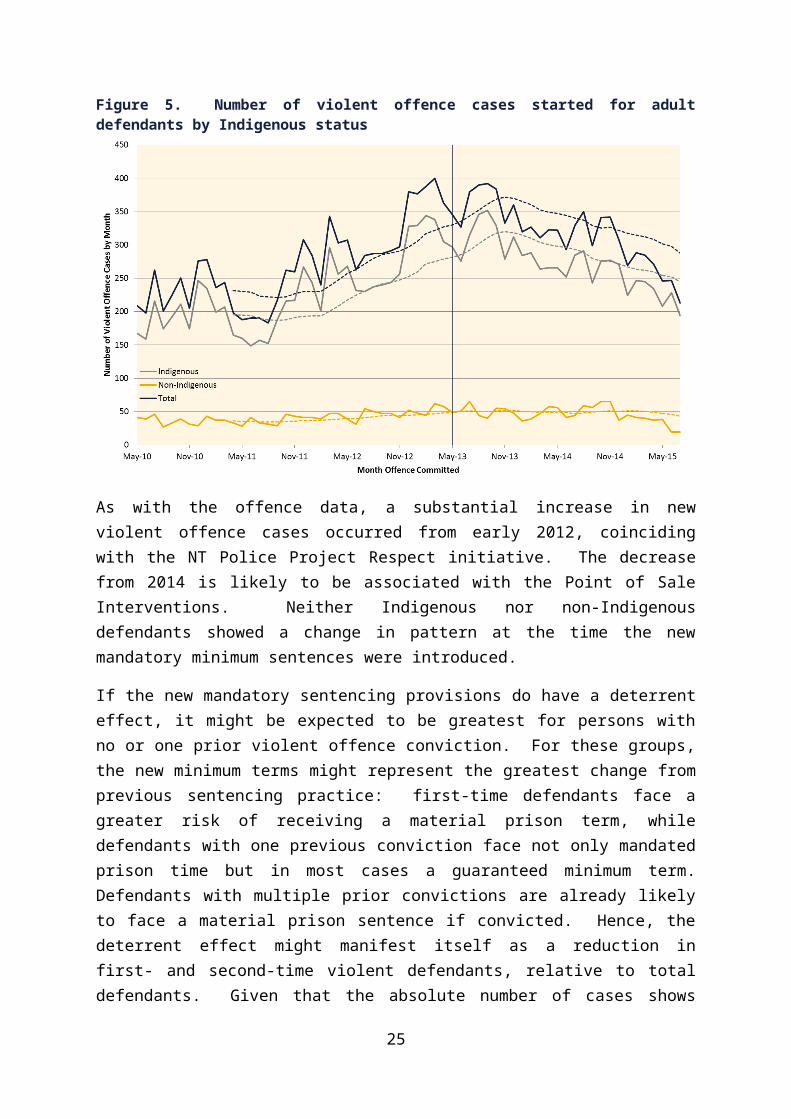
Figure 14 shows the percentage of male non-Indigenous offenders released from prison who re-offended within 12 months.
Figure 14. Re-offending by male non-Indigenous offenders released from prison
The re-offending rate for male non-Indigenous offenders who committed offences from May 2013 to April 2014 was greater than in the four previous years, although the difference was only statistically significant when compared with those who offended from May 2011 to April 2012. The re-offending rates following release from prison for Indigenous and non-Indigenous males who committed offences in May 2013-April 2014 were similar.
27
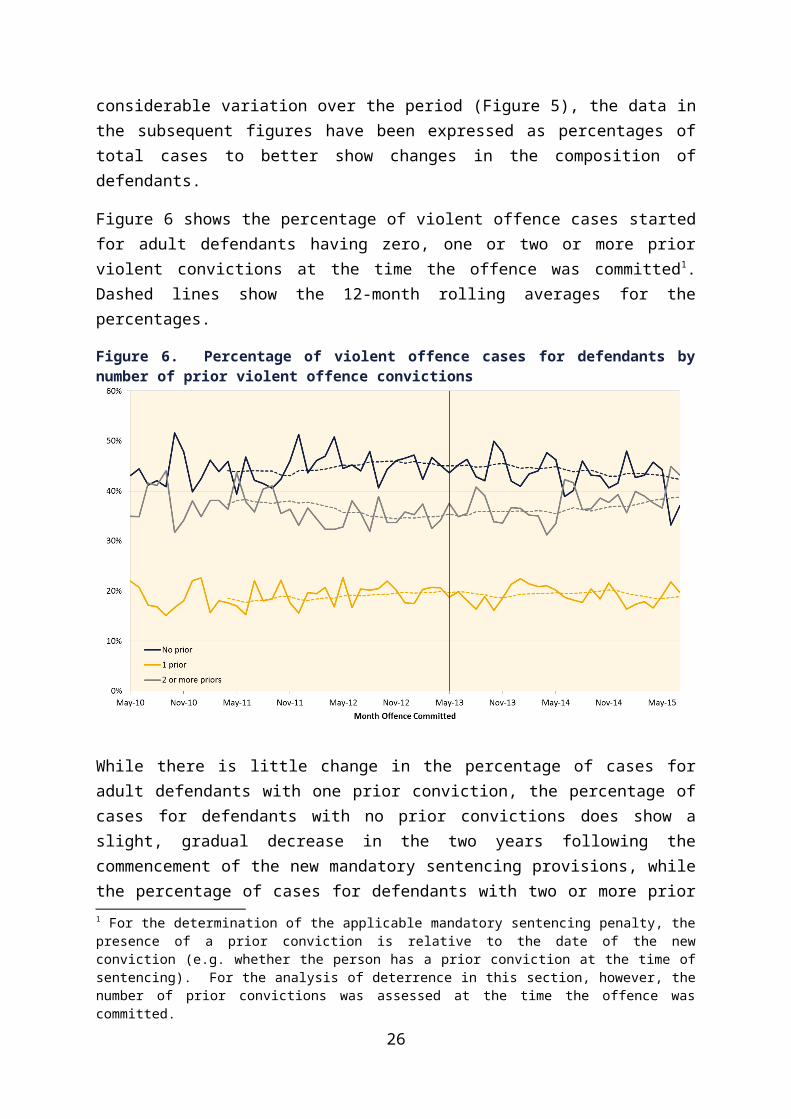
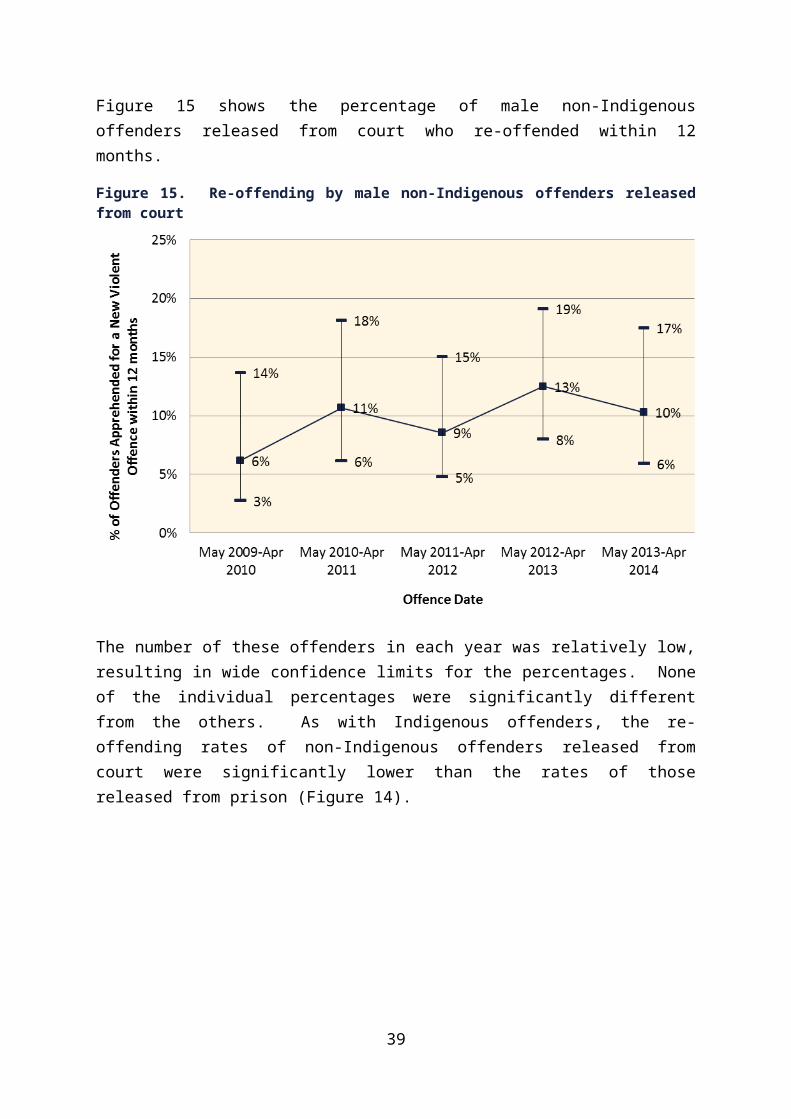
Figure 15 shows the percentage of male non-Indigenous offenders released from court who re-offended within 12 months.
Figure 15. Re-offending by male non-Indigenous offenders released from court
The number of these offenders in each year was relatively low, resulting in wide confidence limits for the percentages. None of the individual percentages were significantly different from the others. As with Indigenous offenders, the re-offending rates of non-Indigenous offenders released from court were significantly lower than the rates of those released from prison (Figure 14).
28

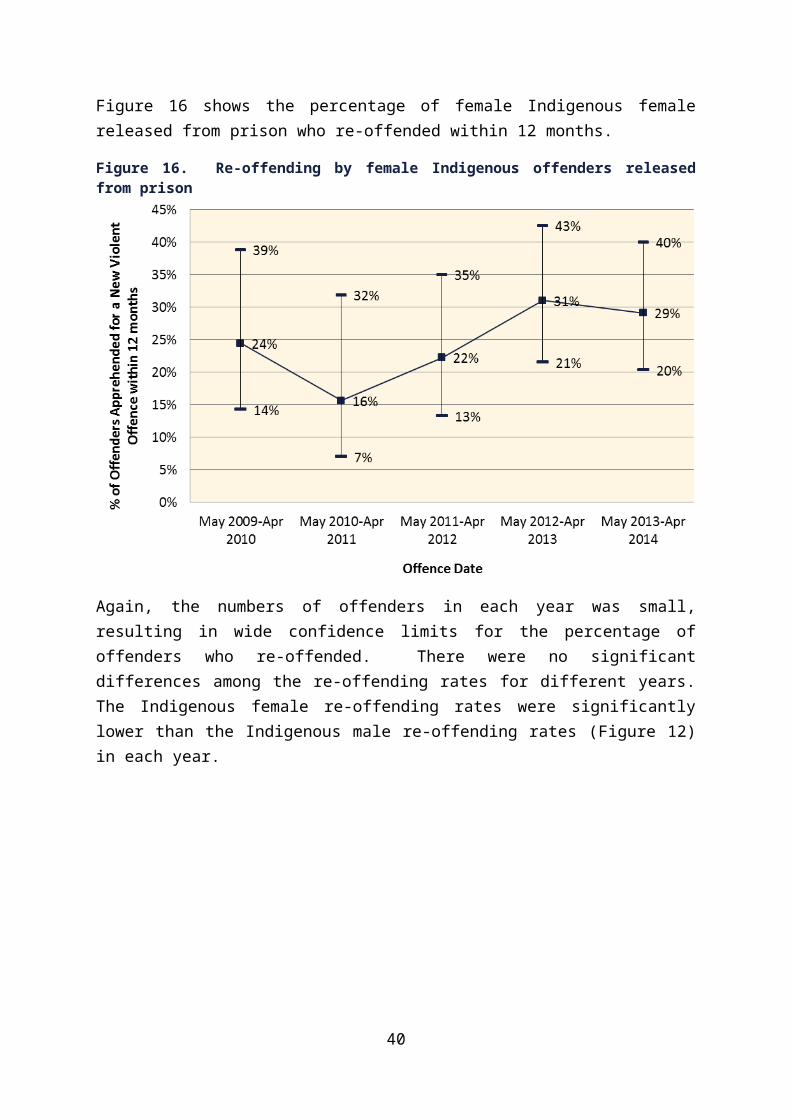
Figure 16 shows the percentage of female Indigenous female released from prison who re-offended within 12 months.
Figure 16. Re-offending by female Indigenous offenders released from prison
Again, the numbers of offenders in each year was small, resulting in wide confidence limits for the percentage of offenders who re-offended. There were no significant differences among the re-offending rates for different years. The Indigenous female re-offending rates were significantly lower than the Indigenous male re-offending rates (Figure 12) in each year.
29
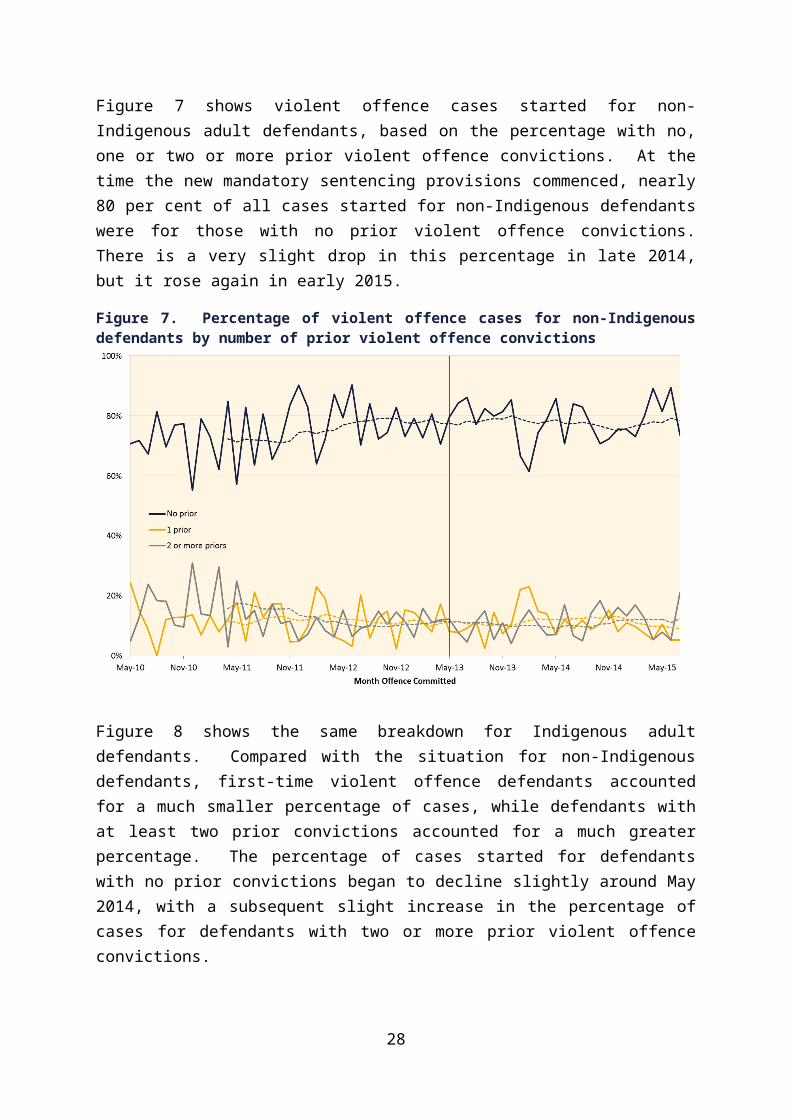
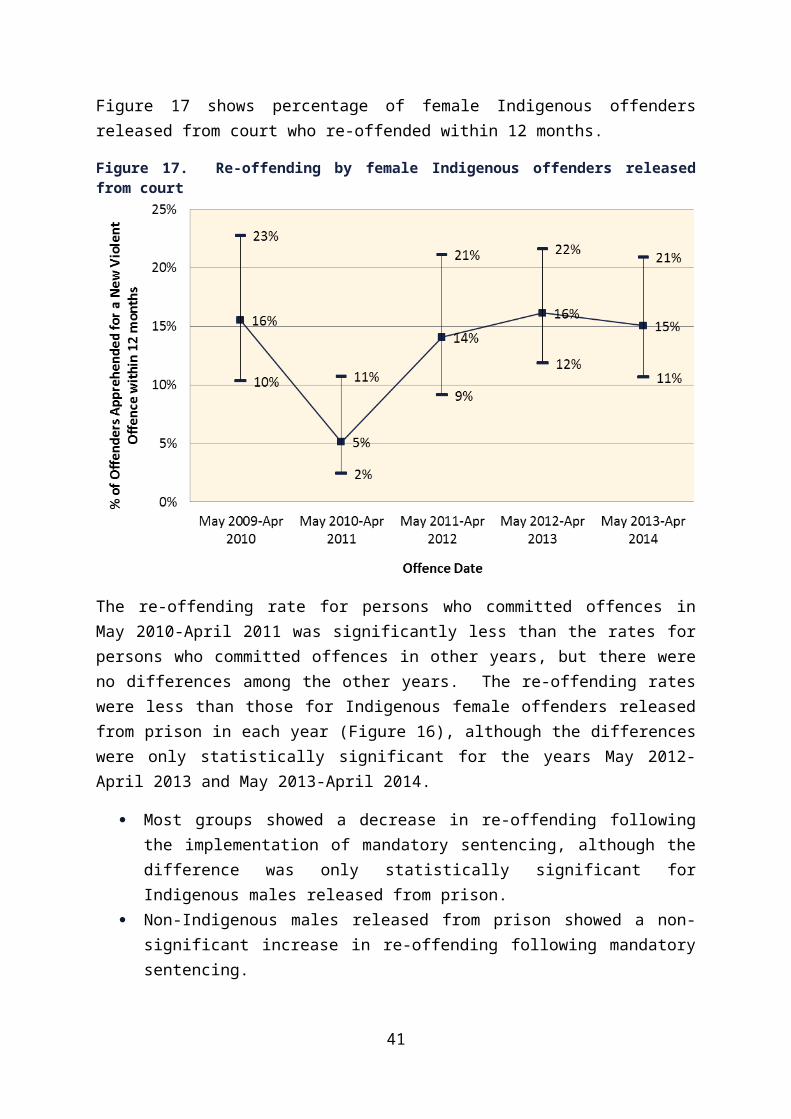
Figure 17 shows percentage of female Indigenous offenders released from court who re-offended within 12 months.
Figure 17. Re-offending by female Indigenous offenders released from court
The re-offending rate for persons who committed offences in May 2010-April 2011 was significantly less than the rates for persons who committed offences in other years, but there were no differences among the other years. The re-offending rates were less than those for Indigenous female offenders released from prison in each year (Figure 16), although the differences were only statistically significant for the years May 2012-April 2013 and May 2013-April 2014.
Most groups showed a decrease in re-offending following the implementation of mandatory sentencing, although the difference was only statistically significant for Indigenous males released from prison.
Non-Indigenous males released from prison showed a non-significant increase in re-offending following mandatory sentencing.
This suggests the drop in re-offending for Indigenous males is likely due to factors other than mandatory sentencing, which should impact on Indigenous and non-Indigenous alike.
30
Persons who committed an offence in the months of May 2013-April 2014 and spent time in prison after conviction would likely have a significant proportion, if not all, of the 12-month assessment period falling in 2014 onwards. In the southern parts of the Territory, the Point of Sale Interventions were implemented on a larger scale from late 2013-early 2014, and from late 2014 a Point of Sale Intervention initiative was also operational in Katherine. These initiatives coincided with a drop in violent offences (Figure 3 and Figure 4) as well as a decrease in violent offence cases started for Indigenous defendants (Figure 5).
Figure 18, Figure 19 and Figure 20 show re-offending rates by male Indigenous offenders released from prison, based on the location of the main court3 (Darwin, Katherine or Alice Springs, respectively) from which the offenders were convicted.
Figure 18. Re-offending by male Indigenous offenders released from prison – Darwin
3 Darwin is the main court for courts in East Arnhem, West Arnhem, the Tiwi Islands, Daly River and Wadeye; Katherine is the main court for courts in the Victoria River District and Roper Gulf Region; and Alice Springs is the main court for courts in the Central and Barkly Districts.
31
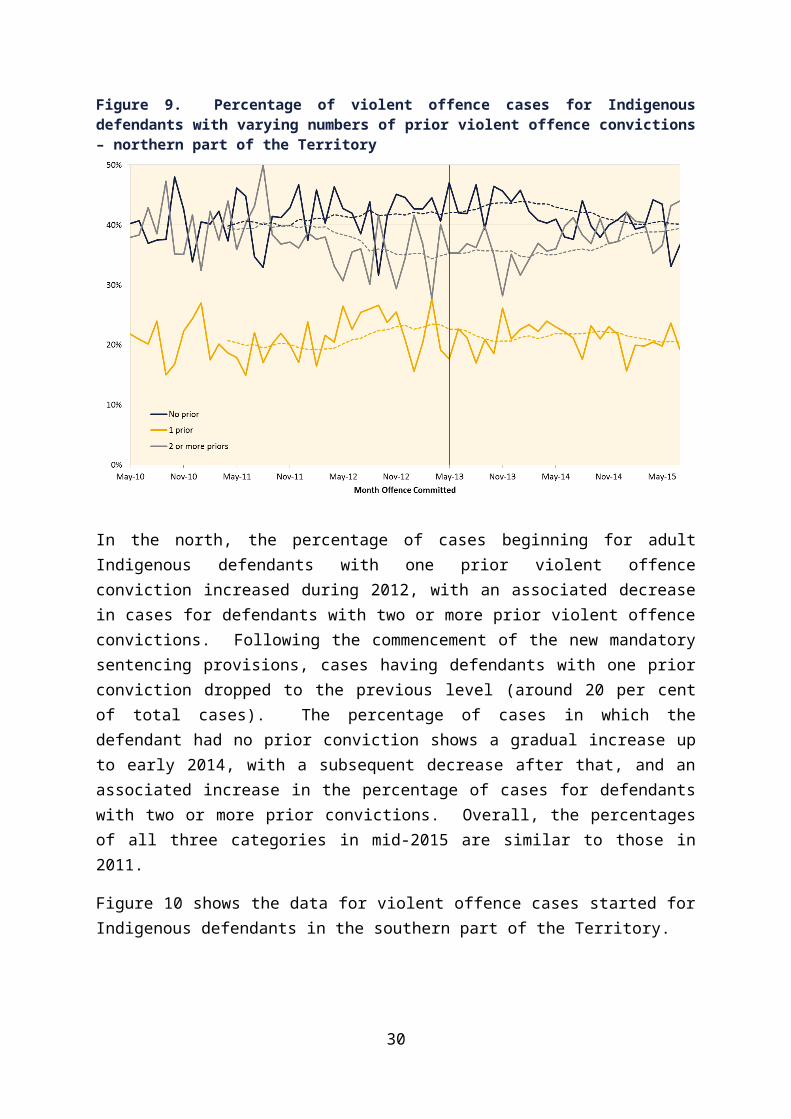
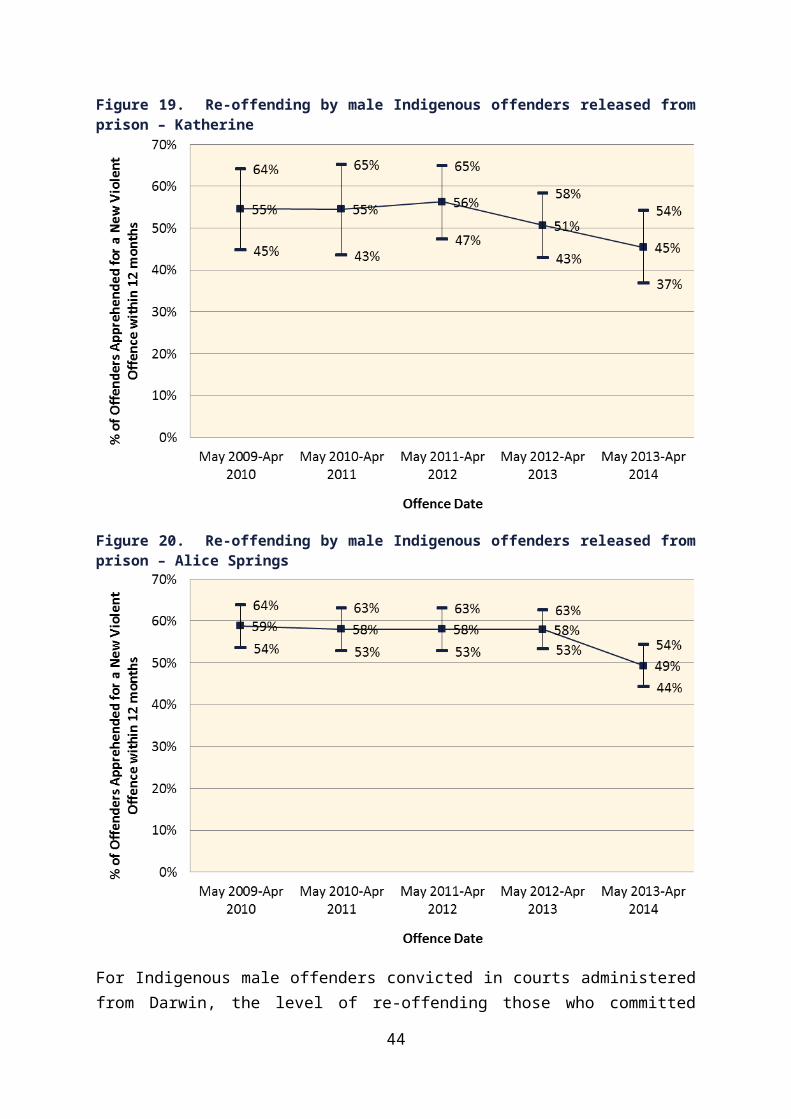
Figure 19. Re-offending by male Indigenous offenders released from prison – Katherine
Figure 20. Re-offending by male Indigenous offenders released from prison – Alice Springs
For Indigenous male offenders convicted in courts administered from Darwin, the level of re-offending those who committed offences in May 2013-April 2014 was virtually identical to the levels in previous years. For offenders convicted in courts administered from Katherine, re-offending by those who committed violent offences in the last two years was
32
less than in previous years, although the differences were not statistically significant. This accords with the Katherine violent offence pattern (Figure 4), which shows a drop in violent offences recorded by Police since early 2013, although the scale of the figure makes it difficult to see the change (actual data are given in Appendix 4).
For offenders convicted in courts administered from Alice Springs (including Tennant Creek), the level of re-offending by those who committed offences in May 2013-April 2014 was significantly less than in the previous years. This suggests that the significant drop in violent re-offending by Indigenous male prisoners is linked to the Point of Sale Interventions.
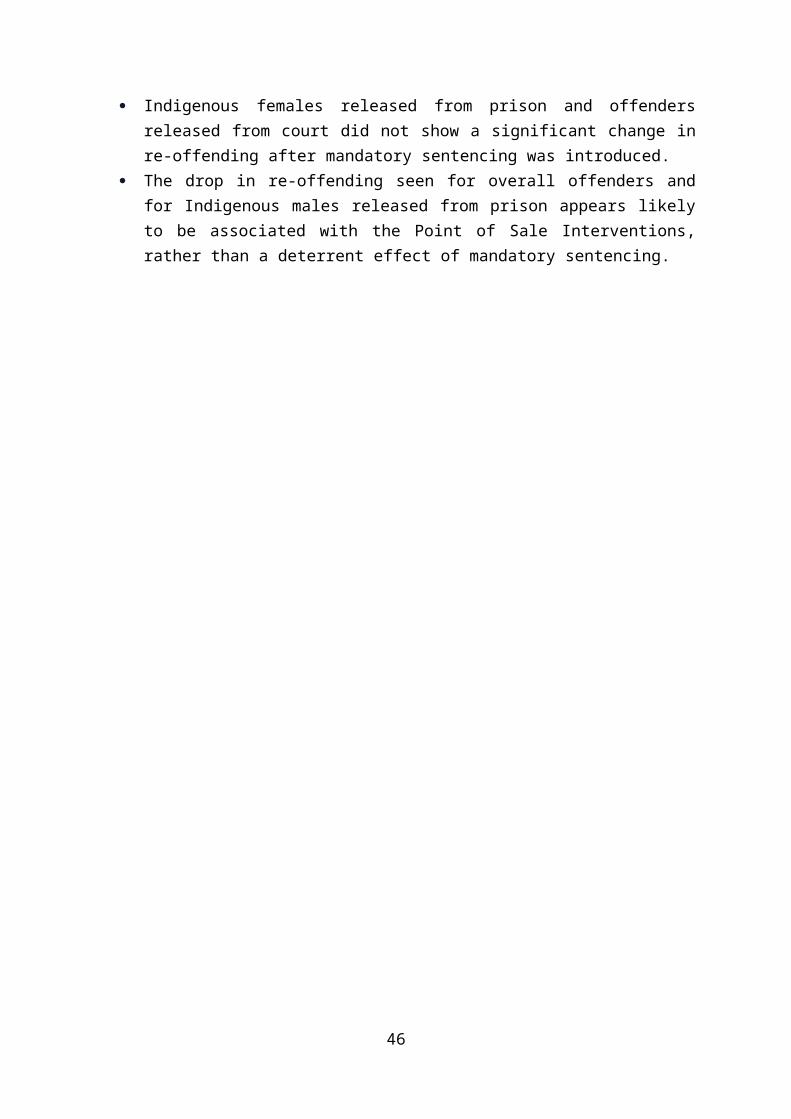
5.2.2 Summary: re-offending Overall, offenders convicted of assault offences committed in May 2013-April 2014
(post mandatory sentencing) had a significantly lower re-offending rate in the year following their release (from prison or from court) than offenders convicted of assault offences committed in each of the four preceding years.
Indigenous males released from prison for offences committed in May 2013-April 2014 had a significantly lower re-offending rate than those released in earlier years. This difference occurred primarily for offenders convicted in courts administered from Alice Springs, and to a lesser extent, those convicted in courts administered from Katherine.
Non-Indigenous males released from prison for offences committed in May 2013-April 2014 had a higher rate of re-offending than in previous years, although the difference was not statistically significant.
Indigenous females released from prison and offenders released from court did not show a significant change in re-offending after mandatory sentencing was introduced.
The drop in re-offending seen for overall offenders and for Indigenous males released from prison appears likely to be associated with the Point of Sale Interventions, rather than a deterrent effect of mandatory sentencing.
33
5.3 To what extent have mandatory minimum imprisonment sentences been imposed for violent offences?
As shown in Figure 1, mandatory sentencing is not applicable to a convicted first-time violent offender who does not cause a physical injury interfering with the victim’s health, and for a Level 2 or 3 offence, a first-time violent offender must only serve “actual imprisonment” rather than a mandatory minimum term. In contrast, a repeat violent offender, if convicted, must at the very least serve a term of actual imprisonment for any violent offence. As a majority of violent offences convicted are “aggravated assault” (section 188(2) of the Criminal Code Act), in most cases a repeat violent offender will be subject to a 3-month minimum term as well. This means that the legislation is likely to have different impacts on first-time and repeat violent offenders. For this reason, the analyses in this section and the two remaining sections are presented separately for offenders with and without prior violent offence convictions.
The offence level is, in most cases, reliant on the determination as to whether the offender caused physical injury interfering with the victim’s health. This is decided by the judicial officer. The judicial officers’ decisions regarding the offence level and applicability of exceptional circumstances were not recorded for the majority of offences. This means that it was not possible to determine the number of offenders convicted of Level 1, 2, 3, 4 or 5 offences, or the number of situations in which exceptional circumstances were found. Hence, analyses are not given for specific offence levels or the use and impact of exceptional circumstances.
34
5.3.1 Percentage of convicted offenders receiving actual imprisonmentFigure 21 shows the percentage of first-time violent offenders who received actual imprisonment sentences. Offenders whose cases took longer than one year to finalise are excluded to make the comparisons more consistent, as those offenders are a much smaller proportion of the total in the most recent months.
Figure 21. Percentage of first-time violent offenders receiving actual imprisonment
The percentage of first-time violent offenders who received actual imprisonment sentences showed a declining pattern from mid-2012 to late 2013, due to a decline in offenders receiving partially suspended imprisonment. The percentage of first-time violent offenders receiving a fixed term sentence was relatively steady prior to the introduction of the new mandatory sentencing provisions, and began to rise a few months afterwards, resulting in an increase in the average percentage of first-time violent offenders receiving actual imprisonment from late 2013.
Figure 22 shows the percentage of repeat violent offenders who received actual imprisonment.
35
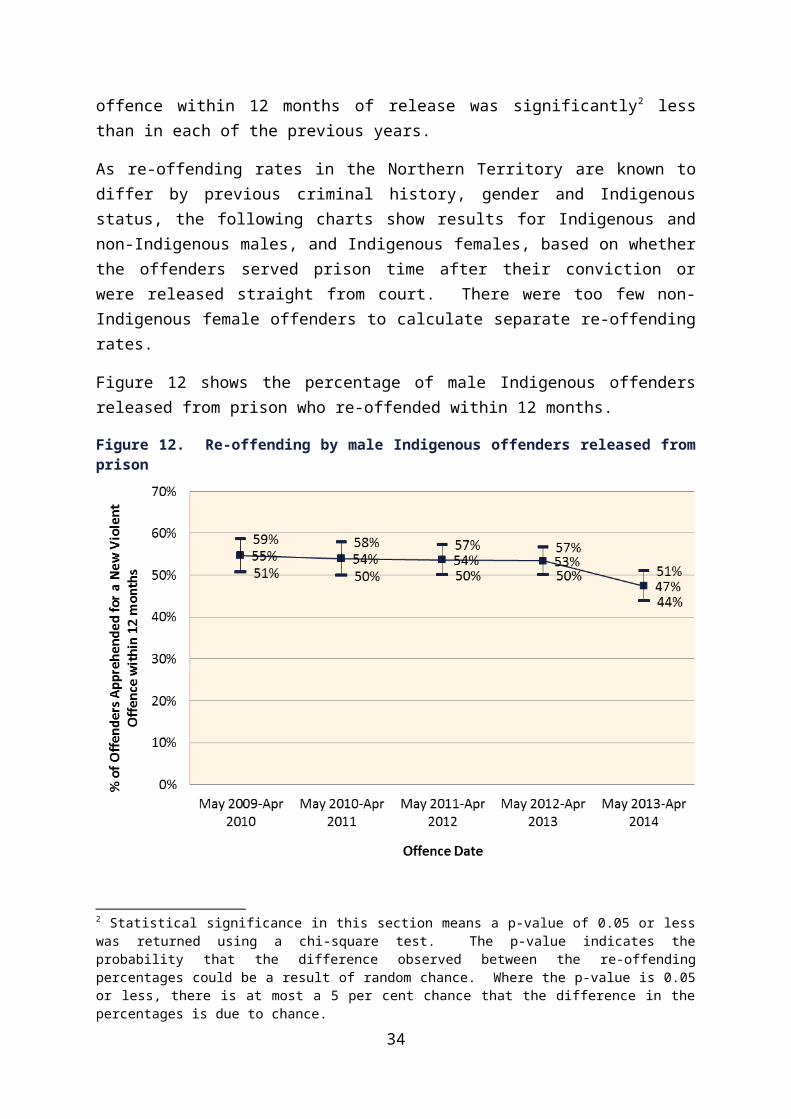
Figure 22. Percentage of repeat violent offenders receiving actual imprisonment
The percentage of repeat violent offenders who received actual imprisonment averaged 96 per cent in the two years prior to introduction of the new mandatory sentencing provisions and 96 per cent in the 15 months afterwards. This is not surprising given that the old Section 78BA of the Sentencing Act, which was added to by the new provisions, already prescribed a term of actual imprisonment for repeat violent offenders. Jackson and Hardy (2010) found that 96 per cent of Indigenous and 94 per cent of non-Indigenous repeat violent offenders convicted in 2008-09 were sentenced to a term of imprisonment.
While the new mandatory sentencing provisions do not prevent the use of partially suspended sentences, as long as the minimum term to serve meets the mandatory minimum requirement, there was a noticeable increase in the use of fixed term sentences instead of partially suspended sentences following the introduction of the new provisions.
The use of fixed term imprisonment for first-time offenders increased following mandatory sentencing, but the overall percentage of first-time offenders sentenced to prison declined due to an earlier drop in the use of partially suspended sentences.
Nearly all (96 per cent) of repeat violent offenders received actual imprisonment before and after mandatory sentencing.
The average percentage of repeat violent offenders receiving fixed term sentences increased from 57 per cent in the year prior to mandatory sentencing to 75 per cent in the year following, with a corresponding drop in the use of partially suspended sentences.
36
5.3.2 Sentence LengthFigure 23 shows the average sentence length given to violent offenders4 sentenced to actual imprisonment in the Court of Summary Jurisdiction.
Figure 23. Average sentence length for offenders sentenced in the Court of Summary Jurisdiction
In the Court of Summary Jurisdiction, the average full term sentence length showed a small decline prior to the introduction of the new mandatory minimums: in April 2013, the average for the past 12 months was 136 days. This showed relatively little change for the first year of the new provisions, but rose to an average of 151 days in the 12 months ending April 2015.
The minimum time to serve averaged approximately 92 days for the two years prior to the introduction of the new mandatory minimum terms. Following the introduction of mandatory minimum terms, the average sentence length increased, averaging 117 days in the 12 months ending April 2015.
4 For the sentence length analyses in the Court of Summary Jurisdiction, all offenders receiving actual imprisonment for violent offences committed between May 2011 and April 2015 have been included. This means that a material proportion of defendants who committed offences in later months have not yet been finalised. It is possible that as these defendants are finalised, the average sentence length will change for the more recent months, but testing did not show consistent or material differences in sentence length based on case duration. The data for the Supreme Court go through February only, as at the time of analysis there were no defendants finalised in the Supreme Court for offences committed in the month of March 2015.
37
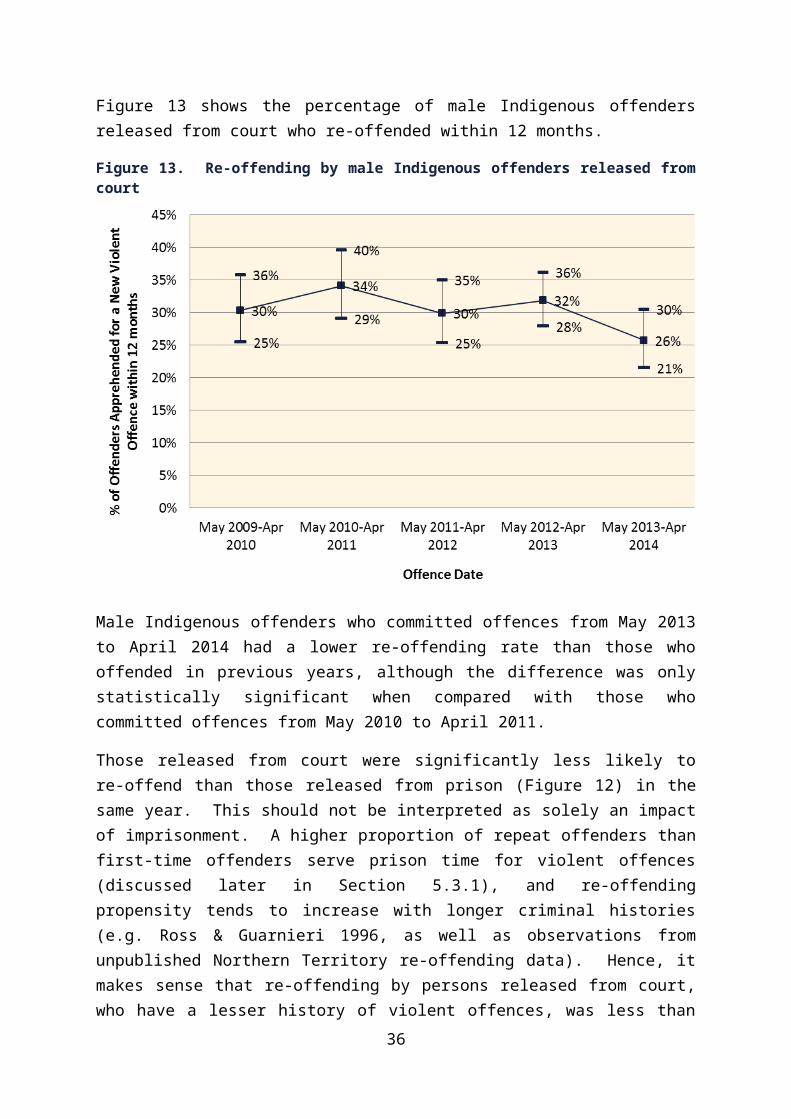
Figure 24 shows the average sentence length given to adult violent offenders sentenced to actual imprisonment in the Supreme Court.
Figure 24. Average sentence length for adult offenders sentenced in the Supreme Court
In the Supreme Court, there was little change in the average full term sentence following the introduction of the mandatory minimum sentences. This is not surprising given that the average sentence length in the Supreme Court was 848 days in the 12 months to April 2012, far above the mandatory minimum terms introduced by the new legislation.
The minimum time to serve did increase after May 2013, from an average of 421 days in the 12 months to April 2013 to an average of 487 days in the 12 months to February 2015. However, this appears to be due to the presence of a few months with low values prior to mandatory sentencing; the range of monthly variation before and after mandatory sentencing does not show a material change, and the average minimum term to serve is well above the mandatory minimum terms specified in the new legislation.
38

Sentence length for adult offenders sentenced in the Court of Summary Jurisdiction was also assessed based on whether the offender had a prior violent offence conviction. Figure 25 and Figure 26 show the average sentence lengths for adult offenders with and without prior violent offence convictions, respectively.
Figure 25. Average sentence length for adult offenders with a prior violent offence conviction
Figure 26. Average sentence length for adult offenders with no prior violent offence conviction
For offenders with a prior violent conviction who were sentenced in the Court of Summary Jurisdiction (Figure 25), the average minimum term to serve increased by a month following
39
the introduction of mandatory minimum prison terms, from an average of 102 days in the 12 months to April 2013 to an average of 127 days in the 12 months to April 2014 and an average of 132 days in the 12 months ending April 2015, representing a 24% increase in the first year and a 29% increase after 2 years. The average full term to serve increased by 3 weeks, from an average of 138 days in the 12 months ending April 2013 to an average of 148 days in the 12 months ending April 2014, and an average of 159 days in the 12 months ending April 2015. This represents an increase of 7% in the first year and 15% after 2 years.
For offenders without a prior violent conviction sentenced in the Court of Summary Jurisdiction (Figure 26), there was little change in the average minimum term to serve, averaging 50 days over the four year period. The average full term to serve began to decrease prior to mandatory sentencing and continued to fall until April 2014, after which the average stabilised for a while and then began to increase.
5.3.3 Summary: sentencing The average percentage of convicted first-time violent offenders receiving a fixed
term imprisonment sentence began to rise a few months after the new mandatory minimum terms were introduced, having been relatively steady in the year before;
The percentage of convicted repeat violent offenders receiving actual imprisonment was unchanged by the new sentencing provisions, as 96 per cent of convicted repeat violent offenders were already sentenced to prison;
The percentage of convicted repeat violent offenders receiving fixed term imprisonment increased, while the use of partially suspended sentences for this group decreased;
The average full sentence length for violent offences showed no change for offenders sentenced in the Supreme Court;
The average minimum sentence length in the Court of Summary Jurisdiction began to increase following the introduction of mandatory minimum terms, rising by an average of 25 days in the Court of Summary Jurisdiction in the first two years of the new sentencing provisions;
While the average minimum sentence length rose by an average of 66 days in the Supreme Court in the first two years of the new sentencing provisions, this seems unlikely to have been a result of mandatory sentencing, as the average minimum sentence was well above the minimum terms specified in the legislation;
In the Court of Summary Jurisdiction, the average minimum sentence length for offenders with a prior violent conviction increased by nearly a month in the first two years of the new provisions, and the average full sentence length increased by 3 weeks;
The average minimum and full sentence lengths for first-time violent offenders in the Court of Summary Jurisdiction did not appear to change as a result of the new mandatory minimum sentence provisions.
40
5.4 To what extent has mandatory minimum sentencing contributed to a consistent standard of sentencing for violent offences?
Consistency was evaluated against two factors: Indigenous status and sex. The measures used were the sentencing outcomes for convicted offenders and the sentence lengths given to offenders receiving actual imprisonment. These measures were evaluated for adult defendants in the Court of Summary Jurisdiction, excluding defendants whose cases lasted longer than a year.
Very few non-Indigenous females appeared as defendants in violent offence cases. Hence, comparisons of measures by Indigenous status were made for Indigenous and non-Indigenous males only; and comparisons of measures by sex were made for Indigenous males and females only.
If the new sentencing provisions increased the consistency of sentencing, then the sentence outcomes and sentence lengths should be more similar for Indigenous and non-Indigenous offenders, and for male and female offenders, following their introduction than prior to it. Clearly many more factors are considered in sentencing decisions than can be examined from a quantitative perspective. These analyses look at whether outcomes become more similar following the implementation of mandatory sentencing, but no claim is made that outcomes should be equivalent. The following analyses are presented for first-time and repeat violent offenders, but do not account for factors such as the length of prior criminal behaviour, severity of offending, offender remorse and prospects for rehabilitation, all of which may have a material influence on sentencing decisions.
41
5.4.1 Consistency of sentence outcome The percentages of convicted Indigenous and non-Indigenous male offenders with a prior violent offence conviction who received imprisonment sentences are shown in Figure 27 to Figure 29. There were many fewer non-Indigenous offenders, so the month-to-month variability of the non-Indigenous offenders is much greater than that of the Indigenous offenders.
Figure 27. Convicted male repeat violent offenders receiving fixed-term imprisonment
Figure 28. Convicted male repeat violent offenders receiving partially suspended imprisonment
42
Prior to mandatory sentencing, Indigenous repeat offenders were more likely to receive fixed-term imprisonment, while non-Indigenous were more likely to receive partially suspended sentences. The percentages began to change for non-Indigenous offenders in the year prior to mandatory sentencing, and for Indigenous offenders at the time of mandatory sentencing. By May 2014 the percentage of Indigenous and non-Indigenous males receiving each type of sentence were similar.
Figure 29. Convicted male repeat violent offenders receiving actual imprisonment
Figure 29 shows that Indigenous and non-Indigenous offenders with a prior violent offence conviction were almost equally likely to receive actual imprisonment, before and after mandatory sentencing. As noted earlier, Jackson and Hardy (2010) found that 96 per cent of Indigenous and 94 per cent of non-Indigenous repeat violent offenders convicted in 2008-09 were sentenced to a term of imprisonment.
43

The percentages of convicted first-time Indigenous and non-Indigenous male offenders who received imprisonment orders are shown in Figure 30 to Figure 32. The percentage of Indigenous first-time violent offenders who received actual imprisonment, either fixed-term or partially suspended sentences, was greater than the comparable percentage of non-Indigenous first-time violent offenders, both before and after mandatory sentencing. For both Indigenous and non-Indigenous first-time offenders, the percentage who received fixed-term sentenced increased after mandatory sentencing.
Figure 30. Convicted male first-time violent offenders receiving fixed-term imprisonment
Figure 31. Convicted male first-time violent offenders receiving partially suspended imprisonment
44
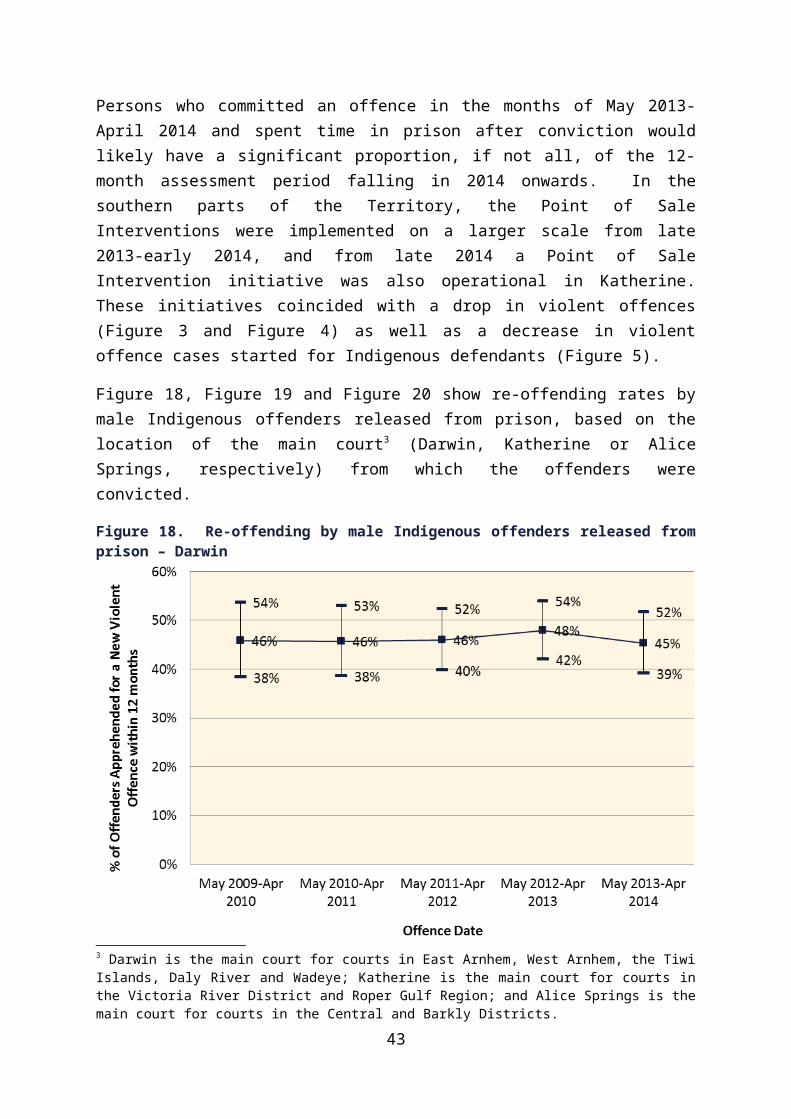
Figure 32. Convicted male first-time violent offenders receiving actual imprisonment
Figure 32 shows that the difference between the percentages of Indigenous and non-Indigenous first-time offenders receiving actual imprisonment was less after the new mandatory sentencing provisions were introduced than before they were introduced. In the two years prior to mandatory sentencing, the percentage of non-Indigenous first-time violent offenders who received actual imprisonment averaged 20 percentage points less than the percentage of Indigenous first-time violent offenders who received actual imprisonment. In the 15 months following mandatory sentencing, the difference averaged 14 percentage points.
Mandatory sentencing appeared to result in convergence of sentence outcomes for Indigenous and non-Indigenous male repeat violent offenders.
For first-time violent offenders, the difference in the percentages of Indigenous and non-Indigenous males receiving particular types of imprisonment decreased following mandatory sentencing, but the percentages did not fully converge.
As the new mandatory minimum terms do not apply to many first-time offenders, it is not surprising that mandatory sentencing had a greater impact on repeat offenders than first-time offenders.
45
The percentages of convicted male and female Indigenous repeat violent offenders receiving fixed-term and partially suspended sentences are shown in Figure 33 to Figure 35.
Figure 33. Convicted Indigenous repeat violent offenders receiving fixed-term imprisonment
Figure 34. Convicted Indigenous repeat violent offenders receiving partially suspended imprisonment
Female offenders were less likely than males to receive fixed-term imprisonment, and more likely to receive partially suspended imprisonment. Both show the increase in the use of fixed-term sentences and decrease in partially suspended sentences following the implementation of mandatory sentencing.
46
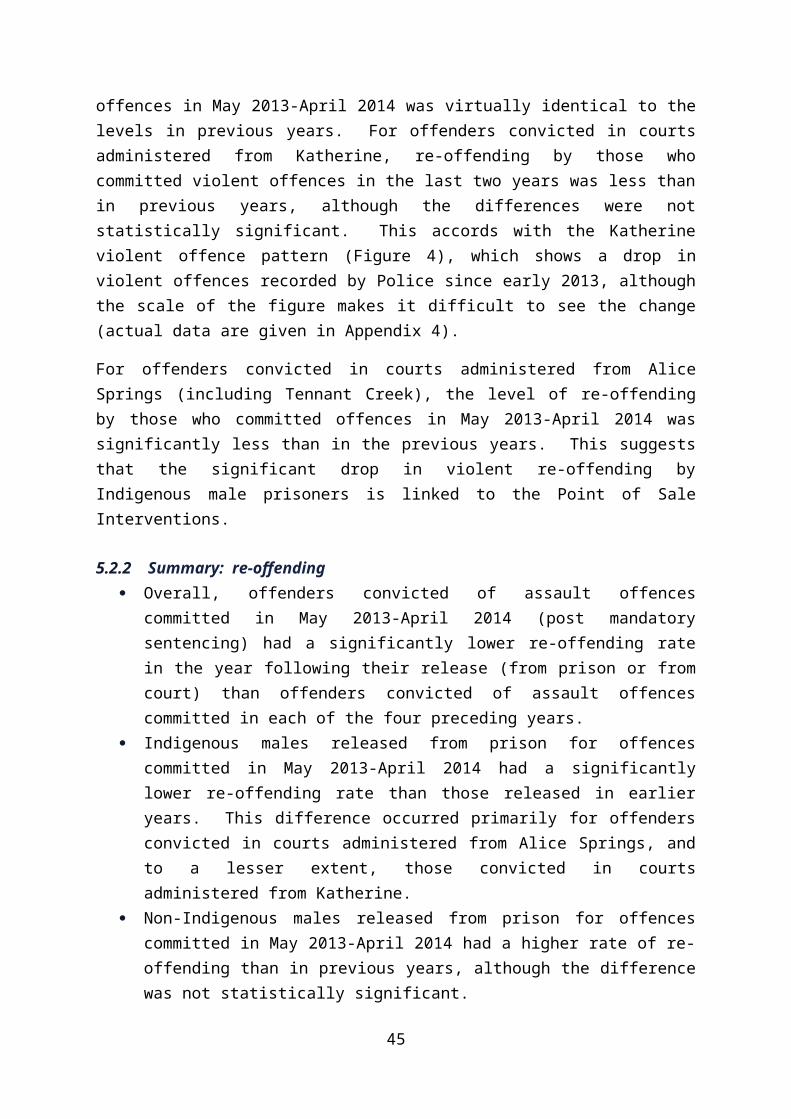
Figure 35. Convicted Indigenous repeat violent offenders receiving actual imprisonment
The percentage of female offenders receiving actual imprisonment averaged 83 per cent in the year 12 months ending April 2013, while males averaged 96 per cent. In the year ending April 2014, the average percentage of females receiving actual imprisonment had risen to 93 per cent.
The comparisons of Indigenous male and female first-time violent offenders (not shown) were broadly similar to the comparisons of Indigenous and non-Indigenous male first-time violent offenders. First-time male offenders were more likely than first-time female offenders to receive actual imprisonment, either fixed-term or partially suspended, but the percentages did not converge following the implementation of mandatory minimum terms. In the year before mandatory sentencing, 34 per cent of convicted female offenders and 50 per cent of convicted male offenders received actual imprisonment; in the year following mandatory sentencing, 33 per cent of convicted females and 49 per cent of convicted males received actual imprisonment.
For repeat violent offenders, the percentages of Indigenous male and female offenders receiving various types of imprisonment sentences partially converged.
For first-time offenders, Indigenous males were more likely to receive each type of imprisonment than Indigenous females, and the percentages did not converge following mandatory sentencing.
47
5.4.2 Consistency of sentence lengthThe average monthly sentence lengths for Indigenous and non-Indigenous male repeat and first-time offenders are shown in Figure 36 to Figure 39.
Figure 36. Full-term sentence length, male repeat violent offenders
Figure 37. Minimum sentence length, male repeat violent offenders
48
The full and minimum terms for Indigenous and non-Indigenous male repeat violent offenders diverged following mandatory sentencing, and appear to be re-converging.
Figure 38. Full-term sentence length, male first-time violent offenders
Figure 39. Minimum sentence length, male first-time violent offenders
For male first-time violent offenders, there was little material difference in the average full and minimum prison terms given to Indigenous and non-Indigenous offenders. The monthly and 12-month moving averages for non-Indigenous offenders are more variable due to
49
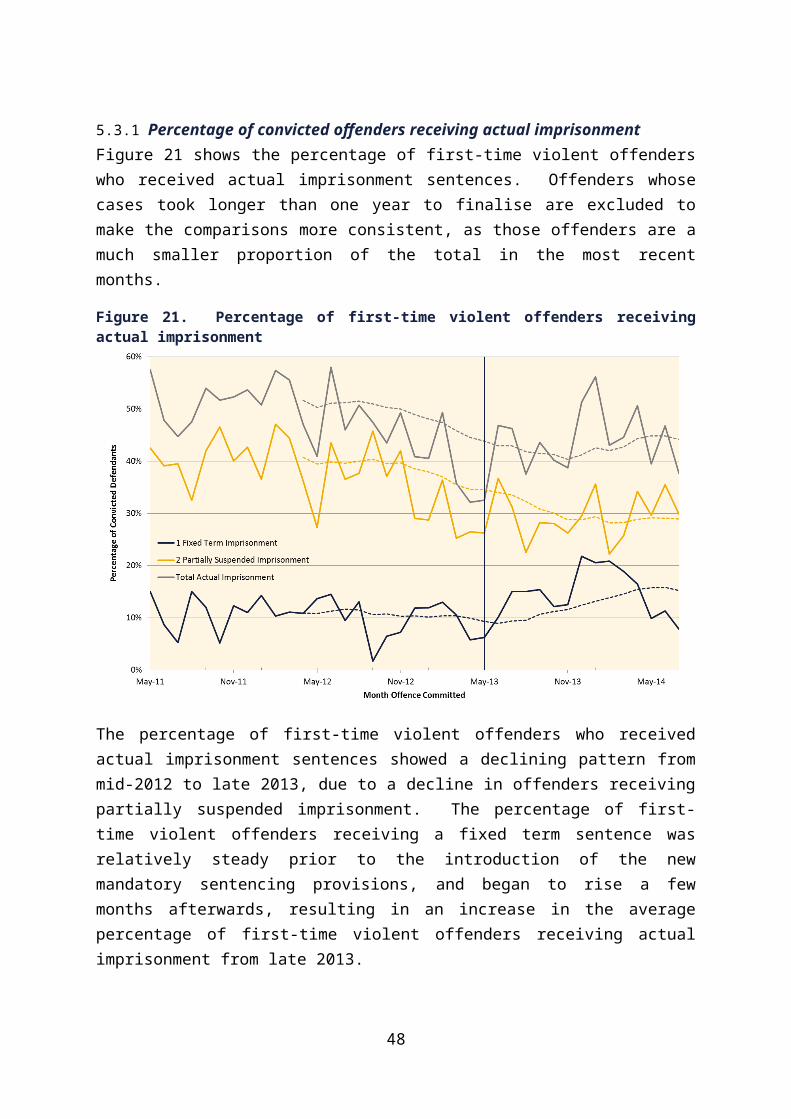
smaller numbers, but the monthly range for non-Indigenous offenders encompasses that for Indigenous offenders.
50
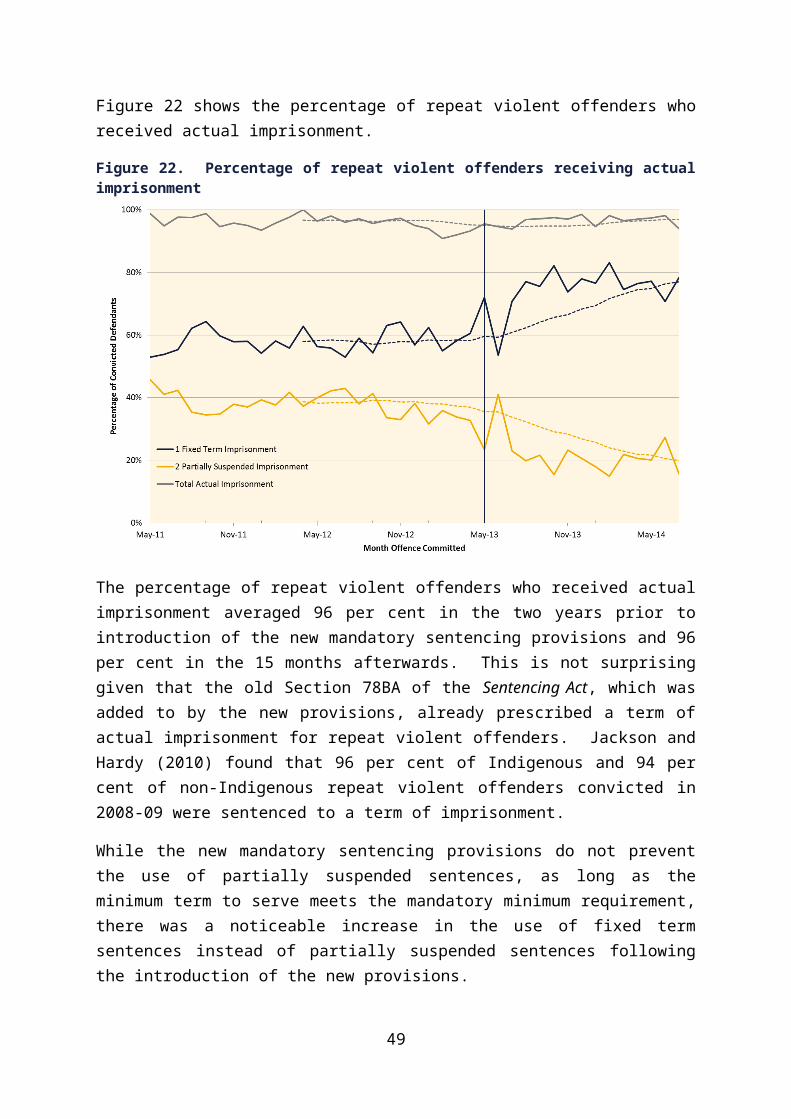
The average sentence lengths for male and female Indigenous repeat and first-time offenders are shown in Figure 40 to Figure 43.
Figure 40. Full-term sentence length, Indigenous repeat violent offenders
Figure 41. Minimum sentence length, Indigenous repeat violent offenders
For male and female repeat offenders, the length of the full term to serve converged prior to mandatory sentencing and remained similar for a year, following which the full-term sentence length for females dropped. Female repeat offenders averaged shorter minimum
51
terms than males; both averaged longer minimum terms following mandatory sentencing, but female minimum terms began to drop again from May 2014.
Figure 42. Full-term sentence length, Indigenous first-time violent offenders
Figure 43. Minimum sentence length, Indigenous first-time violent offenders
Average full-term sentence lengths were similar for male and female first-time offenders, while males averaged longer minimum sentence lengths.
52
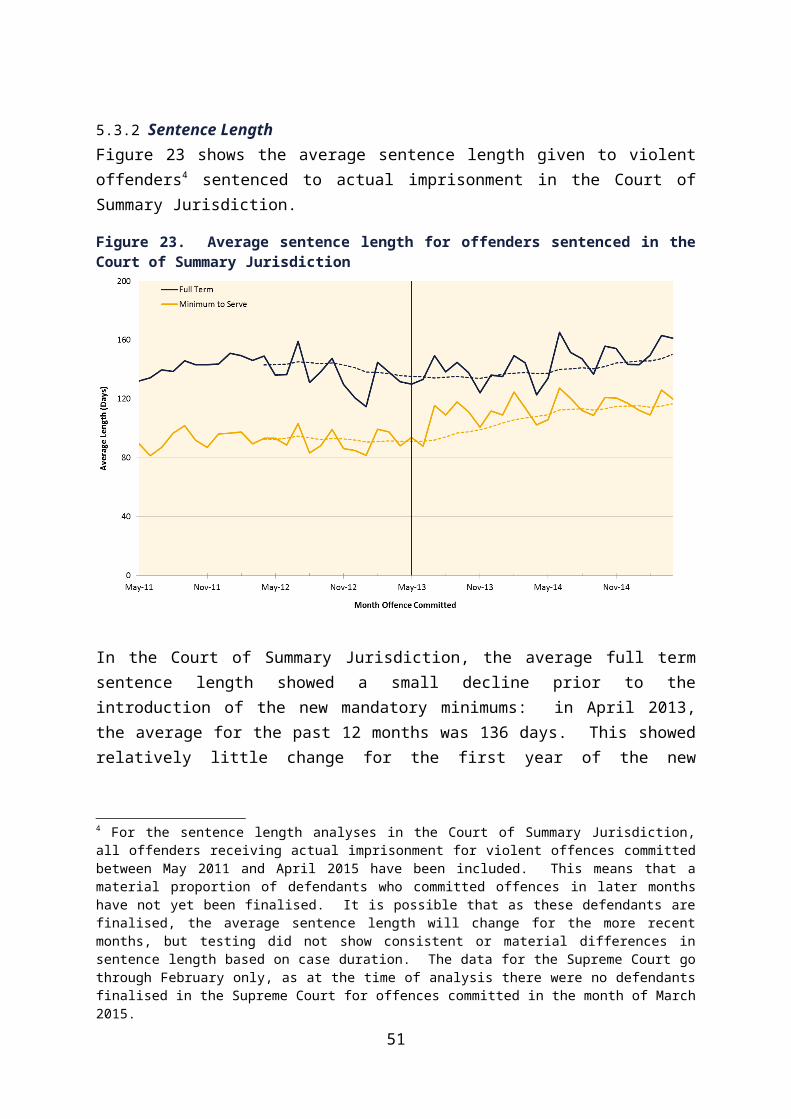
5.4.3 Summary: sentencing consistency Following the introduction of mandatory sentencing, the percentages of Indigenous
and non-Indigenous male offenders with a prior violent conviction who received fixed-term imprisonment sentences completely converged, as did the percentages who received partially suspended imprisonment sentences.
The percentages of male and female Indigenous offenders with a prior violent conviction who received actual imprisonment partially converged following mandatory sentencing.
For first-time violent offenders, the introduction of mandatory sentencing did not appear to significantly increase the consistency of sentence outcomes. Indigenous and non-Indigenous males had slightly more similar outcomes following the introduction of mandatory sentencing, but the relative outcomes for male and female Indigenous first-time offenders showed little change.
The full and minimum sentence lengths for Indigenous and non-Indigenous males with a prior violent conviction temporarily diverged following the introduction of mandatory sentencing, but appear to be converging again. Maximum and minimum terms for Indigenous and non-Indigenous males with no prior violent convictions were similar before and after mandatory sentencing.
The average full sentence lengths for Indigenous males and females with and without prior convictions were similar in the year immediately following mandatory sentencing, but appear to diverge from May 2014.
The average minimum terms to serve were less for females than for males. For females with a prior violent offence conviction, the average minimum term rose substantially in the first year of mandatory sentencing, as did the term for males; however the average term for females has decreased since May 2014, while the average for males has remained steady.
The average minimum terms for males and females with no prior convictions showed no material change following the introduction of mandatory sentencing.
53
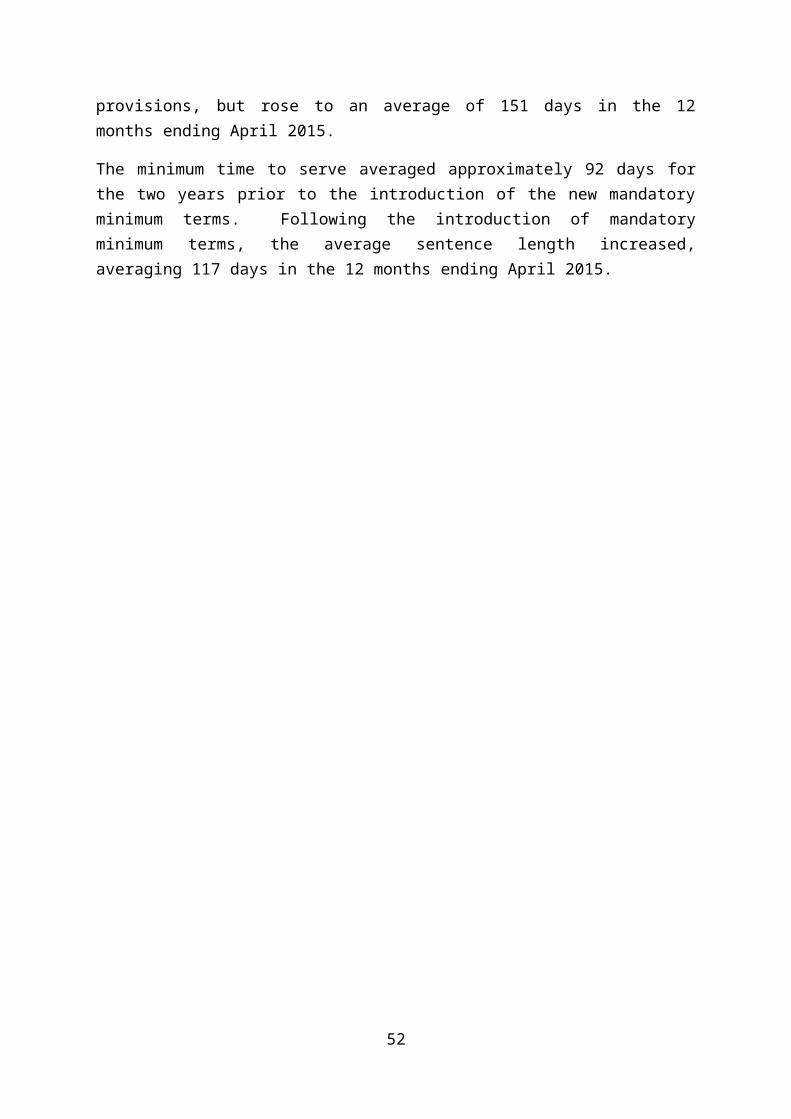
5.5 To what extent has mandatory minimum sentencing caused impacts on the operations or processes of prosecutions, courts, and corrections?
5.5.1 Finalisation timeA potential unintended consequence of mandatory sentencing is a lengthening in the court process, due to a greater proportion of defendants contesting cases in order to avoid prison. This may manifest itself in longer times to finalise defendants. Figure 44 shows the average time to finalise adult violent offence defendants in the Court of Summary Jurisdiction, based on the defendant’s final plea. Cases taking longer than a year to finalise are also excluded, as the frequency of these cases is much less in the more recent months.
Figure 44. Average time to finalise violent offence defendants by final plea
Overall, the average finalisation time for violent offence defendants pleading guilty increased by 19 days in the year following the introduction of mandatory sentencing. The pattern for defendants overall was similar to the pattern for those pleading guilty. The average finalisation time for violent offence defendants pleading not guilty increased by an average of 14 days in the year following mandatory sentencing, the same rate at which it had increased in the year prior to mandatory sentencing.
54
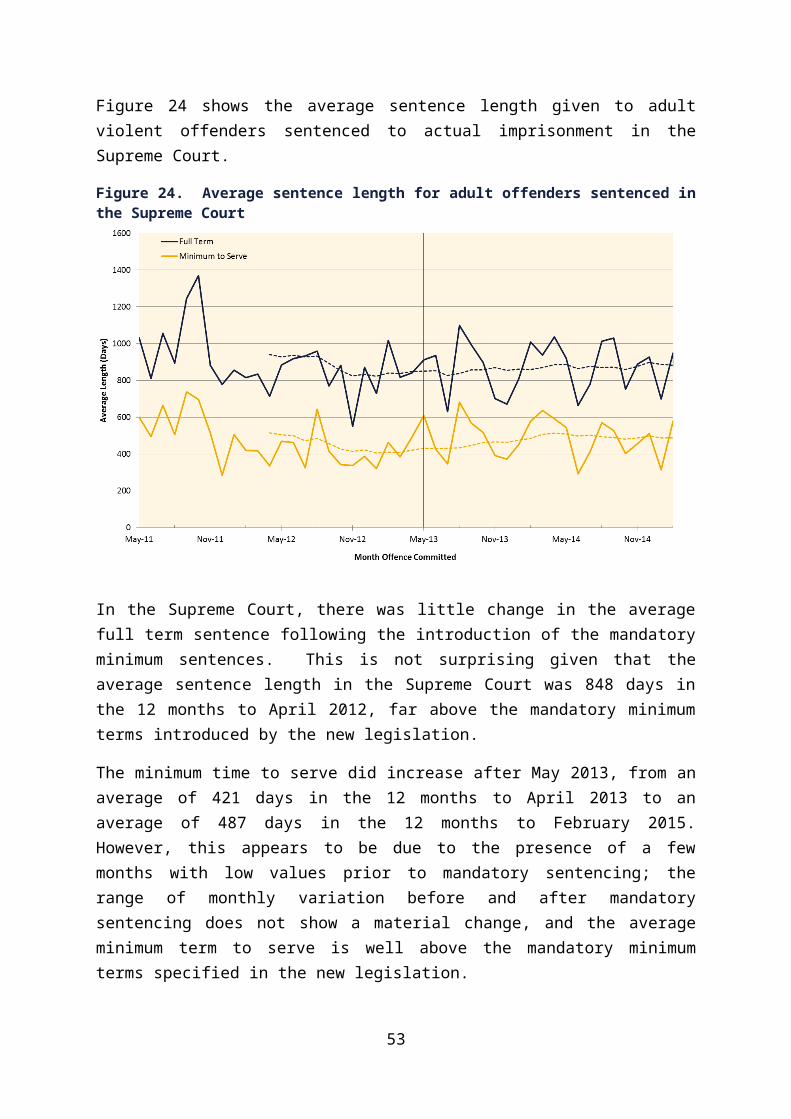
Figure 45 shows the percentiles of finalisation time for adult violent offence defendants finalised in the Court of Summary Jurisdiction, excluding defendants who took longer than a year to finalise. The median finalisation time represents the time in which 50 per cent of defendants were finalised, and the 75th and 95th percentiles represent the time in which 75 per cent and 95 per cent, respectively, of defendants were finalised.
Figure 45. Percentiles of finalisation time (days)
As with the average time, the percentiles show a definite increase beginning for defendants committing offences in the month before mandatory sentencing was introduced. The median finalisation time went from an average of 64 days in the two years prior to mandatory sentencing to 90 days in the year after mandatory sentencing; the 75 th percentile increased from 121 to 150 days; and the 95th percentile increased from 245 to 264 days.
55
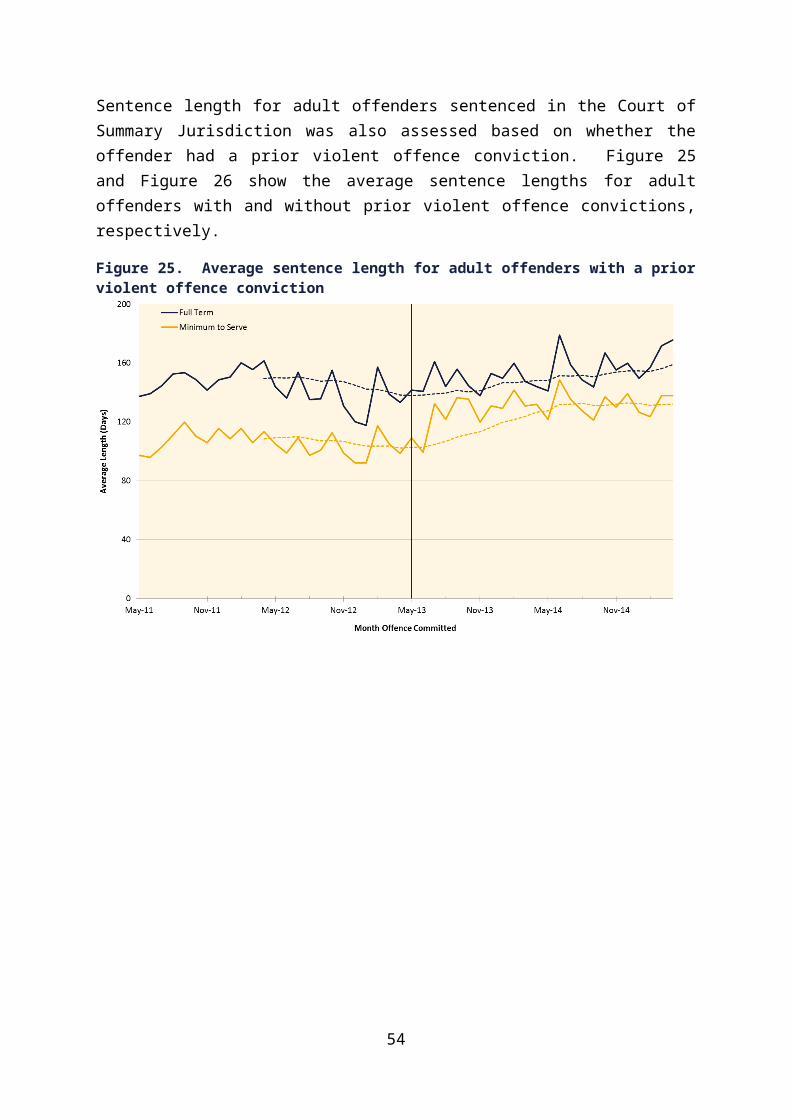
Figure 46 shows the time required to finalise adult defendants in the Supreme Court. Data have only been shown to May 2014, as a substantial proportion of later cases are yet to be finalised. The number of defendants is relatively small and so has not been split by plea. Cases lasting longer than a year have been included, as these form a higher proportion of matters heard in the Supreme Court.
Figure 46. Average time to finalise adult violent offence defendants – Supreme Court cases
The average finalisation time increased for offences committed in February 2013 due to a trial involving multiple defendants for manslaughter. The finalisation time continued to increase gradually over the following year and then dropped once the value for February 2013 was no longer included in the 12-month rolling average. There did not appear to be any change in average finalisation time immediately following the introduction of the new mandatory sentencing provisions.
The finalisation time for violent defendants with a final plea of guilty finalised in the Court of Summary Jurisdiction increased immediately following the implementation of mandatory sentencing.
The finalisation time for violent defendants with a final plea of not guilty had been increasing prior to mandatory sentencing and continued to increase at the same rate following mandatory sentencing.
The finalisation time for violent defendants finalised in the Supreme Court did not show a material change following mandatory sentencing.
56
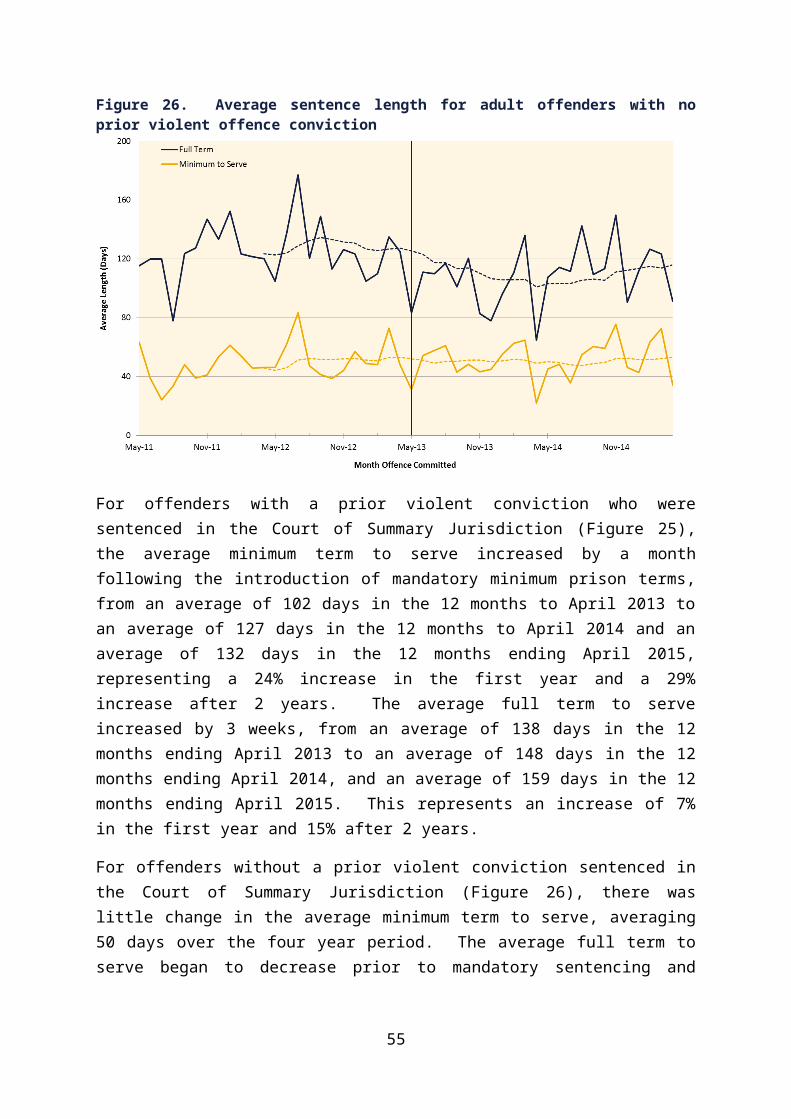
5.5.2 Status of defendants at three months post apprehensionAn increase in the time to finalise defendants means that at a given time, a greater percentage of defendants will be on remand, bail or otherwise free in the community, e.g. summonsed to appear in court or at large, and a smaller percentage will be finalised.
Figure 47 shows the status of violent offence defendants (finalised, on remand or on bail or otherwise free) at the date three months after being apprehended.
Figure 47. Percentage of violent offence defendants by status three months following apprehension
In the two years prior to the introduction of mandatory sentencing, the percentage of violent offence defendants finalised within three months of apprehension increased, indicating an increase in court efficiency. The percentage finalised began to drop just prior to the introduction of mandatory sentencing, from an average of just over 40 per cent to approximately 32 per cent a year later.
The percentage on remand averaged 17 per cent in the year before mandatory sentencing and 21 per cent in the year following, and the percentage on bail or otherwise free increased from an average of 43 per cent in the year before to 47 per cent in the year after. While the percentage on bail or otherwise free has subsequently declined back to the level seen prior to the introduction of mandatory sentencing, with an increase in the percentage finalised, the percentage on remand has remained at the higher level.
Mandatory sentencing appears to have resulted in a small but persistent increase in the percentage of defendants on remand three months following apprehension.
57
5.5.3 Number of court appearancesFigure 48 shows the average number of court appearances (excluding cancelled appearances) for violent offence defendants finalised in the Court of Summary Jurisdiction. Again, defendants whose cases took longer than a year have been excluded, as the frequency of these cases is much less in the more recent months.
Figure 48. Average number of court appearances for violent offence defendants by final plea
Finalised defendants with a final plea of “Not guilty” required, on average, 1 to 1.5 more court appearances to finalise than those with a final plea of “Guilty”. The average number of appearances for defendants pleading “Not guilty” increased marginally from mid-to-late 2013, but showed no real change at the time the new mandatory sentencing provisions began.
The average number of appearances for defendants pleading “Guilty” was decreasing slightly prior to the implementation of mandatory sentencing and increased immediately following, from an average of 3.81 appearances in the year prior to mandatory sentencing to an average of 4.48 appearances in the year following. This is roughly equivalent to an additional 68 appearances per 100 defendants pleading guilty. With 2,126 violent offence defendants pleading guilty in the first year following mandatory sentencing, this suggests an additional 1,436 court appearances were required to finalise these defendants.
The average number of court appearances required to finalise defendants pleading guilty in the Court of Summary Jurisdiction increased by approximately 68 appearances per 100 defendants following the implementation of mandatory sentencing.
58

5.5.4 Guilty pleasAs a majority of violent offences convicted are “aggravated assault” (section 188(2) of the Criminal Code Act), a plea of guilty for many repeat violent defendants will lead to a minimum of at least three months’ prison time under the amended legislation (Figure 1). Therefore, fewer repeat violent defendants were expected to plead guilty following the introduction of the new sentencing provisions.
Figure 49 shows the percentage of violent offence defendants finalised in the Court of Summary Jurisdiction who had a final plea of guilty, split by whether the defendant had a prior violent offence conviction and excluding defendants that took longer than a year to finalise.
Figure 49. Percentage of finalised violent offence defendants with a final plea of guilty
The percentage of defendants with no prior violent offence conviction with a final plea of guilty shows relatively little change over the period. In contrast, the percentage of defendants with a prior violent offence conviction who pled guilty began to decline for offences committed from March 2013 onwards.
It is possible that this decline was an anticipated reaction by defendants (or defence counsel) to the new mandatory sentencing law, which was passed by the Legislative Assembly on 14 February 2013, although it did not apply to offences committed prior to 1 May 2013. Another possibility is that the decline was a response to the commencement of the Evidence (National Uniform Legislation) Act 2011 in January 2013. This legislation allowed spouses and partners in domestic violence cases to object to, and be excused by the courts, from giving evidence; without evidence, defendants may have been less inclined to
59
plead guilty. If so, the decline should occur for defendants in domestic violence cases, with or without a prior conviction, and not in non-domestic violence cases.
Figure 50 and Figure 51 show the percentage of violent offence defendants pleading guilty by domestic violence involvement for defendants with and without a prior conviction.
Figure 50. Percentage of finalised repeat violent offence defendants pleading guilty, by whether domestic violence was involved in the case
Figure 51. Percentage of finalised first-time violent offence defendants pleading guilty, by whether domestic violence was involved in the case
60
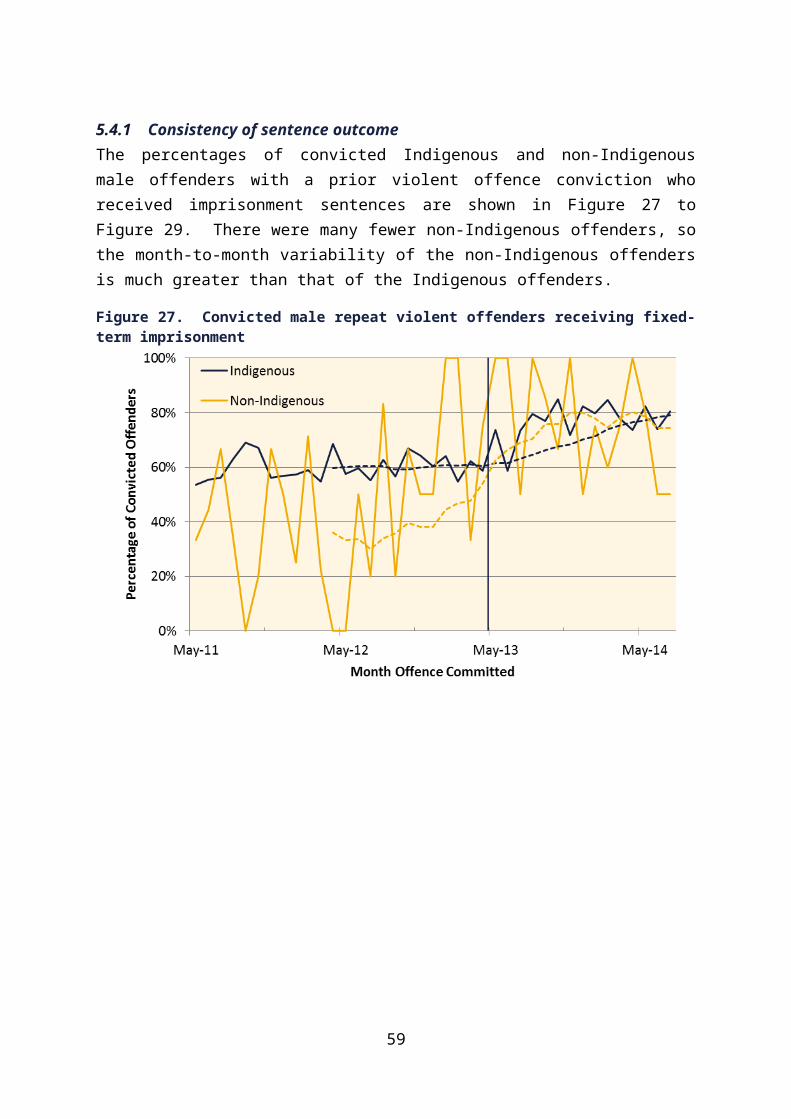
The decline in guilty pleas occurs for repeat violent defendants regardless of domestic violence involvement; however, first-time violent defendants show a slight drop in the propensity to plead guilty in domestic violence matters, but no real change for non-domestic violence matters. This makes it difficult to determine whether the drop in the guilty pleas was a reaction to the Evidence Act, an anticipated response to the mandatory sentencing legislation, a combination of both or a reaction to some other factor.
5.5.5 Withdrawal of charges by the prosecutionAnother potential impact of introducing mandatory minimum prison terms is an increase in the percentage of situations in which defendants pleading not guilty escape conviction by having all charges withdrawn by the prosecution.
Figure 52 shows the percentage of defendants with a final plea of not guilty who were finalised by having all violent offence charges in a sentencing occasion withdrawn by the prosecution, including nolle prosequi outcomes in the Supreme Court. Defendants not finalised within a year were excluded in order to make the later months more comparable to the earlier months.
Figure 52. Percentage of defendants pleading not guilty who were finalised by having all charges withdrawn
The percentage of defendants who pled not guilty and were finalised by having all charges withdrawn increased during 2011 and 2012, but by early 2013 the 12-month rolling average had stabilised at 70 per cent. The average dropped slightly, to around 68 per cent, following the introduction of the new mandatory minimum terms, but has since risen back to nearly 70 per cent.
61
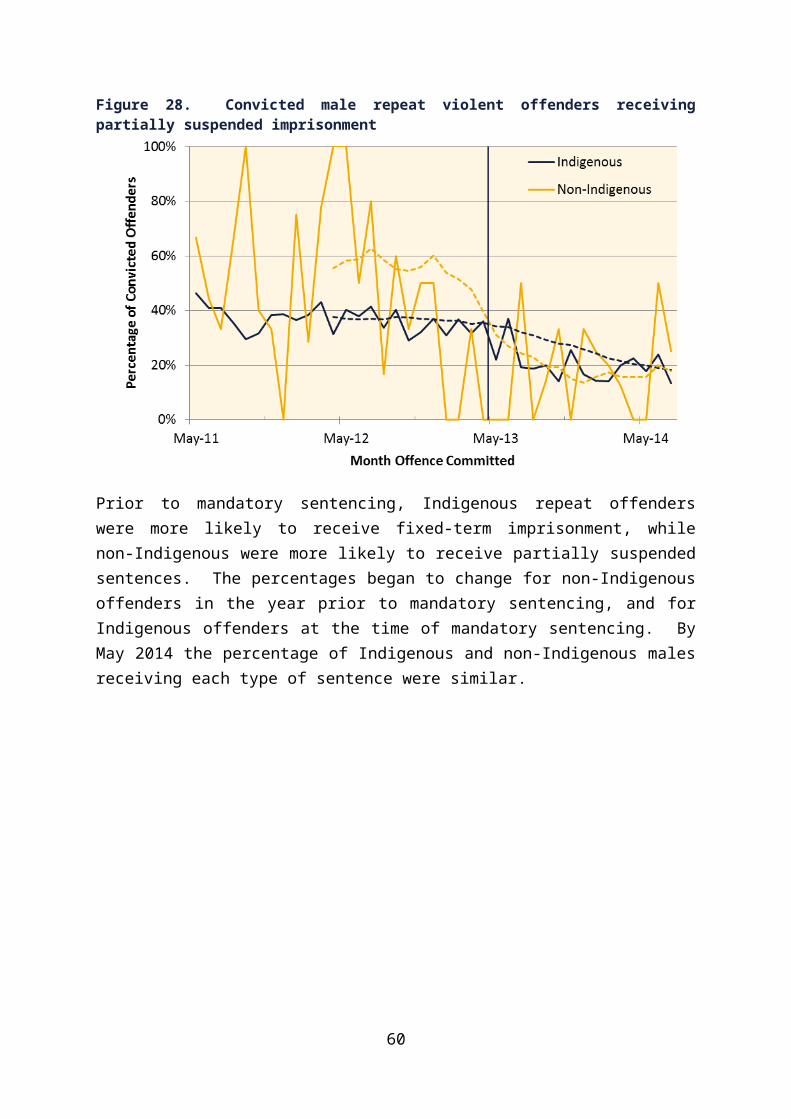
Mandatory sentencing did not substantially change the percentage of defendants pleading not guilty who had all charges withdrawn by the prosecution.
5.5.6 Court outcomes for defendants pleading not guiltyFigure 53 shows the court outcomes for defendants with a final plea of not guilty, excluding those with all charges withdrawn. The data show substantial monthly variation within groups as the numbers are very small (averaging 27 defendants per month over the period shown who pled not guilty and did not have all charges withdrawn).
Figure 53. Outcomes of defendants pleading not guilty excluding those with all charges withdrawn
The average percentage of defendants pleading not guilty who were found guilty dropped from around 60 per cent in the year ending April 2012 to around 50 per cent at the time mandatory minimum sentences were introduced, and continued to fall to 47 per cent, where it appears to be relatively stable, though with large monthly fluctuations. The average percentage of defendants found not guilty began to rise before the introduction of mandatory minimum sentences and continued rising until the year ending March 2014, when it stabilised at approximately 20 per cent. The remainder, those whose offences were dismissed, discharged, set aside, struck out or determined to have no case to answer, began a slight decline prior to mandatory sentencing that continued afterwards, but the average showed relatively little net change across the period.
The percentages of defendants pleading not guilty who were found guilty, found not guilty and discharged/dismissed showed changes before and after mandatory sentencing. However, the patterns in defendant outcomes did not appear to change at the time mandatory sentencing was introduced.
62
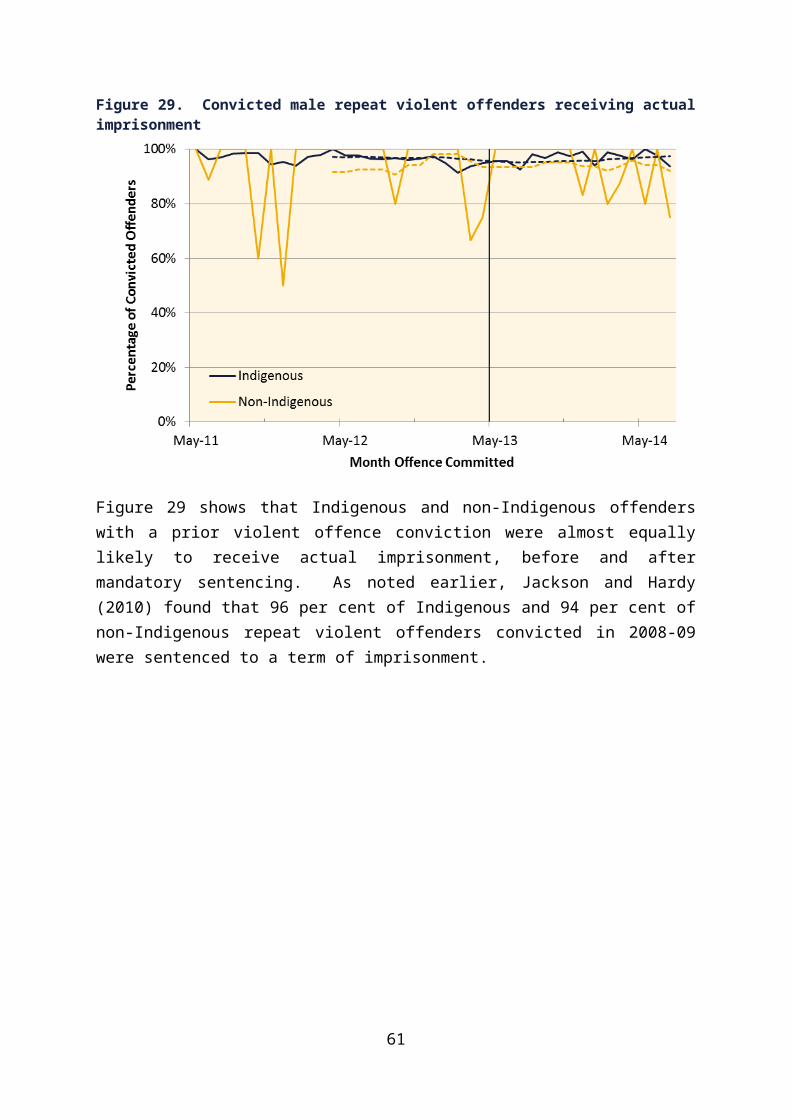
5.5.7 Prisoner numbersAn expected impact of introducing mandatory minimum prison sentences is an increase in prisoner numbers. This may occur through a greater proportion of defendants being sentenced to prison, an increase in the average length of prison terms and/or a greater number of persons on remand, due to increased delays in court.
As shown previously, following the implementation of mandatory sentencing a smaller proportion of first-time violent defendants were sentenced to prison (Figure 21) with no change in the proportion of repeat violent offenders sentenced to prison (Figure 22). The average minimum and full-term sentence lengths for repeat offenders increased (Figure 25) while the average minimum sentence length for first-time offenders did not change and the full-term sentence decreased (Figure 26); and the proportion of violent offence defendants on remand at three months post apprehension increased following the introduction of mandatory sentencing (Figure 47).
From 2011 to early 2013, the number of prisoners held for a most serious offence of assault followed a steady pattern of linear growth overlain by a cyclical seasonal factor. The trend is projected forward to create estimates of future prisoner numbers assuming the existing state persists, and to enable detection of significant departures from the pattern.
Figure 54 shows the number of prisoners held for a most serious offence of assault at the end of each month. Also shown are the projected assault prisoner numbers, based on the data from April 2011 to March 2013, and the projection boundaries (the estimated 95 per cent confidence interval for the actual values). Note that as these are end of month numbers, the vertical line crosses between April and May 2013.
Figure 54. Prisoners held for assault offences at the end of the month, and projected assault prisoner numbers
63
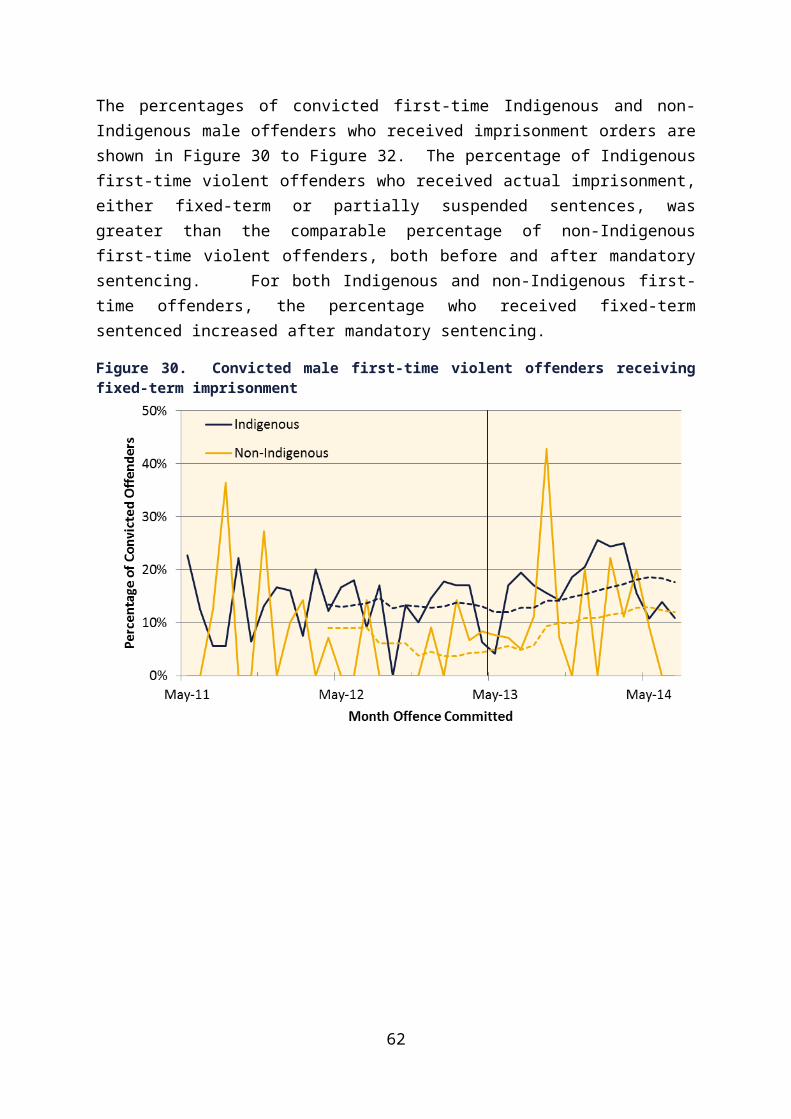
Beginning in February 2013, the number of prisoners held for assault began to drop below the projection, falling just outside the projection boundaries in March and April 2013. From May to August 2013, the actual values averaged approximately 80 prisoners less than the projection; September and October 2013 saw actual numbers return to nearly the projected values, but numbers again dropped below the projection boundaries in December 2013. Since then, the number of prisoners held for assault has continued to show the cyclical seasonal pattern, but without appreciable growth. By August 2015, the actual number of prisoners held for assault was 291 less than had been projected for that month using the pattern of growth prior to the implementation of mandatory sentencing.
It is difficult to conclusively identify reasons for the changes seen in assault prisoner numbers. Factors other than mandatory sentencing may be involved, as the number of prisoners held for offences other than assault also declined in early 2013. Some potential explanations for the changes in assault prisoner numbers are listed below.
The decrease in assault prisoner numbers prior to mandatory sentencing may have been partially related to the decline in the percentage of violent defendants with a prior conviction who pled guilty (Figure 49), which also began to decline prior to mandatory sentencing, as well as the decline in the percentage of those pleading not guilty who were found guilty (Figure 53);
The continued lower-than-projected numbers through August 2013 may have been partially a result of longer finalisation times in court (Figure 44);
The increase back to the projected numbers in September and October 2013 may have been as a result of increased sentence lengths for those committing violent offences after May 2013 (Figure 23 to Figure 25);
The lack of underlying growth in prisoners held for assault since December 2013 is likely to be related to the Point of Sale Interventions.
5.5.8 Summary: impact on justice operational processes In the Court of Summary Jurisdiction, the average time to finalise defendants
pleading guilty increased by an average of 19 days following the implementation of mandatory sentencing. The average number of court appearances for defendants pleading guilty increased by approximately 68 appearances per 100 defendants following mandatory sentencing.
Finalisation times for defendants pleading not guilty increased steadily over the whole time period and did not show any change in pattern following the implementation of the new provisions.
Finalisation times in the Supreme Court did not appear to be affected by the implementation of mandatory minimum sentences.
The percentage of violent offence defendants finalised by three months prior to apprehension dropped, starting just prior to the introduction of mandatory
64
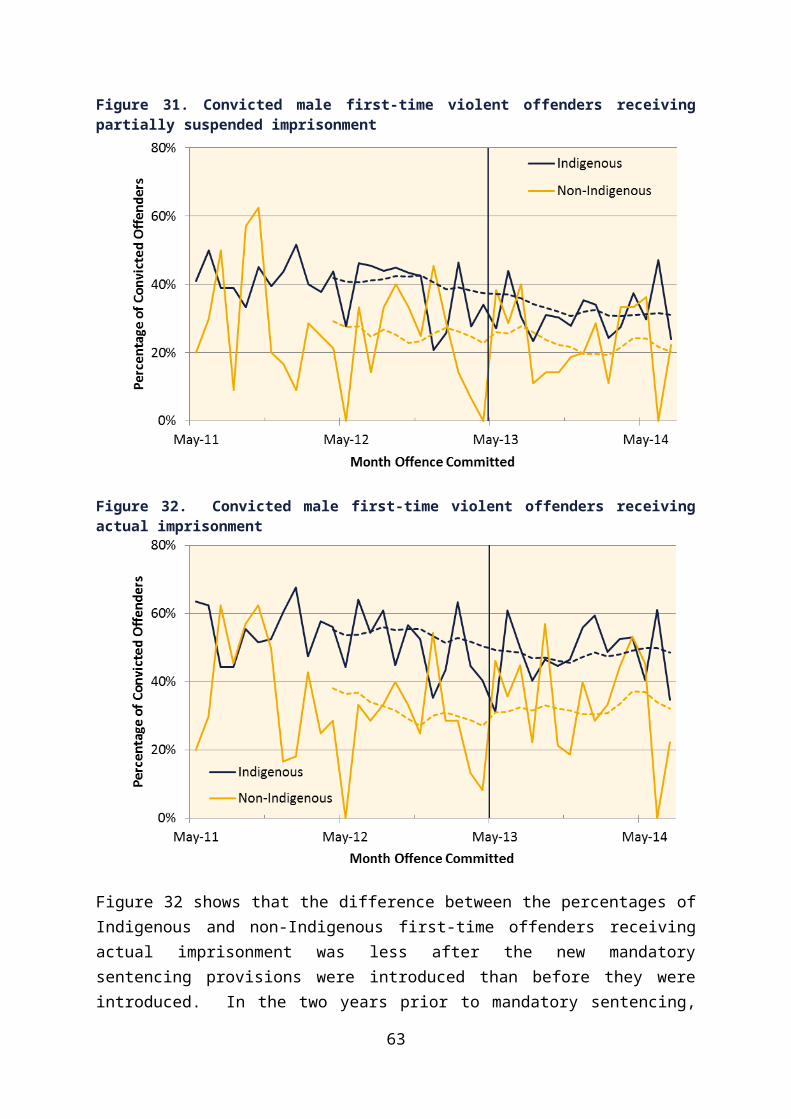
sentencing, with corresponding increases in the percentages of defendants on bail and on remand.
The percentage of defendants with a prior violent conviction who pled guilty began to decline for offences committed from March 2013 onwards, while the percentage of those without a prior conviction who pled guilty remained relatively unchanged. The reason for the decline is unclear. As some drop occurred in the percentages of both first-time and repeat violent defendants who pled guilty in domestic violence cases, this may have been partly a response to the Evidence (National Uniform Legislation) Act 2011; alternatively, it may have an anticipated reaction to mandatory sentencing, a combination of both or a response to some other factor.
The percentage of defendants pleading not guilty who were finalised by having all charges withdrawn by the prosecution did not show any change following the implementation of mandatory sentencing.
Excluding those with all charges withdrawn, the percentages of defendants found guilty, found not guilty and otherwise discharged from court did not appear to change as a result of the introduction of mandatory sentencing.
The number of prisoners held for assault offences dropped below its projected level, based on the pattern of the previous 24 months, in the two months prior to the introduction of mandatory sentencing. After several months, prisoner numbers re-approached the projected level, but dropped below it again in late 2013. Since then, the number of prisoners held for assault offences (the majority of violent offences) has shown seasonal fluctuations but no underlying growth.
65
6. Discussion
6.1 Offending and re-offending
No immediate changes in offence patterns (based on the 12-month rolling averages) appeared at the time the new mandatory sentencing provisions commenced. As the deterrent effect of mandatory prison sentences on offending is dependent on offenders and would-be offenders being aware of the policy, it is possible that such effects would not manifest themselves immediately. With the large decrease in recorded offences for Alice Springs and Tennant Creek that occurred at the time the larger-scale Point of Sale Interventions began (Figure 4), it would be difficult to discern a more gradual effect occurring as a result of the new sentencing provisions.
Deterrence assumes that offenders make a rational response to increased penalties for crime (Law Institute of Victoria 2011). However, violent acts are frequently impulsive rather than planned (Roth 2014). This suggests that even were offenders aware of the new legislation, their knowledge might not have an impact on their decision-making process in the heat of the moment. In addition, a significant (though currently declining) percentage of violent offences in the Northern Territory involve alcohol (Figure 3), which could further reduce the likelihood of offenders making a rational response.
While the 2013 mandatory sentencing provisions did not apply to first-time violent offenders in some cases (Figure 1) and did not result in an increase in the overall percentage of first-time offenders receiving actual imprisonment (Figure 21), this is a group that might reasonably be expected to respond to the threat of serving actual prison time. A reduction in the percentage of violent offence cases started for first-time Indigenous adult defendants was seen in the southern part of the Territory (Figure 10) from the time the new mandatory minimum sentence provisions began. However, the same pattern was not observed for first-time non-Indigenous defendants or for Indigenous defendants in the northern part of the Territory. Defendants with one prior conviction also did not decline as a percentage of the total, even though these defendants now face a greater penalty under the new provisions. This makes it difficult to link the result for Indigenous offenders in the south with the mandatory sentencing legislation.
Because the legislation is recent, re-offending impacts were only measured over one year, and used apprehension for a new offence, rather than conviction or re-imprisonment. Some authors have advocated that measures of re-offending must use either adjudication or conviction data (Harris et al. 2009), and strictly speaking, one who is not found guilty of an offence cannot be said to have re-offended. Nevertheless, Ringland (2013) found that Police apprehension data could provide a more timely measure of re-offending than court finalisations data. If the measure is used as an indicator within a program or a jurisdiction, and not taken as an absolute figure, then expressing re-offending as “re-appearance in the
66
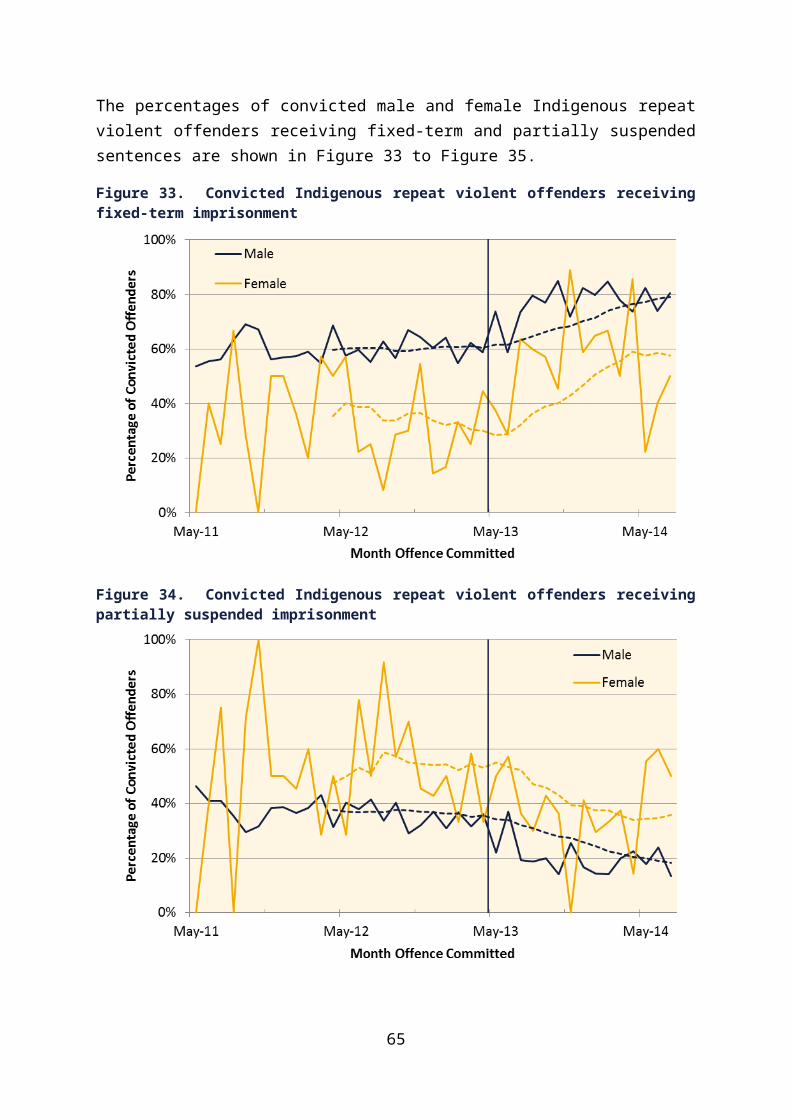
justice system”, as done in this review, may still provide useful information and may be the only measure available for assessments of very recent initiatives.
Re-offending by Indigenous males released from prison after serving time for offences committed under the new mandatory sentencing regime was significantly less than in the four previous years. Again, this result was not observed for non-Indigenous males and occurred for offenders sentenced in a court administered from Alice Springs (including Tennant Creek), but not for those sentenced in a court administered from Darwin. Hence, it seems likely that the drop in re-offending is also linked to the Point of Sale Interventions.
Conclusion: Offending and re-offending dropped following the introduction of mandatory minimum prison terms for violent offences, but this is thought to be due to another crime reduction initiative.
In this instance, re-offending was only measured for the space of one year. It is possible that the differences seen in the percentage of individuals re-offending from one year to the next will either disappear or be magnified after several years. Hence, the re-offending results presented here should be considered preliminary.
6.2 Sentencing
6.2.1 Imprisonment sentencesFor first-time violent offenders, the use of partially suspended imprisonment sentences began to decline markedly from around November 2012 (Figure 21). This decline corresponded with an increase in the use of fully suspended sentences and, to a smaller extent, fines. From July 2013 the use of fully suspended sentences declined again, with increases in fixed-term imprisonment and orders such as good behaviour bonds.
The existing mandatory sentencing provisions in the Sentencing Act resulted in 96 per cent of repeat violent offenders receiving actual imprisonment (Figure 22). This percentage remained unchanged following the introduction of mandatory minimum terms, although the use of partially suspended sentences dropped in favour of fixed-term sentences. Unpublished analyses of Northern Territory prisoner re-offending data suggest that short-term recidivism is less for offenders who are released to community supervision following prison (the situation for most offenders on partially suspended sentences) than for offenders on fixed-term sentences who are released with no further Correctional Services follow-up, even after controlling for prisoner security level and employment status. In New South Wales, a study of offenders who had been to prison before (Lulham et al. 2009) found that offenders who received a prison sentence re-offended substantially sooner than similar offenders who received a suspended sentence (although the NSW research may refer to fully, rather than partially, suspended sentences). Hence, a reduction in the use of partially suspended sentences could potentially result in an increase in re-offending.
67
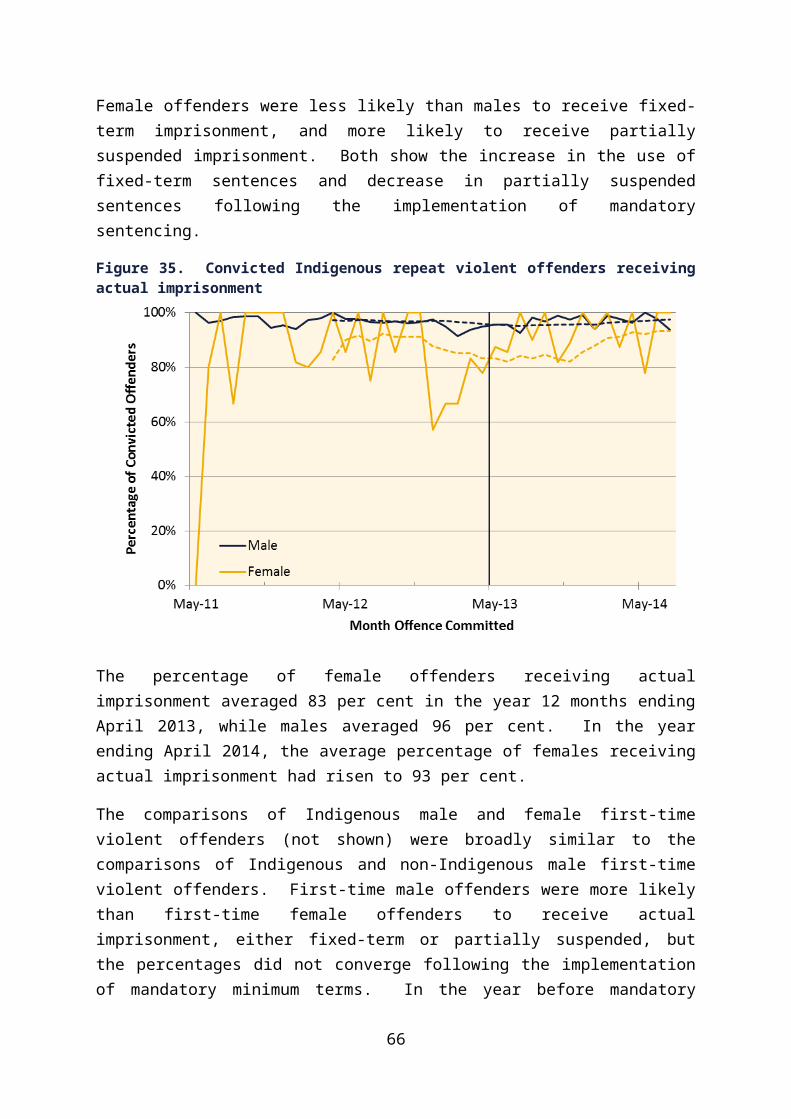
Conclusion: The introduction of mandatory minimum prison terms did not increase the overall percentage of violent offenders sentenced to prison, although it did result in changes to the type of imprisonment option used.
6.2.2 Sentence lengthThe 2013 mandatory minimum sentencing provisions resulted in an increase in both the full and minimum term sentence length for repeat violent offenders who were sentenced in the Court of Summary Jurisdiction (Figure 25). While the average minimum term, at 102 days in the year prior to the new provisions beginning, was already above the 3-month minimum that applied to most repeat violent offenders, it increased to an average of 127 days in the year following their commencement and 132 days by two years following commencement.
No increase in average sentence length occurred for first-time violent offenders. This is not unexpected, as only Level 4 and 5 offences carried minimum terms for first-time offenders, and of the Level 5 offences, those under section 181 of the Criminal Code Act are heard in the Supreme Court. While Level 4 offences could not be distinguished explicitly, the majority of Northern Territory violent offences are aggravated assault (section 188(2) of the Criminal Code Act), rather than offences covered in sections 188A and 189A. Hence, most first-time offenders, if subject to mandatory sentencing at all, would have only been required to serve a term of actual imprisonment, rather than a mandated minimum term.
No change in sentence length was observed for offenders sentenced in the Supreme Court (Figure 24); while the average minimum term did increase, this appears likely due to a few lower values in the months prior to the commencement of the mandatory minimum terms, rather than an increase in values afterwards. As the minimum and full terms given to offenders in the Supreme Court prior to the introduction of the new provisions averaged well over one and two years, respectively, no significant effect would be expected.
Conclusion: The introduction of mandatory minimum prison terms led to an increase in sentence length for repeat violent offenders sentenced in the Court of Summary Jurisdiction, but not for first-time violent offenders or offenders sentenced in the Supreme Court.
6.2.3 Consistency of sentencingSentencing consistency was compared for Indigenous and non-Indigenous males and for Indigenous males and females. Both sentence outcome (fixed-term versus partially suspended imprisonment) and sentence length showed a marked increase in consistency for Indigenous and non-Indigenous male repeat offenders following implementation of the new sentencing provisions. For first-time male offenders, a higher percentage of Indigenous offenders received prison sentences of each type, although the differences between Indigenous and non-Indigenous males were less following mandatory sentencing. Sentence lengths for male Indigenous and non-Indigenous first-time violent offenders were similar.
68
Sentencing consistency increased for Indigenous male and female repeat offenders. The percentage of female repeat offenders receiving actual imprisonment increased immediately following mandatory sentencing, although not quite to the level of male offenders. Proportionately more females received partially suspended sentences and fewer received fixed-term sentences than males, although the differences were smaller following the implementation of mandatory sentencing. Full-term sentence lengths for male and female repeat offenders were similar immediately following mandatory sentencing, and the differences in the minimum terms decreased; but approximately one year following mandatory sentencing both the full-term and minimum sentence lengths for females began to decrease, while those for males did not.
For first-time offenders, mandatory sentencing made little impact on either the percentage of males and females receiving imprisonment or on sentence length. Males were more likely than females to receive actual imprisonment, either fixed-term or partially suspended sentences. The average full-term sentence length was similar for males and females, but the average minimum term length was less for females.
Conclusion: The introduction of mandatory minimum prison terms was followed by an increase in the consistency of sentence outcome and sentence length for repeat violent offenders, but had relatively little impact on consistency of outcomes for first-time offenders.
6.3 Justice system operations
6.3.1 CourtsSome impacts of mandatory sentencing were observed on court processes. The main operational impact appears to have been an increase of approximately 19 days in the average time to finalise violent offence defendants pleading guilty and finalised in the Court of Summary Jurisdiction. This was accompanied by a slight increase in the average number of court appearances for defendants pleading guilty.
The percentage of violent offence defendants with a prior violent conviction who pled guilty declined slightly for offences committed from February 2013 onwards (Figure 49). The new mandatory sentencing legislation was passed in February 2013, although it was implemented on 1 May 2013 and applied only to offences committed from this date. It is possible, although not certain, that the decline in guilty pleas for repeat offenders was in anticipation of the mandatory sentencing legislation, as defence counsel were certainly aware of the legislation even if offenders were not.
Conclusion: The introduction of mandatory minimum prison terms resulted in an increase in the length of time and number of court appearances required to finalise defendants who pled guilty, and may have contributed to a decrease in the percentage of defendants with a final plea of guilty.
69
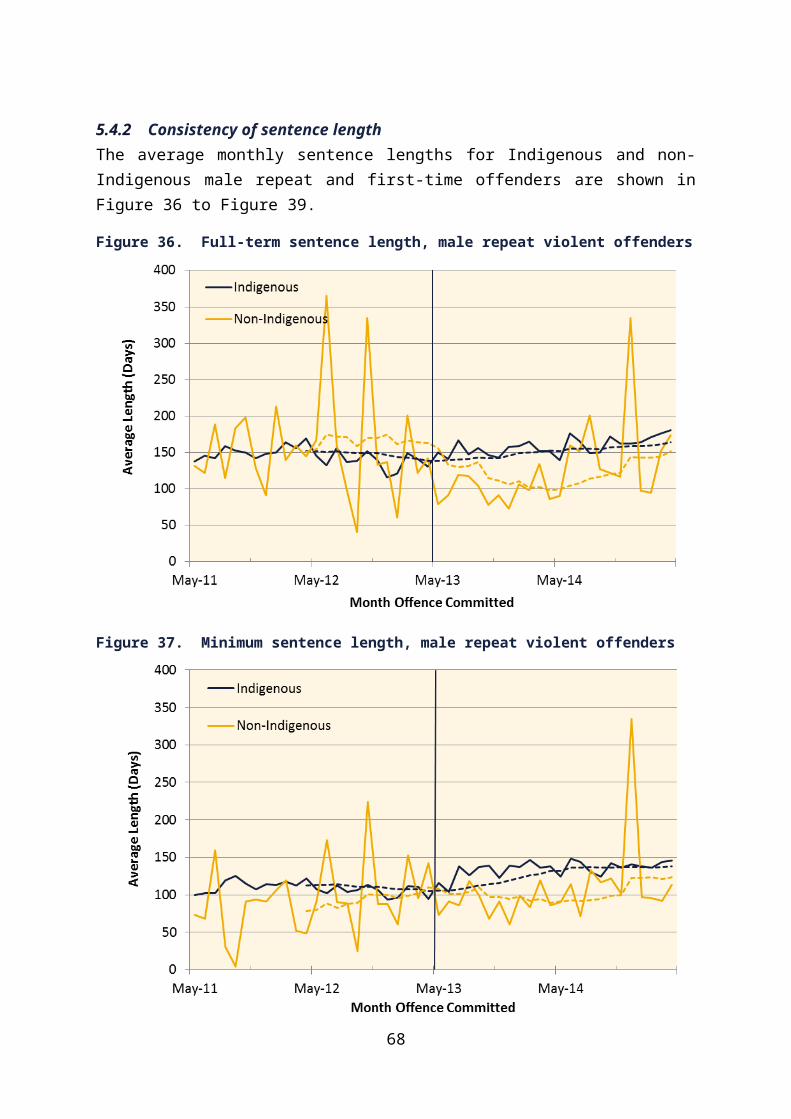
6.3.2 Prisoner numbersThe introduction of mandatory minimum prison terms is generally expected to increase prisoner numbers, either because a greater number of offenders are sent to prison and/or offenders are sent to prison for longer. In the current situation, the number of prisoners in custody for violent offences following the introduction of mandatory sentencing was lower than had been projected, based on the pattern of increase from April 2011 to March 2013.
While the new mandatory minimum sentencing provisions appear to have increased the percentage of defendants on remand at three months post apprehension (Figure 47), the overall number of prisoners held for assault offences did not increase (Figure 54). This is contrary to statements linking the Northern Territory’s high incarceration rates with the new mandatory sentencing legislation (e.g. Stein 2014a, 2014b), but consistent with Jackson and Hardy (2010) who found that the impact of mandatory sentencing for violent offences on Northern Territory prisoner numbers was much less than expected.
Almost all repeat violent offenders in the Northern Territory already received actual imprisonment (Figure 22), although the minimum sentence length for these offenders increased (Figure 25). Initially, the decreases in defendants pleading guilty and defendants who pled not guilty but were found guilty, coupled with the increased time to finalise defendants, may have interrupted the flow of offenders into prison and resulted in a temporary drop in the number of prisoners held for assault. While the actual numbers returned to the projected level for a few months, the implementation of the Point of Sale Interventions appeared to coincide with another departure from the projection, with the number of prisoners held for assault not showing material growth since early 2014, apart from seasonal fluctuations.
Conclusion: The introduction of mandatory minimum prison terms did not lead to an increase in the number of prisoners held for assault offences (the majority of violent offences). Prisoners held for assault decreased slightly before mandatory sentencing began and remained lower than expected for several months afterwards. The lack of later growth in assault prisoners is likely to be due to another initiative.
6.4 Context
“Mandatory sentencing” is sometimes discussed as though the concept refers to a sentencing regime with a common structure and application, which should have similar outcomes when applied in different jurisdictions. In fact, mandatory sentencing regimes have been applied in a variety of circumstances, to different types of offences and with differing penalty provisions and criteria for application. The background contexts of the jurisdictions in which they are applied may also differ considerably. Hence, it is not unreasonable to expect that the impacts should vary too.
In the United States, many studies of mandatory sentencing regimes have been undertaken at the macro level (as summarised in Stemen 2007) with overlapping county, state and
70
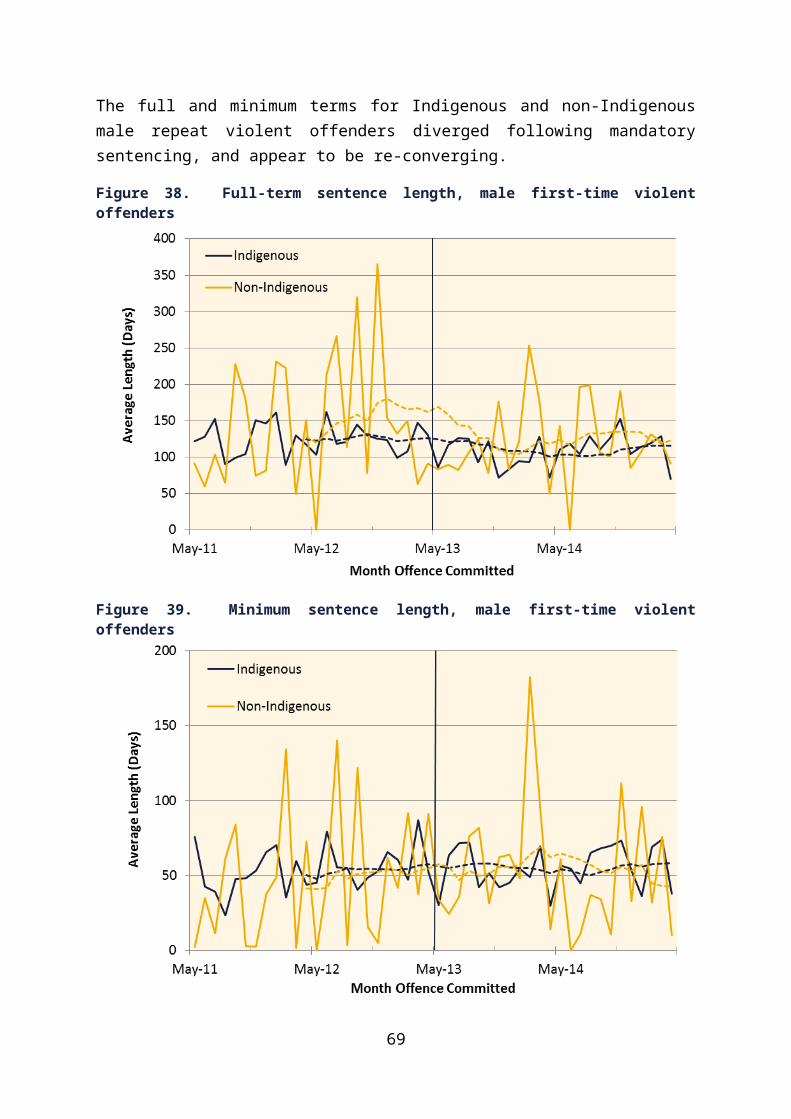
federal jurisdictions. In this type of analysis, changes in offending or prisoner numbers can be only generally linked with mandatory sentencing laws and (as noted by various authors) are likely to be influenced by a wide variety of criminal justice initiatives as well as socio-economic factors. As shown in this review, concurrent initiatives may significantly influence outcomes and make it difficult to ascribe change to a particular measure.
The findings of this report relate specifically to the Northern Territory sentencing law for violent offences. In 2013, mandatory minimum prison terms for certain violent offences were implemented in a jurisdiction characterised by existing mandatory imprisonment for repeat violent offenders and an already high imprisonment rate, where over half of adult prisoners, many of whom are repeat offenders, are incarcerated for violent offences (Department of Correctional Services 2015).
The Northern Territory mandatory minimum terms do not apply to first-time violent offenders for lower-level offending, resulting in the “safety valve” advocated in the United States for offenders with no criminal histories (Vincent & Hofer 1994). The Law Institute of Victoria (2011, pg. 9) notes that:
“The significant moral objections can be ameliorated by only applying mandatory sentencing regimes to the most serious and tightly defined class of offences, designed to capture the most culpable and blameworthy offenders who are at a high risk of reoffending. The definition would have to preclude first time offenders; it is generally accepted that repeat offenders are more morally blameworthy than first time offenders who may not offend again.”
In addition, a provision for “exceptional circumstances” was included in the 2013 legislation, allowing the judicial officer to waive the minimum term, although not the requirement for actual imprisonment, where circumstances are found to be exceptional. Roth (2014) notes that such provisions help ensure that mandatory sentencing laws do not result in excessively harsh sentences. Wilson v Berlin [2015] NTSC 52 provides an illustration of how exceptional circumstances may be considered by the court. As actual imprisonment may be for a term as short as a day or even a few hours (e.g. the time spent in a court holding cell), the Northern Territory 2013 mandatory minimum sentencing legislation may escape some of the manifest injustice claims made against mandatory sentencing regimes where no such safety-valve provisions exist.
The number of prisoners held for assault offences had been increasing steadily in the years prior to the introduction of mandatory minimum terms, and the expectation was that the new legislation would result in an even greater rate of increase due to increased sentence lengths, as well as the potential for more first-time offenders to attract a mandatory prison sentence. In fact, the number of offenders imprisoned for assault dropped below its projected pattern of increase shortly before the introduction of the new provisions, and as a result of other initiatives now appears to be stable, apart from seasonal variation. This
71

finding is contrary to the usual expectations for mandatory sentencing regimes and seems likely to be due to the combination of specific factors operating in the Northern Territory. This demonstrates the importance that the jurisdictional context, including other complementary initiatives, plays in determining the impacts to be expected as a result of introducing mandatory minimum sentences.
72
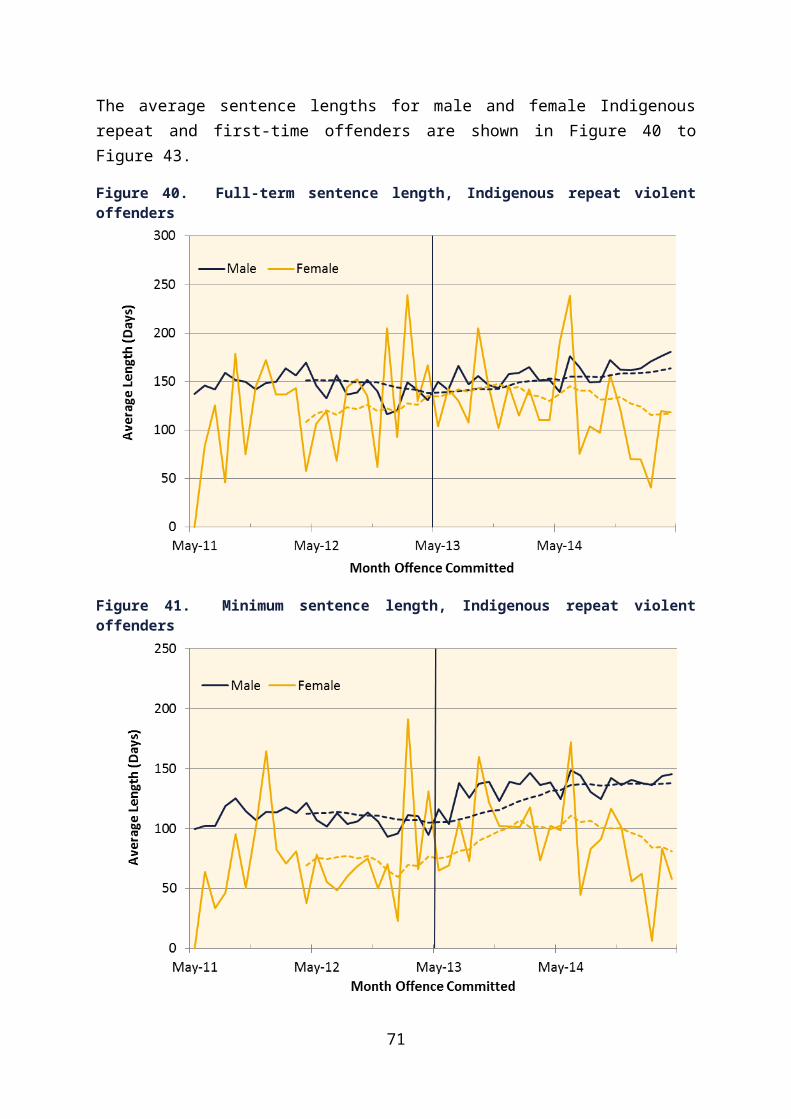
7. References
Australian Bureau of Statistics. 2009. National Offence Index, 2009. Cat. No. 1234.0.55.001. http://www.abs.gov.au/ausstats/[email protected]/Mf/1234.0.55.001 Retrieved 10 November 2015.
Bernick, E, & Larkin, P. 2014. Reconsidering mandatory minimum sentences: the arguments for and against potential reforms. Legal Memorandum No. 114. The Heritage Foundation. http://report.heritage.org/lm114. Retrieved 6 October 2015.
Brown, D. 2001. Mandatory sentencing: a criminological perspective. 7(2) Australian Journal of Human Rights 31. http://www.austlii.edu.au/au/journals/AJHR/2001/16.html. Retrieved 12 October 2015.
Department of Correctional Services. 2015. Annual Statistics 2013 – 2014. http://www.nt.gov.au/justice/policycoord/researchstats/documents/2013-14%20NTCS%20Annual%20Statistics.pdf. Retrieved 6 October 2015.
Department of Justice. 2009. Correctional Services Annual Statistics 2008 – 2009. http://www.nt.gov.au/justice/policycoord/documents/statistics/NTCS%20Annual%20Statistics%202008-09_EBook.pdf. Retrieved 6 October 2015.
Harris, P, Lockwood, B & Mengers, L. 2009. Defining and Measuring Recidivism [white paper]. Council of Juvenile Correctional Administrators. http://cjca.net/attachments/article/55/CJCA-Recidivism-White-Paper.pdf. Retrieved 13 October 2015.
Helland, E, & Tabarrok, A. 2007. Does three strikes deter? A non-parametric estimation. The Journal of Human Resources 42:2, 309-330. Available at: http://mason.gmu.edu/~atabarro/ThreeStrikes.pdf. Retrieved 6 October 2015.
Jackson, S, & Hardy, F. 2010. The impact of mandatory sentencing on Indigenous offenders. Paper presented at Sentencing Conference 2010, National Judicial College of Australia.
Law Council of Australia. 2014. Policy Discussion Paper on Mandatory Sentencing. http://www.lawcouncil.asn.au/lawcouncil/images/LCA-PDF/discussion%20papers/MS_Discussion_Paper_Final_web.pdf. Retrieved 6 October 2015.
Law Institute of Victoria. 2011. Mandatory Minimum Sentencing. http://www.liv.asn.au/getattachment/22c3c2c9-45a5-45c4-96e6-f0affdfe2ff8/Mandatory-Minimum-Sentencing.aspx. Retrieved 6 October 2015.
73
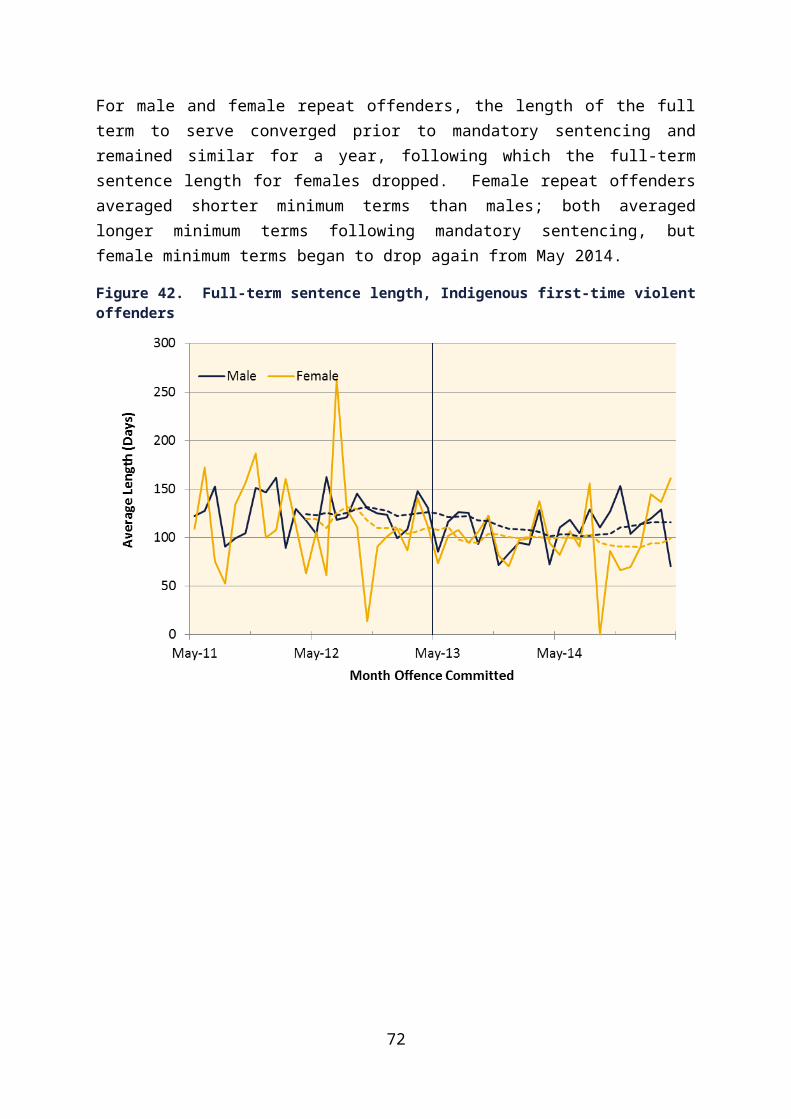
Lulham, R, Weatherburn, D & Bartels, L. 2009. The recidivism of offenders given suspended sentences: a comparison with full-time imprisonment. Crime and Justice Bulletin, No. 136. NSW Bureau of Crime Statistics and Research. http://www.bocsar.nsw.gov.au/Documents/CJB/cjb136.pdf. Retrieved 15 October 2015.
Moffatt, S, Weatherburn, D & Donnelly, N. 2005. What caused the recent drop in property crime? Crime and Justice Bulletin No. 85. NSW Bureau of Crime Statistics and Research. http://www.bocsar.nsw.gov.au/Documents/CJB/cjb85.pdf. Retrieved 6 October 2015.
Morgan, F & Clare, J. 2007. Household burglary trends in Western Australia. I on crime Bulletin No. 1, Crime Research Centre, The University of Western Australia. http://www.law.uwa.edu.au/__data/assets/pdf_file/0011/118388/I_on_Crime-Bulletin_No1-Household_Burglary_Trends_in_WA-1997.pdf. Retrieved 6 October 2015.
Morgan, N. 1999. Capturing crims or capturing votes? The aims and effects of mandatories. UNSW Law Journal Vol. 22, No. 1: 267-279. http://www.austlii.edu.au/cgi-bin/sinodisp/au/journals/UNSWLawJl/1999/52.html?query=. Retrieved 6 October 2015.
Office of Crime Prevention. 2003. Mandatory sentencing for adult property offenders: the Northern Territory experience. http://www.nt.gov.au/justice/policycoord/documents/statistics/mandatory_sentencing_nt_experience_20031201.pdf. Retrieved 6 October 2015.
Ringland, C. 2013. Measuring recidivism: Police versus court data. Crime and Justice Bulletin No. 175. NSW Bureau of Crime Statistics and Research. http://www.bocsar.nsw.gov.au/Documents/CJB/cjb175.pdf. Retrieved 24 August 2015.
Ross, S, & Guarnieri, T. 1996. Recidivism rates in a custodial population: the influence of criminal history, offence & gender factors. Criminology Research Council Grant 35/89. http://crg.aic.gov.au/reports/35-89.pdf. Retrieved 13 October 2015.
Roth, L. 2014. Mandatory sentencing laws. NSW Parliamentary Research Service e-brief 1/2014. https://www.parliament.nsw.gov.au/prod/parlment/publications.nsf/key/Mandatorysentencinglaws/$File/mandatory+sentencing+laws.pdf. Retrieved 15 October 2015.
Starr, S, & Rehavi, M. 2012. Racial disparity in federal criminal charging and its sentencing consequences. University of Michigan Law & Economics Empirical Legal Studies Center Paper No. 12-002. http://papers.ssrn.com/sol3/papers.cfm?abstract_id=1985377. Retrieved 26 August 2015.
74
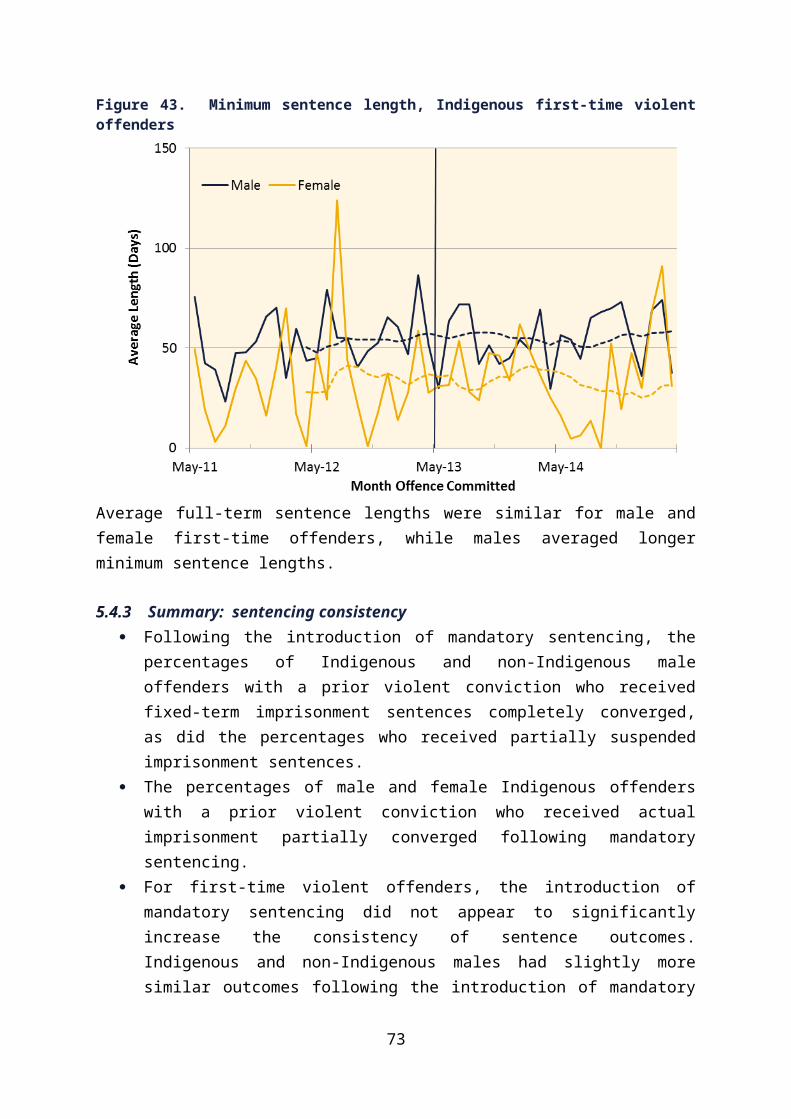
Stein, G. 2014a. Mandatory sentencing increases prison numbers (transcript). ABC News 28 May 2014. http://www.abc.net.au/news/2014-05-28/mandatory-sentencing-increases-prison-numbers/5485292. Retrieved 6 October 2015.
Stein, G. 2014b. Mandatory sentencing blamed for Northern Territory’s status as Australia’s top jailer. ABC News 28 May 2014. http://www.abc.net.au/news/2014-05-28/mandatory-sentencing-blamed-for-nt-status-as-top-jailer/5485124. Retrieved 6 October 2015.
Steman, D. 2007. Reconsidering incarceration: new directions for reducing crime. Vera Institute of Justice. http://www.vera.org/sites/default/files/resources/downloads/veraincarc_vFW2.pdf. Retrieved 7 October 2015.
Trevena, J, & Weatherburn, D. 2015. Does the first prison sentence reduce the risk of further offending? Crime and Justice Bulletin No. 187. NSW Bureau of Crime Statistics and Research. http://www.bocsar.nsw.gov.au/Documents/CJB/Report-2015-Does-the-first-prison-sentence-reduce-the-risk-of-further-offending-cjb187.pdf. Retrieved 2 December 2015.
Vahlberg, D. 2000. “Profile of prisoners received into custody at Darwin Correctional Centre in the Northern Territory and their health status upon reception.” MPH treatise, The University of Sydney.
Vincent, B, & Hofer, P. 1994. The consequences of mandatory minimum prison terms: a summary of recent findings. Federal Judicial Centre. http://www.fjc.gov/public/pdf.nsf/lookup/conmanmin.pdf/$file/conmanmin.pdf. Retrieved 15 October 2015.
Western Australian Government. 2014. Statutory review: operation and effectiveness of the 2009 amendments to Sections 297 and 318 Criminal Code. http://www.parliament.wa.gov.au/publications/tabledpapers.nsf/displaypaper/3911784a454ff1b5196d5ff448257d04000d6089/$file/1784.pdf. Retrieved 6 October 2015.
Western Australian Police Union of Workers. 2013. Mandatory sentencing report. https://www.wapu.org.au/images/PoliceNews/WAPU_MandatorySentencingReport.pdf. Retrieved 6 October 2015.
Legal Authorities
Sentencing Amendment (Mandatory Minimum Sentences) Bill 2012. Second Reading Speech. http://www.austlii.edu.au/cgi-bin/sinodisp/au/legis/nt/bill_srs/samsb2012493/srs.html?stem=0&synonyms=0&query=sentencing%20amendment%20mandatory%20minimum%20sentences. Retrieved 10 September 2015.
75
Wilson v Berlin [2015] NTSC 52. http://www.supremecourt.nt.gov.au/documents/judgements/2015/NTSC52.pdf. Retrieved 15 October 2015.
76
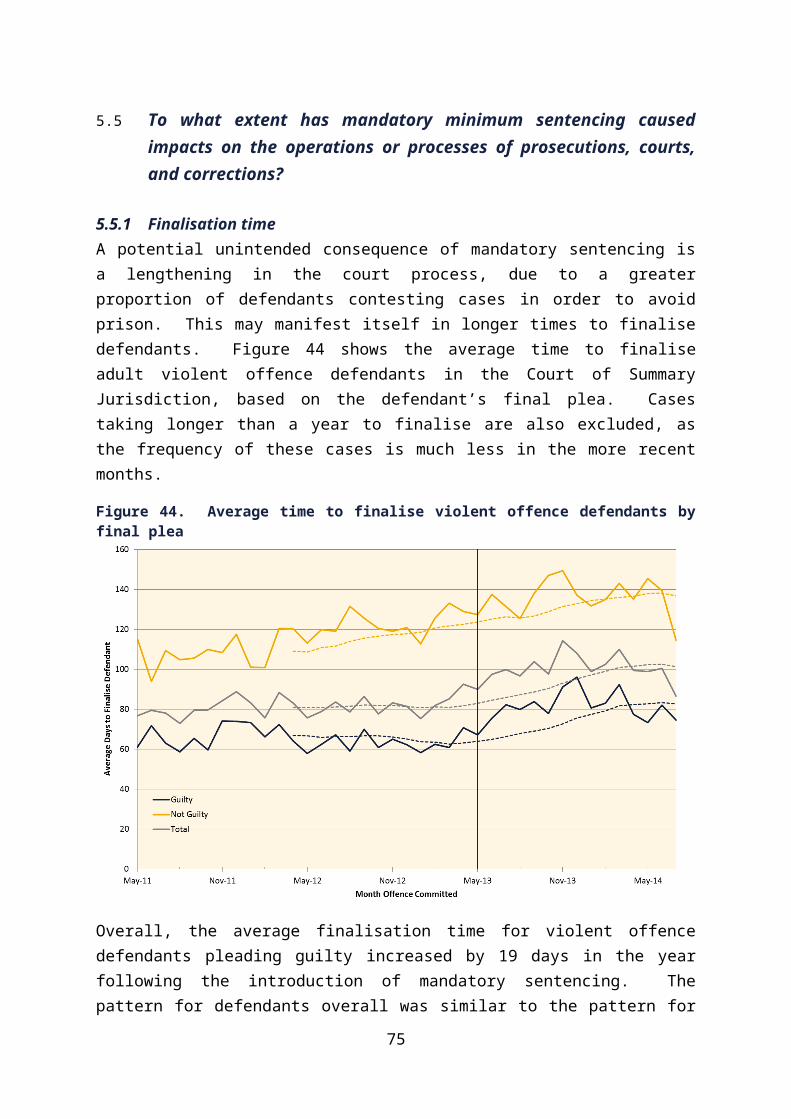
8. Appendix 1
List of Violent Offences Included
Criminal Code (As stated in Schedule 2 of the Sentencing Act)section 54 Terrorismsection 55 Contribution towards acts of terrorismsection 155A Assault, obstruction etc. of persons providing rescue, medical
treatment or other aid if the offender assaulted the other personsection 156 Murdersection 160 Manslaughtersection 161A Violent act causing deathsection 165 Attempt to murdersection 166 Threats to killsection 175 Disabling in order to commit crimesection 176 Stupefying in order to commit crimesection 177 Acts intended to cause serious harm or prevent apprehensionsection 181 Serious harmsection 182 Attempting to injure by explosive substancessection 185 Setting man-trapssection 186 Harmsection 188 Common assault other than in circumstances mentioned in
section 188(2)(k)section 188A Assaults on workerssection 189 Unlawful stalkingsection 189A Assaults on policesection 190 Assaults on the Administrator or judges or magistratessection 191 Assaults on member of crew of aircraftsection 193 Assaults with intent to commit an offencesection 194 Kidnapping for ransomsection 211 Robberysection 212 Assault with intent to steal
Criminal Code Act 1995 (Commonwealth)5
section 147.1 Conduct to cause harm to a Commonwealth official
Crimes (Aviation) Act 1991 (Commonwealth)Section 21 Assault or threaten a crew member
5 As noted in section 78C of the Sentencing Act, a violent offence may include offences substantially the same as those listed from the Northern Territory Criminal Code against a law of another jurisdiction. Two such offence types occurred in the time period covered by the analyses, and so were included in the analyses.
77

9. Appendix 2
Program Logic
The legislation is underpinned by several assumptions and intended outcomes in the medium and longer terms. Some outcomes may also occur in the short and medium terms as a consequential result of the legislation.
9.1 Assumptions
1. Going to prison is a deterrent to would-be offenders (punishment leads to deterrence leads to protection).
2. The practices of Police officers, prosecutors, magistrates, justices, juries and others involved in the justice system will not change in such a way as to reduce the number of offenders charged, prosecuted and convicted of offences that attract mandatory minimum sentences.
3. If an offender is proven guilty of a relevant offence, an imprisonment sentence of at least the mandatory minimum length will be imposed by the court as prescribed in the legislation, except where exceptional circumstances exemptions are granted.
4. Exemptions for exceptional circumstances will be the exception rather than the rule.5. Plea bargains and similar mechanisms will not enable offenders to avoid the mandatory
minimum sentences.6. Prison space will not limit the imposition of mandatory imprisonment terms where
warranted.7. Seeing offenders sent to prison helps victims feel that justice has been served.
9.2 Outcomes
Certain outcomes are directly related to the stated intent of the legislation; others are potential operational consequences of implementing the legislation. While the literature on impacts of mandatory minimum sentencing elsewhere indicates the potential for such consequences, they may be mitigated by other initiatives in the justice sector. If they occur, the consequential outcomes may be of short duration or persistent, and may have flow-on implications for operational responses, including planning for demands on court or corrections staffing. The consequential outcomes listed are not necessarily expected to occur, but information will be monitored to determine whether they are occurring, where possible.
9.2.1 Outcomes that may occur in the short term 1. The percentage of defendants who plead not guilty for assault will increase.2. The number and length of hearings and trials will increase.3. The waiting times for hearings, trials and sentencing will increase.4. The number of people on remand or bail for assault will increase.5. The percentage of violent offenders charged that are proven guilty may decrease (some
that would have pled guilty may now be acquitted or have charges withdrawn).
78
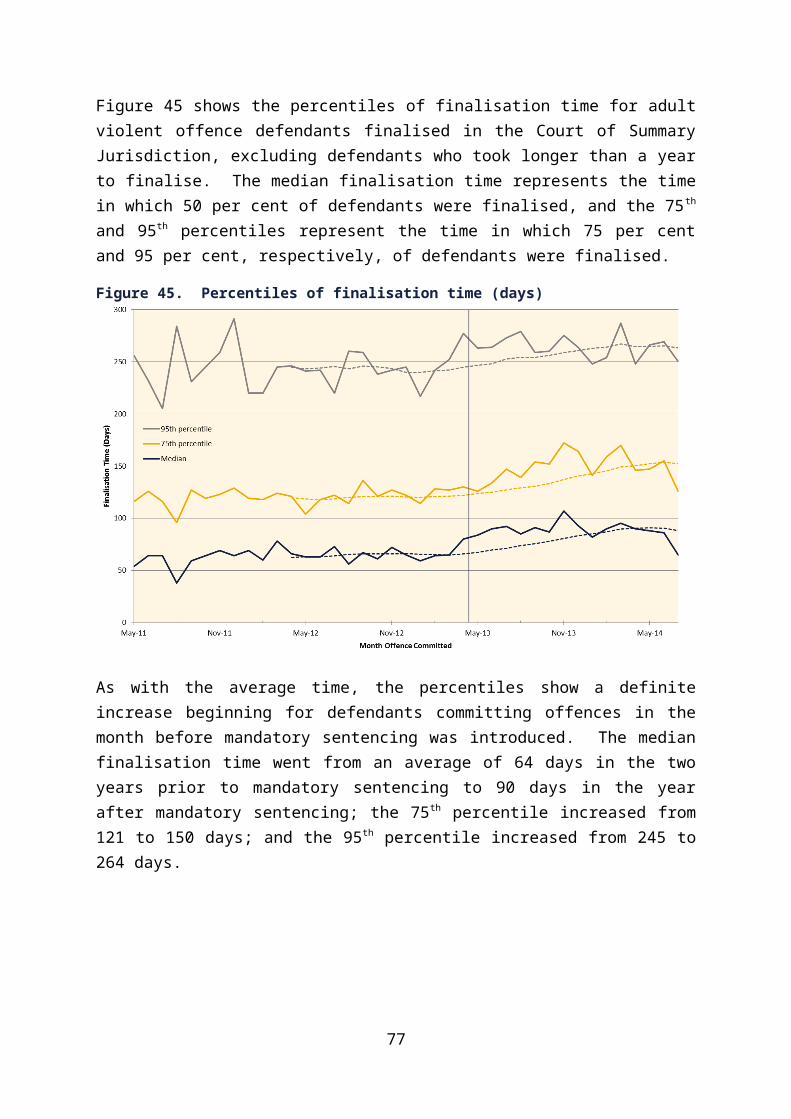
6. Some violent offenders who plead guilty straight away may avoid the mandatory minimum sentence if the prosecution does not have time to prove the required harm element.
7. The percentage of convicted violent offenders sentenced to actual prison time will increase.
8. The average sentence length for convicted violent offenders will increase.9. Victim satisfaction with the service of justice will increase (or may decrease initially, if
the court process time increases).10. The number of violent offenders in prison will increase.
9.2.2 Outcomes that may occur in the medium term11. The average time actually served by violent offenders will increase.12. Victim mental and emotional healing will be faster.13. Convicted offenders will spend a higher proportion of their sentence on remand.14. The number of violent offenders requiring correctional programs will increase.15. The number of violent offenders in prison long enough to undertake programs will
increase.16. The return to prison recidivism rate will increase initially as a result of ensuring repeat
offenders go to prison.
9.2.3 Outcomes that may occur in the longer term17. The number of violent offences committed will decrease.18. The severity of violent offences committed will decrease.19. The likelihood that a released offender commits a repeat violent offence will decrease.20. The number of first-time offenders will decrease (as a percentage of total offenders).
79
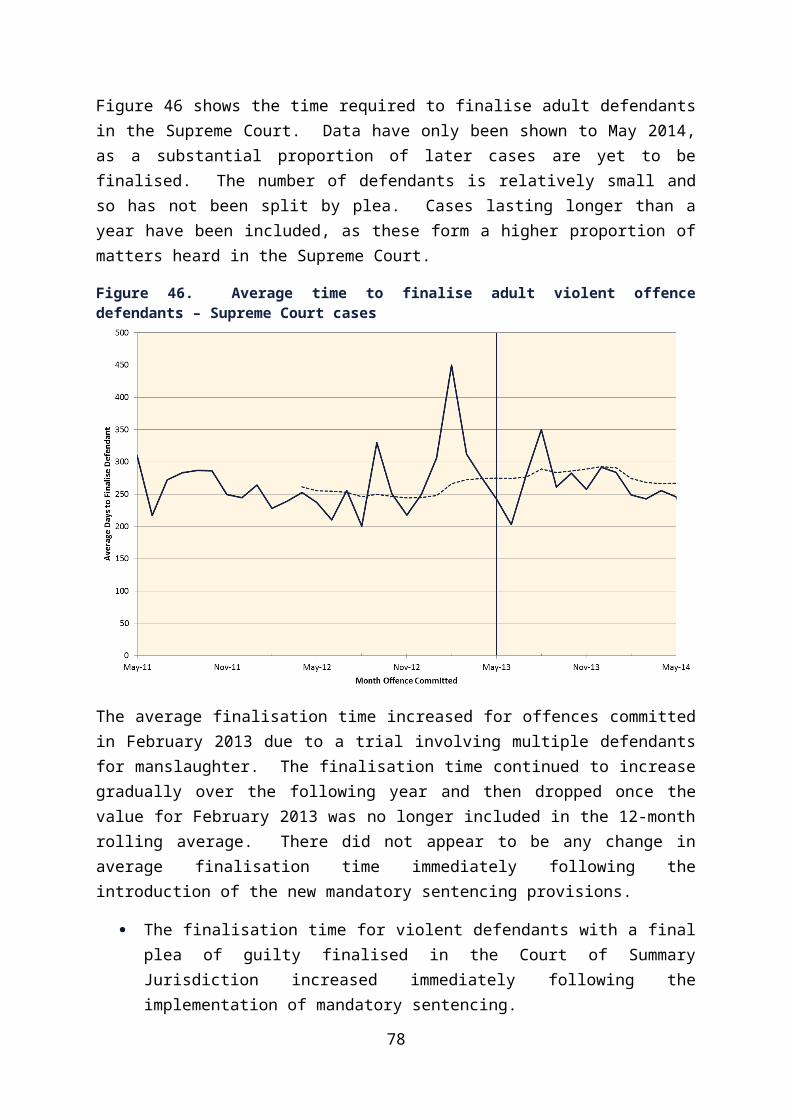
Mandatory Minimum Sentencing Review
9.3 Program logic model
The program logic model links the problem to the inputs, activities and outputs of the legislation, and the intended and potential consequential outcomes.
Problem / Issue Inputs Activities OutputsOutcomes
Short term Medium term Long termViolent offenders may serve little or no time in prison
The current situation does not adequately deter the commission of violent offences, nor the repetition of offending behaviour
Legislation specifying mandatory minimum sentences for specific offences
New data capture process for offence level and exceptional circumstances
Modification to the IJIS system to enable new data to be stored and retrieved
ApprehensionsBailPreparation of casesPleasHearingsTrialsSentencingAppeals
ConvictionsSentencesExceptional circumstances exemptions (granted at judicial officer’s discretion)
Offenders know they will go to prison for violent offencesMore offenders resist arrestClear-up time increasesMore contested hearings / trials (more not guilty pleas)Longer court process timesMore time spent on bail, remand and pre-sentencingConvicted offenders receive minimum mandatory terms / exemptionsMore violent offenders in prison with longer sentencesPrison population increases
Increased time servedIncreased need for violent offender programsIncreased recidivism (initially)Change in sentencing for non-violent offendersNTG budget for Courts and Correctional Services increased
Fewer violent offences committedReduced severity of violent offences committedDecreased recidivismFewer first-time offenders coming into prison system
Victims of violent offences feel they do not receive justice when offenders do not serve prison time
Victim support services
Victims see violent offenders receive prison sentences and see their views considered in exceptional circumstance exemptionsVictims experience more frustration at longer delaysVictim satisfaction with service of justice increases (after sentencing)
Victims heal faster mentally and emotionally
80
Mandatory Minimum Sentencing Review
10. Appendix 3
Detailed Counting Rules
10.1 Sentence length
Sentence length was assessed on an offender basis, rather than an offence basis, as offenders who are sentenced for multiple violent offences may be required to serve the sentences concurrently, consecutively, or a mix of the two, and often the minimum time to serve in such situations is given only for the combination of offences, rather than for each offence individually. Only the violent offences for which the offender was being sentenced were considered. Murder and manslaughter offences were left out of these calculations, as the mandatory minimum terms for those were already well above the minimums set by the new mandatory sentencing provisions, and inclusion of these offences would have obscured the results for the assaults and other violent offences, which are the majority of the offences affected by the new provisions.
For the purposes of this report, the sentence length was calculated for offenders receiving fixed term or partially suspended imprisonment sentences as follows.
10.1.1 Fixed-term imprisonment1. Offender receives a fixed term sentence for a single violent offence: the full term is the
length of the term specified in the order6. The minimum term is the non-parole period, if one is specified, or the full term if no non-parole period is specified.
2. Offender receives fixed-term sentences for multiple violent offences: the full term is the aggregate sentence length, if one is specified, or the longest of the fixed term sentences if no aggregate sentence is specified. The minimum term is the non-parole period, if one is specified, or the full term if no non-parole period is specified.
3. Offender receives fixed-term sentences for non-violent offences, in addition to one or more violent offences: the full term for the violent offences is the minimum of the aggregate sentence and the sum of the fixed terms for the violent offences, or the longest of the fixed-term violent offence sentences if no aggregate sentence is specified. The minimum term is the minimum of the non-parole period and the full term for the violent offences, or the full term if no non-parole period is specified.
10.1.2 Partially suspended imprisonment1. Offender receives a partially suspended sentence for one or more violent offences, with
or without additional non-violent offences: the full term is calculated as in Section 10.1.1. The minimum term to serve may be specified in various ways:
6 Life sentences have no full term specified, but do have a non-parole period.
81
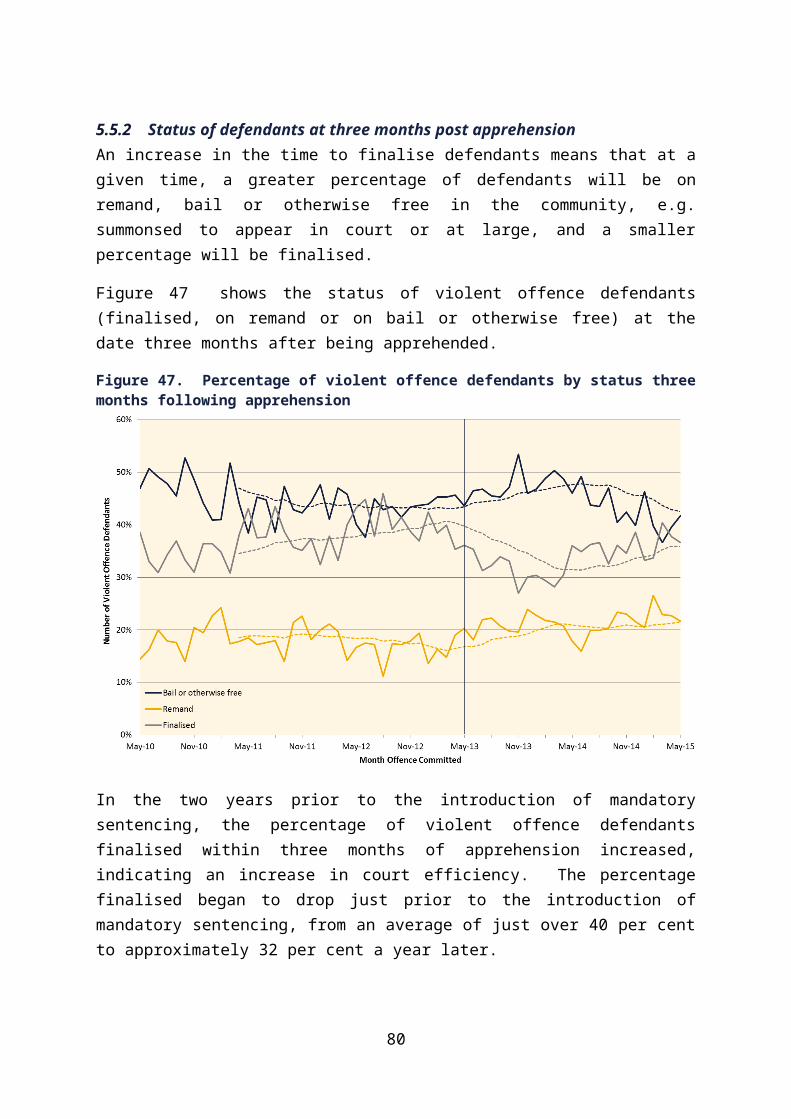
Mandatory Minimum Sentencing Review
a. Released forthwith. The offender is released immediately following sentencing. If the sentence is backdated to include time served on remand, the minimum time to serve is the number of days from the sentence start date to the sentencing date. If no sentence start date was indicated, a minimum term of one day was used.
b. Released at the rising of the court. The offender is released on the day of sentencing when the court session finishes. If the sentence is backdated to include time served on remand, the minimum time to serve is the number of days from the sentence start date to the sentencing date. If no sentence start date was indicated, a minimum term of one day was used.
c. Released on bond (specified release date). The offender is released on a bond on a specified date. The minimum term is the number of days between the sentence start date (if one is specified) or the sentencing date and the bond release date.
d. Released on bond (specified length of time). The offender is released on a bond after a specified length of time, which may be expressed in hours, days, months or years. The minimum term is the specified length of time (if less than one day, a minimum term of one day was used).
10.1.3 Additional informationIf the bond or non-parole period also covered offences other than violent offences and the length of the bond or non-parole period was greater than the full term calculated for the violent offences, the minimum term to serve for the violent offences was set to the full term for the violent offences.
All sentence lengths were calculated in full days. Sentences or bonds given in months were converted to days as 365.25/12 rounded to the nearest day. Sentences specifying start and/or release dates count both the start day and the release day as days served. Sentences may include time spent in custody in police cells, court cells or prison.
As the interest for the purpose of this review was on the sentence lengths given, rather than the offender compliance with the terms of the sentences, the minimum term was based on the first sentencing occasion for a particular offence. If an offender who initially received a partially suspended sentence was later brought back to serve the full term due to a breach of conditions, the minimum term to serve for that offender was not re-set to the full term. Hence, actual time served would have been greater than the minimum term for some offenders.
Checks were performed against the sentence calculations done for offenders sent to prison, although these were not the same if the offenders were also imprisoned for non-violent offences or if the time for the new offences was added to existing time the offender was already serving.
82
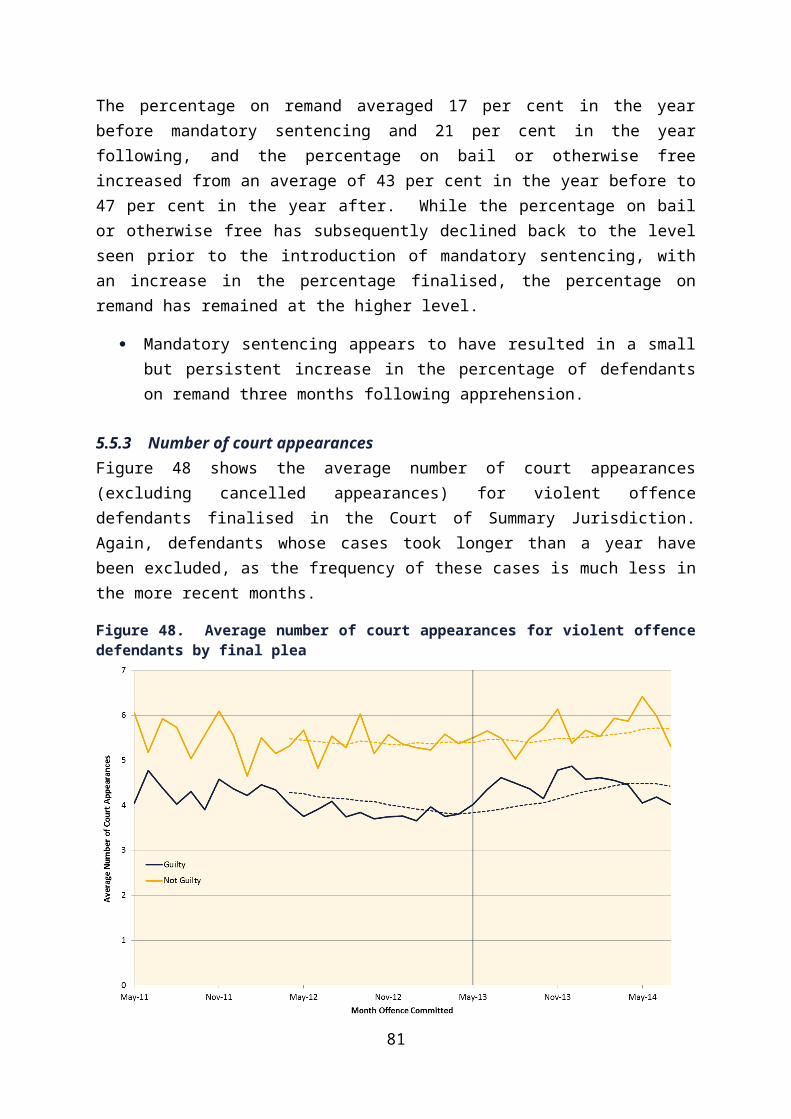
Mandatory Minimum Sentencing Review
10.2 Re-offending
For the purposes of this analysis, re-offending was measured as the percentage of convicted violent offenders who were apprehended for a new violent offence within 12 months of:
a. Release from court (mainly offenders sentenced to penalties other than imprisonment, but also including some offenders released after serving their minimum term on remand or after spending one to a few days in Police or court cells); or
b. Release from prison (e.g. a correctional facility administered by Department of Correctional Services).
While traditional measures of re-offending relate to persons returning to prison for new offences, the time required to wait for sentencing makes it difficult to obtain timely results for program evaluation, especially for initiatives that have only been in place for a few years. Measuring re-offending at the point of apprehension and charging allows for more timely analysis than does measuring following sentencing, even though not all of those charged will be ultimately convicted. Ringland (2013) estimated that using persons proceeded against by police as a measure of re-offending could potentially enable program evaluations in New South Wales to be conducted six months earlier than using court finalisation data.
Changes in re-offending behaviour may not manifest themselves for several years. Analyses measuring re-offending over a longer time period may detect changes that are not significant at the 12-month mark, and so the re-offending analyses here should be considered preliminary.
The population considered for the re-offending analysis included adult offenders convicted of committing violent offences between May 2009 and April 2014, who were either released from court (if not sent to prison following sentencing) or released from prison at least 12 months prior to the date of analysis. Not all offenders who committed offences in these years could be included, particularly if they were sentenced to imprisonment, as the assessment required they have been released into the community for at least a year. Some of those sentenced for offences committed in the latter years shown are either still in prison or have been released within the last year.
The starting date for each offender was the date the offender was finalised in court, if they were released from court, or the date they were released from prison following finalisation. Offenders who were apprehended for a new violent offence within 12 months of their starting date were counted for the purposes of this analysis as having re-offended. A new violent offence was defined as a violent offence committed on or after the starting date.
Offenders who were received in prison prior to being apprehended for a new violent offence (either because they breached conditions of a suspended sentence, parole or bail, or because they were received in prison for an offence committed prior to the starting date or
83
Mandatory Minimum Sentencing Review
a non-violent offence) were excluded from consideration, because they were not free to re-offend during the entire period between their starting date and their date of first apprehension for a new violent offence.
Re-offending patterns differ by Indigenous status, sex and prior criminal history. There were too few non-Indigenous females for the results to be meaningful, so analyses are only shown for Indigenous and non-Indigenous males and Indigenous females, with separate analyses for offenders released from court and offenders released from prison. Each analysis shows the percentage re-offending by offenders committing offences in each year. Error bars on the individual percentages represent the 95 per cent confidence limits for the percentages. Statistical significance in this section means a p-value of 0.05 or less was returned using a chi-square test. The p-value indicates the probability that the difference observed between the re-offending percentages could be a result of random chance. Where the p-value is 0.05 or less, there is at most a 5 per cent chance that the difference in the percentages is due to chance.
84
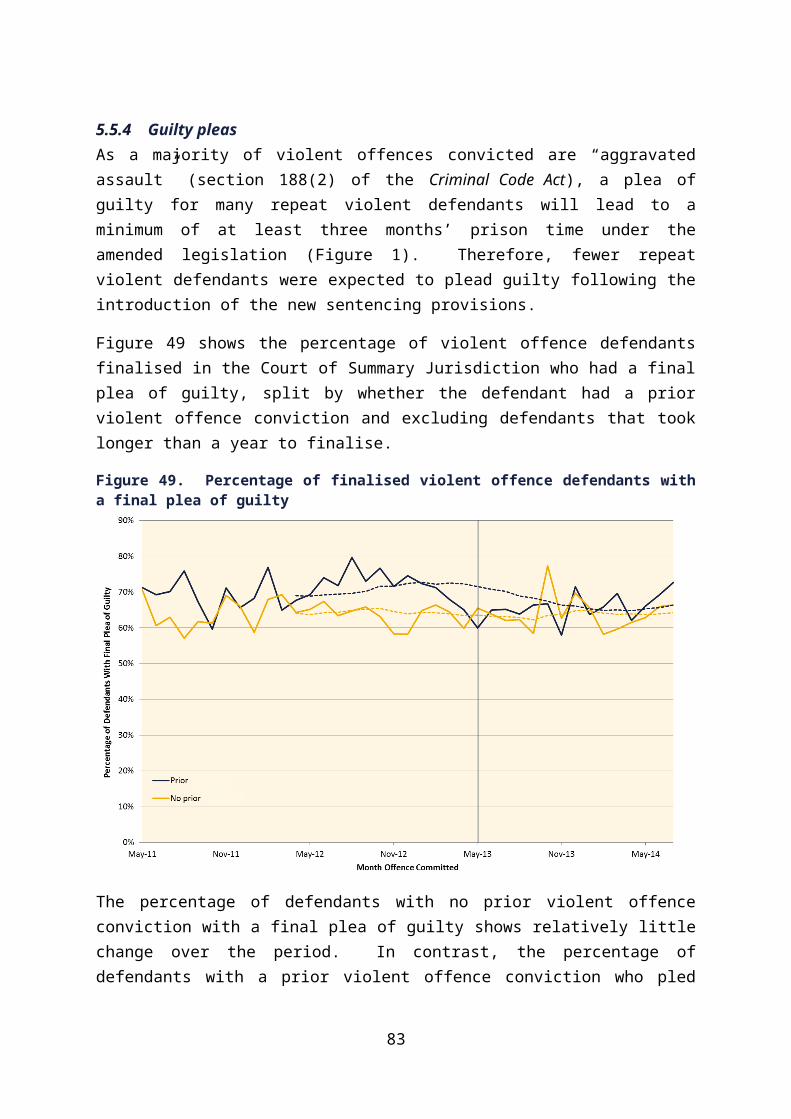
Mandatory Minimum Sentencing Review
11. Appendix 4
Data Tables
Table 1. Monthly recorded violent offences7 by alcohol and domestic violence involvement2009 2010 2011 2012 2013 2014 2015
Month Alcohol DV NonDV DV NonDV DV NonDV DV NonDV DV NonDV DV NonDV DV NonDV
Jan Yes 187 165 243 164 229 138 242 144 257 142 239 122 162 141
No 44 45 60 44 84 41 91 49 101 66 92 54 100 78
Unk8 51 84 41 82 44 65 38 95 57 65 42 55 44 62
Feb Yes 167 114 184 135 211 130 194 127 227 134 199 102 165 114
No 44 58 45 54 59 55 76 57 114 56 75 58 96 56
Unk 37 72 38 76 26 63 31 71 45 58 39 44 42 67
Mar Yes 198 137 198 161 192 131 235 138 291 146 200 109 201 138
No 45 53 65 52 69 68 93 72 110 63 105 69 107 51
Unk 39 98 31 112 34 84 28 99 42 77 33 71 49 77
Apr Yes 174 132 216 146 192 116 199 146 263 136 232 150 184 100
No 41 36 53 48 67 47 97 48 99 69 88 55 89 56
Unk 30 96 30 97 32 87 39 75 45 60 35 62 45 68
May Yes 157 130 185 110 153 125 230 129 247 137 199 113 163 78
No 48 40 49 63 69 55 74 61 98 51 113 70 95 69
Unk 29 74 39 63 34 57 38 61 44 60 41 61 44 67
Jun Yes 171 95 154 90 161 119 207 108 244 135 177 93 188 93
No 54 31 59 34 69 41 83 43 92 49 97 66 85 60
Unk 26 56 28 72 34 64 29 54 31 63 32 43 36 58
Jul Yes 169 120 215 148 189 117 210 121 283 130 246 117
No 39 30 53 43 57 45 72 54 85 57 97 55
Unk 33 82 27 67 34 86 38 53 36 76 33 49
Aug Yes 153 118 193 153 170 118 201 109 323 125 228 112
No 73 27 61 52 60 54 82 63 83 64 111 60
Unk 46 63 21 71 23 54 36 71 41 69 39 65
Sep Yes 198 117 215 143 204 148 197 158 285 129 242 111
No 70 58 57 50 76 60 62 42 106 58 98 66
Unk 29 80 33 67 31 67 32 57 32 52 30 72
Oct Yes 200 133 217 148 234 128 209 129 260 134 226 115
No 57 53 79 54 89 57 83 66 115 51 104 86
Unk 42 95 28 78 41 81 48 67 49 67 42 78
Nov Yes 201 143 185 147 212 132 188 140 230 121 229 132
No 64 61 85 49 94 59 89 63 121 66 111 74
Unk 40 102 32 77 42 53 35 62 36 55 41 70
Dec Yes 239 148 216 172 269 146 254 167 286 159 231 123
No 70 39 67 42 95 64 94 67 97 55 116 68
Unk 37 91 37 72 37 71 33 73 39 55 38 65
Data for Figures 2 and 3.
7 These data are counts of violent offences as defined in Appendix 1. They will therefore differ from the Northern Territory Crime Statistics for assault in the months shown, although the patterns are similar.8 Unknown alcohol involvement. The involvement of alcohol cannot be determined for some incidents.
85
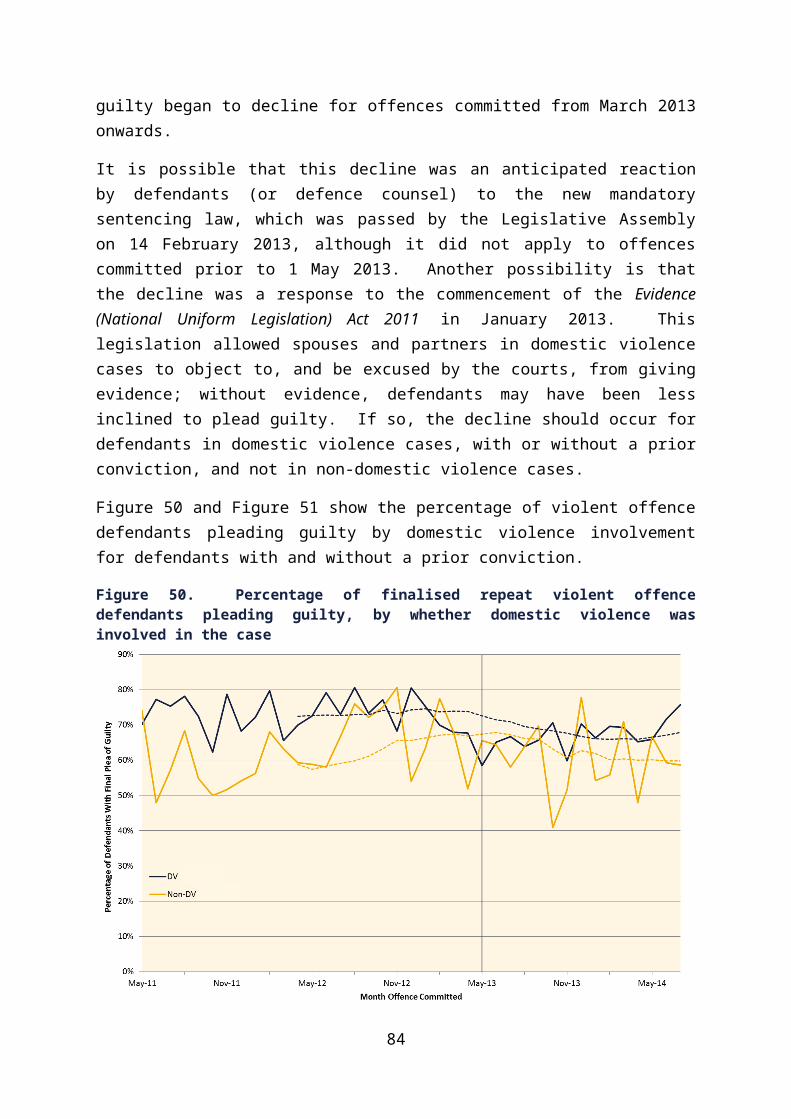
Mandatory Minimum Sentencing Review
Table 2. Monthly recorded violent offences9 by regionRegion Month 2009 2010 2011 2012 2013 2014 2015Alice Springs and Tennant Creek Jan 166 253 200 231 220 204 153
Feb 146 152 191 192 224 145 157
Mar 180 208 209 195 288 141 169
Apr 159 228 185 184 208 167 154
May 146 169 177 178 201 153 131
Jun 138 154 166 171 196 122 141
Jul 147 175 166 171 255 140
Aug 125 157 140 190 242 141
Sep 159 194 187 165 216 156
Oct 192 182 211 179 223 139
Nov 211 173 178 188 191 142
Dec 186 223 218 209 227 139
Katherine Jan 74 47 60 71 52 53 29
Feb 64 51 68 45 63 32 25
Mar 49 76 70 73 47 51 24
Apr 67 51 49 54 53 63 40
May 46 49 36 63 52 46 46
Jun 54 40 37 49 44 40 33
Jul 66 63 47 63 61 61
Aug 65 53 40 55 75 59
Sep 77 47 46 68 72 50
Oct 67 55 54 84 60 69
Nov 64 73 56 55 34 50
Dec 68 50 57 66 61 46
Rest of the Territory Jan 336 334 341 357 416 347 405
Feb 282 329 285 319 347 340 358
Mar 341 335 299 397 394 395 430
Apr 283 311 307 366 411 392 348
May 286 291 280 352 384 398 339
Jun 241 243 285 304 374 346 346
Jul 260 315 315 314 351 396
Aug 290 341 299 317 388 415
Sep 316 324 353 315 374 413
Oct 321 367 365 339 393 443
Nov 336 329 358 334 404 465
Dec 370 333 407 413 403 456
Data for Figure 4.
9 These data are counts of violent offences as defined in Appendix 1. They will therefore differ from the Northern Territory Crime Statistics for assault in the months shown, although the patterns are similar.
86

Mandatory Minimum Sentencing Review
Table 3. Number of new violent offence cases started by month offence committed and number of prior violent offence convictions
2010 2011 2012 2013 2014 2015
Priors 0 1 2+ 0 1 2+ 0 1 2+ 0 1 2+ 0 1 2+ 0 1 2+
Youth10 defendants
Jan 14 3 2 21 3 0 23 1 2 15 0 0 28 2 0
Feb 18 0 1 27 1 1 25 2 1 15 2 4 26 0 0
Mar 18 2 2 25 1 0 39 0 3 24 2 0 25 2 1
Apr 18 2 0 12 4 1 34 2 0 27 2 2 24 1 1
May 27 3 1 8 2 0 17 3 4 11 1 0 28 1 1 22 0 0
Jun 4 0 0 10 2 1 13 1 0 26 1 0 13 0 0 15 2 0
Jul 10 1 1 22 2 2 28 1 0 15 1 0 18 1 1 24 1 0
Aug 8 2 1 15 1 2 21 0 2 22 1 1 23 1 0
Sep 20 1 2 13 1 0 18 1 1 23 2 1 28 0 0
Oct 22 0 0 14 4 0 28 0 2 31 2 1 21 3 0
Nov 19 4 1 10 3 2 19 1 0 31 4 0 20 0 0
Dec 8 4 1 28 5 3 24 1 2 25 4 0 25 2 0
Adult defendants
Jan 118 63 97 124 56 104 179 66 133 131 72 117 129 44 96
Feb 110 37 90 111 47 83 164 79 145 142 70 115 123 50 115
Mar 109 44 93 161 72 111 187 83 130 137 65 109 123 51 111
Apr 91 35 72 154 51 98 164 75 124 154 68 101 124 45 102
May 90 46 73 74 32 82 137 70 101 152 65 130 149 65 108 109 47 90
Jun 88 41 69 89 29 72 119 44 100 148 65 114 115 55 124 82 54 111
Jul 108 45 109 81 42 68 125 58 101 176 69 135 132 60 137 79 42 92
Aug 85 34 83 76 33 74 138 58 92 167 64 159 161 62 127
Sep 92 34 99 88 40 89 118 59 112 165 74 153 129 61 109
Oct 131 42 80 111 58 93 129 64 98 192 62 131 147 63 132
Nov 98 37 70 120 46 95 137 60 100 159 62 112 139 74 129
Dec 110 61 105 159 48 102 178 67 136 151 77 132 128 59 121
Data for Figure 5.
10 Youth refers to defendants aged 10-17 at the time the offence was committed.
87
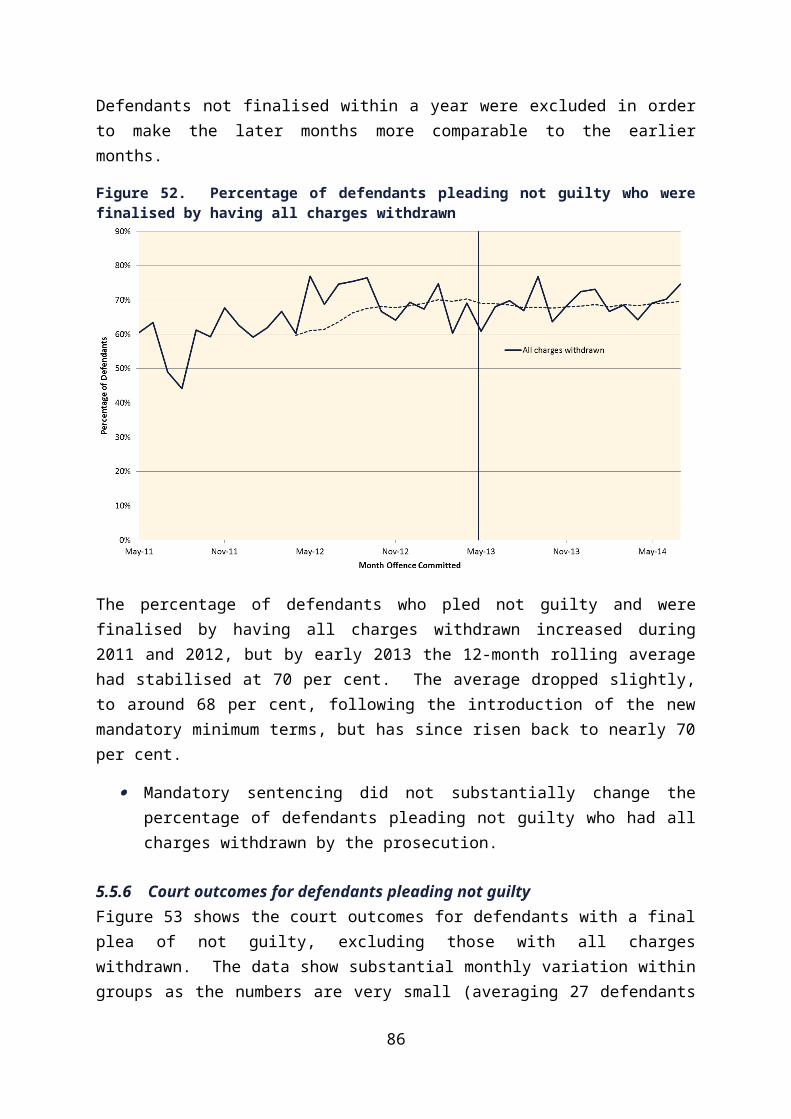
Mandatory Minimum Sentencing Review
Table 4. Number of new violent offence cases started by month offence committed and number of prior violent offence convictions – adult defendants by Indigenous status
2010 2011 2012 2013 2014 2015
Priors 0 1 2+ 0 1 2+ 0 1 2+ 0 1 2+ 0 1 2+ 0 1 2+
Indigenous defendants – Offences committed in northern regions
Jan
Feb 45 30 36 58 37 60 82 30 80 71 35 49 59 22 59
Mar 39 17 41 50 18 41 73 35 63 74 41 60 59 30 61
Apr 45 21 39 69 38 65 82 51 51 75 41 68 58 29 59
May 28 14 33 77 34 55 72 34 71 69 41 61 69 32 55
Jun 35 19 33 36 14 28 71 44 51 81 30 60 66 37 58 57 26 48
Jul 35 18 33 39 13 35 52 28 44 63 34 53 65 38 68 49 35 64
Aug 44 24 51 33 21 41 47 31 44 67 34 59 73 41 80 40 21 48
Sep 36 23 37 27 14 41 54 32 37 85 31 66 85 34 74
Oct 35 14 44 41 20 38 45 37 58 81 43 82 67 39 62
Nov 60 21 44 47 25 42 61 35 51 85 34 65 74 41 80
Dec 40 21 33 60 28 52 69 39 45 68 39 42 78 45 72
Indigenous defendants – Offences committed in southern regions
Jan
Feb 39 30 55 32 15 41 59 29 50 36 29 64 36 17 31
Mar 44 15 44 35 20 37 59 39 75 44 20 49 34 16 47
Apr 40 20 43 58 25 42 55 27 72 27 17 36 33 19 47
May 35 17 38 36 14 40 51 31 46 39 19 36 22 11 45
Jun 26 17 38 22 13 47 34 24 44 32 31 64 35 24 46 21 17 39
Jul 25 17 31 16 14 32 39 15 54 42 27 57 21 12 49 16 18 46
Aug 33 17 47 27 14 22 40 16 52 53 29 73 22 15 54 25 20 40
Sep 26 11 41 24 15 31 41 23 50 48 28 88 27 21 50
Oct 34 16 49 28 14 46 38 16 47 51 30 65 19 17 39
Nov 39 16 32 31 25 46 33 22 42 63 20 63 26 15 40
Dec 34 12 33 23 16 38 34 20 49 47 19 64 14 19 49
Non-Indigenous defendants
Jan 34 3 6 34 4 3 38 7 3 24 8 4 34 5 6
Feb 27 5 5 25 9 5 32 5 7 24 9 6 30 4 7
Mar 24 3 11 34 9 4 50 5 7 35 7 5 32 3 5
Apr 28 4 1 41 3 3 41 10 7 45 8 4 33 2 2
May 29 10 2 16 5 7 31 2 6 39 4 6 48 4 4 31 4 3
Jun 28 6 5 34 2 5 28 1 2 43 4 4 29 5 7 17 1 1
Jul 31 4 11 21 7 5 38 11 5 56 6 3 37 4 3 14 1 4
Aug 22 0 5 25 4 2 42 3 5 34 5 5 49 7 3
Sep 23 4 6 19 5 5 34 6 7 33 1 6 43 5 8
Oct 30 5 4 33 8 5 35 7 5 44 8 3 46 7 12
Nov 24 4 3 36 2 5 34 1 6 44 4 6 47 10 8
Dec 16 4 9 37 2 2 38 8 6 41 5 2 28 3 6
Data for Figures 5 through 10. Indigenous status was not recorded for a small number of defendants: these defendants do not appear above, but are included in Table 3. Hence the total number of adult defendants in some months is larger than the sum of the numbers shown above.
88
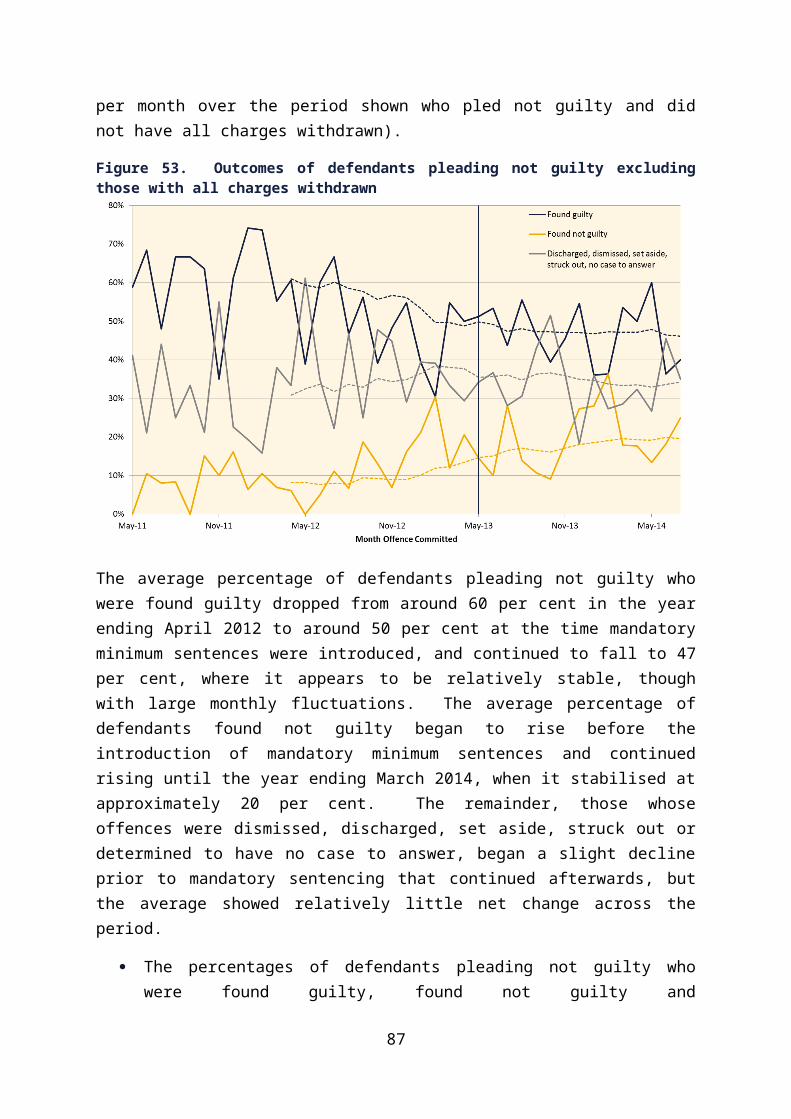
Mandatory Minimum Sentencing Review
Table 5. Summary of offenders included in re-offending analysisYear offence committed Sentence outcome Indigenous status
Males Females
Total Re-off11 Total Re-off
May 2009 – Apr 2010
Released from CourtIndigenous 297 90 129 20
Non-Indigenous 81 5 31 0
Released from Prison(Indigenous males by main court location)
Indigenous 594 325 45 11
Darwin 157 72
Katherine 97 53
Alice Springs 340 200
Non-Indigenous 58 16 2 0
May 2010 – Apr 2011
Released from CourtIndigenous 305 104 117 6
Non-Indigenous 103 11 18 0
Released from Prison(Indigenous males by main court location)
Indigenous 588 317 32 5
Darwin 175 80
Katherine 77 42
Alice Springs 336 195
Non-Indigenous 55 20 3 0
May 2011 – Apr 2012
Released from CourtIndigenous 338 101 128 18
Non-Indigenous 117 10 18 0
Released from Prison(Indigenous males by main court location)
Indigenous 697 374 54 12
Darwin 237 109
Katherine 119 67
Alice Springs 341 198
Non-Indigenous 60 15 3 3
May 2012 – Apr 2013
Released from CourtIndigenous 471 150 217 35
Non-Indigenous 136 17 19 3
Released from Prison(Indigenous males by main court location)
Indigenous 835 446 71 22
Darwin 265 127
Katherine 156 79
Alice Springs 414 240
Non-Indigenous 46 18 4 2
May 2013 – Apr 2014
Released from CourtIndigenous 358 92 187 28
Non-Indigenous 108 11 26 2
Released from Prison(Indigenous males by main court location)
Indigenous 728 345 79 23
Darwin 236 107
Katherine 119 54
Alice Springs 373 184
Non-Indigenous 45 21 3 2
Data for Figures 11 through 20.
11 Number who re-offended, according to the definition used in the analysis.
89
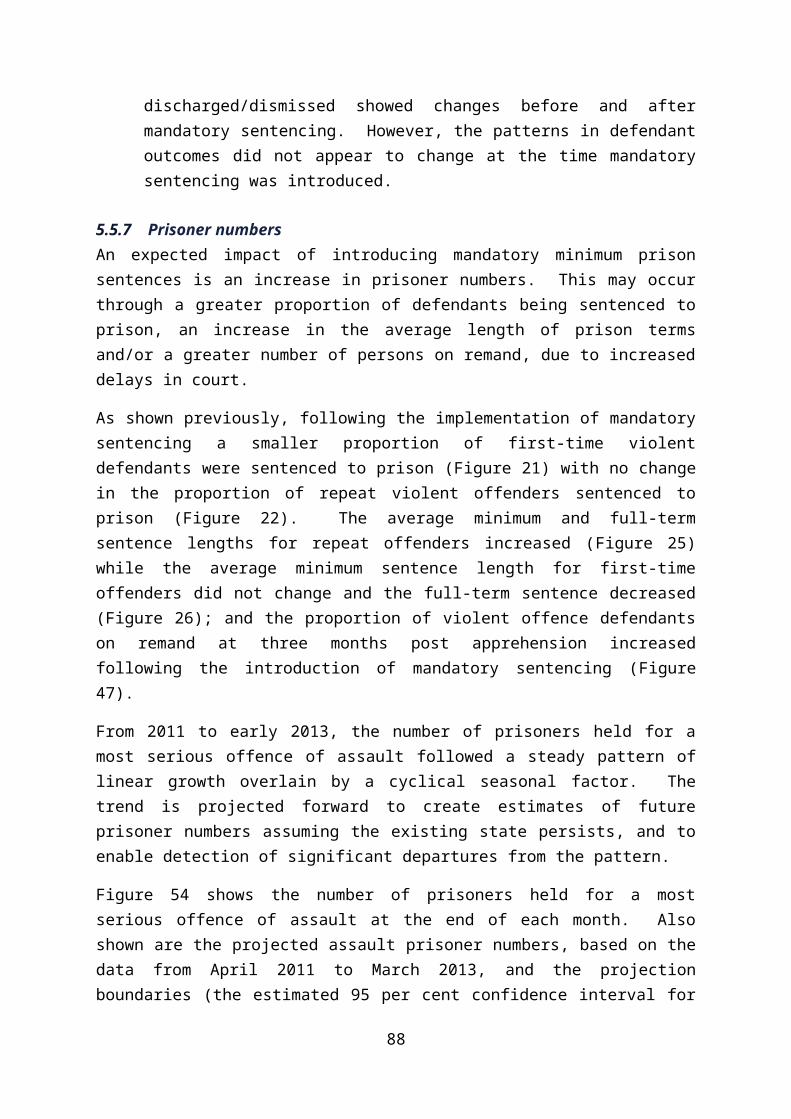
Mandatory Minimum Sentencing Review
Table 6. Number of convicted violent offence defendants by month offence committed, prior conviction status and principal penalty received – defendants finalised within one year
No prior violent offence conviction Prior violent offence conviction
MonthFixed term
imprisonmentPart susp
imprisonment Other penalty Fixed term imprisonment
Part susp imprisonment Other penalty
May 2011 6 17 17 44 38 1
Jun 2011 4 18 24 42 32 4
Jul 2011 2 15 21 47 36 2
Aug 2011 6 13 21 51 29 2
Sep 2011 6 21 23 56 30 1
Oct 2011 3 27 28 55 32 5
Nov 2011 8 26 30 55 36 4
Dec 2011 9 35 38 58 37 5
Jan 2012 9 23 32 58 42 7
Feb 2012 7 32 29 54 35 4
Mar 2012 9 36 36 71 53 3
Apr 2012 9 30 44 64 38 0
May 2012 9 18 39 62 44 4
Jun 2012 10 30 29 57 43 2
Jul 2012 6 23 34 53 43 4
Aug 2012 9 26 34 62 40 3
Sep 2012 1 27 31 63 48 5
Oct 2012 4 23 35 75 40 4
Nov 2012 5 29 35 70 36 3
Dec 2012 11 27 55 79 53 7
Jan 2013 12 29 60 83 42 8
Feb 2013 10 28 39 72 47 12
Mar 2013 10 24 61 79 46 11
Apr 2013 5 23 59 72 39 8
May 2013 5 21 54 80 26 5
Jun 2013 8 29 42 60 46 6
Jul 2013 12 25 43 92 30 8
Aug 2013 12 18 50 101 26 4
Sep 2013 12 22 44 108 31 4
Oct 2013 13 30 64 101 19 3
Nov 2013 10 21 49 73 23 3
Dec 2013 16 23 38 106 28 2
Jan 2014 16 26 32 85 20 6
Feb 2014 15 16 41 89 16 2
Mar 2014 14 19 41 85 25 4
Apr 2014 13 27 39 78 21 3
May 2014 8 24 49 88 23 3
Jun 2014 7 22 33 75 29 2
Jul 2014 6 23 48 105 21 8
Data for Figures 21 and 22.
90

Mandatory Minimum Sentencing Review
Table 7. Average sentence length (days) for violent offenders sentenced to actual imprisonmentCourt of Summary Jurisdiction Supreme Court
Month Full term Minimum term
Number of defendants Full term Minimum
termNumber of defendants
May 2011 132.2 89.5 99 1032.0 599.3 14
Jun 2011 134.4 81.4 90 810.5 495.8 11
Jul 2011 139.7 87.2 95 1056.5 664.1 12
Aug 2011 138.7 96.9 86 895.6 506.0 19
Sep 2011 146.0 101.8 107 1245.0 738.9 14
Oct 2011 143.4 92.0 108 1368.8 697.3 12
Nov 2011 143.3 87.0 109 880.8 513.6 21
Dec 2011 143.8 96.3 132 779.6 285.3 16
Jan 2012 151.0 96.8 124 855.5 505.8 16
Feb 2012 149.5 97.7 117 814.8 419.8 17
Mar 2012 146.3 89.4 153 833.6 417.5 23
Apr 2012 149.3 93.4 141 714.9 336.4 8
May 2012 136.2 93.3 125 885.0 468.9 11
Jun 2012 136.5 88.7 134 917.8 462.3 6
Jul 2012 159.2 103.2 123 934.4 326.3 7
Aug 2012 131.1 83.5 136 958.2 643.7 6
Sep 2012 138.5 88.1 135 770.7 414.8 10
Oct 2012 147.5 99.2 137 882.3 343.4 7
Nov 2012 129.9 86.3 129 550.7 339.1 13
Dec 2012 120.7 85.1 156 872.1 386.6 18
Jan 2013 114.7 81.8 162 730.1 321.3 9
Feb 2013 144.9 99.4 165 1016.9 463.7 7
Mar 2013 138.1 97.6 161 817.0 385.1 7
Apr 2013 131.6 88.1 130 841.6 492.8 12
May 2013 130.1 93.7 126 912.5 608.5 8
Jun 2013 133.3 88.0 139 936.4 426.1 9
Jul 2013 149.5 115.6 155 629.7 346.3 10
Aug 2013 138.5 109.2 155 1098.1 681.4 10
Sep 2013 145.0 117.9 175 993.7 568.0 3
Oct 2013 137.9 111.4 155 947.0 554.5 15
Nov 2013 124.1 100.8 116 701.9 391.0 14
Dec 2013 136.3 111.9 167 671.9 372.4 9
Jan 2014 135.2 109.2 136 809.2 451.3 15
Feb 2014 149.5 124.8 136 1009.0 579.8 6
Mar 2014 144.6 114.0 137 936.9 636.7 10
Apr 2014 122.9 102.5 123 1036.1 591.4 16
May 2014 134.2 105.9 136 920.1 543.4 8
Jun 2014 165.2 127.3 127 665.0 292.6 7
Jul 2014 151.7 120.4 138 779.2 411.9 17
Aug 2014 147.3 112.1 149 1012.1 570.6 11
Sep 2014 136.9 109.0 115 1029.2 527.2 6
Oct 2014 155.8 120.9 145 752.3 402.7 11
Nov 2014 154.3 120.6 138 889.2 457.0 6
91
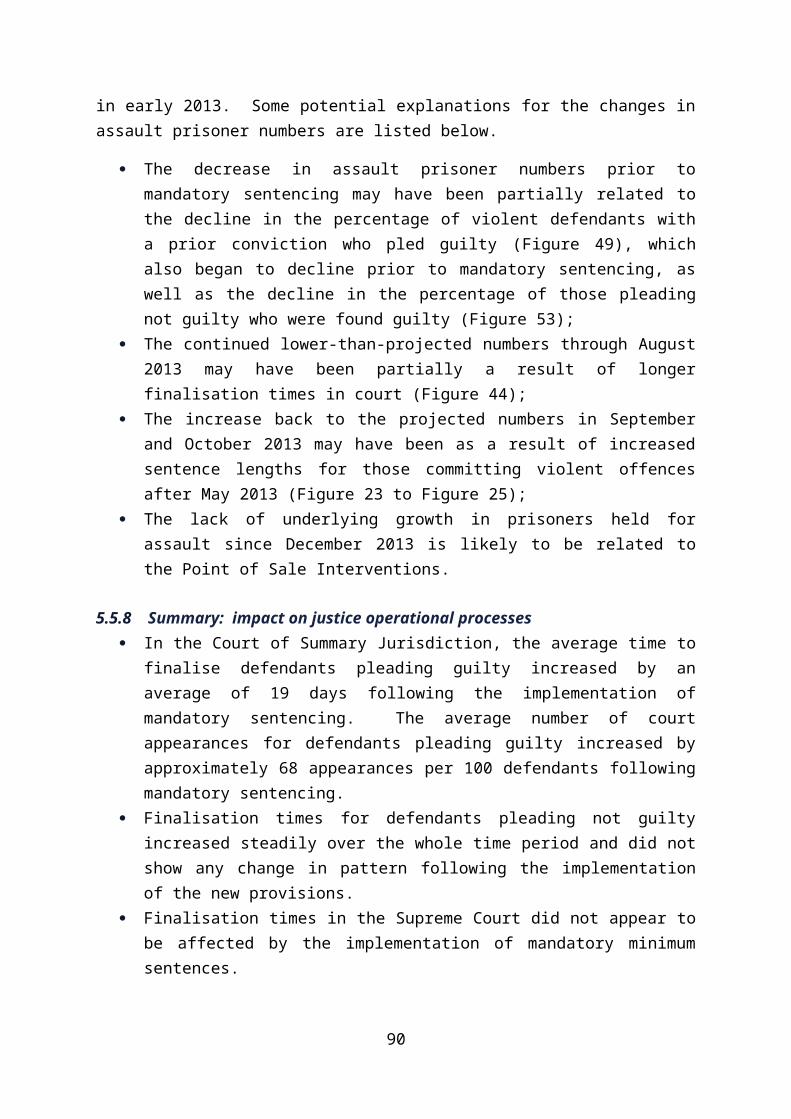
Mandatory Minimum Sentencing Review
Court of Summary Jurisdiction Supreme Court
Month Full term Minimum term
Number of defendants Full term Minimum
termNumber of defendants
Dec 2014 143.6 117.2 131 926.3 513.2 9
Jan 2015 143.2 112.3 99 699.7 314.3 3
Feb 2015 149.7 109.2 83 948.0 578.2 6
Mar 2015 163.1 126.0 100 - - -
Apr 2015 161.2 120.0 81 - - -
Data for Figures 23 and 24.
92
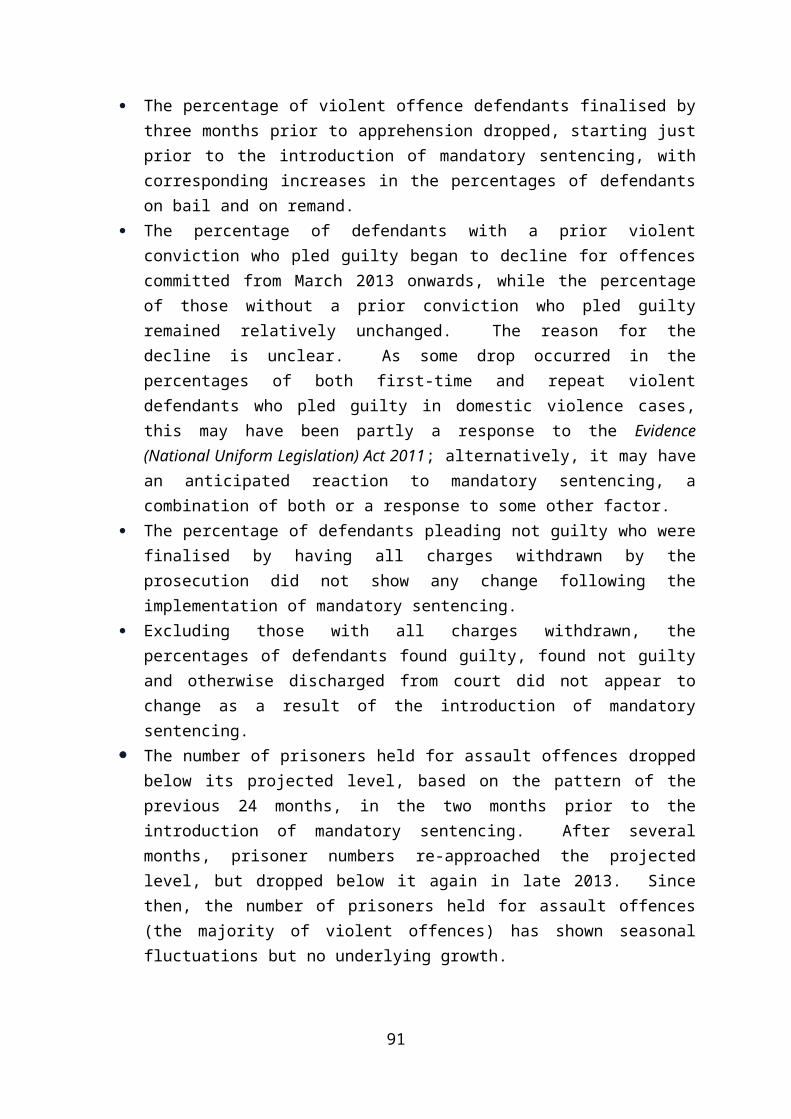
Mandatory Minimum Sentencing Review
Table 8. Average sentence length (days) for violent offenders by prior convictionCourt of Summary Jurisdiction: with prior Court of Summary Jurisdiction: without prior
Month Full term Minimum term
Number of defendants Full term Minimum
termNumber of defendants
May 2011 137.3 97.4 76 115.3 63.5 23
Jun 2011 139.4 95.9 67 119.9 39.1 23
Jul 2011 144.6 102.9 76 120.0 24.2 19
Aug 2011 152.6 111.4 70 78.1 33.7 16
Sep 2011 153.6 119.9 80 123.6 48.1 27
Oct 2011 149.0 110.5 80 127.3 39.1 28
Nov 2011 141.6 106.1 77 147.1 41.3 32
Dec 2011 148.5 115.6 91 133.4 53.4 41
Jan 2012 150.5 108.7 93 152.4 61.3 31
Feb 2012 160.2 115.5 83 123.3 54.1 34
Mar 2012 155.7 106.0 111 121.4 45.7 42
Apr 2012 161.6 113.3 99 120.2 46.3 42
May 2012 144.0 105.1 100 104.8 46.2 25
Jun 2012 136.3 99.0 97 137.0 61.9 37
Jul 2012 153.7 109.3 94 177.2 83.5 29
Aug 2012 135.3 97.5 98 120.5 47.4 38
Sep 2012 135.6 100.8 106 148.9 41.5 29
Oct 2012 155.1 112.7 112 113.1 38.8 25
Nov 2012 131.0 99.1 99 126.5 44.0 30
Dec 2012 120.1 92.3 124 123.3 56.9 32
Jan 2013 117.8 92.2 123 104.9 49.1 39
Feb 2013 157.2 117.5 122 109.9 48.2 43
Mar 2013 139.0 105.2 123 134.9 72.8 38
Apr 2013 133.4 98.6 103 124.9 48.2 27
May 2013 141.7 109.2 101 83.2 31.1 25
Jun 2013 140.7 99.4 104 111.0 54.3 35
Jul 2013 161.0 132.5 120 110.1 57.9 35
Aug 2013 144.1 121.7 123 116.9 61.1 32
Sep 2013 156.0 136.6 140 101.0 43.0 35
Oct 2013 144.7 135.6 112 120.5 48.4 43
Nov 2013 137.8 119.9 87 82.9 43.4 29
Dec 2013 152.9 131.0 130 77.9 44.9 37
Jan 2014 149.7 129.4 99 96.4 55.1 37
Feb 2014 159.9 141.6 107 110.9 62.8 29
Mar 2014 147.5 130.9 102 136.1 64.7 35
Apr 2014 144.2 132.0 90 64.7 22.1 33
May 2014 141.1 121.6 108 107.6 45.3 28
Jun 2014 179.0 148.6 100 114.3 48.4 27
Jul 2014 158.9 135.5 117 111.5 35.9 21
Aug 2014 148.7 127.8 117 142.3 54.8 32
Sep 2014 143.8 121.1 92 109.5 60.6 23
Oct 2014 166.8 137.0 115 113.4 59.3 30
Nov 2014 155.3 130.1 114 149.8 75.5 24
93
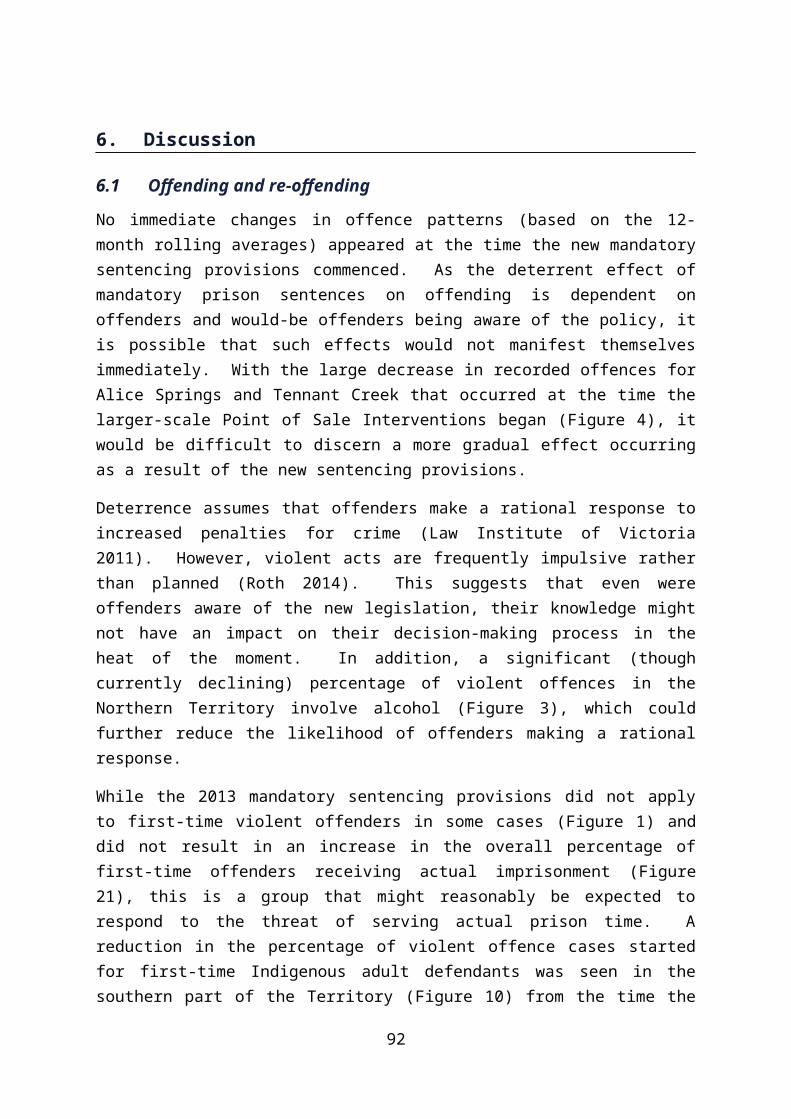
Mandatory Minimum Sentencing Review
Court of Summary Jurisdiction: with prior Court of Summary Jurisdiction: without prior
Month Full term Minimum term
Number of defendants Full term Minimum
termNumber of defendants
Dec 2014 160.0 139.1 100 90.5 46.4 31
Jan 2015 149.7 126.6 82 111.7 42.8 17
Feb 2015 157.1 123.7 63 126.6 63.4 20
Mar 2015 171.8 137.8 82 123.4 72.5 18
Apr 2015 175.8 137.9 67 91.3 34.3 14
Data for Figures 25 and 26.
94
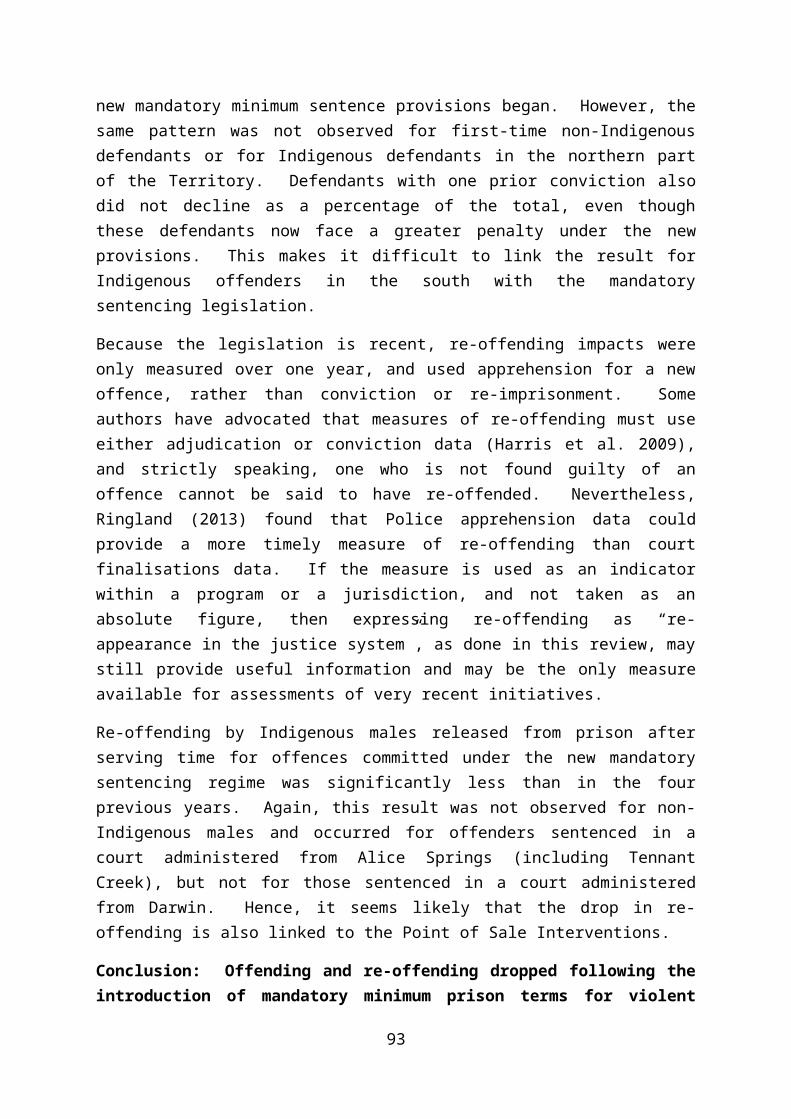
Mandatory Minimum Sentencing Review
Table 9. Number of offenders with a prior violent conviction by sentence outcome
MonthNon-Indigenous Males Indigenous Males Indigenous Females
Fixed term Part susp Total12 Fixed
term Part susp Total12 Fixed term Part susp Total12
May 2011 2 4 6 37 32 69 0 0 1
Jun 2011 4 4 9 31 23 56 2 2 5
Jul 2011 4 2 6 37 27 66 1 3 4
Aug 2011 1 2 3 41 23 65 2 0 3
Sep 2011 0 1 1 49 21 71 2 5 7
Oct 2011 1 2 5 49 23 73 0 2 2
Nov 2011 2 1 3 41 28 73 2 2 4
Dec 2011 1 0 2 50 34 88 1 1 2
Jan 2012 1 3 4 47 30 82 4 5 11
Feb 2012 5 2 7 43 28 73 1 3 5
Mar 2012 2 7 9 52 41 95 4 2 7
Apr 2012 0 4 4 59 27 86 3 3 6
May 2012 0 2 2 53 37 92 4 2 7
Jun 2012 1 1 2 52 33 87 2 7 9
Jul 2012 1 4 5 48 36 87 1 2 4
Aug 2012 5 1 6 52 28 83 1 11 12
Sep 2012 1 3 5 55 39 97 2 4 7
Oct 2012 2 1 3 69 30 103 3 7 10
Nov 2012 2 2 4 56 28 87 6 5 11
Dec 2012 3 3 6 70 43 116 1 3 7
Jan 2013 2 0 2 77 37 120 1 3 6
Feb 2013 5 0 5 64 43 117 2 2 6
Mar 2013 2 2 6 71 36 114 3 7 12
Apr 2013 3 0 4 57 35 97 4 3 9
May 2013 4 0 4 67 20 91 3 4 8
Jun 2013 1 0 1 54 34 92 4 8 14
Jul 2013 2 2 4 80 21 109 7 4 11
Aug 2013 2 0 2 89 21 112 6 3 10
Sep 2013 6 1 7 97 25 126 4 3 7
Oct 2013 2 1 3 85 14 100 5 4 11
Nov 2013 2 0 2 56 20 78 8 0 9
Dec 2013 3 2 6 89 18 108 10 7 17
Jan 2014 3 1 4 67 12 84 11 5 17
Feb 2014 3 1 5 78 13 92 4 2 6
Mar 2014 6 1 8 70 18 90 4 3 8
Apr 2014 6 0 6 59 18 80 6 1 7
May 2014 4 0 5 79 17 96 2 5 9
Jun 2014 2 2 4 68 22 92 2 3 5
Jul 2014 2 1 4 91 15 113 4 4 8
Data for Figures 27 through 29 and Figures 33 through 35.
12 Total includes a few offenders who received other orders.
95
Mandatory Minimum Sentencing Review
Table 10. Number of offenders with no prior violent conviction by sentence outcome
MonthNon-Indigenous Males Indigenous Males Indigenous Females
Fixed term Part susp Other13 Fixed
term Part susp Other13 Fixed term Part susp Other13
May 2011 0 1 4 5 9 8 1 4 4
Jun 2011 0 3 7 3 12 9 0 2 4
Jul 2011 1 4 3 1 7 10 0 2 8
Aug 2011 4 1 6 1 7 10 0 2 3
Sep 2011 0 4 3 6 9 12 0 4 8
Oct 2011 0 5 3 2 14 15 0 5 9
Nov 2011 3 2 6 5 15 18 0 5 4
Dec 2011 0 2 10 8 21 19 1 7 7
Jan 2012 1 1 8 5 16 10 2 3 10
Feb 2012 1 2 4 3 16 21 2 7 2
Mar 2012 0 2 6 9 17 19 0 9 8
Apr 2012 1 3 10 7 25 25 0 1 8
May 2012 0 0 5 6 10 20 1 7 13
Jun 2012 0 2 4 7 18 14 2 7 10
Jul 2012 2 2 10 3 15 15 1 4 7
Aug 2012 0 3 6 7 18 16 1 5 9
Sep 2012 0 2 3 0 18 22 1 6 5
Oct 2012 0 5 10 4 13 13 0 1 11
Nov 2012 0 1 3 4 17 19 0 6 13
Dec 2012 1 5 5 7 10 31 3 5 15
Jan 2013 0 4 10 11 16 35 1 7 13
Feb 2013 2 2 10 7 19 15 1 3 13
Mar 2013 1 1 13 8 13 26 1 8 22
Apr 2013 1 0 11 3 16 28 1 5 17
May 2013 1 5 7 2 13 33 1 3 11
Jun 2013 1 4 9 7 18 16 0 4 15
Jul 2013 1 8 11 7 11 18 2 5 11
Aug 2013 1 1 7 8 11 28 3 5 15
Sep 2013 3 1 3 7 14 24 2 7 13
Oct 2013 1 2 11 8 17 31 3 7 20
Nov 2013 0 3 13 8 12 23 2 3 10
Dec 2013 3 3 9 7 12 15 3 5 13
Jan 2014 0 2 5 12 16 19 2 3 7
Feb 2014 2 1 6 10 10 21 2 3 12
Mar 2014 1 3 5 10 11 19 2 5 12
Apr 2014 3 5 7 5 12 15 1 3 14
May 2014 1 4 6 4 11 22 1 6 17
Jun 2014 0 0 9 5 17 14 0 3 8
Jul 2014 0 2 7 5 11 30 0 3 9
Data for Figures 30 through 32.
13 Orders other than fixed term or partially suspended imprisonment.
96
Mandatory Minimum Sentencing Review
Table 11. Average sentence length (days) for offenders with a prior violent conviction
MonthNon-Indigenous Males Indigenous Males Indigenous Females
Full term Minimum term Full term Minimum term Full term Minimum term
May 2011 131.8 73.0 137.8 99.4 - -Jun 2011 121.9 68.3 145.9 102.3 83.8 63.8Jul 2011 188.2 159.5 141.8 102.0 125.8 33.3Aug 2011 115.3 30.7 158.9 118.9 46.0 46.0Sep 2011 183.0 4.0 152.2 125.1 179.0 95.1Oct 2011 198.0 90.8 150.0 114.6 75.0 50.5Nov 2011 129.3 93.3 142.2 107.0 144.8 101.8Dec 2011 91.0 91.0 148.4 114.2 172.3 164.7Jan 2012 213.0 106.0 149.8 113.6 136.9 82.3Feb 2012 139.1 119.6 163.6 117.6 136.8 70.8Mar 2012 159.4 52.1 156.2 112.6 143.3 80.8Apr 2012 144.5 48.3 169.3 121.3 58.3 37.8May 2012 167.0 92.0 146.0 107.1 106.5 78.2Jun 2012 365.0 173.0 132.7 101.8 119.9 55.3Jul 2012 160.6 89.8 156.2 112.6 68.7 48.3Aug 2012 98.7 88.5 136.7 103.7 144.2 60.2Sep 2012 40.8 24.8 138.5 106.0 152.3 68.5Oct 2012 334.7 223.7 151.7 113.2 135.2 75.0Nov 2012 133.0 87.5 139.9 106.0 61.7 49.9Dec 2012 136.8 87.7 116.2 93.4 205.3 70.3Jan 2013 60.5 60.5 120.7 95.9 93.0 22.8Feb 2013 200.8 152.0 149.5 111.1 239.0 191.0Mar 2013 121.8 95.3 141.6 110.3 130.5 65.7Apr 2013 142.0 142.0 130.6 94.7 167.1 131.1May 2013 79.0 73.2 149.8 116.0 104.1 65.0Jun 2013 91.0 91.0 141.5 103.6 143.0 69.4Jul 2013 119.3 86.0 166.5 137.7 129.9 105.8Aug 2013 118.0 118.0 147.4 125.7 108.0 72.7Sep 2013 104.3 99.9 155.7 137.2 205.4 159.6Oct 2013 78.0 67.7 146.5 138.9 146.4 121.1Nov 2013 91.0 91.0 143.4 122.9 102.1 102.1Dec 2013 72.6 60.6 157.8 138.9 145.8 101.7Jan 2014 106.5 98.8 159.0 136.7 114.9 100.9Feb 2014 98.8 83.5 164.8 146.3 142.0 117.8Mar 2014 134.4 119.0 151.5 136.4 110.6 73.6Apr 2014 86.0 86.0 151.8 138.3 110.7 102.0May 2014 90.3 90.3 139.6 124.6 190.7 98.6Jun 2014 159.8 114.0 176.5 148.5 238.4 171.8Jul 2014 152.0 71.3 165.3 144.2 75.5 44.5
Data for Figures 36 and 37, and Figures 40 and 41.
97
Mandatory Minimum Sentencing Review
Table 12. Sentence length for offenders with no prior violent conviction
MonthNon-Indigenous Males Indigenous Males Indigenous Females
Full term Minimum term Full term Minimum term Full term Minimum term
May 2011 91.0 2.0 122.2 75.6 109.2 49.6
Jun 2011 60.3 35.0 127.7 42.5 172.5 19.0
Jul 2011 103.4 11.3 152.7 39.3 76.0 3.0
Aug 2011 65.4 61.4 90.8 23.3 52.5 11.0
Sep 2011 228.3 83.8 99.5 47.7 134.2 29.8
Oct 2011 179.4 3.0 104.8 47.9 156.2 43.6
Nov 2011 74.8 2.4 151.3 53.3 187.0 34.9
Dec 2011 82.0 37.5 146.9 65.6 99.8 16.3
Jan 2012 231.5 49.0 161.7 70.1 108.0 41.3
Feb 2012 222.3 134.0 89.6 35.3 160.2 69.8
Mar 2012 49.0 1.5 129.6 59.7 112.8 16.9
Apr 2012 151.0 73.0 117.5 43.8 63.0 1.0
May 2012 - - 103.9 45.1 106.2 48.2
Jun 2012 213.0 46.0 162.4 79.1 61.1 24.2
Jul 2012 266.3 140.0 118.2 55.3 263.3 123.8
Aug 2012 114.0 3.3 121.3 54.8 129.0 44.1
Sep 2012 319.5 122.0 145.2 40.5 111.0 21.6
Oct 2012 78.3 15.5 130.2 48.7 14.0 1.0
Nov 2012 365.0 5.0 125.3 52.6 91.2 17.8
Dec 2012 154.2 61.8 123.9 65.6 101.4 37.3
Jan 2013 132.3 41.5 99.5 60.6 109.4 14.0
Feb 2013 149.8 91.5 108.3 47.0 86.6 27.6
Mar 2013 63.6 37.6 147.8 86.7 141.0 58.6
Apr 2013 91.0 91.0 130.6 52.2 111.7 27.7
May 2013 83.2 34.0 85.8 30.0 73.8 31.0
Jun 2013 89.4 24.4 116.5 63.6 102.3 31.8
Jul 2013 82.4 35.8 126.2 71.7 108.1 53.7
Aug 2013 106.5 76.0 125.9 71.8 94.8 28.0
Sep 2013 124.2 81.6 93.2 42.0 106.2 23.8
Oct 2013 78.0 31.3 122.1 51.6 122.3 47.7
Nov 2013 176.3 62.0 72.0 42.1 81.4 46.4
Dec 2013 83.5 63.7 83.7 45.1 70.4 33.9
Jan 2014 121.5 48.0 94.6 54.4 97.2 62.0
Feb 2014 253.7 182.3 92.9 49.1 99.3 48.5
Mar 2014 177.8 95.0 128.5 69.3 137.4 36.5
Apr 2014 50.4 13.9 72.5 29.8 94.8 25.3
May 2014 142.8 60.8 110.7 56.7 82.6 16.3
Jun 2014 - - 118.4 54.4 106.3 4.7
Jul 2014 196.5 11.0 104.8 44.6 90.7 6.3
Data for Figures 38 and 39, and Figures 42 and 43.
98
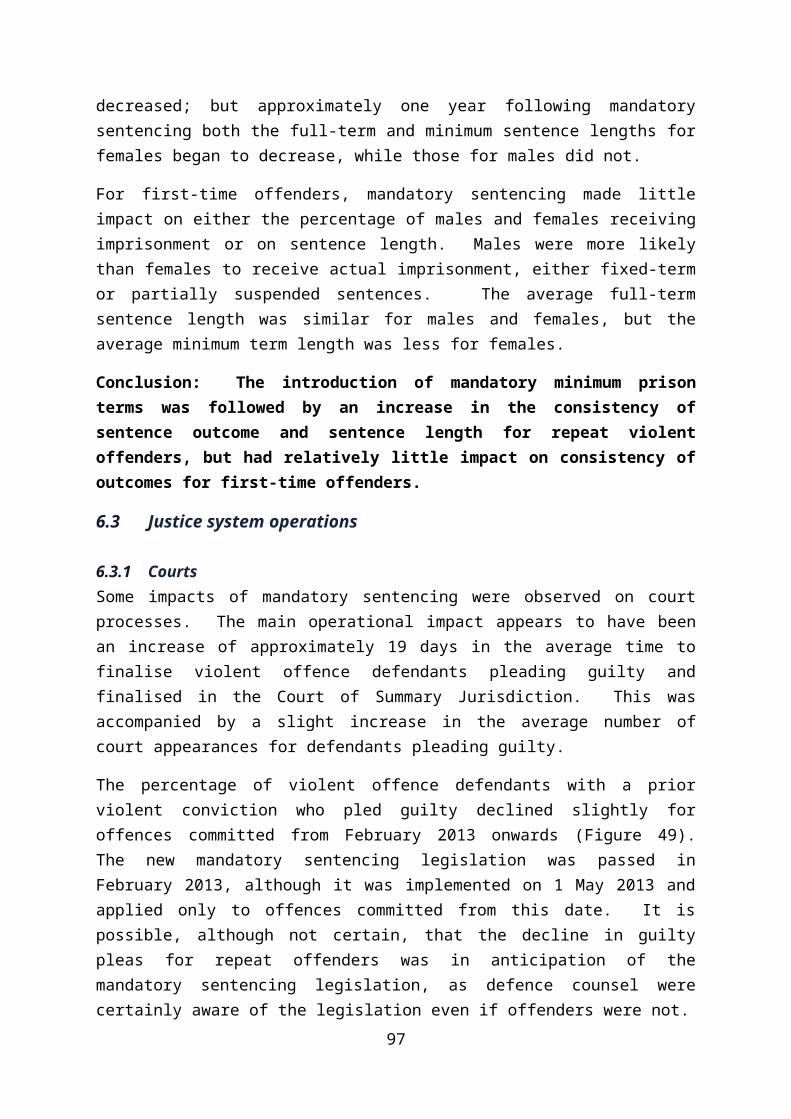
Mandatory Minimum Sentencing Review
Table 13. Average time (days) to finalise violent offence defendants by court and month offence committed (N = number of finalised defendants)
Court of Summary Jurisdiction (finalised within 1 year) Supreme Court
Month N Guilty Not guilty Total Median 75th
percentile95th
percentile Total N
May 2011 145 60.8 115.7 76.7 54 116 256 309.9 15
Jun 2011 152 71.8 93.9 79.4 64 126 232 217.1 14
Jul 2011 151 63.1 109.3 78.1 64 116 205 264.7 13
Aug 2011 132 58.6 104.8 72.9 38 96 283 283.1 23
Sep 2011 175 65.4 105.6 79.4 59 128 230 286.9 15
Oct 2011 194 59.7 109.9 79.6 64 119 245 286.4 21
Nov 2011 196 75.0 108.3 84.9 67 122 259 249.6 26
Dec 2011 234 73.9 117.4 88.7 64 129 291 244.7 21
Jan 2012 208 72.5 101.1 82.6 69 119 220 264.6 19
Feb 2012 185 66.3 100.8 75.6 60 118 220 228.4 17
Mar 2012 258 72.3 120.5 88.3 78 124 249 239.2 28
Apr 2012 242 63.9 120.3 83.0 66 121 246 252.8 11
May 2012 235 57.9 113.1 75.8 63 104 241 237.6 14
Jun 2012 219 62.5 119.9 79.0 63 118 242 210.2 10
Jul 2012 217 67.2 119.0 83.7 73 122 220 255.5 13
Aug 2012 225 59.1 131.5 78.7 56 114 260 200.4 7
Sep 2012 226 70.0 125.5 86.5 67 136 259 329.7 14
Oct 2012 233 60.8 120.5 77.7 61 121 238 251.1 10
Nov 2012 233 65.0 119.1 83.3 72 126 242 217.7 15
Dec 2012 299 62.3 120.9 81.5 65 122 245 250.1 23
Jan 2013 318 58.2 112.8 75.2 59 114 217 306.1 14
Feb 2013 284 62.5 125.6 81.9 64 128 242 449.6 15
Mar 2013 313 60.9 133.2 85.2 65 127 252 312.1 10
Apr 2013 292 70.8 129.0 92.5 80 130 277 276.1 15
May 2013 265 67.2 127.5 90.0 84 126 263 242.3 13
Jun 2013 265 75.6 137.5 97.5 90 134 264 203.2 9
Jul 2013 295 82.2 132.0 100.3 92 147 273 280.1 13
Aug 2013 293 79.9 124.6 96.3 85 139 279 349.8 16
Sep 2013 324 83.9 138.1 103.8 91 154 259 261.3 6
Oct 2013 297 77.8 147.0 97.6 87 152 260 282.9 22
Nov 2013 260 91.1 149.3 114.4 106 172 275 257.3 16
Dec 2013 274 96.0 137.1 108.0 93 164 264 288.6 15
Jan 2014 256 80.6 131.6 98.8 82 141 247 286.3 16
Feb 2014 261 83.1 134.9 102.3 90 155 254 248.8 9
Mar 2014 257 92.4 143.0 109.9 95 170 287 242.9 11
Apr 2014 246 77.5 135.1 99.5 90 146 248 255.7 19
May 2014 266 73.3 145.4 98.8 88 147 267 245.8 10
Jun 2014 228 82.1 139.4 100.4 87 155 269 179.6 8
Jul 2014 266 74.5 114.3 86.3 65 126 250 195.4 17
Data for Figures 44 through 46. The average finalisation time by plea and the percentiles of total time are not calculated for the Supreme Court due to the small number of defendants.
99
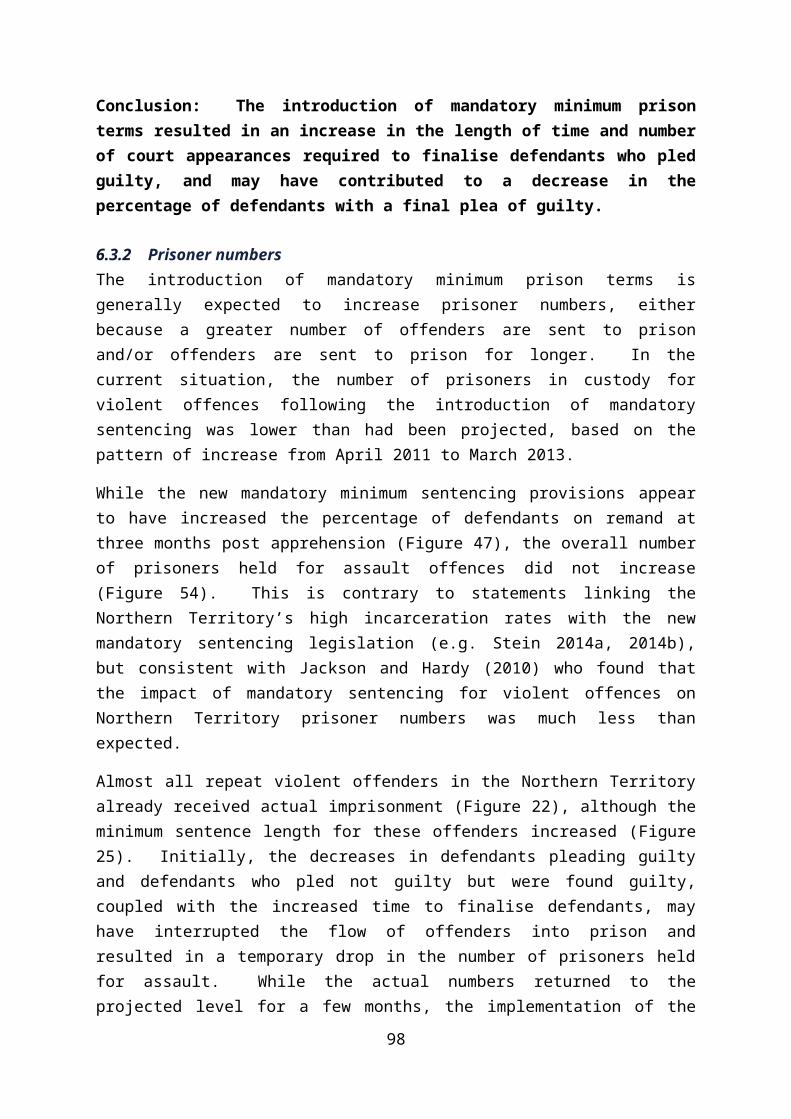
Mandatory Minimum Sentencing Review
Table 14. Status of violent offence defendants by month offence committed, assessed at three months following apprehension
Number PercentageMonth Bail or otherwise free Remand Finalised Bail or otherwise free Remand FinalisedMay 2010 101 31 83 47% 14% 39%Jun 2010 103 33 67 51% 16% 33%Jul 2010 135 55 85 49% 20% 31%Aug 2010 99 37 71 48% 18% 34%Sep 2010 106 41 86 45% 18% 37%Oct 2010 136 36 86 53% 14% 33%Nov 2010 102 43 64 49% 20% 31%Dec 2010 125 55 103 44% 19% 36%Jan 2011 117 65 104 41% 23% 36%Feb 2011 100 59 85 41% 24% 35%Mar 2011 131 44 78 52% 17% 31%Apr 2011 89 36 77 44% 18% 38%May 2011 75 36 84 38% 18% 43%Jun 2011 87 33 72 45% 17% 38%Jul 2011 89 35 75 45% 18% 38%Aug 2011 71 33 80 39% 18% 43%Sep 2011 105 30 86 47% 14% 39%Oct 2011 114 57 95 43% 21% 36%Nov 2011 112 60 93 42% 23% 35%Dec 2011 139 57 117 44% 18% 37%Jan 2012 138 58 94 48% 20% 32%Feb 2012 101 52 93 41% 21% 38%Mar 2012 167 70 118 47% 20% 33%Apr 2012 142 44 123 46% 14% 40%May 2012 125 52 135 40% 17% 43%Jun 2012 99 46 118 38% 17% 45%Jul 2012 131 50 110 45% 17% 38%Aug 2012 127 33 136 43% 11% 46%Sep 2012 130 52 117 43% 17% 39%Oct 2012 123 51 123 41% 17% 41%Nov 2012 131 54 117 43% 18% 39%Dec 2012 169 75 143 44% 19% 37%Jan 2013 171 53 165 44% 14% 42%Feb 2013 178 64 151 45% 16% 38%Mar 2013 187 61 165 45% 15% 40%Apr 2013 168 70 130 46% 19% 35%May 2013 157 73 130 44% 20% 36%Jun 2013 154 60 117 47% 18% 35%Jul 2013 180 85 121 47% 22% 31%Aug 2013 182 89 129 46% 22% 32%Sep 2013 179 82 134 45% 21% 34%Oct 2013 184 77 129 47% 20% 33%Nov 2013 180 66 91 53% 20% 27%Dec 2013 171 89 112 46% 24% 30%Jan 2014 154 75 100 47% 23% 30%
100
Mandatory Minimum Sentencing Review
Number PercentageMonth Bail or otherwise free Remand Finalised Bail or otherwise free Remand FinalisedFeb 2014 161 72 97 49% 22% 29%Mar 2014 159 68 89 50% 22% 28%Apr 2014 159 68 100 49% 21% 30%May 2014 152 59 119 46% 18% 36%Jun 2014 148 48 105 49% 16% 35%Jul 2014 145 66 120 44% 20% 36%Aug 2014 153 70 129 43% 20% 37%Sep 2014 143 62 99 47% 20% 33%Oct 2014 140 81 125 40% 23% 36%Nov 2014 146 79 119 42% 23% 35%Dec 2014 124 67 120 40% 22% 39%Jan 2015 127 56 91 46% 20% 33%Feb 2015 117 78 99 40% 27% 34%Mar 2015 107 67 118 37% 23% 40%Apr 2015 108 62 103 40% 23% 38%May 2015 106 55 93 42% 22% 37%
Data for Figure 47.
101
Mandatory Minimum Sentencing Review
Table 15. Average number of court appearances for finalised violent offence defendants by final plea and month offence committed – defendants finalised in the Court of Summary Jurisdiction within one year (N = number of defendants)
MonthGuilty Not Guilty Total
Average N Average N Average N
May 2011 4.0 103 6.0 42 4.6 145
Jun 2011 4.8 100 5.2 52 4.9 152
Jul 2011 4.4 102 5.9 49 4.9 151
Aug 2011 4.0 91 5.7 41 4.6 132
Sep 2011 4.3 114 5.0 61 4.6 175
Oct 2011 3.9 117 5.6 77 4.6 194
Nov 2011 4.6 138 6.1 58 5.0 196
Dec 2011 4.4 154 5.6 80 4.8 234
Jan 2012 4.2 134 4.6 74 4.4 208
Feb 2012 4.5 135 5.5 50 4.7 185
Mar 2012 4.3 172 5.2 86 4.6 258
Apr 2012 4.0 160 5.3 82 4.5 242
May 2012 3.8 159 5.7 76 4.4 235
Jun 2012 3.9 156 4.8 63 4.2 219
Jul 2012 4.1 148 5.5 69 4.5 217
Aug 2012 3.7 164 5.3 61 4.2 225
Sep 2012 3.8 159 6.0 67 4.5 226
Oct 2012 3.7 167 5.2 66 4.1 233
Nov 2012 3.7 154 5.6 79 4.4 233
Dec 2012 3.8 201 5.4 98 4.3 299
Jan 2013 3.7 219 5.3 99 4.2 318
Feb 2013 4.0 197 5.2 87 4.4 284
Mar 2013 3.8 208 5.6 105 4.4 313
Apr 2013 3.8 183 5.4 109 4.4 292
May 2013 4.0 165 5.5 100 4.6 265
Jun 2013 4.4 171 5.6 94 4.8 265
Jul 2013 4.6 188 5.5 107 4.9 295
Aug 2013 4.5 186 5.0 107 4.7 293
Sep 2013 4.4 205 5.5 119 4.8 324
Oct 2013 4.1 212 5.7 85 4.6 297
Nov 2013 4.8 156 6.1 104 5.3 260
Dec 2013 4.9 194 5.4 80 5.0 274
Jan 2014 4.6 165 5.7 91 5.0 256
Feb 2014 4.6 164 5.5 97 5.0 261
Mar 2014 4.6 168 5.9 89 5.0 257
Apr 2014 4.5 152 5.9 94 5.0 246
May 2014 4.1 172 6.4 94 4.9 266
Jun 2014 4.2 155 6.0 73 4.8 228
Jul 2014 4.0 187 5.3 79 4.4 266
Data for Figure 48.
102
Mandatory Minimum Sentencing Review
Table 16. Number of convicted violent offence defendants finalised in the Court of Summary Jurisdiction by month offence committed, domestic violence involvement, prior conviction status and final plea – defendants finalised within one year
Month
DV Non-DV
No prior Prior No prior Prior
Guilty Not guilty Guilty Not guilty Guilty Not guilty Guilty Not guilty
May 2011 26 7 47 20 10 8 20 7
Jun 2011 24 16 51 15 13 8 12 13
Jul 2011 21 14 52 17 13 6 16 12
Aug 2011 13 11 50 14 15 10 13 6
Sep 2011 24 14 55 21 18 12 17 14
Oct 2011 33 16 58 35 13 13 13 13
Nov 2011 41 8 63 17 18 17 16 15
Dec 2011 52 21 69 32 20 15 13 11
Jan 2012 25 22 70 27 21 11 18 14
Feb 2012 34 15 63 16 20 11 17 8
Mar 2012 48 16 76 40 24 16 24 14
Apr 2012 52 24 72 31 20 16 16 11
May 2012 50 17 79 30 10 15 20 14
Jun 2012 48 17 76 20 14 13 18 13
Jul 2012 40 17 73 27 19 17 16 8
Aug 2012 46 19 79 19 20 17 19 6
Sep 2012 42 18 77 28 14 11 26 10
Oct 2012 36 18 91 27 19 14 21 7
Nov 2012 38 23 69 32 18 17 29 7
Dec 2012 51 23 103 25 27 33 20 17
Jan 2013 64 27 97 32 32 25 26 15
Feb 2013 45 22 100 43 28 15 24 7
Mar 2013 62 26 104 49 25 22 17 8
Apr 2013 54 38 90 43 25 15 14 13
May 2013 56 21 72 51 16 17 21 11
Jun 2013 42 23 84 45 27 16 18 10
Jul 2013 53 26 98 49 19 19 18 13
Aug 2013 55 29 92 52 16 13 23 13
Sep 2013 54 32 109 57 19 20 23 10
Oct 2013 73 14 101 42 29 16 9 13
Nov 2013 49 28 67 45 23 15 17 16
Dec 2013 46 17 104 44 23 13 21 6
Jan 2014 49 20 81 41 16 14 19 16
Feb 2014 47 24 80 35 13 19 24 19
Mar 2014 49 30 81 36 16 14 22 9
Apr 2014 38 25 73 39 29 17 12 13
May 2014 57 24 83 43 14 18 18 9
Jun 2014 38 16 81 32 20 14 16 11
Jul 2014 50 19 103 33 17 15 17 12
Data for Figures 49 through 51.
103
Mandatory Minimum Sentencing Review
Table 17. Number of violent offence defendants pleading not guilty by outcome
Month Found guilty Found not guiltyDischarged,
dismissed, set aside, struck out, etc.
All charges withdrawn Total
May 2011 10 0 7 26 43
Jun 2011 13 2 4 33 52
Jul 2011 12 2 11 24 49
Aug 2011 16 2 6 19 43
Sep 2011 16 0 8 38 62
Oct 2011 21 5 7 48 81
Nov 2011 7 2 11 42 62
Dec 2011 19 5 7 52 83
Jan 2012 23 2 6 45 76
Feb 2012 14 2 3 31 50
Mar 2012 16 2 11 58 87
Apr 2012 20 2 11 50 83
May 2012 7 0 11 60 78
Jun 2012 12 1 7 44 64
Jul 2012 12 2 4 53 71
Aug 2012 7 1 7 46 61
Sep 2012 9 3 4 52 68
Oct 2012 9 3 11 46 69
Nov 2012 14 2 13 52 81
Dec 2012 17 5 9 70 101
Jan 2013 13 7 13 68 101
Feb 2013 7 7 9 68 91
Mar 2013 23 5 14 64 106
Apr 2013 17 7 10 76 110
May 2013 21 6 14 64 105
Jun 2013 16 3 11 64 94
Jul 2013 14 9 10 74 107
Aug 2013 20 5 10 73 108
Sep 2013 13 3 12 93 121
Oct 2013 13 3 17 58 91
Nov 2013 15 6 12 71 104
Dec 2013 12 6 4 58 80
Jan 2014 9 7 9 68 93
Feb 2014 12 12 9 66 99
Mar 2014 15 5 8 61 89
Apr 2014 17 6 11 61 95
May 2014 18 4 8 67 97
Jun 2014 8 4 10 52 74
Jul 2014 8 5 7 59 79
Data for Figures 52 and 53.
104
Mandatory Minimum Sentencing Review
Table 18. Prisoners held for assault offences and projected assault prisoner numbersMonth Actual prisoners held Projected numbers Lower boundary Upper boundaryJun 2010 462 389.0 336.4 441.6Jul 2010 449 381.7 329.8 433.6Aug 2010 469 380.2 328.9 431.4Sep 2010 484 387.9 337.3 438.5Oct 2010 477 406.0 355.9 456.0Nov 2010 471 433.7 384.3 483.2Dec 2010 470 466.4 417.5 515.3Jan 2011 517 499.5 451.1 547.9Feb 2011 526 527.3 479.4 575.2Mar 2011 533 544.5 497.0 592.0Apr 2011 535 552.2 505.2 599.3May 2011 535 550.3 503.6 597.0Jun 2011 549 543.4 497.1 589.7Jul 2011 545 536.1 490.1 582.1Aug 2011 535 534.6 488.9 580.3Sep 2011 548 542.3 496.9 587.8Oct 2011 578 560.4 515.2 605.6Nov 2011 590 588.1 543.1 633.2Dec 2011 623 620.8 575.9 665.7Jan 2012 654 653.9 609.2 698.7Feb 2012 661 681.7 637.0 726.4Mar 2012 688 699.3 654.7 744.0Apr 2012 711 707.1 662.4 751.7May 2012 716 705.1 660.4 749.8Jun 2012 718 698.2 653.5 743.0Jul 2012 712 690.9 646.0 735.8Aug 2012 724 689.4 644.4 734.4Sep 2012 719 697.2 651.9 742.4Oct 2012 719 715.2 669.8 760.6Nov 2012 745 743.0 697.3 788.7Dec 2012 773 775.7 729.7 821.6Jan 2013 805 808.8 762.5 855.1Feb 2013 802 836.5 789.8 883.2Mar 2013 799 853.7 806.7 900.8Apr 2013 799 861.5 814.0 909.0May 2013 773 859.5 811.6 907.4Jun 2013 766 852.6 804.2 901.1Jul 2013 773 845.3 796.4 894.2Aug 2013 766 843.8 794.4 893.3Sep 2013 841 851.6 801.5 901.6Oct 2013 850 869.6 819.0 920.2Nov 2013 858 897.4 846.1 948.6Dec 2013 853 930.1 878.2 981.9Jan 2014 884 963.2 910.6 1015.7Feb 2014 902 990.9 937.7 1044.2Mar 2014 887 1008.1 954.2 1062.1Apr 2014 870 1015.9 961.2 1070.6
105
Mandatory Minimum Sentencing Review
Month Actual prisoners held Projected numbers Lower boundary Upper boundaryMay 2014 838 1013.9 958.5 1069.3Jun 2014 834 1007.1 950.9 1063.2Jul 2014 831 999.7 942.8 1056.7Aug 2014 854 998.2 940.4 1056.0Sep 2014 836 1006.0 947.3 1064.6Oct 2014 854 1024.0 964.6 1083.5Nov 2014 875 1051.8 991.4 1112.1Dec 2014 896 1084.5 1023.3 1145.7Jan 2015 893 1117.6 1055.5 1179.7Feb 2015 891 1145.3 1082.3 1208.4Mar 2015 865 1162.5 1098.7 1226.4Apr 2015 858 1170.3 1105.5 1235.1May 2015 829 1168.3 1102.6 1234.1Jun 2015 811 1161.5 1094.8 1228.2Jul 2015 829 1154.2 1086.5 1221.8Aug 2015 862 1152.6 1084.0 1221.3
Data for Figure 54.
106


