Florida International University FIU Digital Commons FIU Electronic eses and Dissertations University Graduate School 7-12-2011 Exergoeconomic Analysis of Solar Organic Rankine Cycle for Geothermal Air Conditioned Net Zero Energy Buildings Rambod Rayegan Florida International University, [email protected]DOI: 10.25148/etd.FI11080805 Follow this and additional works at: hps://digitalcommons.fiu.edu/etd is work is brought to you for free and open access by the University Graduate School at FIU Digital Commons. It has been accepted for inclusion in FIU Electronic eses and Dissertations by an authorized administrator of FIU Digital Commons. For more information, please contact dcc@fiu.edu. Recommended Citation Rayegan, Rambod, "Exergoeconomic Analysis of Solar Organic Rankine Cycle for Geothermal Air Conditioned Net Zero Energy Buildings" (2011). FIU Electronic eses and Dissertations. 470. hps://digitalcommons.fiu.edu/etd/470
Transcript
Florida International UniversityFIU Digital Commons
FIU Electronic Theses and Dissertations University Graduate School
7-12-2011
Exergoeconomic Analysis of Solar OrganicRankine Cycle for Geothermal Air ConditionedNet Zero Energy BuildingsRambod RayeganFlorida International University, [email protected]
DOI: 10.25148/etd.FI11080805Follow this and additional works at: https://digitalcommons.fiu.edu/etd
This work is brought to you for free and open access by the University Graduate School at FIU Digital Commons. It has been accepted for inclusion inFIU Electronic Theses and Dissertations by an authorized administrator of FIU Digital Commons. For more information, please contact [email protected].
Recommended CitationRayegan, Rambod, "Exergoeconomic Analysis of Solar Organic Rankine Cycle for Geothermal Air Conditioned Net Zero EnergyBuildings" (2011). FIU Electronic Theses and Dissertations. 470.https://digitalcommons.fiu.edu/etd/470
EXERGOECONOMIC ANALYSIS OF SOLAR ORGANIC RANKINE CYCLE FOR
GEOTHERMAL AIR CONDITIONED NET ZERO ENERGY BUILDINGS
A dissertation submitted in partial fulfillment of the
requirements for the degree of
DOCTOR OF PHILOSOPHY
in
MECHANICAL ENGINEERING
by
Rambod Rayegan
2011
ii
To: Dean Amir Mirmiran College of Engineering and Computing
This dissertation, written by Rambod Rayegan, and entitled Exergoeconomic Analysis of Solar Organic Rankine Cycle for Geothermal Air Conditioned Net Zero Energy Buildings, having been approved in respect to style and intellectual content, is referred to you for judgment. We have read this dissertation and recommend that it be approved.
_______________________________________ Ali Ebadian
_______________________________________
Yiding Cao
_______________________________________ Yimin Zhu
______________________________________
Yong X. Tao, Major Professor Date of Defense: July 12, 2011 The dissertation of Rambod Rayegan is approved.
_______________________________________ Dean Amir Mirmiran
College of Engineering and Computing
_______________________________________ Interim Dean Kevin O’Shea University Graduate School
Florida International University, 2011
iii
DEDICATION
I dedicate this dissertation to my parents and my wife for their never-ending love.
iv
ACKNOWLEDGMENTS
I am grateful to my major advisor Dr. Yong Tao for his support and guidance
throughout my studies. The discussions I had with Dr. Tao were a great source of
learning and encouragement for me. I am truly thankful for his patience, support and
valuable advices. I would also like to recognize and thank Dr. Ali Ebadian, Dr. Yiding
Cao and Dr. Yimin Zhu for serving on my advisory committee.
The work and its findings in this paper are made possible by the financial support
from US Department of Energy Geothermal Program under the Award No. DE-
EE0002802, which is greatly appreciated. Finally, I would like to acknowledge the
financial support of Florida International University Doctoral Evidence Acquisition
Fellowship.
v
ABSTRACT OF THE DISSERTATION
EXERGOECONOMIC ANALYSIS OF SOLAR ORGANIC RANKINE CYCLE FOR
GEOTHERMAL AIR CONDITIONED NET ZERO ENERGY BUILDINGS
by
Rambod Rayegan
Florida International University, 2011
Miami, Florida
Professor Yong X. Tao, Major Professor
This study is an attempt at achieving Net Zero Energy Building (NZEB) using a
solar Organic Rankine Cycle (ORC) based on exergetic and economic measures. The
working fluid, working conditions of the cycle, cycle configuration, and solar collector
type are considered the optimization parameters for the solar ORC system.
In the first section, a procedure is developed to compare ORC working fluids
based on their molecular components, temperature-entropy diagram and fluid effects on
the thermal efficiency, net power generated, vapor expansion ratio, and exergy efficiency
of the Rankine cycle. Fluids with the best cycle performance are recognized in two
different temperature levels within two different categories of fluids: refrigerants and
non-refrigerants. Important factors that could lead to irreversibility reduction of the solar
ORC are also investigated in this study.
In the next section, the system requirements needed to maintain the electricity
demand of a geothermal air-conditioned commercial building located in Pensacola of
Florida is considered as the criteria to select the optimal components and optimal
working condition of the system. The solar collector loop, building, and geothermal air
vi
conditioning system are modeled using TRNSYS. Available electricity bills of the
building and the 3-week monitoring data on the performance of the geothermal system
are employed to calibrate the simulation. The simulation is repeated for Miami and
Houston in order to evaluate the effect of the different solar radiations on the system
requirements.
The final section discusses the exergoeconomic analysis of the ORC system with
the optimum performance. Exergoeconomics rests on the philosophy that exergy is the
only rational basis for assigning monetary costs to a system’s interactions with its
surroundings and to the sources of thermodynamic inefficiencies within it.
Exergoeconomic analysis of the optimal ORC system shows that the ratio Rex of the
annual exergy loss to the capital cost can be considered a key parameter in optimizing a
solar ORC system from the thermodynamic and economic point of view. It also shows
that there is a systematic correlation between the exergy loss and capital cost for the
investigated solar ORC system.
vii
TABLE OF CONTENTS
CHAPTER PAGE
1. INTRODUCTION ...........................................................................................................1 1.1 Research Background .................................................................................................1 1.2 Exergoeconomic Point of View .................................................................................4 1.3 Objectives and Significance of Study ........................................................................5 1.4 Framework of the Research ........................................................................................6
2. A CRITICAL REVIEW ON SINGLE COMPONENT WORKING FLUIDS FOR ORGANIC RANKINE CYCLES (ORCs)...........................................................................9
2.1 Introduction ................................................................................................................9 2.2 General criteria for Selecting Working Fluids in ORC ............................................10 2.3 Studies Based on Critical Temperature ....................................................................14 2.4 Studies Based on Molecular Complexity .................................................................18 2.5 Comparison in Efficiency among Selected Fluids ...................................................22 2.6 ORCs at Supercritical Region ..................................................................................27 2.7 Major Findings .........................................................................................................28
3. A PROCEDURE TO SELECT WORKING FLUIDS FOR SOLAR ORGANIC RANKINE CYCLES .........................................................................................................35
3.5. Results and discussion .............................................................................................51 3.5.1. Dominant factors influencing the performance of an ORC ............................. 51 3.5.2. Maximum thermal efficiency of the ORC for different working fluids .......... 52 3.5.3. Comparing procedure of preselected working fluids ...................................... 54 3.5.4. Exergy efficiency enhancement in a solar ORC .............................................. 60
3.6. Conclusions .............................................................................................................68 4. EXERGOECONOMIC ANALYSIS OF SOLAR ORGANIC RANKINE CYCLE FOR A BUILDING IN HOT AND HUMID CLIMATE ..................................................72
4.1 Introduction ............................................................................................................722 4.2 TRNSYS Software ...................................................................................................73 4.3 Building and GSHP System Description .................................................................74 4.4 Building and GSHP System Modeling Details ........................................................75 4.5 Calibration Procedure ...............................................................................................80 4.6 ORC System Modeling Details ................................................................................84 4.7 The Optimal Solar ORC Components and Working Condition ...............................89 4.8 Solar Radiation Intensity Effect on the Solar ORC Performance ............................95
viii
4.9 Economic Comparison between the Solar ORC and PV Panel System ...................98 4.10 Exergoeconomic Analysis of the Optimal Solar ORC System ............................104 4.11 Conclusions ..........................................................................................................108
5. CONCLUSIONS AND FUTURE WORK ..................................................................110
5.1 Future work ............................................................................................................115
LIST OF REFERENCES .................................................................................................116
VITA ................................................................................................................................119
ix
LIST OF TABLES
TABLE PAGE
Table 2.1 Optimization results for a regenerative biomass ORC (Drescher and Bruggemann, 2007)........................................................................................................... 16 Table 2.2 Optimization results for a regenerative waste heat ORC for fluids with different molecular complexity (Invernizzi et al., 2007) ................................................................. 21 Table 2.3 Summary of the most important characteristics of the fluids and cycle for selected fluids.................................................................................................................... 31 Table 2.3 Summary of the most important characteristics of the fluids and cycle for selected fluids (Continued) ............................................................................................... 32 Table 3.1 Preselected working fluids ................................................................................ 38 Table 3.2 Practical limits of the ORC for preselected working fluids .............................. 41 Table 3.3 Values of the coefficients for the thermal loss coefficient of the LS-3 PTC absorber tube [Delgado-Torres and Garcia-Rodriguez (2007a)] ...................................... 48 Table 3.4 Maximum delivery of an ORC employing different working fluids ................ 53 Table 3.5 Regeneration Effects on thermal efficiency, exergy efficiency, and irreversibility of a solar ORC employing IND300 and LS-3 solar collectors for different working fluids ................................................................................................................... 64 Table 3.6 Molecular complexity of working fluids .......................................................... 65 Table 4.1 Key properties of constituent layers of the building envelope’s main components ....................................................................................................................... 76 Table 4.2 Made assumptions in modeling building and GSHP. ....................................... 81 Table 4.3 Temperature difference between the inside and outside of the building for February and March in Pensacola based on measured data and simulation results. ......... 85 Table 4.4 Power consumption of the building in Pensacola based on simulation results and available billing information ...................................................................................... 86 Table 4.5 Selected solar collector specifications .............................................................. 88
x
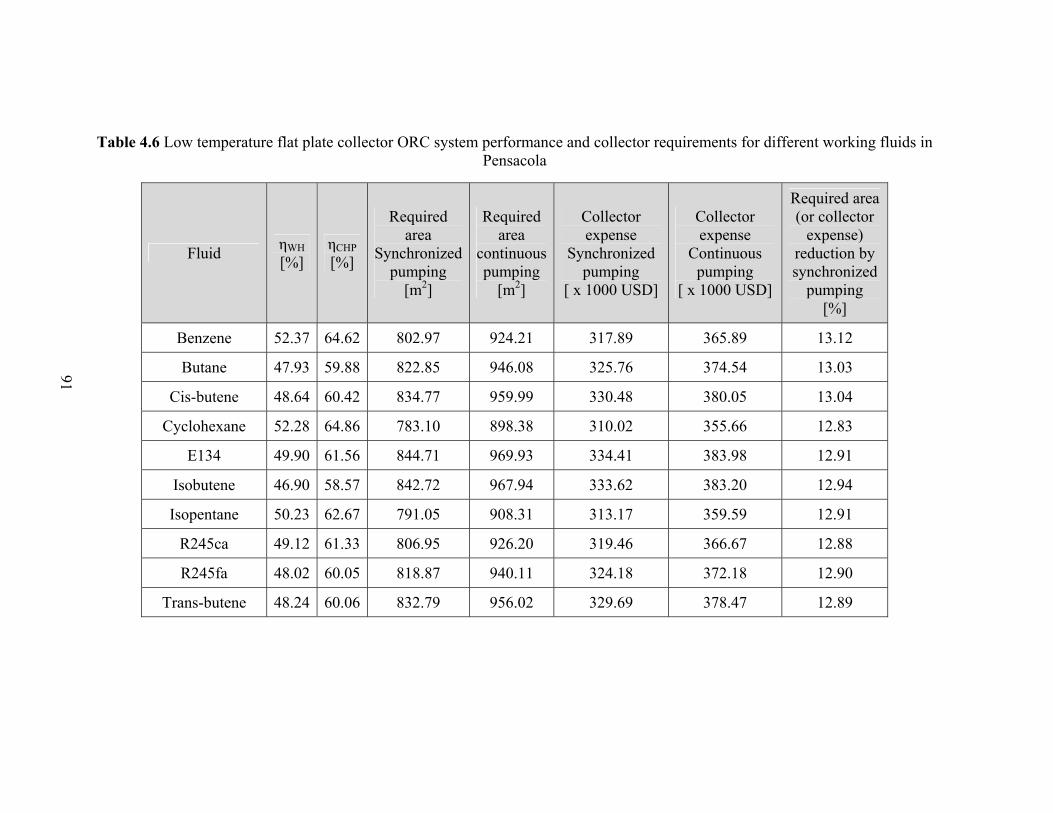
Table 4.6 Low temperature flat plate collector ORC system performance and collector requirements for different working fluids in Pensacola .................................................... 91 Table 4.7 Low temperature evacuated tube collector ORC system performance and collector requirements for different working fluids in Pensacola ..................................... 92 Table 4.8 Medium temperature evacuated tube collector ORC system performance and collector requirements for different working fluids in Pensacola ..................................... 93 Table 4.9 Annual power demand of the building and the annual power generation per collector unit for the solar ORC which employs evacuated tube collector and Isopentane as the working fluid for Pensacola,Miami and Houston ................................................... 98 Table 4.10 Derate factors for AC power rating at Standard Testing Condition ............. 101 Table 4.11 Selected PV panel and inverter specifications .............................................. 103 Table 4.12 Required area and total cost for the suggested solar ORC system (employing low-temperature evacuated tube and Isopentane as working fluid) and PV panel system to maintain the power demand of the building ................................................................... 104 Table 4.13 The exergy loss, capital cost, payback period and Rex of the ORC system which employs low temperature evacuated tube collector for different working fluids in Pensacola......................................................................................................................... 106
xi
LIST OF FIGURES
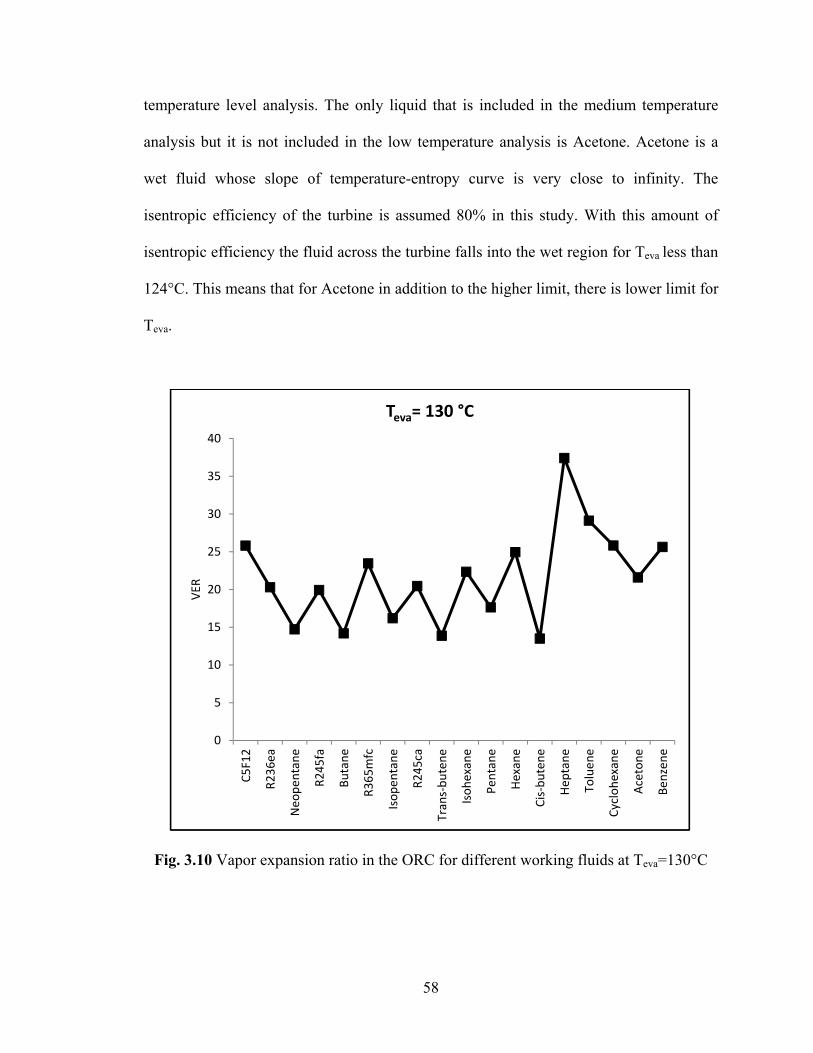
FIGURE PAGE Fig. 2.1 Framework of the research. ................................................................................... 8 Fig. 2.1 Organic fluids with lower specific vaporization heat produce less irreversibility (Larjola, 1995)............................................................................................ 12 Fig. 2.2 (a) Plant layout (b) Typical T-S diagram for a regenerative ORC (Drescher and Bruggemann, 2007)........................................................................................................... 17 Fig. 2.3 The effect of molecular complexity on the Tr-S diagram (Mago et al., 2008) .... 19 Fig. 2.4 Parabolic Trough Collector (PTC) ...................................................................... 26 Fig. 2.5 Pressure ratios and vapor expansion ratio across the turbine for selected fluids 33 Fig. 2.6 Variation of the fluid and cycle characteristics for linear hydrocarbons ........... 33 Fig. 2.7 Variation of the critical temperature, boiling temperature and efficiency for refrigerants ........................................................................................................................ 34 Fig. 3.1 Higher pressure limit of the ORC ..................................................................... 40 Fig. 3.2 Actual saturated basic ORC .............................................................................. 43 Fig. 3.3 Enthalpy calculation procedure in a saturated basic ORC ................................ 44 Fig. 3.4 Heat transfer components to/from a solar ORC ................................................ 45 Fig. 3.5 Actual saturated regenerative ORC .................................................................. 49 Fig. 3.6 Supplementary enthalpy calculation procedure in a saturated regenerative ORC........................................................................................................................................... 50 Fig. 3.7 Variation of performance factors with respect to Teva of an ORC employing R-236ea as working fluid (a) VER and wnet (b) ηth and ηex .................................................. 52 Fig. 3.8 Thermal and exregy efficiency of the ORC for different working fluids at Teva=130°C ........................................................................................................................ 56 Fig. 3.9 Net output power of the ORC for different working fluids at Teva=130°C ......... 57 Fig. 3.10 Vapor expansion ratio in the ORC for different working fluids at Teva=130°C 58
xii
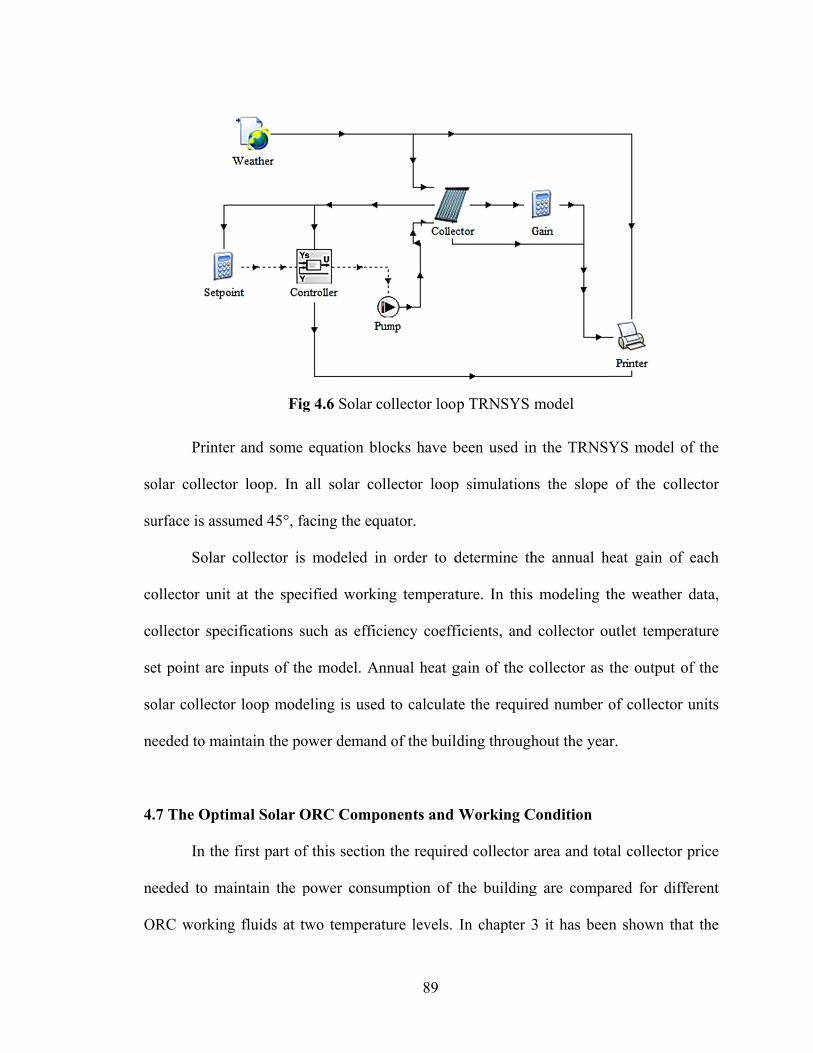
Fig. 3.11 Thermal and exregy efficiency of the ORC for different working fluids at Teva=85°C .......................................................................................................................... 60 Fig. 3.12 Net output power of the ORC for different working fluids at Teva=85°C ......... 61 Fig. 3.13 Vapor expansion ratio in the ORC for different working fluids at Teva=85°C .. 62 Fig. 3.14 (a) Irreversibility reduction, (b) Exergy efficiency enhancement by increasing collector efficiency from 70% to 100% for Isopentane. ................................................... 63 Fig. 3.15 (a) Thermal and exergy efficiency enhancement, (b) Irreversibility reduction by using regenerative ORC based on molecular complexity of working fluids (Teva=130°C)........................................................................................................................................... 66 Fig. 3.16 (a) Thermal and exergy efficiency enhancement, (b) Irreversibility reduction by using regenerative ORC based on molecular complexity of working fluids (Teva=85°C)........................................................................................................................................... 67 Fig. 3.17 Proposed selection procedure of the working fluid in a solar ORC .................. 68 Fig 4.1 Building and GSHP system TRNSYS model SketchUp ...................................... 77 Fig 4.2 The building geometry created in Google SketchUp ........................................... 79 Fig 4.3 The electrical power consumption of the north zone heat pump unit based on measured data and simulation results ............................................................................... 82 Fig 4.4 Monthly average of indoor and outdoor temperatures for each hour of every day in February in Pensacola ................................................................................................... 83 Fig 4.5 Monthly average of indoor and outdoor temperature for each hour of every day in March in Pensacola ........................................................................................................... 84 Fig 4.6 Solar collector loop TRNSYS model ................................................................... 89 Fig 4.7 Required collector area for running the solar ORC which employs low temperature evacuated tube collector and Isopentane as the working fluid for Pensacola, Miami and Houston........................................................................................................... 95 Fig 4.8 Monthly power generation per collector unit for the solar ORC which employs low temperature evacuated tube collector and Isopentane as the working fluid for Pensacola, Miami and Houston......................................................................................... 97 Fig 4.9 Monthly average of solar radiation incident upon the collector surface for Miami, Pensacola and Houston ..................................................................................................... 97
xiii
Fig 4.10 A snapshot of the input page of the PVWatts 2 ................................................ 100 Fig 4.11 Rex variation versus ambient temperature for an ORC system which employs low temperature evacuated tube collector in Pensacola ................................................. 107 Fig. 5.1 Proposed selection procedure of the working fluid in a solar ORC .................. 111
xiv
LIST OF SYMBOLS
Cg geometric concentration ratio of solar collector [-]
Ex exergy [W]
Fe dirt degree of the collector mirrors [-]
Gb direct solar irradiance [W/m2]
h specific enthalpy [J/kg]
K incidence angle modifier [-]
Kg capital cost [USD]
Lex exergy loss [W]
annual exergy loss [kWh]
mass flow rate [kg/s]
P pressure [Pa]
annual power demand of the building [kWh]
Ph higher pressure limit of Rankine cycle [Pa]
Q heat transfer rate [W]
Q* irradiation rate [W]
Q0 ambient heat loss rate of solar collector [W]
q heat transfer per unit mass [J/kg]
R gas constant [J/kg K]
Rex ratio of the annual exergy loss to the capital cost [kWh/USD]
s specific entropy [J/kg K]
Sgen entropy generation rate [W/K]
∆T temperature difference [K]
xv
T temperature [K]
Tbp boiling point [°C]
T* apparent sun temperature [K]
thermal loss coefficient per unit area of the absorber tube [W/m2 K]
W power [W]
w power per unit mass [J/kg]
Greek Symbols
εreg regeneration efficiency [-]
η efficiency [%]
ηopt,0 collector optical efficiency at a zero incidence angle [%]
σ molecular complexity [-]
angle of incidence of the direct solar radiation [rad]
Subscripts
a actual
abs absorber
c collector
CHP combined heat and power
con condenser
cr critical
eva evaporator
ex exergy
xvi
f saturated liquid
g saturated vapor
in inlet flow
inside inside of the building
j cycle component index
L low
ME measured data
TR TRNSYS simulation results
net net output
out outlet flow
outside outside of the building
p pump
r reduced property
s isentropic
SV saturation vapor
t turbine
th thermal
WH water heating
wf working fluid
0 ambient
xvii
Superscripts
¯ average
Sat saturation state
Acronyms
DIPPR Design Institute for Physical Properties
GSHP Ground Source Heat Pump
HVAC Heating, Ventilating and Air Conditioning
NZEB Net Zero Energy Building
ODP Ozone Depletion Potential
ORC Organic Rankine Cycle
PTC Parabolic Trough Collector.
PV Photovoltaic
SHGC Solar Heat Gain Coefficient
SRCC Solar Rating and Certification Corporation
STC Standard Test Conditions
1
CHAPTER 1
INTRODUCTION
1.1 Research Background
Buildings have a significant impact on energy consumption. The Net Zero Energy
Building (NZEB) concept is a promising approach to overcoming the energy crisis of our
time. The NZEB is a residential or commercial building with greatly reduced energy
needs achieved through efficiency gains such that the balance of energy needs can be
supplied with renewable technologies on an annual basis. This study is an attempt at
achieving NZEB using a solar-assisted geothermal heat pump.
Air conditioning systems are usually the most energy consuming devices in
regular residential and commercial buildings especially in hot and humid climates.
Among different air conditioning systems, the heat pump is the most common system in
which the amount of heat absorption from its condenser in cooling mode, has a great
effect on the efficiency of the system. Ground Source Heat Pumps (GSHPs) use the
relatively constant temperature of ground. Heat is extracted from the ground and
delivered to the space during the winter, and removed from the space and rejected into
the ground during the summer. The cooling Energy Efficiency Ratio (EER) of a GSHP is
higher than its heating EER which makes the GSHP a better choice for cooling
dominated regions. For this reason GSHPs have recently become more popular for
residential and commercial space cooling applications.
Electricity generation for a GSHP is another challenge. It is clear that in a net zero
energy building, the input energy of the electricity generation system should be a form of
2
sustainable energy. Solar radiation has the highest capacity and the lowest replenishment
time among sustainable energies. There are different technologies available to convert
solar radiation to electricity. Because of the low efficiency and high capital costs of PV
panels and also the high energy consumption and CO2 production rate of the
manufacturing process of PV panels, this technology has not been widely commercialized
for residential and commercial building application. Enhancement of the PV panel
manufacturing process may alter this conclusion in the future. Therefore the use of solar
irradiation as a heat source to run heat engines is of great interest.
Because of the limitation of solar irradiation and efficiency of collectors, the
conventional Rankine cycle is economically feasible only for large scale power plants.
The Organic Rankine cycle (ORC) is a substitutive technology which is applicable for
small scale power generation for use in residential and commercial buildings. ORC
employs low grade heat from different sources such as biomass, geothermal, solar and
waste heat of industrial processes. The main difference between ORC and the
conventional Rankine cycle is in the working fluid. The boiling point of the working fluid
in ORC is much lower than steam, hence there is no need to achieve high temperatures to
generate vapor for running a micro-turbine or expander. As a result ORC can be driven at
lower temperatures than the Rankine cycles that use water.
Hot and humid climate has been selected for the study due to its high solar
intensity and long solar radiation time through the year. In addition in such a cooling
dominant region, the GSHP system has a better annual performance and electricity
demand profile of the building better follows the electricity generation profile by the
solar ORC system.
3
A solar ORC can be optimized with respect to different parameters. Parameters
that will be considered for solar ORC optimization in this study are as follows: the
working fluid, the working conditions of the cycle, the cycle configuration and the solar
collector type.
In most of the papers that have been reviewed so far ORC optimization has been
done for a limited number of fluids or the optimization procedure has been applied on an
ORC system using one specific working fluid.
Mago et al. (2008) determined the influence of the boiling point temperature on
the system thermal efficiency for both basic and regenerative ORCs by comparing
simulation results for R113, R123, R245ca and Isobutane. Angelino et al. (1984) suited
the performance of the ORC system employing seven linear hydrocarbons from C4H10
(n-butane) to C10H22 (n-decane). Hung (1995) compared ORC efficiency and
irreversibility for selected refrigerants and hydrocarbons. He selected R-113 and R-123
from refrigerants and p-Xylene (C8H10), Toluene (C7H8) and Benzene (C6H6) from
aromatic hydrocarbons. Hettiarachchi et al. (2007) compared a geothermal ORC optimum
performance for ammonia, R123, n-Pentane and PF5050 as the working fluid. Thermal
stability over the range of operating temperatures and a minimal degradation rate over
time is the only criteria in the preliminary selection of the working fluids for a given
ORC in Prabha’s analysis (2006). A regenerative cascade cycle with toluene as the
topping fluid and butane as the bottoming fluid is the optimized solar ORC plant relative
to this study.
A comparison between Toluene and some selected siloxanes for different
superheating temperatures, condensation temperatures and recuperator’s efficiencies in a
4
100 KW power ORC in the medium range temperature has been carried out by Delgado-
Torres and Garcia-Rodriguez (2007a).
Karellas and Schuster (2008) studied the effects of using working fluids at their
supercritical region on the ORC performance. The R-245fa was chosen as the working
fluid for calculations.
As can be seen, because of the wide variety of fluid parameters and the cycle
conditions that have been considered in the literature, there have been very limited
attempts at systematically categorizing the selection of working fluids, working condition
and cycle configuration for an ORC. In addition previous investigations on the ORC
using solar heat are very limited and often emphasize the optimized cycle that results in
different working conditions for different working fluids. The best performance of each
fluid in a Rankine cycle has not been compared under the relatively same benchmark
conditions for solar heat applications. The employment of a specific solar collector in a
specific geographic region often limits its temperature range. Therefore the highest
allowed temperature for a working fluid in the ORC is not necessarily achievable through
solar heat source. Therefore it is necessary to develop a meaningful procedure to compare
capabilities of working fluids when they are employed in solar Rankine cycles with
similar working conditions.
1.2 Exergoeconomic Point of View
Among the methods that have been used to evaluate the performance of a thermal
energy system, there are techniques that combine thermodynamic and economic
principles. Thermoeconomics is a general term that describes any combination of a
5
thermodynamic analysis with an economic one. Compared with energy, exergy is a more
consistent measure of economic value. Exergoeconomics rests on the philosophy that
exergy is the only rational basis for assigning monetary costs to a system’s interactions
with its surroundings and to the sources of thermodynamic inefficiencies within it. The
ratio Rex of the exergy loss to the capital cost is the key parameter of exergoeconomic
analysis of energy systems.
Ozgener et al. (2007) believe that for any technology there is an appropriate value
for Rex where the design of the device is more successful if the Rex for that device
approaches that appropriate value. Rosen et al. (2003a) speculate that mature
technologies have achieved a balance of exergy loss and capital cost over the time that is
appropriate to the circumstances.
The main perspective in the exergoeconomic analysis of the Solar ORC system in
this study is to examine the relation between the exergy loss and the capital cost for the
optimal solar ORC system using the exergoconomic key parameter Rex.
1.3 Objectives and Significance of Study
Fossil fuel depletion, atmospheric pollution, global warming and ozone layer
destruction are serious problems experts face in finding more sustainable ways to satisfy
the requirements of human life. Buildings account for 40% of the energy used annually
worldwide. In the U.S. about as much construction and demolition waste is produced as
municipal garbage. As a result, both the constructions and Heating, Ventilating and Air
Conditioning (HVAC) industries are under increasing pressure from government and
environmental groups to replace conventional methods with more sustainable processes.
6
This research can give us applied guidelines for using sustainable resources of
energy for space air conditioning. By considering how the solar collector type, solar
collector size, working fluid selection, temperature and pressure of each section of cycle
influence the exergy loss, as well as their effects on the capital cost of the solar ORC
system, for a building with a specific power demand a unique combination of all these
parameters - the optimized condition - will be determined. This will inevitably be an
important step toward creating a sustainable society.
1.4 Framework of the Research
This research mainly focuses on employing exergoeconomic principles in order to
select optimal working fluids, cycle configuration, solar collector type and operation
conditions for solar ORCs to maintain power demand of a building in hot and humid
climate. Among above mentioned parameters, the selection of working fluids is the base
to determine the optimal performance of ORCs. In other words, other parameters
including cycle configuration, solar collector type, and operation conditions are addressed
in the selection process of working fluids for solar ORCs.
Chapter 2 presents a comprehensive review on the ORC literature. Second law
efficiency and exergetic studies on ORCs have thus far drawn less attention by
researchers. In addition, in most of papers that have been reviewed so far ORC
optimization has been done for a limited number of fluids or the optimization procedure
has been applied on an ORC system using one specific working fluid. In general, there is
no systematic procedure in the literature to compare capabilities of working fluids when
they are employed in ORCs with similar working conditions.
7
Chapter 3 is an attempt at filling above mentioned gaps in selecting working
fluids for the solar ORCs with a consideration of exergetic measures. In this chapter, a
procedure is developed to compare ORC working fluids in two different operation
conditions (i.e., two different temperature levels). The comparison is based on fluids
molecular components, temperature-entropy diagram of the fluid, and fluid effects on the
thermal efficiency, net power generated, vapor expansion ratio, and exergy efficiency of
the Rankine cycle. Fluids with the best cycle performance are recognized in two different
temperature levels within two different categories of fluids: refrigerants and non-
refrigerants. The optimal cycle configuration for the selected working fluids is identified
through an exergetic analysis.
In Chapter 4, the optimization process is finalized by identifying the best collector
type and its corresponding temperature level, and exergoeconomic principles are applied
on the optimal solar ORC. In the first section of chapter 4, the best collector-temperature
combination for the solar ORC which maintains the electricity demand of a geothermal
air-conditioned commercial building located in Pensacola of Florida is determined with
exergetic and economic considerations. Selected fluids in chapter 3 are employed in this
analysis. The solar collector loop, building, and geothermal air conditioning system are
modeled using TRNSYS. Available electricity bills of the building and the 3-week
monitoring data on the performance of the geothermal system are employed to validate
the simulation. By the end of this section, the optimal working fluids, cycle
configuration, solar collector type, and operation conditions of the solar ORC are
determined.
Second section of chapter 4 discusses the exergoeconomic analysis of the optimal
8
solar ORC system. The analysis shows that the ratio Rex of the annual exergy loss to the
capital cost can be considered a key parameter in optimizing a solar ORC system from
the thermodynamic and economic point of view. It also shows that there is a systematic
correlation between the exergy loss and capital cost for the investigated solar ORC
system. The framework of the research can be summarized and illustrated in Fig. (2.1).
Fig. 2.1 Framework of the research. Note: All steps are taken with exergetic considerations.
To identify the optimal cycle configuration for the selected
working fluids
To develop a systematic selection procedure of the working fluid
To identify the gaps of previous investigations
Literature review
To identify the optimal collector-temperature combination for the
selected working fluids and selected cycle configuration
Employing governing equations of basic thermodynamic cycle
- Modeling the building, GSHP system and solar collector loop using TRNSYS - To verify the simulation results using monitoring data and available electricity bills
Applying exergoeconomic principles on the optimal solar ORC
Employing governing equations of regenerative thermodynamic cycle
Steps Methods
To extract a systematic correlation between the exergy loss and capital cost of a solar
ORC
9
CHAPTER 2
A CRITICAL REVIEW ON SINGLE COMPONENT WORKING FLUIDS FOR
ORGANIC RANKINE CYCLES (ORCs)
2.1 Introduction
The main difference between the ORC and the conventional Rankine cycle is the
working fluid. The boiling point of working fluid in the ORC is much lower than steam,
hence there is no need to achieve high temperatures to generate vapor for running a
micro-turbine or expander. As a result ORCs can be driven at lower temperatures than the
Rankine cycles that use water.
The selection of working fluid and operation conditions has a great effect on the
system operation, and its energy efficiency and impact on the environment. The selection
of working fluid is the base to determine the optimal performance of ORCs. In other
words, other optimization parameters including cycle configuration, solar collector type,
and operation conditions are addressed in the selection process of working fluids for solar
ORCs.
The main advantage of using multicomponent organic fluids in the Rankine cycle
is non-isothermal phase change processes in the evaporator and condenser. Siloxanes
have the same advantage among single component working fluids. In addition,
muticomponent organic fluids cover an unlimited number of fluids and studies on them
are more fundamental than practical. For those reasons this literature review has been
narrowed to single component working fluids to reach to more practical conclusions.
10
Single component organic fluids have different categories which have desirable
and undesirable properties for use in ORC. This chapter presents a critical review on
single component working fluids in Organic Rankine Cycles (ORCs). The study focuses
on practical considerations for providing guidelines for the categorization of working
fluids based on their capabilities and shortcomings for power generation in a Rankine
cycle.
2.2 General criteria for Selecting Working Fluids in ORC
There are some general desirable properties of the working fluids in a
thermodynamic cycle regardless of its application that help reduce equipment size and
decrease different types of fluid loss (i.e. heat and pressure loss) while passing through a
component or fluid interaction with its environment. Some of these desirable properties
of working fluids in ORCs can be listed as follows:
• Small specific volume
• Low viscosity and surface tension
• High thermal conductivity
• Suitable thermal stability
• Non-corrosive, non-toxic and compatible with engine materials and lubricating
oils
• Moderate vapor pressure in the range (0.1-2.5 Mpa) in the heat exchange units
• High availability and low costs
• Low safety, health and environmental hazards
11
Low Ozone Depletion Potential (ODP) is one of the most important
environmental characteristic of the fluid used as the working fluid in the ORC system.
Chlorine containing fluids are not Ozone-safe and have been banned by Montreal
protocol and thus should be avoided in new systems.
We can also recognize properties of working fluids that are generally beneficial
for ORCs and help us for preliminary selection of fluids before computing calculations.
Depending on the slope of the temperature-entropy curve to be infinity, positive,
or negative, working fluids can be classified into isentropic, dry, or wet respectively. Dry
or isentropic working fluids are more appropriate for ORC systems. This is because dry
or isentropic fluids are superheated after isentropic expansion. Therefore there is no
concern for existing liquid droplets at the turbine outlet.
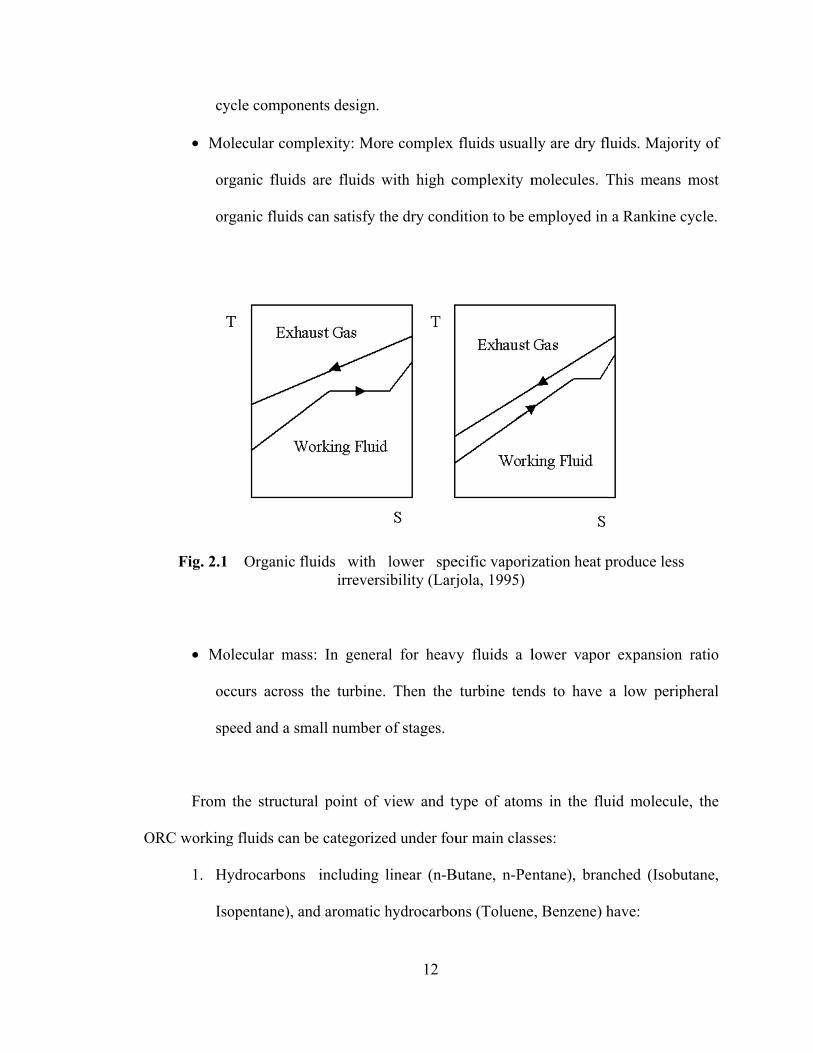
When the heat source is waste heat, organic fluids with lower specific
vaporization heat are preferred. Lower vaporization heat of the working fluid causes the
heat transfer process in the evaporator to occur mostly at variable temperature. Therefore
the temperature profile of the working fluid in the evaporator better follows the
temperature profile of heating fluid in the heat source. This means that the temperature
difference between fluids in the heat exchanger is reduced as illustrated in Fig. 2.1.
Hence the irreversibility in the heat transfer process is decreased.
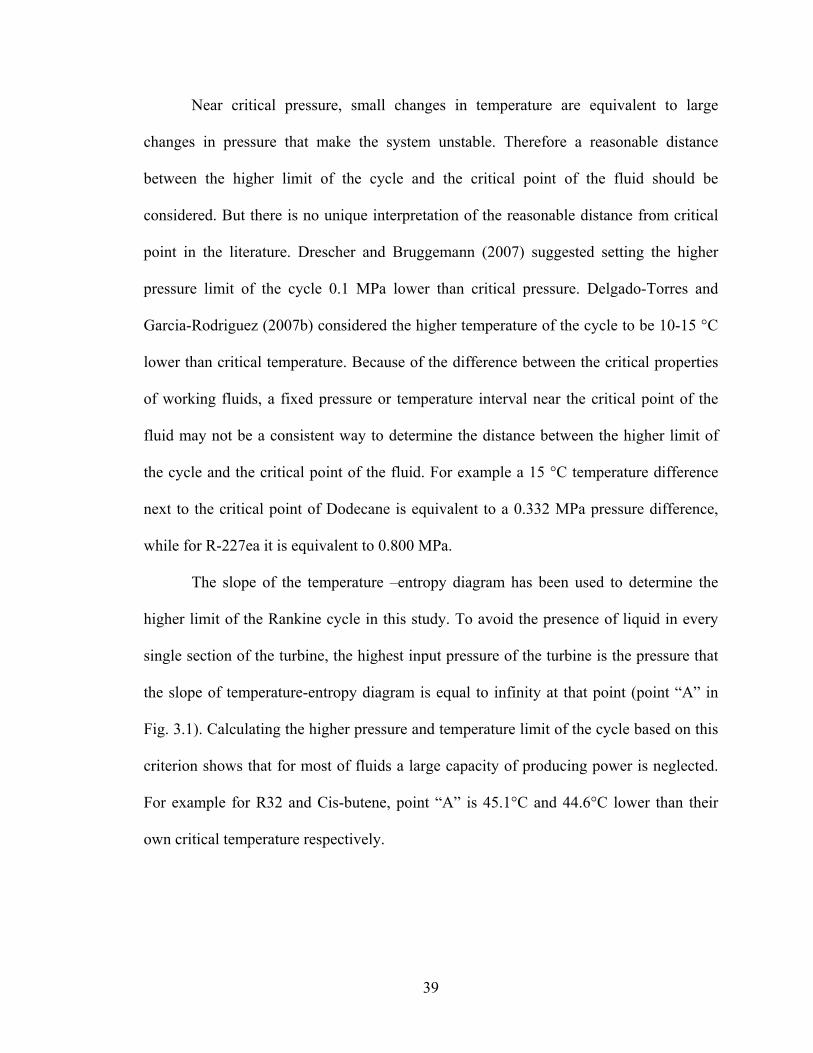
A few parameters which have the main effects on the cycle’s thermodynamic
performance are introduced as follows:
• Critical Temperature: At the fixed evaporating temperature (Teva) and
condensing temperature (Tcon) the higher critical temperature (Tcr) results in
higher pressure ratio but lower condensing pressure which could conflict with
the collector efficiency for two selected models, IND300 and LS-3, for most analyzed
fluids in this study is close to 70% for a large interval of Teva. Calculations show that the
exergy efficiency variation with respect to collector efficiency at each temperature level
not only has the same trend but also the exergy efficiency enhancement percentage is
almost the same for all selected fluids. It is also correct for the irreversibility reduction
trend and percentage.
Fig. 3.12 Net output power of the ORC for different working fluids at Teva=85°C
0
10
20
30
40
50
60
70
C4F1
0C5
F12
R227
eaRC
318
R423
AR2
36fa
R416
AR2
36ea
Neo
pent
ane
Isob
utan
eTo
luen
eR2
45fa
Buta
neIs
obut
ene
R365
mfc
Bute
neIs
open
tane
E134
R245
caIs
ohex
ane
Pent
ane
Tran
s-bu
tene
Hexa
neHe
ptan
eCi
s-bu
tene
Cycl
ohex
ane
Benz
ene
wne
t (KJ
/Kg)
Teva= 85 °C
62
Fig. 3.13 Vapor expansion ratio in the ORC for different working fluids at Teva=85°C
Fig. (3.14) shows the variation of irreversibility reduction and exergy efficiency
enhancement for Isopentane as a representative. As seen in Fig. (3.14), the theoretical
limit for irreversibility reduction through collector efficiency improvement for two
selected collector models, IND300 and LS-3, is 35%. It also shows this limit is 5% for
the exergy efficiency enhancement.
0
2
4
6
8
10
12
C4F1
0C5
F12
R227
eaRC
318
R423
AR2
36fa
R416
AR2
36ea
Neo
pent
ane
Isob
utan
eTo
luen
eR2
45fa
Buta
neIs
obut
ene
R365
mfc
Bute
neIs
open
tane
E134
R245
caIs
ohex
ane
Pent
ane
Tran
s-bu
tene
Hexa
neHe
ptan
eCi
s-bu
tene
Cycl
ohex
ane
Benz
ene
VER
Teva= 85 °C
63
(a)
(b)
Fig. 3.14 (a) Irreversibility reduction, (b) Exergy efficiency enhancement by increasing collector efficiency from 70% to 100% for Isopentane.
0
5
10
15
20
25
30
35
70 80 90 100
Irrev
ersi
bilit
y re
duct
ion
(%)
Collector Efficiency (%)
Teva=130 deg C Teva=85 deg C
00.5
11.5
22.5
33.5
44.5
5
70 80 90 100
Exer
gy E
ffici
ency
Enh
ance
men
t(%
)
Collector Efficiency (%)
Teva=130 deg C Teva=85 deg C
64
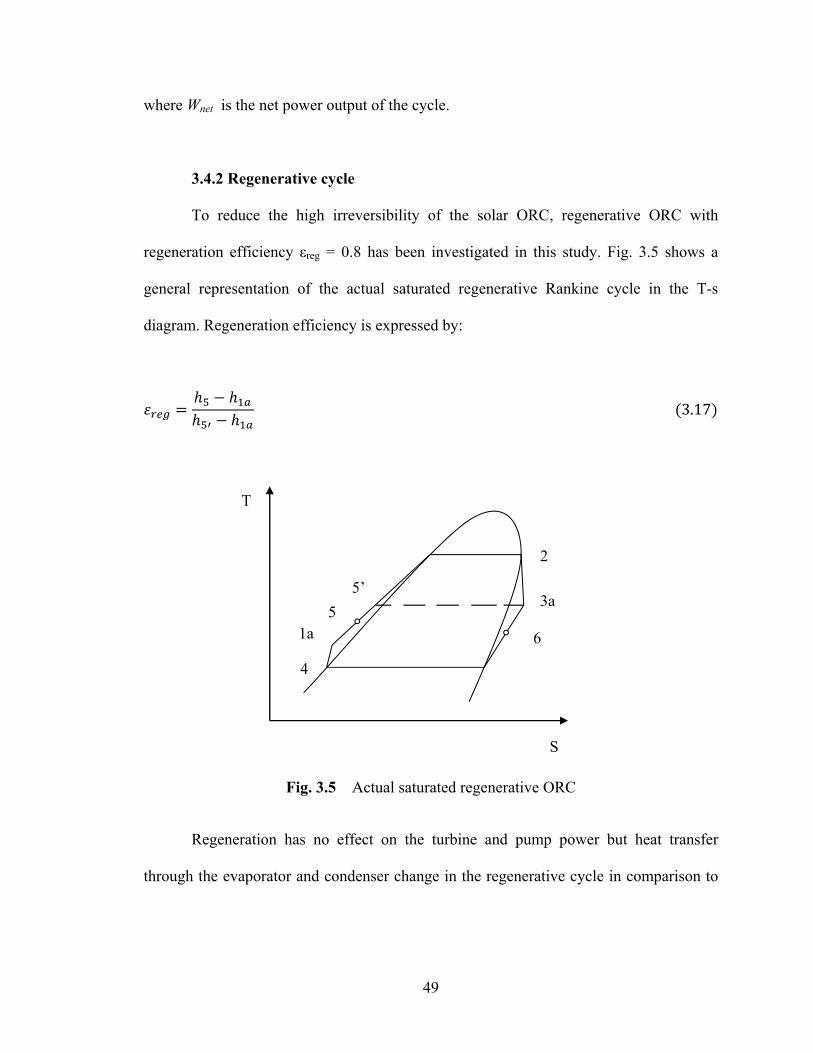
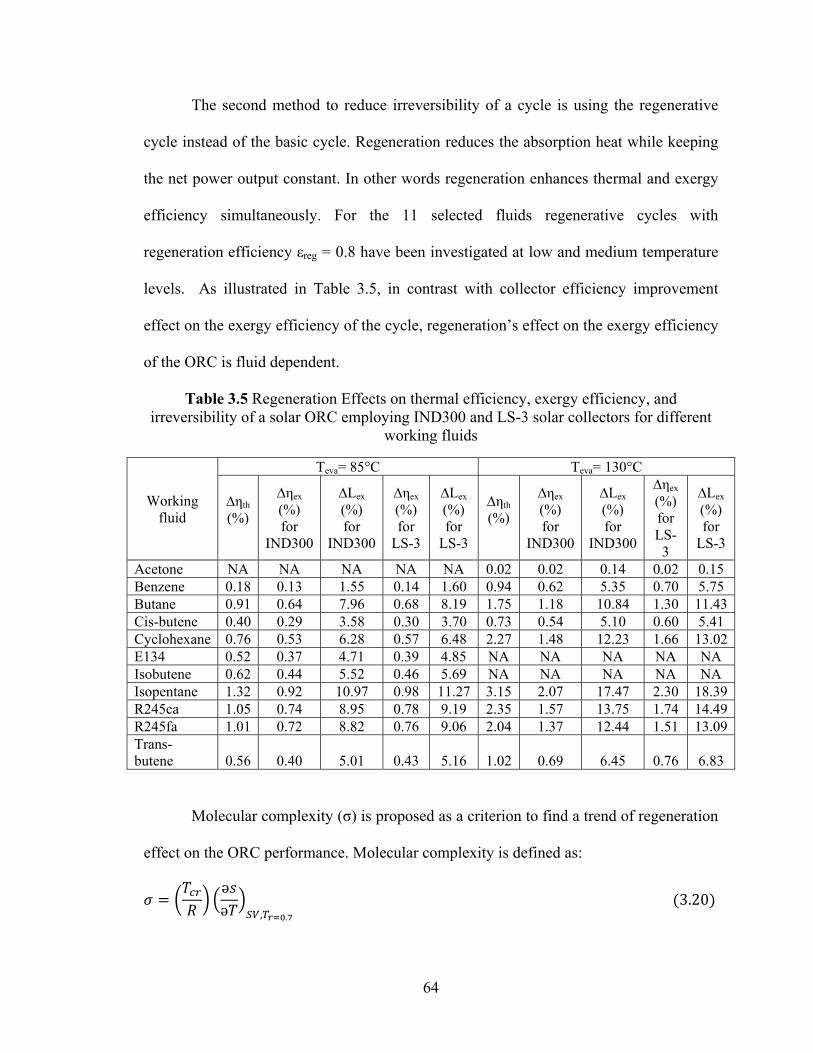
The second method to reduce irreversibility of a cycle is using the regenerative
cycle instead of the basic cycle. Regeneration reduces the absorption heat while keeping
the net power output constant. In other words regeneration enhances thermal and exergy
efficiency simultaneously. For the 11 selected fluids regenerative cycles with
regeneration efficiency εreg = 0.8 have been investigated at low and medium temperature
levels. As illustrated in Table 3.5, in contrast with collector efficiency improvement
effect on the exergy efficiency of the cycle, regeneration’s effect on the exergy efficiency
of the ORC is fluid dependent.
Table 3.5 Regeneration Effects on thermal efficiency, exergy efficiency, and irreversibility of a solar ORC employing IND300 and LS-3 solar collectors for different
working fluids
Working fluid
Teva= 85°C Teva= 130°C
∆ηth
(%)
∆ηex
(%) for
IND300
∆Lex
(%) for
IND300
∆ηex
(%) for
LS-3
∆Lex
(%) for
LS-3
∆ηth
(%)
∆ηex
(%) for
IND300
∆Lex
(%) for
IND300
∆ηex
(%) for LS-3
∆Lex
(%) for
LS-3
Acetone NA NA NA NA NA 0.02 0.02 0.14 0.02 0.15 Benzene 0.18 0.13 1.55 0.14 1.60 0.94 0.62 5.35 0.70 5.75 Butane 0.91 0.64 7.96 0.68 8.19 1.75 1.18 10.84 1.30 11.43Cis-butene 0.40 0.29 3.58 0.30 3.70 0.73 0.54 5.10 0.60 5.41 Cyclohexane 0.76 0.53 6.28 0.57 6.48 2.27 1.48 12.23 1.66 13.02E134 0.52 0.37 4.71 0.39 4.85 NA NA NA NA NA Isobutene 0.62 0.44 5.52 0.46 5.69 NA NA NA NA NA Isopentane 1.32 0.92 10.97 0.98 11.27 3.15 2.07 17.47 2.30 18.39R245ca 1.05 0.74 8.95 0.78 9.19 2.35 1.57 13.75 1.74 14.49R245fa 1.01 0.72 8.82 0.76 9.06 2.04 1.37 12.44 1.51 13.09Trans-butene 0.56 0.40 5.01 0.43 5.16 1.02 0.69 6.45 0.76 6.83
Molecular complexity (σ) is proposed as a criterion to find a trend of regeneration
effect on the ORC performance. Molecular complexity is defined as: әә , . (3.20)
65
where Pr and Tr are reduced pressure and temperature respectively, R is gas constant and
SV stands for saturation vapor.
The higher slope of the entropy-temperature diagram results in higher molecular
complexity. Table 3.6 shows the molecular complexity of selected fluids.
Figures (3.15) and (3.16) show thermal and exergy efficiency enhancement and
irreversibility reduction of the ORC by using the regenerative cycle for selected working
fluids. In these figures fluids are arranged in the horizontal axis in ascending order of
molecular complexity.
At both temperature levels and based on all performance factors discussed in this
section higher molecular complexity results in a more effective regenerative cycle. The
only exceptions to this rule are Benzene and Cyclohexane. This means that the
regeneration will be more effective in ORCs employing high molecular complexity
working fluids if they are not Cyclohydrocarbons.
66
(a)
(b) Fig. 3.15 (a) Thermal and exergy efficiency enhancement, (b) Irreversibility reduction by using regenerative ORC based on molecular complexity of working fluids (Teva=130°C)
Fig. 3.16 (a) Thermal and exergy efficiency enhancement, (b) Irreversibility reduction by using regenerative ORC based on molecular complexity of working fluids (Teva=85°C)
• Thermal efficiency of ORC cycle for different working fluids (From
chapter 3).
• Annual power demand of the building resulting from building and GSHP
modeling.
Table 4.3 Temperature difference between the inside and outside of the building for February and March in Pensacola based on measured data and simulation results.
The presented results in Tables 4.6 to 4.8 show that the best collector-temperature
combination for supplying the building power is the low temperature evacuated tube solar
collector. In the real case, the minimum required collector area among all possible
options is 722.54 m2 which belongs to the low temperature ORC using the evacuated tube
solar collector and Cyclohexane as its working fluid. This amount can be reduced to
627.52 m2 by synchronizing circulation pump running time with the heat pump units’
running time. It can be seen however that the power consumption rate of the circulation
pump is low in comparison to units’ power consumption; non-stop working of the pump
can increase the required collector area and the corresponding expense up to 13 percent.
After Cyclohexane, Isopentane with a 728.16 m2 required collector area, and Benzene
and R245ca each with a 742.96 m2 required collector area to maintain the power demand
of the building are the best working fluids to be employed in the ORC system.
Isopentane is a more optimal choice for working fluid in comparison to
Cyclohexane, Benzene, and R245ca. Cyclohexane is a smog generating pollutant. Smog,
which is ground-level Ozone, is formed when volatile organic compounds and oxides of
nitrogen interact in the presence of sunlight. Exposure to elevated smog levels can cause
serious respiratory problems, such as aggravate asthma and lead to increased respiratory
infection rates. Benzene is also not a suitable choice due to its carcinogenic properties,
while R245ca has a relatively high global warming potential, which makes it more
undesirable as a working fluid.
While the thermal efficiency of the ORC for none of the fluids in this study can
exceed 19.2 % at low or medium temperature levels, relatively high combined heat and
power efficiencies up to 74% are achievable which makes the use of the ORC technology
95
more reasonable.
4.8 Solar Radiation Intensity Effect on the Solar ORC Performance
In this section the effect of solar radiation intensity on the performance of the
suggested technology is investigated. Pensacola, Miami and Houston have been selected
as the representatives of hot and humid climate.
The required collector area for running the solar ORC which employs low
temperature evacuated tube collector and Isopentane as the working fluid for the above
mentioned cities have been depicted in Figure 4.7. As can be seen in Figure 4.7 the
variation of required collector area versus working fluid has the same trend in all three
cities. For all working fluids, the required collector area for Pensacola is less than that of
Miami but more than that of Houston.
Fig 4.7 Required collector area for running the solar ORC which employs low temperature evacuated tube collector and Isopentane as the working fluid for Pensacola,
Miami and Houston
650
700
750
800
850
900
Req
uirr
ed c
olle
ctor
are
a (m
2 )
Pensacola Miami Houston
96
To find the reason for this trend, the monthly power generation of the
aforementioned ORC system per collector unit and monthly average of solar radiation
incident upon the collector surface for Miami, Pensacola and Houston have been
presented in Figures 4.8 and 4.9.
Figures 4.8 and 4.9 show that the monthly variation of the power generation of the
ORC per collector unit and the average solar radiation incident upon the surface follow
the same pattern. This conformity is not just due to the order but the amount as well. For
example, in months like January, February and December where the differences between
the average solar radiations in the cities are significant, the differences between power
generations of the system per collector unit in different cities are significant too. In
months like August, September and October where the differences between average solar
radiations in the cities are negligible, the power generations of the ORC per collector unit
in three cities are very close to each other.
The power demand of the building is different in different cities due to their
different weather conditions. Hence the annual power demand of the building should be
considered in order to justify the differences between required collector areas needed to
run the suggested ORC system in the cities presented in Fig. 4.7. Table 4.9 shows the
annual power demand of the building and annual power generation per collector unit of
the aforementioned ORC system in Pensacola, Miami and Houston.
Houston has the minimum power generation per collector unit using the suggested
ORC while the power demand of the building in that city is higher than the demand in
Pensacola. Hence in Houston, the maximum collector area needed to run the suggested
97
Fig 4.8 Monthly power generation per collector unit for the solar ORC which employs low temperature evacuated tube collector and Isopentane as the working fluid for
Pensacola, Miami and Houston
Fig 4.9 Monthly average of solar radiation incident upon the collector surface for Miami, Pensacola and Houston
80
90
100
110
120
130
140
150
160
170
180
Jan Feb Mar Apr May Jun Jul Aug Sep Oct Nov Dec
Mon
thly
pow
er g
ener
atio
n pe
r co
llec
tor
unit
(kW
h)
Pensacola Miami Houston
0
100
200
300
400
500
600
700
Jan Feb Mar Apr May Jun Jul Aug Sep Oct Nov Dec
Sol
ar r
adia
tion
(W
/m2)
Pensacola Miami Houston
98
ORC system. In Miami the suggested ORC system can generate 7.4 percent more power
per collector unit in comparison to the system in Pensacola while the power demand of
the building in Miami is 14.5 percent more that the demand in Pensacola. Therefore the
required collector area to run the system in Miami is higher than that in Pensacola.
Table 4.9 Annual power demand of the building and the annual power generation per
collector unit for the solar ORC which employs evacuated tube collector and Isopentane as the working fluid for Pensacola,Miami and Houston
Pensacola Miami Houston
Annual power demand [kWh]
46408.0 53132.6 47784.1
Annual power generation per collector unit
[kWh]
1684.6 1808.6 1541.1
4.9 Economic Comparison between the Solar ORC and PV Panel System
Because of the low efficiency and high capital costs of PV panels and also the
high energy consumption and CO2 production rate of the manufacturing process of PV
panels, this technology has not been widely commercialized for residential and
commercial building application.
An economic comparison between the studied solar ORC system and a PV panel
system that maintains the electricity demand of the building is presented in this section.
PVWatts™ 2 is used to determine the required PV panel area and number of inverters to
maintain the power demand of the building. PVWatts™ Grid Data calculator is an
99
internet-accessible simulation tool for providing quick estimates of the electrical energy
produced by grid-connected crystalline silicon PV system for a location in United States
from an interactive map. This tool has been provided by National Renewable Energy
Library and it is available to public.
The Grid Data calculator employs a PV performance model and hourly typical
meteorological year (TMY2) weather data to estimate annual energy production for a
crystalline silicon PV system. It allows users to create estimated performance data of the
PV system for any location in the United States or its territories by selecting a site on a
40-km gridded map. PVWatts™ 2 considers data from a climatologically similar typical
meteorological year data station and site-specific solar resource and maximum
temperature information to provide PV performance estimation. In version 2,
performance is first calculated for the nearest TMY2 location and then translated to the
desired 40-km grid cell location. Grid cell monthly values of solar radiation and
meteorological parameters are used in the translation process.
The input factors of the PV system that should be determined by the user are as
follows:
• Nameplate DC power rating
• DC-to-AC derate factor
• Array type (fixed, sun-tracking with one or two axes of rotation)
• Tilt angle
• Azimuth angle
• Electricity cost
A
ra
fo
d
u
Figure
ACA derate f
ating at Stan
or losses fro
erate factors
sed by the P
e 4.10 show
factor is a m
ndard Test C
om the DC n
s for the com
PVWatts calc
Fig 4.10
ws a snapsho
multiplier tha
Conditions (S
nameplate p
mponents of t
culator and th
0 A snapshot
100
ot of the inp
at is applied
STC). The o
power rating
the PV syste
heir ranges a
t of the input
put page of
by PVWatts
overall DC-t
g and is the
em. The defa
are listed in
t page of the
the PVWatt
s to determin
to-AC derat
mathematic
ault compon
the Table 4.
e PVWatts 2
ts 2. The D
ne the AC p
e factor acc
al product o
nent derate fa
.10.
2
DC-to-
power
ounts
of the
actors
101
Table 4.10 Derate factors for AC power rating at Standard Testing Condition
Component derate factors
PVWatts default Range
PV module nameplate DC
rating 0.95 0.80–1.05
Inverter and transformer
0.92 0.88–0.98
Mismatch 0.98 0.97–0.995
Diodes and connections
1.00 0.99–0.997
DC wiring 0.98 0.97–0.99 AC wiring 0.99 0.98–0.993
• PV module nameplate DC rating derate factor accounts for the accuracy of the
manufacturer's nameplate rating.
• Inverter and transformer derate factor reflects the inverter's and transformer's
combined efficiency in converting DC power to AC power.
• The derate factor for PV module mismatch accounts for manufacturing tolerances
that yield PV modules with slightly different current-voltage characteristics.
Consequently, when connected together electrically, they do not operate at their
102
peak efficiencies.
• Diodes and connections derate factor accounts for losses from voltage drops
across diodes used to block the reverse flow of current and from resistive losses in
electrical connections.
• DC wiring derate factor for DC wiring accounts for resistive losses in the wiring
between modules and the wiring connecting the PV array to the inverter.
• AC wiring derate factor for AC wiring accounts for resistive losses in the wiring
between the inverter and the connection to the local utility service.
• The derate factor for soiling accounts for dirt, snow, and other foreign matter on
the surface of the PV module that prevent solar radiation from reaching the solar
cells.
• The derate factor for system availability accounts for times when the system is off
because of maintenance or inverter or utility outages.
• The derate factor for shading accounts for situations in which PV modules are
shaded by nearby buildings, objects, or other PV modules and arrays.
• The derate factor for sun-tracking accounts for losses for one- and two-axis
tracking systems when the tracking mechanisms do not keep the PV arrays at the
optimum orientation.
• The derate factor for age accounts for performance losses over time because of
weathering of the PV modules.
Annual electricity production of each PV panel which is the output of the
PVwatt™ 2 and the available annual power demand of the building are used to calculate
the required number of PV panels and inverters to maintain the annual power demand.
103
Table 4.11 shows the specifications of selected PV panel and inverter.
Table 4.11 Selected PV panel and inverter specifications
Supplier Kyocera Solar Fronius USA
Model KD135GX-LPU IG PLUS 5.0-1
Type Multicrystal
Sicilon module Utility
interactive
Maximum power at STC [w]
135 NA
Maximum power voltage at STC [V]
17.7 NA
Maximum power current at STC [A]
7.63 NA
Recommended PV power [w]
NA 4250-5750
Maximum input voltage [v]
NA 600
Nominal input current [A]
NA 13.8
Nominal output power [w]
NA 5000
Gross area [m2] 1.00 NA
Unit price at May 2011 [USD]
365 3320
Table 4.12 shows the required area and total cost for the suggested solar ORC
system (employing low-temperature evacuated tube and Isopentane as working fluid) and
PV panel system to maintain the power demand of the building in Pensacola. It can be
seen for the suggested ORC system the required collector area to maintain the power
demand of the building is more than 60 percent less than required PV panel area to
maintain the same amount of power. The total cost to establish the suggested solar ORC
system is more than 50 percent less than total cost of running a PV panel system to
104
maintain the power demand of the building in Pensacola.
Table 4.12 Required area and total cost for the suggested solar ORC system (employing low-temperature evacuated tube and Isopentane as working fluid) and PV panel system to
maintain the power demand of the building
System Required
area [m2]
Collector/ PV expense
[ x 1000 USD]
ORC package/Inverter expense
[ x 1000 USD]
Total cost [ x 1000 USD]
Solar ORC 728.16 257.81 75 332.81
PV 1839.00 671.24 33.2 704.44
4.10 Exergoeconomic Analysis of the Optimal Solar ORC System
The main objective of this section is to examine the relation between the exergy
loss and the capital cost of the optimal solar ORC system using the exergoconomic key
parameter Rex. Rex is defined by the Eq. (4.5).
(4.5)
where is the annual exergy loss in [kWh] and Kg is the capital cost in [USD].
is calculated using Eq. (4.6).
(4.6)
105
where Lex is exergy loss of the cycle in [W], is the annual power demand of the
building in [kWh] and Wnet is the net power output of the cycle in [W].
is one of the outputs of the building and the GSHP system modeling. Lex and
Wnet are calculated by Equations (3.2) and (3.1) in chapter 3.
The main reason that the capital cost is the only considered economic item in this
study is that the use of other economic details like maintenance cost, interest rate and
equipment lifetimes increases significantly the complexity of the analysis. There are two
main justifications for this simplification:
• Capital costs are often the most significant part of the total cost of the system.
Hence, the consideration of only capital cost closely approximates the results
when the total cost of the system is considered.
• The total cost components other than capital costs often are proportional to
capital costs. Therefore, the identified trends in the present study will likely be
in good conformity with those identified when the entire cost term is
considered.
Ozgener et al. (2007) believe that for any technology there is an appropriate value
for Rex where the design of the device is more successful if the Rex for that device
approaches that appropriate value. Rosen et al. (2003a) speculate that mature
technologies have achieved a balance of exergy loss and capital cost over the time that is
appropriate to the circumstances.
Table 4.13 shows the exergy loss, capital cost, payback period and Rex of the
106
ORC system which employs low temperature evacuated tube collector for different
working fluids in Pensacola. Minor costs such as controllers’ costs, in-line pumps’ costs
and piping costs have been neglected in comparison to collector and ORC system costs.
The selected ORC system in this study is a 50 kW EletraTherm™ ORC package.
Table 4.13 The exergy loss, capital cost, payback period and Rex of the ORC system which employs low temperature evacuated tube collector for different working fluids in
Fig 4.11 Rex variation versus ambient temperature for an ORC system which employs low temperature evacuated tube collector in Pensacola
Equations (4.7) to (4.9) confirm the exergoeconomic notion that states exergy is
the commodity of value in the system. This means that there is a systematic correlation
between the annual exergy loss and capital cost for the investigated solar ORC system.
Rex = 0.0031T0+ 1.2194R² = 1
Rex = 0.0031T0+ 1.2257R² = 1
Rex = 0.0031T0 + 1.233R² = 1
1.230
1.240
1.250
1.260
1.270
1.280
1.290
1.300
1.310
1.320
1.330
0 5 10 15 20 25 30
Rex
(kW
h/U
SD
)
T0 (°C)
Cyclohexane Isopentane R245ca
108
4.11 Conclusions
Exergoeconomic analysis of the optimal solar ORC system that maintains the
electricity demand of a geothermal air conditioned commercial building has been
accomplished in this chapter. The system requirements needed to run the solar ORC
system has been considered as the criteria to select the optimal components and optimal
working condition of the system such as collector type, working fluid and high
temperature level of the ORC system.
TRNSYS 17 has been employed for the modeling of the building, GSHP system
and solar collector loop. The building and GSHP modeling has been calibrated by
measured data from a 20 day monitoring period and also available billing information.
The system requirements needed to maintain the electricity demand of the
building with an ORC system has been compared for the 11 suggested fluids in chapter 3
for two temperature levels of 85°C and 130°C. The simulation results show that the best
collector-temperature combination for supplying the building power is the low
temperature evacuated tube solar collector. Cyclohexane and Ispentane with respectively
722.54 m2 and 728.16 m2 and Benzene and R245ca each with a 742.96 m2 required
collector area are the best working fluids to be employed in the ORC system to maintain
the power demand of the building in Pensacola. Isopentane is a more optimal choice for
working fluid in comparison to Cyclohexane, Benzene, and R245ca when considering
environmental and health issues.
The effect of solar radiation intensity on the performance of the suggested
technology was investigated. Pensacola, Miami and Houston were selected as the
representatives of hot and humid climate cities. The results show that the monthly
109
variation of the power generation of the ORC per collector unit and the average solar
radiation incident upon the surface follow the same pattern. This means that the solar
radiation incident upon the collector surface is a determining factor of the required
collector area to maintain a specific amount of electricity. The effect of weather condition
on the building load and consequently on the power demand of the building should not be
neglected.
An economic comparison between the solar ORC and PV panel system shows the
suggested ORC system (employing low-temperature evacuated tube and Isopentane as
working fluid) needs 60 percent less area and 50 percent less money than PV panel
system to maintain the power demand of the commercial building in Pensacola.
Exergoeconomic analysis of the optimal ORC system shows that the ratio Rex of
the annual exergy loss to the capital cost can be considered as a key parameter in order to
optimize a solar ORC system from the thermodynamic (exergy-based) and economic
point of view. It also shows that there is a systematic correlation between the exergy loss
and capital cost for the investigated solar ORC system.
110
CHAPTER 5
CONCLUSIONS AND FUTURE WORK
This research has been developed the applied guidelines for using a solar organic
Rankine cycle for space air conditioning. By considering how the solar collector type,
solar collector size, working fluid selection, temperature and pressure of each section of
the cycle influence the exergy loss, as well as their effects on the capital costs of the solar
ORC system, for a building with a specific power demand, a unique combination of all
these parameters - the optimized condition – has been determined.
A procedure to compare working fluid capabilities when they are employed in the
solar Rankine cycles with similar working conditions has been developed.
The exergoeconomic concept has been applied on the optimal solar ORC in order
to investigate the relation between the exergy loss and capital cost of the system for the
first time in this study. A systematic correlation between the annual exergy loss and
capital cost for the optimal solar ORC system has been derived.
5.1 Conclusions
A comprehensive list of working fluids has been analyzed to find the most
suitable fluids to operate a solar ORC. A procedure to compare working fluid capabilities
when they are employed in the solar Rankine cycles with similar working conditions has
been proposed. This procedure has been summarized and illustrated in Fig. (5.1).
The maximum practical thermal efficiency and corresponding cycle performance
factors confirm that fluids with a higher critical temperature have better performance in
111
the ORC. Calculation shows that a thermal efficiency higher than 25% and an exergy
efficiency higher than 20% are achievable in ORCs.
Fig. 5.1 Proposed selection procedure of the working fluid in a solar ORC
Discarding chlorine included fluids
Discarding highly wet fluids
Calculating thermal efficiency, exergy efficiency, net power generated, and vapor
expansion ratio
Setting higher temperature level of the cycle based on the collector type
Categorizing working fluids into: - Refrigerants - High performance non-refrigerants - Medium performance non-refrigerants
Choosing working fluids in the following order:
- Highest thermal/exergy efficiency - Highest net power generated - Lowest vapor expansion ratio
112
In the investigation, two temperature levels for Teva have been considered which
are 85 °C and 130 °C as representatives of low temperature and medium temperature
solar collectors.
Fluids have been divided into two groups: refrigerants and non-refrigerants.
Fluids with the best performance in the ORC have been recognized in each group. In the
non-refrigerant’s group, two different subdivisions have been considered: high
performance fluids and medium performance fluids. The reason for this subdivision is
that most non-refrigerants are in the medium performance group. Then by considering all
non-refrigerants as one group, a large group of fluids would be omitted from analysis.
At medium temperature level the final selected refrigerants through the introduced
procedure are R245fa and R245ca. The final selected non-refrigerants at Teva=130 °C are
Acetone and Benzene with high performance and Butane, Isopentane, Transbutan, and
Cis-butene with medium performance.
At the low temperature level only a few numbers of fluids have been changed in
comparison to fluids selected at the medium temperature level. At Teva=85 °C, E134 has
been added to the selected refrigerants at Teva=130 °C. In the non-refrigerants group,
Acetone has been replaced by Cyclohexane and Isobutene has been added to the fluids
with the medium performance capability.
Exergy efficiency enhancement and irreversibility reduction have been calculated
for all 11 selected fluids when the collector efficiency increases from 70% to 100% at
low and medium temperature levels. Calculation results show that the theoretical limit for
irreversibility reduction through collector efficiency improvement for two selected
collector models, IND300 and LS-3, is 35%. It also shows this limit is 5% for the exergy
113
efficiency enhancement.
Different configurations of ORCs have different effects on the overall thermal
efficiency of the cycle, the cycle total irreversibility, cycle second law efficiency, and the
mass flow rate needed to generate a certain power output. Regenerative ORC is the most
significant alternative configuration for basic ORC. The finite temperature difference
during the heat transfer process is the main reason for irreversibility. The regenerative
cycle reduces the irreversibility by using heat input from other parts of the system. In this
study it has been investigated by what percentage the regenerative cycle outperforms the
basic cycle with respect to the working fluid of the cycle. Calculation results show, at the
two temperature levels studied, the regeneration will be more effective in ORCs
employing high molecular complexity working fluids except for Cyclohydrocarbons.
The optimization process has been finalized by identifying the best collector type
and its corresponding temperature level, and exergoeconomic principles were applied on
the optimal solar ORC. The best collector-temperature combination for the solar ORC
which maintains the electricity demand of a geothermal air-conditioned commercial
building located in Pensacola of Florida is determined with exergetic and economic
considerations.
The system requirements needed to maintain the electricity demand of the
building with an ORC system has been compared for the 11 suggested fluids in the
previous section for two temperature levels of 85°C and 130°C. The simulation results
show that the best collector-temperature combination for supplying the building power is
the low temperature evacuated tube solar collector. Cyclohexane and Ispentane with
respectively 722.54 m2 and 728.16 m2 and Benzene and R245ca each with a 742.96 m2
114
required collector area are the best working fluids to be employed in the ORC system to
maintain the power demand of the building in Pensacola. Isopentane is a more optimal
choice for working fluid in comparison to Cyclohexane, Benzene, and R245ca when
considering environmental and health issues.
The investigation of solar radiation intensity effect on the performance of the
suggested technology shows that the monthly variation of the power generation of the
ORC per collector unit and the average solar radiation incident upon the surface follow
the same pattern. This means the solar radiation incident upon the collector surface is a
determining factor of the required collector area needed to maintain a specific amount of
electricity. The effect of weather condition on the building load and consequently on the
power demand of the building should not be neglected.
An economic comparison between the solar ORC and PV panel system shows the
suggested ORC system (employing low-temperature evacuated tube and Isopentane as
working fluid) needs 60 percent less area and 50 percent less money than PV panel
system to maintain the power demand of the commercial building in Pensacola.
Exergoeconomic analysis of the optimal ORC system shows that the ratio Rex of
the annual exergy loss to the capital cost can be considered a key parameter in order to
optimize a solar ORC system from the thermodynamic (exergy-based) and economic
point of view. It also shows that there is a systematic correlation between the annual
exergy loss and capital cost for the investigated solar ORC system.
115
5.1 Future work
Possible future works include:
• Evaluation of different options to reach to net zero energy building such
as:
- Installing appropriate equipment to return the surplus electricity to the grid
- Choosing an appropriate Thermal Energy Storage (TES) system
- Using PV panels as a supplement to the power generation system and
finding the best combination of ORC and PV panel system for this option
• All calculations of this study have been done in steady state mode and in
an annual base. Performing a time dependent analysis will give a better
understanding of the energy, exergy and cost flow in the system.
• A comprehensive comparison between the solar ORC and PV panel
system which includes consumed energy and materials in manufacturing process
of both technologies.
• Using Compound Parabolic Concentrating (CPC) collectors can be a
solution to reduce the required collector area while there are no studies to date on
using CPC collectors to generate power for a residential or commercial building.
CPC collector products have not been commercialized for public use as of yet.
For this reason the high price of CPC collectors is the main barrier of use in
residential or commercial building application.
116
LIST OF REFERENCES
Angelino, G., and Di Paliano, P. C., 2000, “Organic Rankine cycles (ORCs) for energy recovery from molten carbonated fuel cell,” Proceedings of the Intersociety Energy Conversion Engineering Conference, 2, pp. 1400-1409.
Angelino, G., Gaia, M., and Macci, E., 1984, “A review of Italian activity in the field of organic Rankine cycles,” VDI Berichte, pp. 465-482.
Bejan, A., Entropy generation through heat and fluid flow, John Wiley and Sons Inc., 1982.
Bruno, J.C., Lopez-Villada, J., Letelier, E., Romera, S., and Coronas, A., 2008, “Modeling and optimization of solar organic Rankine cycle engines for reverse osmosis desalination”, Applied Thermal Engineering, 28:2212-2226.
Cengel, Y.A., and Boles, M.A., Thermodynamics: An Engineering Approach, fifth ed., McGraw-Hill, 2006.
Delgado-Torres, A. M., and Garcia-Rodriguez, L., 2007a, “Preliminary assessment of solar organic Rankine cycles for driving a desalination system,” Desalination, 216, pp. 252-275.
Delgado-Torres, A. M, and Garcia-Rodriguez, L., 2007b, “Double cascade organic Rankine cycle for solar driven reverse osmosis desalination,” Desalination, 216, pp. 306-313.
Drescher, U. and Bruggemann, D., 2007, “Fluid selection for the Organic Rankine Cycle (ORC) in biomass power and heat plants”, Applied Thermal Engineering, 27:223-228.
Eck, M., and Steinmann, W.D., 2002, Direct steam generation in parabolic troughs: First results of the DISS project, ASME Journal of Solar Energy Engineering, 124, pp. 134-139.
Feng, M., 2008, “An exergy based engineering and economic analysis of sustainable building”, PhD Thesis, Florida International University, Miami, Florida.
Hermann, W. A., 2006, “Quantifying global exergy resources”, Energy, 31(12):1349-1366.
Hettiarachchi, H. D. M., Golubovic, M., Worek W. M., and Ikegami, Y., 2007, “Optimum design criteria for an Organic Rankine cycle using low-temperature geothermal heat sources,” Energy, 32, pp. 1698-1706.
Hung, T. C., 1995, “Waste heat recovery of organic Rankine cycle using dry fluids,” Energy Conversion and Management, 42(5), pp. 539-553.
117
Invernizzi, C., Iora, P., and Silva, P., 2007, “Bottoming micro-Rankine cycles for micro-gas turbines”, Applied Thermal Engineering, 27:100-110.
Karellas, S., and Schuster, A., 2008, “Supercritical fluid parameters in organic Rankine cycle applications,” International Journal of Thermodynamics, 11(3), pp. 101-108.
Larjola, J., 1995, “Electricity from industrial waste heat using high-speed organic Rankine cycle (ORC),” International Journal of Production Economics, 41(1-3), pp. 227-235.
Lemmon, E.W., Huber, M.L., and McLinden, M.O., 2007, NIST Standard Reference Database 23: Reference Fluid Thermodynamic and Transport Properties-REFPROP, Version 8.0, National Institute of Standards and Technology, Standard Reference Data Program, Gaithersburg.
Liu, B. T., Chien, K. H., and Wang, C. C., 2004, “Effect of working fluids on organic Rankine cycle for waste heat recovery,” Energy, 29, pp. 1207-1217.
Mago, P. J., Chamra, L. M., Srinivasan, K., and Somayaji, C., 2008, “An examination of regenerative organic Rankine cycles using dry fluids,” Applied Thermal Engineering, 28, pp. 998-1007.
Maizza, V., and Maizza, A., 1996, “Working fluids in non-steady flows for waste energy recovery systems,” Applied Thermal Engineering, 16(7), pp. 579-590.
Marion, B., Anderberg, M., George, R., Gary-Hann, P., and Heimiller D., “PVWATTS Version 2- Enhanced Spatial Resolution for Calculating Grid-Connected PV Performance,” National Renewable Energy Laboratory (NREL) publications.
Mills, D., 2004, “Advances in solar thermal electricity technology”, Solar Energy, 76:19-31.
National Renewable Energy Laboratoty (NREL) renewble energy data center, Updated June 06 2011, Website: < http://www.nrel.gov/rredc/pvwatts/grid.html >.
Ozgener, O., Hepbasli, A., and Ozgener, L., 2007, “A parametric study on the exegoeconomic assessment of a vertical ground-coupled (geothermal) heat pump system ,” Building and Environment, 42, pp. 1503-1509.
Prabha, E., March 2006, “Solar Trough ORC Electricity System (STORES) Stage 1- Power plant optimization and economics,” National Renewable Energy Laboratory report, NREL/SR-550-39433.
Rabl, A., Active solar collectors and their applications, Oxford University Press, New York, 1985.
Roodman, D.M. and Lenssen, N., 1995, “A building revolution: How ecology and health concerns are transforming construction”, Worldwatch Paper, Worldwatch Institute, Washington, DC.
118
Rayegan, R., and Tao, Y.X., 2009, “A critical review on single component working fluids for Organic Rankine Cycles (ORCs),” ASME Early Career Technical Journal, 8(1), pp. 20.1-20.8.
Rayegan, R., and Tao, Y. X., 2011, “A procedure to select working fluids for solar Organic Rankine Cycles (ORCs),” Renewable Energy, Vol. 36 (2), pp. 659-670.
Rosen, M.A., and Dincer, I., 2003a, “Exergoeconomic analysis of power plants operating on various fuels,” Applied Thermal Engineering, Vol. 23, pp. 643-658.
Rosen, M.A., and Dincer, I., 2003b, “Thermoeconomic analysis of power plants: an application to a coal fired electrical generating station,” Energy Conversion and Management, Vol. 44, pp. 2743-2761.
Torcellini, P., Pless, S., and Deru, M., 2006, “Zero energy buildings: A critical look at the definition”, National Renewable Energy Laboratory report, NREL/CP-550-39833.
TRNSYS 17 Main Reference Manual.
Tsatsaronis, G., 2007, “Definitions and nomenclature in exergy analysis and exergoeconomics”, Energy, 32(4):249-253.
Tsatsaronis, G., and Winhold, M., 1985, “Exergoeconomic analysis and evaluation of energy conversion plants: I.A new General methodology”, Energy, 10(1):69-80.
United Nations Environmental Programme, September 2006, “Montreal protocol on substances that deplete the ozone layer,” Website: <http://ozone.unep.org/teap/Reports/TEAP_Reports/Teap-CUN-final-report-Sept-2006.pdf >.
Zhang, X. R., Yamaguchi, H., Unedo, D., Fujima, K., Enomoto, M., and Sawada, N., 2006, “Analysis of a novel solar energy-powered Rankine cycle for combined power and heat generation using supercritical carbon dioxide,” Renewable Energy, 31, pp. 1839-1854.
119
VITA
RAMBOD RAYEGAN
EDUCATION
1996 B.Sc., Mechanical Engineering University of Tehran Tehran, Iran 1998 M.Sc., Mechanical Engineering University of Tehran Tehran, Iran 2009 Doctoral Candidate in Mechanical Engineering Florida International University Miami, Florida, USA
AWARDS
Florida International University, University Graduate School, Doctoral Evidence Acquisition Fellowship, Summer and Fall 2009. Florida International University, Student Government Association, Graduate Student Leadership Scholarship, 2008.
PUBLICATIONS
Book Chapter
Tao, Y. X., Rayegan, R., “Solar energy applications and comparisons,” in Energy and Power Generation Handbook, Editor: K. R. Rao, Publisher: ASME Press (In Press)
120
Papers
Rayegan, R., Tao, Y.X., 2011, “Analysis of solar Organic Rankine Cycle for a building in hot and humid climate,” ASME 2011 International Mechanical Engineering Congress and Exposition, Denver, Colorado, USA. (Accepted) Rayegan, R., Tao, Y. X., 2011 “A procedure to select working fluids for solar Organic Rankine Cycles (ORCs),” Renewable Energy, 36 (2), pp. 659-670. Rayegan, R., Tao, Y. X., 2009, “A critical review on single component working fluids for Organic Rankine Cycles (ORCs),” ASME Early Career Technical Journal, 8(1), pp. 20.1-20.8. Mun, J., Rayegan, R., Phadtare, S., Zhu, Y., and Tao, Y.X., “Feasibility Study of Horizental Ground Loop Modules of EnergyPlus on Geothermal Heat Pump System Simulation,” ASME International Mechanical Engineering Congress & Exposition, Denver, Colorado, November 2011 (Accepted). Jones, W.K., Zheng, F., Siddiqui, M., Rayegan, R., Tao, Y.X., 2008, “Development of 3-D channels in LTCC for capillary cooling structures for thermal management,” IMAPS/ACerS 4th International Conference and Exhibition on CICMT, Munich, Germany. Rayegan, R., Tao, Y. X., 2007, “A critical review of hot gas and reverse cycle defrost methods,” ASME Early Career Technical Journal, 6(1), pp. 9.1-9.8. Rayegan, R., Ziari A., 2006, “Analysis of energy and cost reduction in a typical residential building due to using appropriate thermal insulation materials,” The 5th Conference of Iranian Fuel Consumption Optimization (I.F.C.O.), Tehran, Iran. Rayegan, R., Jahani, N., 2004, “Ocean Thermal Energy Conversion (OTEC) power plants,” Proceedings of the 1st International Conference on Eco-energy, Urima, Iran. Nourbakhsh, A., Rayegan, R., 2001, “Cavitation erosion testing techniques,” Journal of Faculty of Engineering, University of Tehran, 34(1), pp. 96-107.