18
Scientia Iranica B (2021) 28(5), 2733{2750
Sharif University of TechnologyScientia Iranica
Transactions B: Mechanical Engineeringhttp://scientiairanica.sharif.edu
Research Note
Exergy-economic-environment optimization of thewaste-to-energy power plant using Multi-ObjectiveParticle-Swarm Optimization (MOPSO)
F. Esmaeilion, A. Ahmadi�, and R. Dashti
Department of Energy Systems Engineering, School of Advanced Technologies, Iran University of Science & Technology (IUST),Tehran, P.O. Box 16846-13114, Iran.
Received 11 March 2020; received in revised form 6 November 2020; accepted 1 February 2021
KEYWORDSExergy;MOPSO;Exergoenvironmental;Exergoeconomic;Waste-to-energy.
Abstract. The present study brings together the bene�ts of the results of exergy,exergoeconomic, and exergoenvironmental analyses as well as optimization of a waste-to-energy power plant. First, exergoeconomic balance for each stream was calculated.To validate the current simulations, the actual data from the Amsterdam waste-to-energypower plant in working conditions were examined. Moreover, the behaviors of the in uentialparameters in the objective functions were evaluated. In order to perform multi-objectiveoptimization, Multi-Objective Particle-Swarm Optimization (MOPSO) algorithm was em-ployed. To obtain the optimum operating conditions, 14 design parameters and 3 objectivefunctions were taken into consideration, with the total cost rate, total exergy e�ciencyof the cycle, and environmental impacts as the objective functions. Finally, the TOPSISdecision-making method determined the optimum-operating conditions. The results ofexergy analysis indicated that the most exergy destruction belonged to the incinerator unitat 66%. Instead, the pumps contributed the least in this �eld (approximately 1%). Underthe in uence of the optimization process, the total exergy e�ciency of the power plantincreased from 30.89% to 38.9% at the total cost of 5188.05 USD/hour. A comparison ofthe obtained results from the optimization procedure revealed that introducing optimumworking condition would cause an increase in the exergy e�ciency and a decrease in theexergy destruction among the components.© 2021 Sharif University of Technology. All rights reserved.
1. Introduction
Municipal Solid Waste (MSW) has turned into one ofthe major challenges of human life in the metropolises.In order to reduce the environmental impacts of wastes,a variety of techniques have been proposed among
*. Corresponding author. Tel.: +98-21-73225832E-mail addresses: [email protected] (F.Esmaeilion); a [email protected] (A. Ahmadi);[email protected] (R. Dashti)
doi: 10.24200/sci.2021.55633.4323
which burial or land�lling is a well-known conventionalmethod. In this method, available energy and usablematerials of waste are eliminated. In a Waste-To-Energy (WTE) unit, after proper separation, MSW isburned and the resulting energy is used to generatepower and heat [1]. Since these types of power plantshave a very small proportion of electricity productionand given the global population growth, the demand forsuch units is dramatically increasing [2,3]. Therefore,given the population growth of the countries andsubsequent generation of waste in the metropolitanareas, it is important to examine the factors thata�ect the performance of these units. One of the
2734 F. Esmaeilion et al./Scientia Iranica, Transactions B: Mechanical Engineering 28 (2021) 2733{2750
main challenges in some developed and developingcountries with the increasing rate of population growthis collecting, recycling, treating, and disposing ofsolid wastes and sewages that are increasingly accu-mulated [4{6]. The basic foundations for sustain-able development include management of waste ina cost-e�ective, energy-e�cient, and sustainable way.It should be emphasized that public health, safety,and environmental protections are also a�ected bywaste management [7,8]. With the development oftechnologies in the �eld of power generation, a newstructural design for a wide variety of power plantshas been proposed, one of the most important partsof which is WTE sector. This technology is capable ofcontrolling the process of converting waste to energy,providing the available process, and extracting themaximum energy from wastes [9,10]. As a result,analysis of these systems is of great signi�cance. Theobtained results from various studies referred to exergyand economic analyses as strong tools for assessmentof energy systems [11{14]. Exergy is an importantcriterion for measuring the degree of unbalance betweenthe matter and its surrounding. This criterion containseconomic and environmental parameters that expressits full functionality. Makkeh et al. [15] carriedout the exergy and exergoeconomic optimization of acogeneration system by Particle Swarm Optimization(PSO) to indicate the most optimum thermodynamicproperties in the integrated cycle. According to theobtained results from exergy destruction analysis, thepumps contributed the least in this regard. Ahmadi etal. [16] performed an exergy and economic investigationof an integration of heliostat solar receiver, gas turbine,and air bottom cycle. Gargari et al. [17] conductedan analysis and optimization for a biogas-based multi-generation system to determine the maximum amountof thermal e�ciency and exergy e�ciency with the min-imum values of unit product cost and environmentalpenalty charge rates.
Alrobaian [18] took bene�ts of energy, exergy,and economic factors to enhance the productivity ofwaste incineration CHP plant. In the presented con-�guration, the thermal e�ciency of the steam recoveryunit was 95% and the Waste Incineration Unit (WIU)contributed the most in the exergy destruction term.Fuji et al. [19] optimized the rate of waste utilizationto enhance the exergy e�ciency of the WTE cycle.The results of the comparison made between MSWand NG (Natural Gas) indicated that using waste inappropriate places would increase the impacts of CO2emission by more than two times. Multi-criteria op-timization of a WTE-TEG (thermoelectric generator)integrated cycle illustrated that the thermodynamicproperties (mass ow rate, temperature, etc.) ofcooling ow in condenser had a direct e�ect on thesystem performance [20]. Carneiro and Gomes [21]
investigated the technical operation of WTE plants.Based on the obtained results, the Amsterdam WTEpower plant underwent the highest investment costs perannual inputted MSW.
The exergy and energy study of pyrolysis in therotary kiln revealed that the pyrolysis exergy e�ciencyof the simulated mixture of plastic ranged from 59 to66%, while the HHV could vary for di�erent types ofproducts [22]. Yatsunthea and Chaiyat [23] revealedthe feasibility of using medical and municipal wastes incomparison with ORC and incinerator. The energy andexergy analyses showed that the relevant e�ciencieswere calculated as 8.05% and 39.98%, respectively. Inaddition, the levelized cost of exergy was estimated tobe 0.257 USD/kWh. Chen et al. [24] designed a newwaste incineration power plant and evaluated its per-formance by exergy criterion. Through optimization,the exergy productivity of waste-to-power increased by7.88% and the total exergy e�ciency grew by 0.43%.
Ehyaei et al. [25] optimized a Parabolic-TroughCollector (PTC) using a multi-objective particle swarmalgorithm to achieve optimum conditions in exergy andeconomic �elds. The optimization outcomes revealedthat the exergy e�ciency and heat cost were calculatedas 29.22% and 0.0142 USD/kWh, respectively. In thisstudy, the Pareto front demonstrated the ideal valuesof objective functions. Shaygan et al. [26] examinedhybrid polymer electrolyte membrane fuel cell andphotovoltaic cells to ensure ideal conditions in exergyand economic terms. In the considered system, thehighest value for exergy destruction belonged to thePV cell at 37.67 kW while the lowest value to thecompressor at 3.7 kW. An innovative combined powerand refrigeration cycle through geothermal energy waspresented by Ehyaei et al. [27]. In the mentionedcycle, the evaporator contributed the most to theexergy destruction rates at 1397, 1 kW. Further, theoptimization procedure improved the energy e�ciencyof the system by 38%. Exergy analysis of a diesel enginewas performed by Nabi et al. [28] who investigatedthe in uential parameters in system performance andtheir impacts. Ahmadi et al. [29] performed the exer-goenvironmental assessment of gas and air bottomingcycles by incorporating heat recovery Steam Generator(SG) to the whole system and the obtained resultsindicated that the energy e�ciency increased up to67.6%. Shamoushaki et al. [30] optimized a gas turbinepower plant and according to the obtained results,the combustion chamber contributed the most to ex-ergy destruction and the performance of the systemwas considerably improved by multi-objective particleswarm and genetic algorithms (separately). In 2016,an exergy-economic analysis was carried out on a bio-gasi�cation plant and the cost of exergy for di�erentcomponents of the plant was assessed [31]. Jack andOko [32] performed an exergoeconomic analysis of the

F. Esmaeilion et al./Scientia Iranica, Transactions B: Mechanical Engineering 28 (2021) 2733{2750 2735
Harcourt WTE power plant. Their obtained resultsindicated that the thermal and exergy e�ciencies of thecycle were 36.91% and 31.36%, respectively. Of note,the highest cost rate of the exergy destruction belongsto the SG and incinerator. However, the incineratorhad the highest proportion of irreversibility due tothe high temperature. Some studies have investigatedsimilar systems such as conversion of heat to energyusing the urban environmental sources [33]; economicand environmental review of the WTE systems forMSW [34]; energy potential of MSW [35]; economic,energy, and environmental analyses for MSW [36]; andassessment of the exergy life cycle of the WTE powerplant [37]. In the study of mass burner incinerator,the exergy and energy terms of the WTE power plantin Tehran, Iran have been calculated. The methodfunctions based on the percentage of compounds in theMSW of Tehran [38].
The novelty of the present study lies in itsoptimization of the WTE power plant through theexergy-economic-environmental approaches. The en-vironmental analysis also makes the results unique.Further and even more importantly, examination ofthe e�ective parameters in the WTE plant providesreliable results and a better understanding of thepower plant systems. Using PSO in multi-objectiveoptimization is a novel procedure for calculating theoptimum conditions of the energy systems that havedesirable outcomes, thus a�ecting system performanceand associated productivity. The results of this studyare brie y listed in the following:
� The WTE power plant was optimized in order toachieve ideal performance conditions in the exergy,economic, and environmental (3E) terms;
� The environmental performance of the power plantwas evaluated through the incinerated MSW. Inthis �eld, environmental impacts were considered bytheir imposed costs;
� The e�ective parameters in the WTE power plantwere examined, and the important parameters werecompared with the actual value obtained from theAmsterdam WTE power plant, thus representingthe appropriate results in the �eld of simulation andequation implementation;
� Exergy and economic analyses of the bottom ashwere conducted to determine the way of treatmentand processing of this part;
� The TOPSIS decision-making method was employedto demonstrate the best and worst conditions for thesystem. These values are based on the overall exergye�ciency and cost rate;
� Pareto front was drawn to declare the obtainedpoints from the optimization process, and the most
ideal point (lowest cost with the highest e�ciency)was identi�ed with the help of TOPSIS;
� The performance of the system was evaluated beforeand after optimization.
2. Mathematical modeling
2.1. Process descriptionIn this power plant, MSW with air required forcombustion enters into the furnace, and the producedheat generates the high-pressure steam. The systeminvolves two main sections: WIU and Rankine cyclefor recovering the produced thermal energy.
In the incinerator, Green-House Gases (GHGs)are emitted. Meanwhile, the furnace is designed underhigh-oxidizable settings, and there is no methane (CH4)emission in gases leaving the chimney. Moreover, thee�ect of bottom ash (state 41) on the exergy e�ciencywas evaluated and the total cost was calculated in thisstudy. As the �nal point, y ash and combustionproducts ow to the environmental control units. Inthe incinerator, the roof crane mixes the MSW. In thefurnace, temperatures are typically higher than 1000�Cand no other types of fuel are needed. Sometimes,there is an oil burner system in the furnace that isused to start and stop the furnace operation. After thecombustible process, what remains is known as slag (orash). The bottom ash is dumped and conveyed to beused in recycling. The boiler consists of long weldedpipelines. Water is heated by hot emitted exhaustsand converted to high-temperature steam. Steam withhigher pressure will produce higher power. At the sametime, increased pressure and temperature result in ahigher risk of equipment corrosion and higher mainte-nance costs. In this study, we used FDF (Forced DraftFan) on the entrance side and IDF (Induced Draft Fan)on the exhaust side. In both of them, the chemicalcomposition of the gases is constant and will remainunchanged. Through the FDF and IDF, the tempera-ture increment is around 3�C and 7�C, respectively.
The high-pressure steam is inputted into thesteam turbine with the pressure and temperature of130 bar and 440�C, respectively. The entire powerplant is presented in Figure 1. The gross generationcapacity of the power plant is about 100 MW, which isreduced to 93 MW by decreasing the power consumedat the pumps and losses. The plant has three separateturbines: High Pressure Turbine (HPT), IntermediatePressure Turbine (IPT), and Low Pressure Turbine(LPT). The inlet pressures for these steam turbinesare 130, 25, and 4 bar, respectively. The main steamexpands through the HPT, IPT, and LPT to generateelectricity by shaft work. At the next stage, the lastexhausted steam is condensed in the one-through watercooling condenser. To improve the thermal e�ective-

2736 F. Esmaeilion et al./Scientia Iranica, Transactions B: Mechanical Engineering 28 (2021) 2733{2750
Figure 1. Schematic of waste-to-energy power plant with streams speci�cations and associated power.
ness, portions of the expanded steam are extractedfrom di�erent places of the turbine to heat the feedwa-ter in the regeneration sub-systems including four low-pressure units (FWH1-FWH4), a deaerator (DEA),and the remaining three high-pressure components(FWH6-FWH8). Furthermore, one ST and three on-stream pumps are embedded to increase the waterpressure (CP, BP, and FWP). In this regard, states43{45 represent the power consumption while state42 indicates the power production. In this system,the air and stack ue gas temperatures are 298 and643 K, respectively. Further, the isentropic e�cienciesof pumps and turbines are 80 and 85%, respectively.
The cooling uid in the condenser is water whosetemperature increases with one pass from 22�C to48�C, thus cooling down the working uid. Demandedsolid waste rate based on its Lower Heating Value(LHV) for steam combustion and generation at 440�Cis 19.07 kg/s.
2.2. Energy modelingFor mathematical modeling of the cycle, several simpleassumptions are considered to provide a less compli-cated analysis by maintaining su�cient accuracy andtaking into consideration the following remarks:
1. All processes are steady;
2. Inlet air and combustion products are ideal gas
mixtures which have low pressures at high temper-atures; hence, the ideal assumption is reasonable;
3. The heat loss intended for the combustion chamber(incinerator) is equal to 2% of the lower heatingvalue of the fuel and the rest of the components areadiabatic;
4. The pressure drops in the connections are ignored;5. The thermal loss through the connections and
accessories is ignored;6. The feedstock (MSW) has steady compositions. In
the boiler, the excess air is 60% and the minor heatloss is 2%.
Of note, the furnace gate pressure drop is 0.622 bar.The incinerator is equipped with IDF and FDF. More-over, the minimum ue gas exit temperature is 137.8�Cand air temperature at the inlet state is 25�C. On thecontrary, some non-essential parameters such as energyloss due to unburned carbon, calcination of sorbent,sulfation as well as unburned carbon in ash, or plumevisibility index are ignored or remain unknown.
The �rst law of thermodynamics illustrates theoriginal concept of energy conservation. The relatedequation can be shown as Eq. (1):
Ein � Eout = �Esystem: (1)
In this equation, the total energy (E) changes based

F. Esmaeilion et al./Scientia Iranica, Transactions B: Mechanical Engineering 28 (2021) 2733{2750 2737
Table 1. Energy equations for WTE (Waste-To-Energy) power plant components based on energy balance.
Equipment Equations
Pump _WPump = _m�(P2 � P1) & h2 = h1 + _W_m = h1 + �(P2 � P1)
Heat exchangerP
_mihi =P
_mehe & �Q = _m(hi � he) & hi � he =RCpdT
Combustion chamber _maha + �CC _mMSWLHVMSW = _mgCPA(T40 � T39) + _mashhash
Steam turbineP
_mihi = _Wsteam turbine +P
_mehe & �steam turbine = _Wactual_Wisentropic
on the di�erence between the total input and output ofenergy through the system. Eqs. (2) and (3) show theenergy balance and continuity below:X
_mi =X
_me; (2)
_Q� _W =Xe
_mehe �Xi
_mihi: (3)
Based on this section, essential equations for physicaland thermal modeling can be provided. Given theenergy balance (Figure 1), the related equations forWTE power plant components are presented in Table 1.
In Table 1, _m is the mass ow rate throughthe pump, � the speci�c volume of the uid, _Wthe associated work, h the speci�c enthalpy, CP thespeci�c heat at constant pressure, LHV the LowerHeating Value, and P the pressure. Here, i and erepresent the input and output states, respectively.Also, the heat loss from the control volume systemsis ignored. Moreover, the condenser is a di�erent typeof heat exchanger. In the corresponding relations, �represents the changes and Cp is the heat transfercoe�cient at a constant pressure. In the combustionchamber relations, a, g, ash, and CC are the inputair, fuel, combustion products ( ue gas), bottom ash,and combustion chamber, respectively. In the steamcycle, the energy in the steam is converted into themechanical energy by the steam turbine. Steam turbineplays an important role in the Rankin cycle. Theenergy balance for the control volume is observed,where _Wsteam turbine is the steam turbine output workrate. The relation of the isentropic e�ciency of a steamturbine is given. Figure 1 illustrates all of the processesand components.
2.3. Exergy analysisExergy analysis works based on the �rst and secondlaws of thermodynamics that combines the principles ofenergy conservation. The main objective of the exergyanalysis is primarily optimization. If properly done,it shows where the largest energy losses occur in thepower plant and which part needs improvement in itsdesign. Hence, exergy is often considered an economicvalue criterion [39{41]. It can also be divided intofour parts: physical, chemical, kinetic, and potentialparts. In this study, the kinetic and potential partswere neglected in this study.
By applying the �rst and second laws of thermo-dynamics, the equilibrium of exergy is given in Eq. (4):
E _xQ +X
_miexi =X
_meexe + _ExW + _ExD; (4)
_ExQ = (1� To=Ti) _Qi; (5)
_ExW = _W; (6)
_ExD =X
_Exi �X _Exe = To _Sgen: (7)
In Eqs. (4){(7), T0, Ti, _W , _Q, and _Sgen are the ambienttemperature, inlet temperature, rate of associatedwork, rate of inlet heat, and rate of entropy generation,respectively. Speci�c exergy can be calculated throughEq. (8):
ex = exph + exch: (8)
In the above equation, subscripts ph and ch denote thephysical and chemical exergy, respectively. Physicalexergy of a system is de�ned as the maximum usefultheoretical work in a process in which the system �ndsbalance with an environment. Chemical exergy pointsto the distinction between the chemical composition ofa system and the reference environment [42,43].
exph = (h� ho)� To(s� so); (9)
where h and s are enthalpy and entropy, respectively,and To is the ambient temperature.
exchmix =hX
xiexchi +RToX
xi lnxii: (10)
The chemical exergy for the gas mixture is expressed inEq. (10), where x is the molar ratio, R the gas constant,To the ambient temperature, and exch the molarstandard chemical exergy [44]. While evaluating thechemical exergy, the systemic particles should refer tothe properties of a suitable collection of environmentalmaterials. However, for waste, the method for calcu-lating the chemical exergy di�ers from hydrocarbonsthrough Eq. (12) [45,46]:
_Exwaste = _mwasteexwaste; (11)
exwaste =1812:5+295:606 C+587:354 H+17:506 O
+ 17:735 N + 95:615 S � 31:8 A; (12)
where C, H, O, N, S, and A are the molar percentages of

2738 F. Esmaeilion et al./Scientia Iranica, Transactions B: Mechanical Engineering 28 (2021) 2733{2750
carbon, hydrogen, oxygen, nitrogen, sulfur, and ash inthe waste, respectively. The LHV of the MSW can becalculated using Dolang equation to approximate to thethermal value, as shown in Eq. (13) [46]. The entropyof solid waste can be calculated through Eq. (14) [45].HHV can be calculated based on Eq. (15) [47]. Here,C, H, O, N, S, H2O are the weight percentages of thewaste elements.
LHVwaste =337 C+1428�
H� O8� Cl
35:5
�+ 9; (13)
So =0:0055 C + 0:0954 H + 0:0096 O + 0:0098 N
+ 0:0138 S (kJ.kg�1.K�1); (14)
HHV =�
1� H2O100
�(�0:3578 C� 1:1357H
+ 0:0845O� 0:0594N� 0:1119S): (15)
According to the obtained results in 2008, if the com-position between the elements is known, the amount ofexergy can be calculated for fuels mixed with variouscompounds [48]. In this respect, � is a constant prop-erty (quality factor or exergy coe�cient) calculatedbased on Eqs. (16) and (17) using the provided data:
�LHV =E _xChLHV
; (16)
�LHV =
"1:0412 + 0:216
�H2
C
�� 0:2499
�O2
C
��1 + 0:7884
�H2
C
��+ 0:045
�N2
C
�=�10:3035
�O2
C
��#: (17)
The chemical exergy associated with the bottom ashis directly related to its temperature coming from thefurnace. In all cases, the temperature of the bottom ashis equal to that of the combustion products. Eq. (17)provides a proper insight into the exergy content of theMSW and validates Eq. (18):
exash = 0:0004056 T 2ash + 0:01057 Tash � 54:44; (18)
exash = 0:01A:nash
�Xxiex0
i +RToX
xi lnxi�:
(19)
In Eq. (19), R is the constant of the gases, A the masselement percentage in ash, n the number of oxides inthe ash, xi the molar ratio, and exi the standard chem-ical exergy of the components in the ash. In the exergyanalysis, the exergy of steam is calculated at each
point. The major share in the irreversibility and exergydestructions for boilers and turbines is associated withthe chemical reaction and thermal losses in the owpaths; however, in the water heaters and the condenser,the high temperature di�erence between the cold andhot water is an e�ective factor. Through the �rst law ofthermodynamics, energy conservation can be de�ned.The associated energy equations for each componentare used for suitable identi�cation for all streams.The equations for exergy ow, exergy destruction, andexergy e�ciency associated with each component aregiven in Table 2.
2.4. Economic analysisIn conventional economic analysis, the cost balance fora general system that works in a steady state is usuallyprovided by Eq. (20) [43]:
_CP;tot = _CF;tot + _ZCItot + _ZOM
tot ; (20)
where, _CP , _CF , _ZCI , and _ZOM are the productioncost, fuel cost, investment cost, and operation andmaintenance cost rates, respectively. According to thecost balance, the cost of the system production ( _CP )equals the total cost of production costs, i.e., the fuelcost rate ( _CF ), investment costs ( _ZCI), and operationand maintenance costs ( _ZOM ). Here, _C represents thecost rate associated with the ow of exergy, material ow, work, or heat transfer and _Z represents the restof the costs. Accordingly, for a component receivingheat and power, it can be de�ned as Eq. (21) [43]:X
(ce _Ee)k + cw;k _Wk = cq;k _Eq;k +X
(ci _Ei)k + _Zk;(21)
where, _Ei, _Ee, _Eq, and _W are the input exergy rate,output exergy rate, rate of exergy transfer through heatand power consumption, or production in the system,respectively. In addition, c is the cost per exergy inthese exergoeconomic equations. The investment costrate can be obtained through Eq. (22):
_ZK =PECk:�:CRF
N:3600: (22)
In the de�ned equation for _ZK , � is the maintenancefactor equal to 1.06, CRF is the recovery factor ofcapital expressed by the annual interest rate (i), andn is the period for the annual payback for calculatedcapital illustrated by the operating hours of the plantper year. Table 3 represents the values of PEC forvarious components.
CRF =i:(1 + i)n
(1 + i)n � 1: (23)
All of the presented equipment costs in this economicanalysis must be updated to the same reference year,

F. Esmaeilion et al./Scientia Iranica, Transactions B: Mechanical Engineering 28 (2021) 2733{2750 2739
Table 2. Exergy ow, exergy destruction, and exergy e�ciency equations for the components of WTE (Waste-To-Energy)plant.
Component Exergy ow equation Exergy destruction Exergy e�ciency
TurbinesHPT _E1 = _E2 + _E3 + _WHPT + T0 _Sgen
_ED;ST =Pi;ST
_E �Pe;ST
_E � _WST �e;ST = _WST( _Ei;ST�Ee;ST )IPT _E4 = _E5 + _E7 + _E8 + _E9 + _WIPT + T0 _Sgen
LPT _E10 = _E11+ _E12+ _E13+ _E15+ _WLPT+T0 _Sgen
PumpsCP _E16 + _WCP = _E17 + T0 _Sgen
BP _E28 + _WBP = _E29 + T0 _Sgen_ED;P = _WP +
Pi;P
_E �Pe;P
_E �e;P = ( _Ee;P�Ei;P )_WP
FWP _E23 + _WFWP = _E24 + T0 _Sgen
Feedwaterheaters
FWH1 _E17 + _E13 + _E30 = _E28 + _E18 + T0 _Sgen
FWH2 _E19 + _E12 + _E31 = _E30 + _E20 + T0 _Sgen
_ED;FWH =P
i;FWH
_E � Pe;FWH
_E �e;FWH =
Pe;FWH
_EPi;FWH _E
FWH3 _E20 + _E11 + _E32 = _E31 + _E21 + T0 _Sgen
FWH4 _E21 + _E9 = _E32 + _E22 + T0 _Sgen
FWH6 _E7 + _E24 + _E34 = _E33 + _E25 + T0 _Sgen
FWH7 _E25 + _E5 + _E35 = _E34 + _E26 + T0 _Sgen
FWH8 _E26 + _E3 = _E35 + _E27 + T0 _Sgen
Condenser _E36 + _E15 = _E37 + _E16 + T0 _Sgen _ED;Cond =P
i;Cond
_E � Pe;Cond
_E �e;Cond =
Pe;Cond
_EPi;Cond
_E
Deaerator _E22 + _E8 + _E33 = _E23 + T0 _Sgen _ED;FWH =P
i;FWH
_E � Pe;FWH
_E �e;Dea =
Pe;Dea
_EPi;Dea
_E
Table 3. Equipment cost function in the form of the corresponding thermodynamic parameters [32,51].
Component Capital or investment cost functions
Steam Turbine PECST = C51:�
_W 0:7ST
�:�
1 +�
0:051��ST
�3�:�
1 + exp�Tin�866
10:42
��& C51 = 3880:5 (USD.kW�0:7)
Condenser PECCond = C5 _msteam & C5 = 1; 773 USD.kg�1S
FeedWater Heater PECFWH = 6:6� _Q�
1(�Tut+4)
�0:1 ��P�0:08fw ��P�0:04
s
Pump PECFWH = C6 _W 0:7P
�1 + 2
1��P�
& C6 = 705:48 (USD.kW0:7)�1
Waste Incineration Unit PECWIU = 275:8 _mmsw:a + 18; 231; 500
Deaerator PECDea = C8 ( _mwater)0:7 & C8 = 74; 788� USD
kW0:7
�i.e., the year used as a basis for the cost studies. Atdi�erent times, this procedure is carried out using anappropriate Cost Index (CI) [49]. Eq. (24) is shown inBox I. In this case, the index factor and index value for
2018 are 1.00 and 1638.2, respectively; for 1995, theyare 1.61 and 1020.4, respectively [50].
To calculate the cost of equipment (Table 3)employed for the WIU, _mmsw:a is used as the annual
Cost in the reference year = Original cost��
cost index for the reference yearcost index for the year when the original cost was obtained
�:
(24)
Box I

2740 F. Esmaeilion et al./Scientia Iranica, Transactions B: Mechanical Engineering 28 (2021) 2733{2750
waste incineration rate (tone/year). In the feedwaterheater, _Q is the heat transfer rate in the feedwaterheater, �Tut is the di�erence between the temperaturesof the terminals, and �Pfw and �Ps are the pressuredrops in the feedwater and steam, respectively. WIUemissions have negative impacts on the environment.In this regard, the main objective is to reduce theenvironmental impacts upon increasing the e�ciencyof energy conversion processes and, consequently, re-ducing fuel consumption. In recent years, particularattention has been given to carbon dioxide emissionsas the most important greenhouse gas. However, otheremissions (CO and NOx) have been also taken intoconsideration. The available volumes of fuel in gramsper kilogram is prevented from entering the furnacestack [10]. Such emissions from WTE power plants areestimated through net electricity production (kWh) orclimate coe�cients considered for each country. Giventhat the climate coe�cients are less accurate and arenot de�ned for NOx and CO compounds, calculationsare made mainly based on the net power production ofthe power plant [51].
Data of greenhouse gas emissions (mg/kWh)point to the total electricity produced by all conven-tional power plants. Based on a combination of powerplants including fossil fuel power plants, nuclear powerplants, and renewable energy plants, greenhouse gasemissions from the power plant in a speci�c climateare considered in creating a global estimation of theemissions in that country. To perform analyses ata local level, instead of considering a power plant,the researchers combine certain factors used in cal-culations to determine the amount of the requiredenergy to replace the amount of energy produced inthe incineration of waste. In Table 4, the emissionfactors associated with the WTE power plant areintroduced [52].
_mi = �i:AEP; (25)
where �i is the pollutant emission factor and AEP is theelectricity produced. The cost of emission is calculatedusing Eq. (26):
Cenv = _mCO:cCO + _mNOx :cNOx + _mCO2 :cCO2 : (26)
The values of cCO, cNOx , and cCO2 indicate thecosts of emissions containing contaminants per kilo-
Table 4. Emission factors for waste to energy powerplants based on mg of emission per energy produced(kWh).
Emission Emission factor� mg
kWh
�CO2 690000CO 235NOx 660
gram which are 0.02086 USD/kg, 6.853 USD/kg, and0.024 USD/kg, respectively [53].
3. Optimization
In this section, multi-objective optimization is per-formed to optimize the WTE cycle. By identifyingthe decision variables, simulation codes are developedbased on PSO. The PSO algorithm is an imitationof social behaviors. Here, the word \particle" refersto, for example, a bee in a colony or a bird in a ock. Each particle behaves in a distributed pathusing individual personal information or a collectionof particle information. To be speci�c, if a particle hasa suitable route to access food, the rest of the particlesuse the collective knowledge to follow the intendedpurpose, even if they are far from the target. Particleknowledge optimization methods are behaviorally in-spired algorithms [54]. To implement the optimizationprocedure, all particles move at a certain velocity tothe optimum point; hence, the particle velocities mustbe determined. To begin with, in the �rst iteration (i =1), the velocity of all particles is assumed to be zero.In the ith iteration, the two important parameters usedby common particles are coordination and velocity:
1. The best value of xj(i) (the coordinates of the jthparticle in the ith iteration) is Pbest;j , with thehighest value of the objective function, f [xj(i)],found in the face of the particle j in the previousiteration. The best value for xj(i) is Gbest, withthe highest value of the objective function f [xj(i)],which encounters all previous replays with each ofN particles.
2. Finding the velocity of the jth particle in the ithiteration:
vj(i) =vj(i� 1) + c1r1[Pbest;j � xj(i� 1)]
+ c2r2[Gbest�xj(i�1)];
j=1; 2; � � � ; N; (27)
where c1 and c2 are individual and social learningrates; r1 and r2 are randomly distributed numbersfrom 0 to 1; c1 and c2 represent the signi�cance ofthe memory (position) of particles that are usuallyassumed to be 2.
3. The location or coordinates of the jth particle arefound in the ith iteration:
xj(i) = xj(i� 1) + vj(i); j = 1; 2; � � � ; N: (28)
Ultimately, the convergence analysis of the solution isdone at this stage. In case all particles converge to theknown values, the method is regarded as convergent.If the convergence is not satisfying, in the previousstep, the iteration is i = i + 1 and the calculation
F. Esmaeilion et al./Scientia Iranica, Transactions B: Mechanical Engineering 28 (2021) 2733{2750 2741
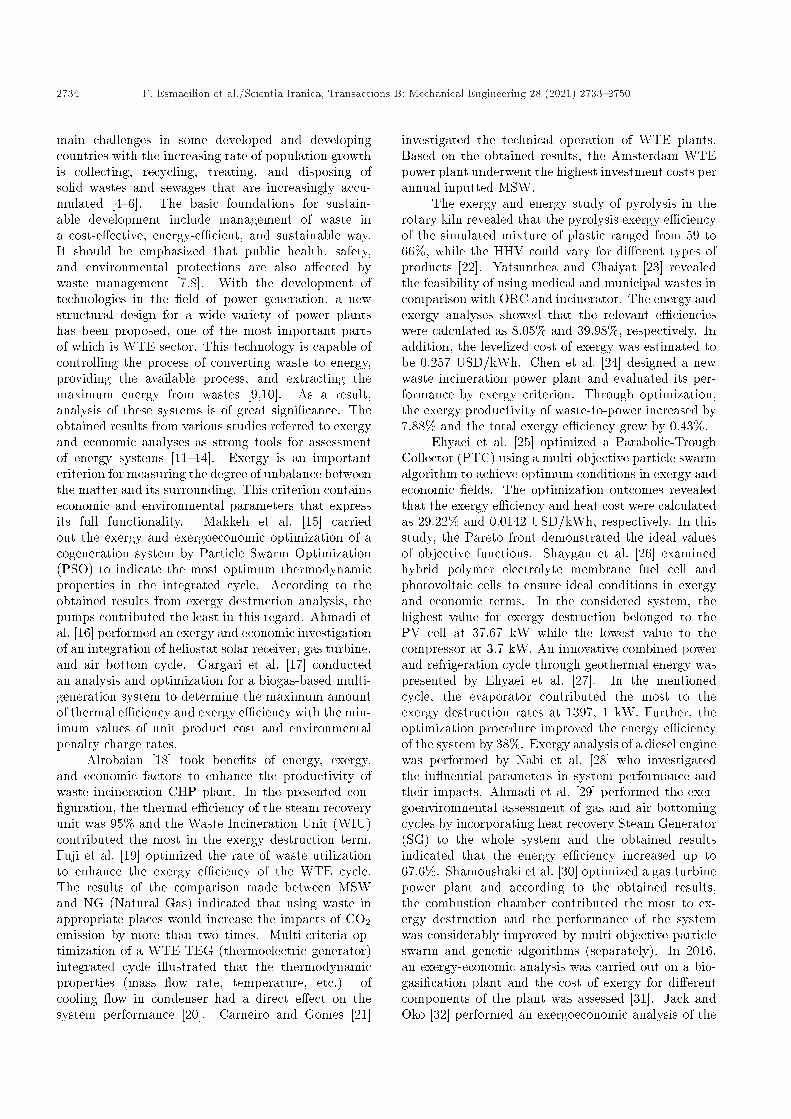
Figure 2. MOPSO (Multiple-Objective Particle Swarm Optimization) owchart.
of the values of new Pbest;j and new Gbest continuesthe iteration process until convergence to the optimumvalue. Figure 2 indicates the Multi-Objective Particle-Swarm Optimization (MOPSO) owchart.
In terms of optimization, two main objectivefunctions are de�ned: while the �rst objective functionis the total exergy e�ciency of the cycle, the latteris the objective function of a set of costs such asthe costs of fuel, exergy destruction, equipment, andenvironment. Eqs. (29) and (30) elaborate the above-mentioned remarks:
OF1 = �ex;cyc =_Wnet
_ExMSW; (29)
OF2 = _Cfuel +X
_Z +X
_CD;i + _Cenv; (30)
_Cfuel = cmsw: _mmsw:LHVmsw: (31)
The objective of multi-objective optimization is tomaximize the �rst objective function and minimize thesecond objective function. Obviously, there is morethan one point in the Pareto curve. Optimizationrequires determination of the decision variables withincertain intervals. To this end, 14 decision variableswere employed to perform optimization, as shown inTable 5.
In this study, MATLABr and EESr softwareproducts were used to determine the �nest response forthe system. Thermodynamic parameters including en-thalpy, entropy, exergy, e�ciency, etc. were calculatedand simulated using EESr software, and performanceassessment of the system and optimization process
2742 F. Esmaeilion et al./Scientia Iranica, Transactions B: Mechanical Engineering 28 (2021) 2733{2750
Table 5. Decision variables and their ranges.
Decision variable Range
P1 (bar) 100{170T1 (K) 720{770P2 (bar) 20{40P7 (bar) 10{20P5 (bar) 15{25P8 (bar) 6{10P9 (bar) 4{6P11 (bar) 3{4P12 (bar) 2{4P13 (bar) 1.1{2P14 (bar) 0.05{0.5�turbine (%) 75{90�pump (%) 75{90
_mmsw (kg/s) 15{25
(MOPSO) were performed by MATLABr software.Further, Aspen HYSYSr was employed to simulatethe incineration process in the waste incinerator unit,and thermo ow steam master softwarer was used tosimulate the steam cycle as well as the rest of the powerplant.
4. Results and discussion
To validate these equations, experimental values of theAmsterdam-Netherlands power plant were comparedwith the simulated values [55,56]. In these references,with the help of the collected values of AmsterdamWTE power plant, some of the e�ective parametersin the system performance analysis were identi�ed.
Table 6 introduces some of the important param-eters in the �elds of simulation and real values. WTEcycle energy and exergy e�ciencies, output power,steam turbine inlet temperature, waste mass ow rateinto the furnace, and ue gas temperature at theboiler exit are the values considered in this study thatexamined the extent of reliability of the thermodynam-ics modeling and simulation. The percentage errorof each parameter is indicative of high accuracy in
implementing the main equations. These percentageerrors have a small di�erence and none of them wouldexceed more than 4%.
Of note, there are in uential parameters in thepower cycle that a�ect the operating conditions andcause the changes in the cycle, as shown in Table 7.In addition, this table shows the thermodynamicproperties of each point. Table 8 provides the maininformation of the power plant including the mass owrate of MSW, mass ow rate of steam at the entranceof HPT, temperature of steam at the entrance of HPT,electrical power, ue gas temperature, and isentropice�ciencies of pumps and turbines.
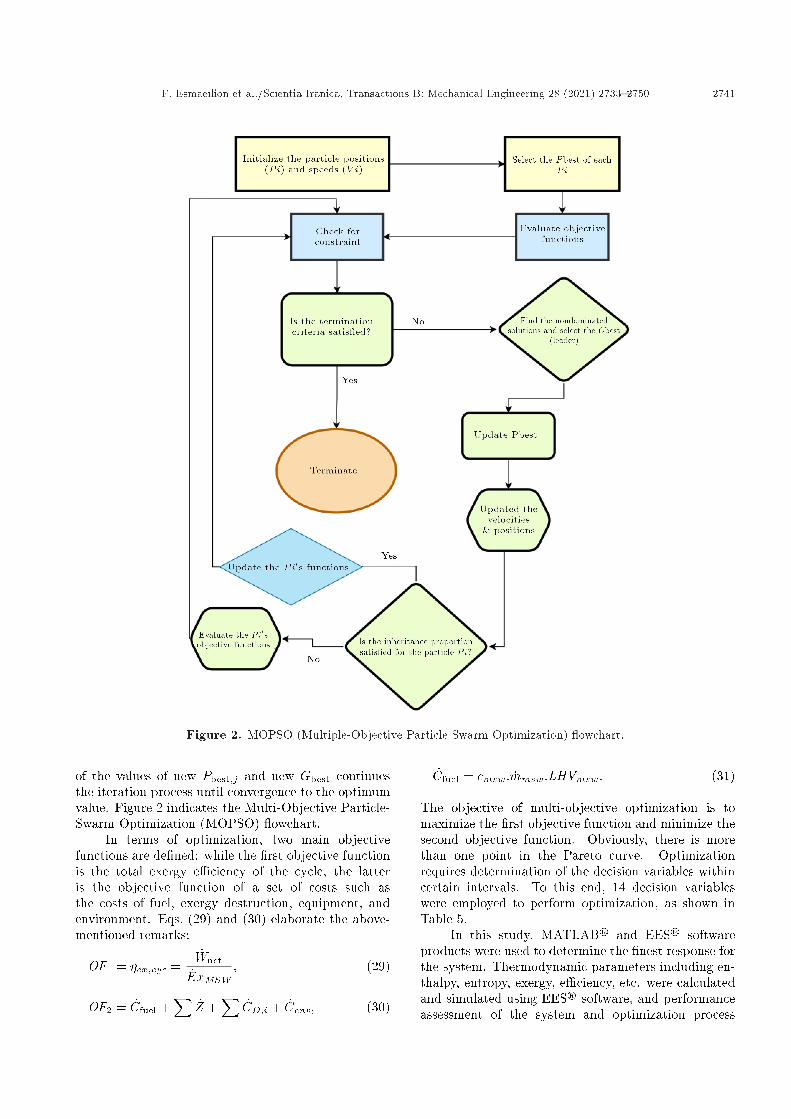
Clearly, by applying the working uid into thecomponents, some of its exergy would be destroyed.Determination of the extent of exergy destructionshares facilitates �nding the related proportion foreach one. Figure 3 presents the percentage of exergydestruction in each of the available components. In this�gure, the incinerator unit contributes the most ac-counting for 66%, while the least proportion belongedto pumps at 1%. In the meantime, other componentshave almost equal shares in this �eld.
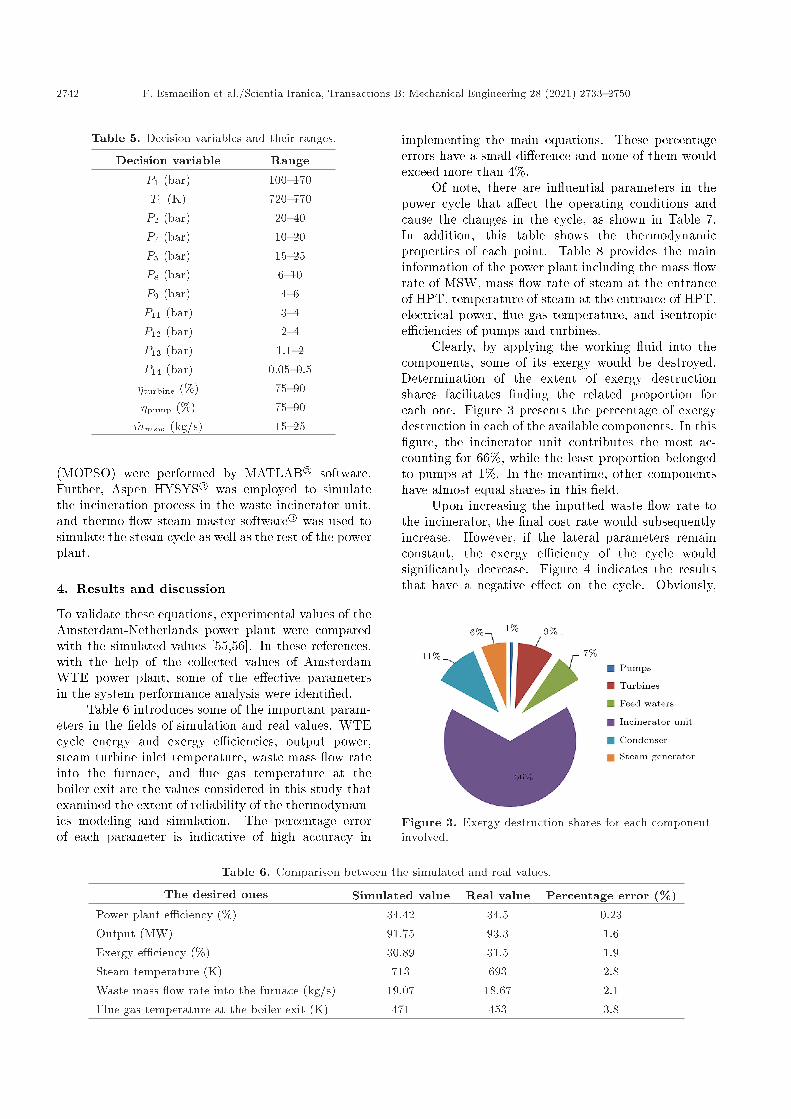
Upon increasing the inputted waste ow rate tothe incinerator, the �nal cost rate would subsequentlyincrease. However, if the lateral parameters remainconstant, the exergy e�ciency of the cycle wouldsigni�cantly decrease. Figure 4 indicates the resultsthat have a negative e�ect on the cycle. Obviously,
Figure 3. Exergy destruction shares for each componentinvolved.
Table 6. Comparison between the simulated and real values.
The desired ones Simulated value Real value Percentage error (%)Power plant e�ciency (%) 34.42 34.5 0.23Output (MW) 91.75 93.3 1.6Exergy e�ciency (%) 30.89 31.5 1.9Steam temperature (K) 713 693 2.8Waste mass ow rate into the furnace (kg/s) 19.07 18.67 2.1Flue gas temperature at the boiler exit (K) 471 453 3.8

F. Esmaeilion et al./Scientia Iranica, Transactions B: Mechanical Engineering 28 (2021) 2733{2750 2743
Table 7. Streams properties for each point of the considered waste-to-energy power plant.
Stateno.
Working uidTemperature
(K)Pressure
(bar)
Flowrate
(kg/s)
Entropy(kJ/kg.K)
Enthalpy(kJ/kg)
Physicalexergy(MW)
Chemicalexergy(MW)
1 Steam 713.00 130.00 90.20 6.20 3164.0 118.78 43.24
2 Steam 513.50 26.50 90.20 6.32 2843.4 85.59 42.29
3 Steam 513.50 26.50 1.98 6.32 2843.4 1.92 0.95
4 Steam 713.00 25.00 88.22 7.14 3329.0 106.22 42.29
5 Steam 688.20 20.83 3.38 7.16 3280.0 3.88 1.62
6 Steam 606.10 133.90 0.23 3.59 1547.4 0.11 0.11
7 Steam 633.80 13.66 3.88 7.19 3174.0 4.00 1.86
8 Steam 563.80 7.52 3.76 7.23 3039.0 3.31 1.80
9 Steam 497.40 4.00 0.92 7.27 2911.2 0.68 0.44
10 Steam 497.40 4.00 76.29 7.27 2911.2 56.73 36.57
11 Steam 479.40 3.33 1.40 7.29 2876.9 0.99 0.67
12 Steam 451.60 2.48 1.90 7.31 2824.0 1.23 0.91
13 Steam 411.70 1.57 7.15 7.34 2748.6 4.03 3.43
14 Steam 311.74 0.13 65.85 0.55 2349.1 1.75 31.57
15 Steam 324.00 0.13 66.08 0.55 2341.3 1.56 31.68
16 Water 323.90 0.43 66.08 0.72 213.4 0.30 0.17
17 Water 324.16 12.69 66.08 0.72 215.2 0.38 0.17
18 Water 383.00 12.13 66.08 1.42 462.0 2.93 0.17
19 Water 383.40 12.13 77.44 1.42 463.9 3.45 0.19
20 Water 397.40 11.15 77.44 1.57 523.0 4.53 0.19
21 Water 407.40 10.26 77.44 1.68 565.5 5.38 0.19
22 Water 413.80 9.77 77.44 1.75 593.1 5.96 0.19
23 Water 440.90 7.52 90.43 2.02 709.8 10.12 0.23
24 Water 443.00 136.00 90.43 2.03 726.4 11.51 0.23
25 Water 468.50 135.40 90.43 2.27 837.5 14.97 0.23
26 Water 489.30 134.80 90.43 2.46 930.1 18.13 0.23
27 Water 498.40 134.50 90.43 2.55 971.5 19.62 0.23
28 Water 385.80 1.57 11.36 1.45 473.0 0.51 0.03
29 Water 386.00 12.13 11.36 1.45 474.4 0.52 0.03
30 Water 388.40 2.48 4.21 1.48 484.3 0.20 0.01
31 Water 402.40 3.33 2.31 1.63 543.7 0.15 0.01
32 Water 412.40 4.41 0.92 1.73 586.5 0.07 0.00
33 Water 448.00 13.66 9.23 2.09 741.5 1.13 0.02
34 Water 473.50 20.83 5.35 2.33 854.7 0.88 0.01
35 Water 494.30 26.50 1.98 2.53 949.6 0.40 0.00
36 Cooling water 295.00 2.05 1294.70 0.32 92.4 0.08 3.23
37 Water 321.00 1.61 1294.70 0.68 206.2 4.58 3.23
38 Air 580.20 1.02 140.20 5.70 301.4 53.39 0.00
39 MSW 298.00 1.01 19.07 1.19 | 0.00 297.07
40 Combustion product 1057.00 | 256.90 235.70 4109.0 199.70 21.62
41 Bottom ash 1068.00 | 0.47 | | 0.00 195.20
2744 F. Esmaeilion et al./Scientia Iranica, Transactions B: Mechanical Engineering 28 (2021) 2733{2750
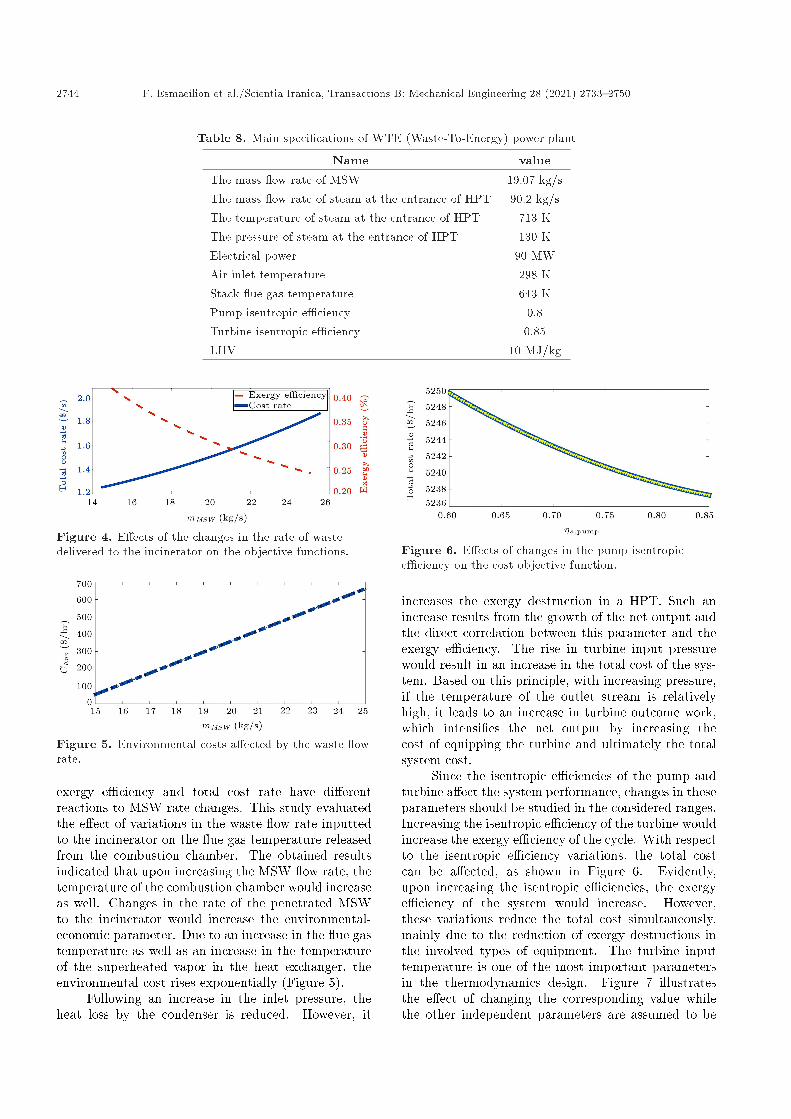
Table 8. Main speci�cations of WTE (Waste-To-Energy) power plant
Name value
The mass ow rate of MSW 19.07 kg/sThe mass ow rate of steam at the entrance of HPT 90.2 kg/sThe temperature of steam at the entrance of HPT 713 KThe pressure of steam at the entrance of HPT 130 KElectrical power 90 MWAir inlet temperature 298 KStack ue gas temperature 643 KPump isentropic e�ciency 0.8Turbine isentropic e�ciency 0.85LHV 10 MJ/kg
Figure 4. E�ects of the changes in the rate of wastedelivered to the incinerator on the objective functions.
Figure 5. Environmental costs a�ected by the waste owrate.
exergy e�ciency and total cost rate have di�erentreactions to MSW rate changes. This study evaluatedthe e�ect of variations in the waste ow rate inputtedto the incinerator on the ue gas temperature releasedfrom the combustion chamber. The obtained resultsindicated that upon increasing the MSW ow rate, thetemperature of the combustion chamber would increaseas well. Changes in the rate of the penetrated MSWto the incinerator would increase the environmental-economic parameter. Due to an increase in the ue gastemperature as well as an increase in the temperatureof the superheated vapor in the heat exchanger, theenvironmental cost rises exponentially (Figure 5).
Following an increase in the inlet pressure, theheat loss by the condenser is reduced. However, it
Figure 6. E�ects of changes in the pump isentropice�ciency on the cost objective function.
increases the exergy destruction in a HPT. Such anincrease results from the growth of the net output andthe direct correlation between this parameter and theexergy e�ciency. The rise in turbine input pressurewould result in an increase in the total cost of the sys-tem. Based on this principle, with increasing pressure,if the temperature of the outlet stream is relativelyhigh, it leads to an increase in turbine outcome work,which intensi�es the net output by increasing thecost of equipping the turbine and ultimately the totalsystem cost.
Since the isentropic e�ciencies of the pump andturbine a�ect the system performance, changes in theseparameters should be studied in the considered ranges.Increasing the isentropic e�ciency of the turbine wouldincrease the exergy e�ciency of the cycle. With respectto the isentropic e�ciency variations, the total costcan be a�ected, as shown in Figure 6. Evidently,upon increasing the isentropic e�ciencies, the exergye�ciency of the system would increase. However,these variations reduce the total cost simultaneously,mainly due to the reduction of exergy destructions inthe involved types of equipment. The turbine inputtemperature is one of the most important parametersin the thermodynamics design. Figure 7 illustratesthe e�ect of changing the corresponding value whilethe other independent parameters are assumed to be

F. Esmaeilion et al./Scientia Iranica, Transactions B: Mechanical Engineering 28 (2021) 2733{2750 2745
Figure 7. The environmental cost changes due tovariations in turbine input temperature.
Figure 8. E�ects of turbine input pressure changes onthe environmental cost.
Figure 9. E�ects of changes in the exergy unit cost offuel on the exergy unit cost of output power.
constant. Upon increasing the inlet pressure up tothe HPI, the cost of the environmental impact wouldconsequently decrease, as depicted in Figure 8. Thesechanges are in line with those obtained by Ahmadiet al. [53] and they are justi�able through the exer-goenvironmental relations (Eq. (24)). Increasing thecondenser pressure decreases the exergy e�ciency ofthe cycle. The existing behavior complies with theresults of the study conducted by Kaviri et al. [57].In addition, increasing the condenser pressure up to0.14 bar decreases exergy e�ciency (30.94%). Figure 9shows the e�ect of changes in the exergy unit cost offuel on the exergy unit cost of output power. It isconspicuous that growing the unit cost of fuel increasesthe unit cost of the produced power.
The exergy unit cost for providing MSW in the
Figure 10. Pareto frontier for the total cost rate andexergy e�ciency and the best �t for a relation to theobjective functions.
plant is about 2 USD/GJ. Therefore, with a certainchange in the cost of unit MSW, the direct e�ect on thecost of the exergy unit can be observed. The reason forsuch behavior is that the exergy unit cost of productionhas a direct relationship with the exergy unit costof MSW, which is established by the exergoeconomicequations of steam and combustion products. The solidwaste exergy unit cost is e�ective in the bottom ashexergy unit cost. As it is known, with the increase ofthis amount, the exergy unit cost of ash is a�ected andit would increase. To justify the behavior of the exergyunit cost of bottom ash as compared to the exergyunit cost of MSW, it is thought that by writing theexergoeconomic equations for the WIU, the increasein input values leads to an increase in the relativevalue of the output state. With increase in the inlettemperature of the pump, the net output power isreduced due to an increase in the temperature whilekeeping other parameters constant, thus increasing theenthalpy of the turbine output. By writing the bal-anced energy equation for the corresponding turbine,the result points to a reduction in the power output ofthe turbine [58].
In order to optimize the parameters related tothe optimization method of the PSO algorithm, themaximum number of iterations, population (particles),inertia weight, individual learning factor, social (to-tal) learning coe�cient, and inertia adjustment ratioare 350, 20, 1, 2, 2, and 0.99, respectively. Fig-ure 10 presents the application of these conditions tooptimizing the cycle parameter, the graph of the exergye�ciency, and the total cost rate. Change in exergye�ciency varies from 30.1% to 40.8%, and the range ofchanges in the total cost rate is around 100 USD perhour. It is important to note that in the multi-objectiveoptimization and the Pareto method, each point canbe the optimal point. Choosing the optimal solutionis related to the priority and criterion of the decisionvariables based on the objective functions. The TOP-SIS decision-making method is employed to determinethe best point. Based on the de�nitions provided for

2746 F. Esmaeilion et al./Scientia Iranica, Transactions B: Mechanical Engineering 28 (2021) 2733{2750
the TOPSIS method, this process functions based onthe ideal point (the highest e�ciency with the lowestcost) and the worst point (the lowest e�ciency withthe highest cost). In this way, the target point musthave the longest distance from the worst point andthe smallest distance to the best point. Finally, it iscalculated through the relation of the point with themaximum value of the TOPSIS method (Eq. (31)).
TOPSIS =�W
�W ��B; (32)
where �W is the maximum distance between theworst point and the considered point and �B is theminimum distance of the best point to the point underconsideration. By implementing the TOPSIS strategyto the Pareto frontier, the best point is demonstrated.Figure 11 shows the Pareto frontier with the best,worst, and determined points. It is obvious thatthe determined point (number 2) has the maximumdistance from the worst point and minimum distancefrom the best point.
The results obtained from the optimizationprocedure revealed striking di�erences between pre-optimization and after-optimization. In this case, bycomparing exergy destructions among various compo-nents, the positive impacts of optimization on reducingnegative parameters have been investigated. Accordingto Figure 12, the cumulative exergy destruction resultsindicate a signi�cant reduction in exergy destructionin each component. As is evident, a reduction in thequantity of exergy destruction for pumps is signi�cantly
Figure 11. Pareto frontier with the declaration of thebest point, the worst point, and the determined point.
Figure 12. Comparison between optimized and simulatedmodels in terms of exergy destruction.
high and is remarkably similar to turbines' results.However, exergy destruction in the incinerator under-goes a slight fall due to the optimization process. Byimplementing the newly calculated design parametersin thermodynamics and exergy equations, system per-formance behaves optimally. Then, exergy e�ciency ofeach component is computed and compared with themodeled values. Figure 13 demonstrates the valuesof the exergy e�ciency of the cycle for each of theequipment and makes a comparison between pre- andpost-optimization of the design parameters.
According to the provided �gure, most of thecomponents undergo a marginal increase in exergye�ciency. In this case, exergy e�ciency values forHPT, IPT, LPT, SG (Steam Generator), incinerator,and deaerator raised from 88.77%, 92.29%, 67.04%,95.65%, 44.2%, and 83.25% to 93.39%, 97.08%, 71.42%,97.35%, 47.73%, and 85.79%, respectively, while othercomponents have the same behaviors, relatively.
5. Conclusion
The waste-to-energy power plants have signi�cantimpacts on human societies and these systems arecharacterized by ine�ectiveness. Energy, exergy, eco-nomic and environmental analyses can be used todemonstrate these ine�ciencies. Furthermore, theapplication of Multi-Objective Particle-Swarm Opti-mization (MOPSO) can de�ne an optimum conditionto improve the system operation. This study carriedout exergoeconomic and exergoenvironmental analyses,as well as 3E optimization of the waste-to-energy powerplant. Based on the �ndings, the main conclusions areachieved as follows:
� The exergy, exergoeconomic, and exergoenviron-mental analyses were performed on the Amsterdamwaste from the energy power plant. Due to thehigh irreversibility of the combustion process at hightemperatures and heat transfer, results indicateda high share of exergy destruction for the wasteincineration unit. Moreover, the waste incinerationunit has the highest share of exergy destruction costamong all the existing components;
� Multiple-objective optimization with the help ofparticle swarm algorithm provided the optimumpoint for system performance. In this �eld, byconsidering the three objective functions and 14decision variables, the optimization process wasperformed. In this study, MATLAB and EESsoftware products were used to determine the bestresponse for the system;
� The exergy destruction associated with each of thecomponents was investigated. Optimization resultspointed to the attenuation of the total exergy de-struction. The alleviation of environmental impacts

F. Esmaeilion et al./Scientia Iranica, Transactions B: Mechanical Engineering 28 (2021) 2733{2750 2747
Figure 13. Values of the exergy e�ciency of the cycle for each equipment and the comparison between pre- andpost-optimizations of the design parameters.
can be achieved by reducing the waste ow rate inthe furnace and consuming less fuel;
� By using the TOPSIS method, the best operationalpoint for power plant concerning exergy e�ciencyand economic parameters was obtained. The de-termined point has speci�c properties that reduceexergy destruction and raise exergy e�ciency in eachcomponent;
� The results of exergy analysis indicated that theincinerator unit had exergy destruction estimatedat about 66% of the total. However, the pumpscontributed the least in this term (around 1% of thetotal amount);
� The optimization results displayed that the exergye�ciency of the power plant was 38.931% and thetotal cost including the environmental costs was5188.046 USD/hr;
� Investigating the behaviors of design parameters inobjective functions revealed a good insight into theire�ects on the optimization procedure. As presentedearlier, increase in the feedstock rate and turbineinlet temperature would increase the environmentalcosts, accordingly;
� Upon making a comparison between the obtainedresults from the optimization procedure, the intro-duction of optimum working conditions increasedexergy e�ciency and reduced exergy destruction forcomponents. The optimization results illustratedthat the exergy e�ciency of the power plant rosefrom 30.89% to 38.9%.
Nomenclature
Cp Speci�c heat at constant pressure(kJ/kg.K)
CD Cost of exergy destruction (USD/h)cf Cost of fuel per unit of energy
(USD/MJ)ex Speci�c exergy (kJ/kg)_Ex Exergy ow rate (kW)ExD Exergy destruction rate (kW)
h Speci�c enthalpy (J/kg)i InterestLHV Lower Heating Value (kJ/kg)HHV Higher Heating Value (kJ/kg)_m Mass ow rate (kg/s)P Pressure (bar)PEC Purchase Equipment Cost (USD)Q Heat (kJ)R Gas constant (kJ/kg K)s Speci�c entropy (kJ/kg K)T Temperature (�C or K)_W Work rate (kW)x Molar fraction_Z Capital cost rate (USD/h)
Greek symbols
� Emission factor (mg/kWh)� E�ciency� Chemical exergy/energy ratio� Maintenance factor Exergy e�ciency� Quality factor or exergy coe�cient
Subscripts and superscripts
ch ChemicalCond CondenserD Destructione Exit conditionF Fuelfwh Feedwater heaterHPT High-Pressure Turbinei Inlet conditionk ComponentL Lossph PhysicalTot Totalv Velocity

2748 F. Esmaeilion et al./Scientia Iranica, Transactions B: Mechanical Engineering 28 (2021) 2733{2750
References
1. Branchini, L., Waste-to-Energy: Advanced Cycles andNew Design Concepts for E�cient Power Plants,Springer (2015).
2. Behzadi, A., Gholamian, E., Houshfar, E., Ashjaee,M., and Habibollahzade, A. \Thermoeconomic anal-ysis of a hybrid PVT solar system integrated withdouble e�ect absorption chiller for cooling/hydrogenproduction", Energy Equipment and Systems, 6(4), pp.413{427 (2018).
3. Esmaeilion, F. \Hybrid renewable energy systems fordesalination", Applied Water Science, 10(3), p. 84(2020). DOI: 10.1007/s13201-020-1168-5
4. Buekens, A., Incineration Technologies, Springer(2013).
5. Esmaeilion, F., Ahmadi, A., Esmaeilion, A., andEhyaei, M.A. \The performance analysis and monitor-ing of grid-connected photovoltaic power plant", Cur-rent Chinese Computer Science. 1, p. 1 (2020). DOI:https://doi.org/10.2174/2665997201999200511083228
6. Ahmadi, A. \Experimental study of a new ow con-ditioner on disturbed ow in ori�ce plate metering",Journal of Fluids Engineering, 131(5), pp. 1{131(2009).
7. Esmaeilion, F., Waste to Energy Power Plants, Schol-ars' Press, pp. 1{46 (2019).
8. Chandler, A.J., Eighmy, T.T., Hjelmar, O., et al., Mu-nicipal Solid Waste Incinerator Residues, 67, Elsevier,pp. 1309{1310 (1997).
9. Ahmadi, A., Esmaeilion, F., Esmaeilion, A., Ehyaei,M.A., and Silveira, J.L. \Bene�ts and limitationsof waste-to-energy conversion in Iran", RenewableEnergy Research and Application (Aug. 2019). DOI:10.22044/rera.2019.8666.1007
10. Bianchi, M., Branchini, L., De Pascale, A., Falchetti,M., and Fiore, P. \Advanced waste-to-energy steamcycles", Energy Procedia, 45(0), pp. 1205{1214 (2014).
11. Ehyaei, M.A., Ahmadi, A., and Rosen, M.A. \Energy,exergy, economic and advanced and extended exergyanalyses of a wind turbine", Energy Conversion andManagement, 183, pp. 369{381 (2019).
12. Ehyaei, M.A., Ahmadi, A., Assad, M.E.H., Hachicha,A.A., and Said, Z. \Energy, exergy and economicanalyses for the selection of working uid and metaloxide nano uids in a parabolic trough collector", SolarEnergy, 187, pp. 175{184 (2019).
13. Al-Sulaiman, F. \Thermodynamic modeling and ther-moeconomic optimization of integrated trigeneration
plants using organic Rankine cycles", Energy Conver-sion and Management, Elsevier BV, 69(12), pp. 209{216 (2010).
14. Habibollahzade, A., Gholamian, E., Ahmadi, P., andBehzadi, A. \Multi-criteria optimization of an inte-grated energy system with thermoelectric generator,parabolic trough solar collector and electrolysis forhydrogen production", International Journal of Hydro-gen Energy, 43(31), pp. 14140{14157 (2018).
15. Makkeh, S.A., Ahmadi, A., Esmaeilion, F., andEhyaei, M.A. \Energy, exergy and exergoeconomicoptimization of a cogeneration system integrated withparabolic trough collector-wind turbine with desalina-tion", Journal of Cleaner Production, 273, pp. 123122{123150 (2020) (JCLP 123122).
16. Ahmadi, A., Ehyaei, M.A., Jamali, D.H., Despotovic,M., Esmaeilion, A.F., and Hani, E.B. \Energy, exergy,and economic analyses of integration of heliostat solarreceiver to gas and air bottom cycles", Journal ofCleaner Production, 273, pp. 123122{123148 (2020).
17. Gargari, S.G., Rahimi, M., and Ghaebi, H. \En-ergy, exergy, economic and environmental analysis andoptimization of a novel biogas-based multigenerationsystem based on gas turbine-modular helium reactorcycle", Energy Conversion and Management, 185, pp.816{835 (2019).
18. Alrobaian, A.A. \Improving waste incineration CHPplant e�ciency by waste heat recovery for feedwaterpreheating process: energy, exergy, and economic(3E) analysis", Journal of the Brazilian Society ofMechanical Sciences and Engineering, 42(8), pp. 1{14(2020).
19. Fujii, M., Dou, Y., Sun, L., et al. \Contribution toa low-carbon society from improving exergy of waste-to-energy system by upgrading utilization of waste",Resources, Conservation and Recycling, 149, pp. 586{594 (2019).
20. Houshfar, E. \Thermodynamic analysis and multi-criteria optimization of a waste-to-energy plant inte-grated with thermoelectric generator", Energy Conver-sion and Management, 205, p. 112207 (2020).
21. Carneiro, M.L.N.M. and Gomes, M.S.P. \Energy, ex-ergy, environmental and economic analysis of hybridwaste-to-energy plants", Energy Conversion and Man-agement, 179, pp. 397{417 (2019).
22. Zhang, Y., Ji, G., Ma, D., et al. \Exergy and energyanalysis of pyrolysis of plastic wastes in rotary kilnwith heat carrier", Process Safety and EnvironmentalProtection, 142, pp. 203{211 (2020).
23. Yatsunthea, T. and Chaiyat, N. \A very small powerplant-municipal waste of the organic rankine cycleand incinerator from medical and municipal wastes",Thermal Science and Engineering Progress, 18(3), p.100555 (2020).
24. Chen, H., Zhang, M., Wu, Y., Xu, G., Liu, W.,and Liu, T. \Design and performance evaluation of anew waste incineration power system integrated with

F. Esmaeilion et al./Scientia Iranica, Transactions B: Mechanical Engineering 28 (2021) 2733{2750 2749
a supercritical CO2 power cycle and a coal-�red powerplant", Energy Conversion and Management, 210, p.112715 (2020).
25. Ehyaei, M.A., Ahmadi, A., Assad, M.E.H., andSalameh, T. \Optimization of parabolic through col-lector (PTC) with multi objective swarm optimization(MOPSO) and energy, exergy and economic analyses",Journal of Cleaner Production, Elsevier BV, 234(4),pp. 285{296 (2019).
26. Shaygan, M., Ehyaei, M.A., Ahmadi, A., Assad,M.E.H., and Silveira, J.L. \Energy, exergy, advancedexergy and economic analyses of hybrid polymer elec-trolyte membrane (PEM) fuel cell and photovoltaiccells to produce hydrogen and electricity", Journal ofCleaner Production, 234, pp. 1082{1093 (2019).
27. Ehyaei, M.A., Ahmadi, A., Assad. M.E.H, and Rosen,M.A. \Investigation of an integrated system combiningan organic rankine cycle and absorption chiller drivenby geothermal energy: Energy, exergy, and economicanalyses and optimization", Journal of Cleaner Pro-duction, Elsevier BV, 258(5), p. 120780 (2020).
28. Nabi, M.N., Rasul, M.G., Anwar, M., and Mullins,B.J. \Energy, exergy, performance, emission and com-bustion characteristics of diesel engine using new seriesof non-edible biodiesels", Renewable Energy, 140, pp.647{657 (2019).
29. Ahmadi, A., Jamali, D.H., Ehyaei, M.A., and Assad,M.E.H. \Energy, exergy, economic and exergoenvi-ronmental analyses of gas and air bottoming cyclesfor production of electricity and hydrogen with gasreformer", Journal of Cleaner Production, ElsevierBV, 259(6), 120915 (2020).
30. Shamoushaki, M., Ghanatir, F., Ehyaei, M.A., andAhmadi, A. \Exergy and exergoeconomic analysisand multi-objective optimisation of gas turbine powerplant by evolutionary algorithms", Case study: AliabadKatoul Power Plant. International Journal of Exergy,22(3), pp. 279{307 (2017).
31. Mondal, P. and Ghosh, S. \Externally �red biomassgasi�cation-based combined cycle plant: exergo-economic analysis", International Journal of Exergy,20(4), pp. 496{516 (2016).
32. Jack, T.A. and Oko, C.O.C. \Exergy and exer-goeconomic analysis of a municipal waste-to-energysteam reheat power plant for Port Harcourt city",International Journal of Ambient Energy, InformaUK Limited, 39(4), pp. 352{359 (2017). DOI:10.1080/01430750.2017.1305447
33. Jurczyk, L. and Koc-Jurczyk, J. \Thermal conversionof municipal waste into energy: Prospects for the sub-carpathia", Journal of Ecological Engineering, 18(2),pp. 157{165 (2017).
34. Fern�andez-gonz�alez, J.M., Grindlay, A.L., Serrano-bernardo, F., Rodr��guez-rojas, M.I., and Zamorano,M. \Economic and environmental review of waste-to-energy systems for municipal solid waste man-
agement in medium and small municipalities",Elsevier BV, 67(4), pp. 360{374 (2017). DOI:10.1016/j.wasman.2017.05.003
35. Kathirvale, S., Noor, M., Yunus, M., Sopian, K.,and Halim, A. \Energy potential from municipal solidwaste in Malaysia", 29, pp. 559{567 (2003). DOI:10.1016/j.renene.2003.09.003
36. Song, J., Yang, W., Li, Z., Higano, Y., and Wang, X.\Discovering the energy, economic and environmentalpotentials of urban wastes: An input-output model fora metropolis case", Energy Conversion and Manage-ment, 114, pp. 168{179 (2016).
37. Rocco, M.V. and Colombo, E. \Exergy life cycleassessment of a waste-to-energy plant", Energy Proce-dia, 104, pp. 562{567 (2016). DOI: 10.1016/j.egypro.2016.12.095
38. Azami, S., Taheri, M., Pourali, O., and Torabi, F.\Energy and exergy analyses of a mass-�red boiler for aproposed waste-to-energy power plant in Tehran", Ap-plied Thermal Engineering, 140, pp. 520{530 (2018).DOI: 10.1016/j.applthermaleng.2018.05.045
39. Ofodu, J.C. and Abam, D.P.S. \Exergy analysis ofAfam thermal power plant", NSE Technical Transac-tions, 37(3), pp. 14{28 (2002).
40. Esfandi, S., Baloochzadeh, S., Asayesh, M., et al.\Energy, exergy, economic, and exergoenvironmentalanalyses of a novel hybrid system to produce electricity,cooling, and syngas", Energies, 13(23), p. 6453 (2020).
41. Derakhshandeh, P., Ahmadi, A., and Dashti, R.\Simulation and technical-economic-environmental op-timization of the General Electric GE90 hydrogenturbofan engine", International Journal of HydrogenEnergy, Elsevier BV, 46(5), pp. 3303{3318 (2020).
42. Ehyaei, M.A., Baloochzadeh, S., Ahmadi, A., andAbanades, S. \Energy, exergy, economic, exergoenvi-ronmental, and environmental analyses of a multigen-eration system to produce electricity, cooling, potablewater, hydrogen and sodium-hypochlorite", Desalina-tion, Elsevier BV, 501(7), p. 114902 (2020).
43. Bejan, A. and Tsatsaronis, G., Thermal Design andOptimization, John Wiley & Sons (1996).
44. Tammemagi, H.Y., The Waste Crisis: Land�lls, In-cinerators, and the Search for a Sustainable Future,Oxford University Press (1999).
45. Song, G., Shen, L., and Xiao, J. \Estimating speci�cchemical exergy of biomass from basic analysis data",Industrial & Engineering Chemistry Research, 50(16),pp. 9758{9766 (2011).
46. Cooper, C.D., Kim, B., and MacDonald, J. \Estimat-ing the lower heating values of hazardous and solidwastes", Journal of the Air & Waste ManagementAssociation, 49(4), pp. 471{476 (1999).
47. Meraz, L., Oropeza, M., and Dominguez, A. \Pre-diction of the combustion enthalpy of municipal solidwaste", Chem Educator, 7(02), pp. 66{70 (2002).

2750 F. Esmaeilion et al./Scientia Iranica, Transactions B: Mechanical Engineering 28 (2021) 2733{2750
http:// www.springerlink.com/content/u5101w24k5676078/ fulltext.pdf (9. Nov 2010).
48. Hepbasli, A. \A key review on exergetic analysisand assessment of renewable energy resources fora sustainable future", Renewable and SustainableEnergy Reviews, 12(3), pp. 593{661 (2008). DOI:10.1016/j.rser.2006.10.001
49. Bejan, A., Tsatsaronis, G., and Moran, M.J., ThermalDesign and Optimization, John Wiley & Sons (1995).
50. Mignard, D. \Correlating the chemical engineeringplant cost index with macro-economic indicators",Chemical Engineering Research and Design, 92(2), pp.285{294 (2014).
51. Dincer, I., Rosen, M.A., and Ahmadi, P., Optimizationof Energy Systems, John Wiley & Sons (2017).
52. Penman, J. et al. \Good practice guidance and un-certainty management in national greenhouse gas in-ventories", IPCC National Greenhouse Gas InventoriesProgramme, 12(6), pp. 1{287 (2001).
53. Ahmadi, P., Dincer, I., and Rosen, M.A. \Exergy,exergoeconomic and environmental analyses and evo-lutionary algorithm based multi-objective optimizationof combined cycle power plants", Energy, 36(10), pp.5886{5898 (2011).
54. Rao, S.S. and Rao, S., Engineering Optimization:Theory and Practice, John Wiley & Sons, Inc., NewAge International Ltd., pp. 1{435 (2009).
55. Murer, M.J., et al. \High e�cient waste-to-energy inAmsterdam: Getting ready for the next steps", WasteManag. Res., 29(10), SUPPL., pp. 20{29 (2011).
56. Tabasov�a, A., Krop�a�c, J., Kermes, V., Nemet, A.,and Stehl��k, P. \Waste-to-energy technologies: Impact
on environment", Energy, 44(1), pp. 146{155 (2012).DOI: 10.1016/j.energy.2012.01.014
57. Kaviri, A.G., Jaafar, M.N.M., and Lazim, T.M. \Mod-eling and multi-objective exergy based optimizationof a combined cycle power plant using a geneticalgorithm", Energy Conversion and Management, 58,pp. 94{103 (2012).
58. Ahmadi, P. \Modeling, analysis and optimization ofintegrated energy systems for multigeneration pur-poses", (2013).
Biographies
Farbod Esmaeilion received his BSc and MSc degreesfrom the ArakUT and IUST, respectively. He has satis-factory experience in Mechanical Engineering and En-ergy with a passion and expertise in thermodynamics,renewable energies, HVAC, CCHP, and desalination.
Abolfazl Ahmadi has been an academic sta� memberat the Department of Energy Systems Engineering(School of Advanced Technologies (New Technologies),Iran University of Science and Technology) since 1992.He also obtained his PhD in Mechanical Engineeringfrom She�eld University in the UK. His researchinterests include energy systems optimization.
Reza Dashti is an academic sta� member at theDepartment of Energy Systems Engineering (Schoolof Advanced Technologies (New Technologies), IranUniversity of Science and Technology). His researchinterests include energy economics and electricalengineering.


