Exhaled nitric oxide as a marker of asthma control in
smoking patients _______________________________________
Alain Michils1, MD; Renaud Louis2, MD; Rudi Peché3, MD; Sandra Baldassarre1, MD; Alain Van Muylem1, PhD
1 Chest Department - CUB Erasme, Brussels, Belgium
2 Chest Department - CHU Sart-Tilmant, Liège, Belgium
3 Chest Department- CHU André Vésale, Montigny- le-Tilleul, Belgium
Address for correspondence and reprint requests:
Alain Van Muylem, PhD
Chest Department
CUB Erasme
808 Route de Lennik
1070 Brussels - Belgium
Phone: 32-2-555.39.85
Fax: 32-2-555.44.11
Email: [email protected]
Running head: Exhaled nitric oxide in smoking asthmatics
Key words: Exhaled nitric oxide, asthma control, tobacco smoking
Funding: AstraZeneca provided a grant for the exhaled biomarker laboratory
Word count: 2583
. Published on January 22, 2009 as doi: 10.1183/09031936.00154008ERJ Express
Copyright 2009 by the European Respiratory Society.
2
Abstract
Fractionated exhaled nitric oxide (FeNO) which is a reliable marker of eosinophilic airway
inflammation, is partially suppressed by tobacco smoking. Consequently, its potential as a
biomarker in asthma management has never been evaluated in smoking patients. In the
present study, we tested the validity of FeNO to predict asthma control in this population.
To do this, FeNO and the Asthma Control Questionnaire (ACQ) were recorded at least once
in 411 non-smoking (345 with at least two visits) and 59 smoking (51 with at least two visits)
asthma patients.
Despite similar mean ACQ scores (1.5 vs1.7-p>0.1) FeNO was reduced in smoking
asthmatics (18,1 ppb vs 33,7 ppb; p<0.001). A decrease in FeNO < 20% precludes asthma
control improvement in non-smoking (NPV 78%) and in smoking patients (NPV 72%). An
increase in FeNO <30% is unlikely to be associated with deterioration in asthma control in
both groups of patients (NPV= 86% and 84%).
It is concluded that, even in smokers, sequential changes in FeNO have a relationship to
asthma control. This is the first study indicating that cigarette smoking does not obviate the
clinical value of measuring FeNO in asthma among smokers.
3
INTRODUCTION
Although the debate is not over, it is generally accepted that fractionated exhaled nitric oxide
(FeNO) has the potential to be useful in the management of asthma [1-6]. However, several
factors confounding FeNO measurement have been recognized [7]. Among them, tobacco
smoking has been consistently shown to reduce FeNO levels [6,8-15], by a factor varying
from 0.63 to 0.80 according to the multivariate analyses that have compared FeNO in
smokers and in non smokers [6,14,15]. The mechanism by which smoking causes FeNO
reduction is not fully understood but may include reduction in NO synthesis due to feedback
inhibition induced by high concentrations of NO contained in cigarette smoke [9]. NO
oxidation or interaction with other molecules present in tobacco smoke might also occur [16].
However, regardless of the mechanism of FeNO reduction reported in smokers, it is generally
assumed that FeNO should not be assessed in asthmatic patients who smoke. Perhaps,
consequently, this population (approximately 25 % of adult asthma patients [17]) has been
excluded from clinical trials that have explored the potential of FeNO as a biomarker in
asthma management. Even in our own studies where we have recently shown that FeNO is a
reliable marker of asthma control over time in unselected patients, but once again, smoking
patients were not enrolled [18]. Interestingly, this study strongly suggested that it is the
change in FeNO values, rather than absolute cut-off points (i.e. individualized FeNO
profiles), which may be meaningful for the longitudinal assessment of asthma control in daily
practise. Therefore, in the present study, we investigated whether, despite the FeNO reduction
reported in smoking asthma patients [6,8-15], changes in FeNO might be significantly related
to changes in asthma control in this population as well.
To do this, FeNO was monitored on several occasions in smoking and non smoking patients
attending a tertiary asthma clinic. Its ability to reflect improvement or worsening of asthma
control over time was compared in both groups, using the Asthma Control Questionnaire
(ACQ) [19] as a gold standard for the assessment of asthma control
4
METHODS
Subjects
Between January 1, 2004 and July 30, 2008, 411 adult non smokers and 59 adult smokers
attending the Allergy and Asthma clinic in the Chest Department of Erasme University
Hospital for treatment of persistent asthma diagnosed according to standard criteria [20] were
enrolled in the study.
The study was approved by the local ethics committee and patients signed an informed
consent.
Study procedures and design
Study design
The study is a post hoc analysis of an existing database that is continuously updated. A
significant part of the current database was reported in our previous publication that
documented a relationship between asthma control and FeNO in non smoking asthma patients
[18]. In the present analysis, we focus on the question as whether current smoking annuls the
validity of FeNO measurements to predict asthma control. ACQ scores and FeNO were
recorded independently on one or more occasions for each patient, including smokers who
were excluded from the initial analysis for reasons mentioned earlier. At each visit, asthma
treatment was adjusted according to GINA guidelines recommendations [20], regardless of
ACQ score or FeNO value, which were recorded separately.
Since optimal asthma control appears more difficult to achieve in smoking patients [21], the
1.5 optimum cut-off point identifying poorly controlled asthma [22] was selected as the
reference ACQ score in the ROC curve analysis. For clarity’s sake, we considered that an
ACQ score < 1.5 identified asthma that is controlled (i.e. partly or well controlled) whereas an
ACQ score ≥ 1.5 identified uncontrolled asthma. Using the ROC curve analysis, we assessed
5
the ability of FeNO to: (i) reflect asthma control cross-sectionally using an ACQ threshold of
1.5 , (ii) detect a significant improvement or worsening of asthma control that resulted in a
change from uncontrolled (ACQ≥1.5) to controlled (ACQ< 1.5) asthma respectively or vice
versa and (iii) detect a significant improvement or worsening of asthma control defined as a
decrease or increase in ACQ of 0.5 or greater even though it was not large enough to result in
a change of the asthma control status
Patients treated with low (≤500 µg BDP eq.day-1) and high-to-moderate (>500 µg BDP
eq.day-1) ICS doses were considered separately. Indeed, in our previous study [18], we found
that the overall ability of FeNO to reflect asthma control was reduced in patients using high
ICS doses.
Study procedures
(a) Asthma Control Questionnaire (ACQ)
Asthma control was assessed using a French translation of the short version of the Asthma
Control Questionnaire (ACQ) from Juniper et al [23]. This version does not include FEV1
rating. Patients subjectively evaluate the degree of impairment caused by their asthma during
the preceding seven days by responding to six questions using a 7-point scale—a score of 0
indicates no impairment and a score of 6 indicates maximal impairment. The total ACQ score
is the mean of the six responses, varying therefore between 0 (totally controlled asthma) and
6 (totally uncontrolled asthma). A score of greater than 1.5 is used to identify poorly
controlled asthma [22]. A 0.5 change in the ACQ score is considered to be the minimum
change that is clinically relevant [22].
6
(b) Fractionated Exhaled nitric oxide (FeNO)
FeNO was measured before any forced expiratory manoeuvres using a daily calibrated LR
2000 chemo-luminescence analyser (Logan Research LTD, Rochester, UK) with on-line
measurement of a single exhalation at flow rate of 50ml/s (ATS/ERS standard) [24]. FeNO
levels were read at the plateau corresponding to 70-80% of the CO2 curve. Absolute FeNO
values are expressed in ppb, and changes in FeNO are expressed as a percentage of the initial
value (∆ %).
Statistical methods
ROC curve analysis was performed in the whole population as well as in different sub-groups:
patients treated by low and high-to-moderate doses. The area under the ROC curve (AUC)
was computed and its difference from 0.5 was statistically evaluated (MedCalc). For a given
type of assessment, the optimal cut-off value was determined for the whole population by
maximizing the Youden's index [25], i.e. the true positive rate (sensitivity) minus the false
positive rate (1-specificity) (see supplementary on-line material). Geometrically, this index is
the vertical distance between the ROC curve and the first bisector. The cut-off value
corresponding to the maximum value of Youden’s index was then used to derive sensitivity,
specificity, positive and negative predictive values, and accuracy in the whole population and
in the sub-groups of patients. In the supplementary on-line material, Se, Sp, PPV, NPV and
accuracy may be found for other cut-off values, as well as the amounts of true positive-, true
negative-, false positive- and false negative cases (contingency tables).
Unpaired t-tests were used when considering FEV1 and log-transformed FeNO values and
Mann-Whitney U tests when considering ICS doses and ACQ scores. Proportions were
compared using a χ2-test.
The limit of significance is 0.05.
8
RESULTS
Three hundred forty-five of 411 non-smoking patients and 51 of 59 smoking patients were
seen at least twice, representing 646 and 92 pairs of successive visits for non-smoking and
smoking patients, respectively (median time between two visits: non-smoking patients: 88
days, range 10 – 1255 days, inter-quartile interval 42 -189; smoking patients: 93 days, range 7
- 525 days, inter-quartile interval 49 -182). Table 1 presents, in the non-smoking and in the
smoking group, demographic data as well as FeNO, FEV1, ACQ score and ICS dose values
at study onset for the total studied population (included in the cross-sectional analysis) and in
the sub-group of patients who were seen at least twice (included in the longitudinal analysis).
Tables 2-5 display the cut-off values (resulting from Youden's index maximisation), the
number of positive and total cases, and therefore the prevalence, the sensitivity (Se), the
specificity (Sp), the positive (PPV) and negative (NPV) predictive values, the accuracy and
the p value allowing to reject (or not) the null hypothesis AUC=0.5.
Cross-sectional assessment of asthma control
Asthma control was cross-sectionally assessed at study onset for 411 non-smoking and 59
smoking asthma patients. Controlled asthma (ACQ score < 1.5) was considered as a positive
event. Table 2 shows that, in smoking asthma patients, FeNO is unable to cross-sectionally
assess asthma control.
Assessment of change in asthma control between pairs of visits
Change from uncontrolled (ACQ score ≥ 1.5) to controlled (ACQ score < 1.5) asthma
In non-smoking and smoking patients, asthma was uncontrolled at visit 1 in 283 pairs (out of
646) and 52 pairs (out of 92), respectively. A change to controlled asthma (spontaneous as
9
well as treatment induced) at visit 2 is considered as a positive event. This was observed in
133 and 17 occasions, in non-smoking and smoking patients, respectively.
Table 3 shows that FeNO exhibits high operating characteristics in both non-smoking and
smoking groups. The cut-off values for decrease in FeNO which had the highest negative
predictive values for establishing control were 30% in non-smokers and 20% in smokers.
Change from controlled (ACQ score < 1.5) to uncontrolled (ACQ score ≥ 1.5) asthma
In non-smoking and smoking patients, asthma was controlled at visit 1 in 360 pairs (out of
643) and 40 pairs (out of 92), respectively. A change to uncontrolled asthma at visit 2 is
considered as a positive event. This was observed on 65 and 10 occasions, in non-smoking
and smoking patients, respectively.
Table 4 shows that FeNO exhibits high operating characteristics in both non-smoking and
smoking groups. The cut-off values for increase in FeNO which had the highest negative
predictive values for a change to uncontrolled asthma control was 50% in both non-smokers
smokers.
Improvement of asthma control (∆ACQ < -0.5)
A significant improvement of asthma control between two consecutive visits is considered as
a positive event. As a whole, this occurred in 257 and 40 occasions, in non-smoking and
smoking patients, respectively.
Table 5 shows that, in the entire population, FeNO exhibited similar operating characteristics
in non-smoking and smoking patients. Figure 1 illustrates this feature.
When considering the sub-group of smoking patients treated with more than 500 µg
eq.BDP.day-1, FeNO is no longer significant in assessing an improvement of asthma control.
10
Worsening of asthma control (∆ACQ > 0.5)
A significant worsening of asthma control between two consecutive visits is considered as a
positive event. As a whole, this occurred in 161 and in 26 occasions, for non-smoking and
smoking patients, respectively.
Table 6 shows that, as for improvement assessment, FeNO exhibited analogous operating
characteristics in non-smoking and smoking patients. With a cut-off value at 30% change, a
high negative predictive value is observed in both groups.
When considering the sub-group of smoking patients treated with more than 500 µg
eq.BDP.day-1, FeNO operating characteristics in assessing asthma control worsening is less
significant.
In both improvement (Table 5) and worsening (Table 6) assessment of asthma control, we
considered a sub-group of pairs of visits with an initial ACQ score <2 as well as a sub-group
of pairs of visits without ICS dose modification. Overall, FeNO characteristics are only
mildly affected compared to the total group.
11
DISCUSSION
The present study confirms that, compared to non-smokers, FeNO is reduced in smoking
asthma patients. However, this reduction does not appear to suppress its ability to reflect
asthma control in smoking patients, as long as changes in FeNO values detected by repeated
measurements are considered.
FeNO is a reliable marker of eosinophilic airway inflammation [26] that has the potential to
be useful in the management of asthma [1-5]. However, tobacco smoking, which affects
±25% of the asthma population [17], leads to a decrease in FeNO [6,8-15] and is considered
as a confounding factor. Therefore, it is generally assumed that FeNO should not be assessed
in asthmatic patients who smoke.
At first glance, our results seem to support this common paradigm. FeNO levels were in fact
substantially reduced in smoking as compared to non-smoking asthma patients and to an
extent that is similar to that found in previous studies [6,14,15]. Furthermore, whereas a single
FeNO value was confirmed to be significantly related to asthma control in the non-smoking
population (i.e. FeNO level > 50ppb indicates uncontrolled asthma in most cases) [18], such a
relation could not be found in the smoking population.
However, in our own previous study [18] which involved non-smoking patients, we showed
sequential FeNO assessments to be more useful than isolated measurements in demonstrating
asthma control. In our current study, we found this to also hold true for smoking asthma
patients. Indeed, repeated FeNO measurements do appear helpful with regard to indicating
change in asthma control over time in both populations. Thus, when asthma is uncontrolled in
non-smoking patients, a FeNO reduction by at least 30% would predict that asthma is
controlled in two out of three cases. The degree of change in FeNO one should be concerned
with for smoking patients is different: a FeNO reduction < 20% would indicate that asthma
remains uncontrolled in most cases. Conversely, when asthma is controlled, a FeNO increase
<50% would indicate that asthma remains controlled in either population.
The aim of asthma treatment is to achieve full asthma control (ACQ< 0.75). In smoking
patients, however, optimal control is usually more difficult to achieve [21,27,28], most likely
due to the reduction in anti-asthma drugs effectiveness that was recently documented in this
12
population [27,28]. The present study confirms this: well-controlled asthma (ACQ score<
0.75) was achieved in only 15 % of smoking patients compared to 33% in non-smokers
(p<0.001-data not shown). Treatment adjustments resulted in asthma that could no longer be
considered poorly controlled in as much as 33% of smoking patients (data not shown). For
this reason, we felt an ACQ cut-off score of 1.5 (which identifies poorly controlled asthma),
to be more appropriate for the present data analysis, and selected it for the current study.
Since this level of control was achieved in only 33% of our patients, we also considered the
ability of FeNO to detect any significant improvement in asthma control [22]. In this respect,
repeated FeNO assessments appear again helpful in both populations: a FeNO reduction
<20% indicates in most cases that no significant improvement in asthma control has occurred.
Conversely, FeNO increases <30% are helpful to rule out mild deteriorations of asthma
control. The results may be summarized as: if FeNO does not change as indicated, the level of
asthma control is not modified. This seems to remain true whether the initial ACQ score is
high or low and whether ICS dose was modified or not.
Interestingly, when patients were treated with high-to-medium ICS doses, FeNO no longer
had the ability to reflect an improvement in asthma control for smoking patients, whereas for
non-smoking patients its ability was only slightly reduced. A similar trend is observed with
respect to asthma control deteriorations. These results confirm the overall reduction of FeNO
ability to reflect asthma control in patients treated with high-to-medium ICS doses that we
documented in our previous study [18]. In addition, it appears that confounding factors such
as high ICS doses [29,30] and tobacco smoking [6,8-15] which are known to reduce FeNO
would have a cumulative interfering effect that may eventually suppress FeNO ability to
reflect asthma control. This suggests that the effect of these confounding factors might have
to be taken into account when using FeNO to assess asthma control. This needs to be clarified
by appropriately designed studies.
In conclusion, this is the first study indicating that cigarette smoking does not obviate the
clinical value of measuring FeNO in asthma. Indeed, it is shown that even in smokers,
13
sequential changes in FeNO have a relationship to asthma control. The results also suggest
that factors such as smoking and ICS dose act cumulatively to influence the ability of FeNO
to be used to assess asthma control. Overall, the importance of sequential FeNO
measurements in smokers or non-smokers is to distinguish whether or not ongoing or a
change in respiratory symptoms is due to changes in airway inflammation - possibly requiring
a change in anti-inflammatory therapy. Our data provide evidence which enables the
magnitude of changes in FeNO to be more accurately interpreted when addressing this
important question
14
Table 1: Demographic data and indices values at study onset
Total Patients seen at least twice
Non-smokers Smokers p& Non-smokers Smokers p&
N 411 59 345 51
Age§ 41 ± 16 38 ± 11 0.39 41 ± 16 39 ± 11 0.47
M/F 195/216 34/25 0.14 219/126 26/25 0.08
Non-atopic/Atopic 61/350 5/54 0.19 43/302 4/47 0.34
ACQ score* 1.5 [0-5.0]
1.7 [0-5.3] 0.34 1.7
[0-5.3] 1.9
[0-5.3] 0.34
ICS dose*$ 250 [0 – 2000]
500 [0 – 2000] 0.50 250
[0 – 2000] 500
[0 – 2000] 0.37
FeNO (ppb)# 33.7 [14.3 – 79.2]
18.1 [6.9 – 47.5] <0.001 34.8
[14.6 – 83.0]18.5
[6.1 – 55.5] <0.001
FEV1 (%pred)§ 85.6 ± 15.7 86.2 ± 17.9 0.80 85.0 ± 20.6 86.5 ± 18.0 0.79
Data are presented as: #: geometrical mean [geometrical interval] § : mean±SD; * median [range]; $ : ICS dose in µg equ BDP.day-1; & : comparison between non-smoking and smoking group. N is the number of patients in each group. Except for FeNO, non-smoking and smoking groups are statistically similar.
15
Table 2: Cross-sectional assessment of asthma control.
N n+ P
(%)
Cut-off
(ppb)
Se
(%)
Sp
(%)
PPV
(%)
NPV
(%)
Acc
(%)
p
Non-smokers 411 197 48 50 72 56 61 68 64 <0.001
Smokers 59 15 25 25 66 48 30 81 53 0.39
Data are presented as: N, n+ and P are the total number of events, the number of positive cases, and the prevalence, respectively. Se, Sp, PPV, NPV and p are sensitivity, specificity, positive and negative predictive values, and the statistical significance of rejecting AUC=0.5, respectively. A positive event is controlled asthma (ACQ score < 1.5). A true positive case is defined as FeNO≤cut-off value associated with a controlled asthma. FeNO does not discriminate cross-sectionally controlled versus uncontrolled asthma in smoking patients (p=0.39).
16
Table 3: Assessment of a change from uncontrolled (ACQ score ≥ 1.5) to controlled (ACQ score < 1.5) asthma
.
N n+ P
(%)
Cut-off
(%)
Se
(%)
Sp
(%)
PPV
(%)
NPV
(%)
Acc
(%)
p
Non-smokers 283 133 47 -30 68 71 68 72 70 <0.001
Smokers 52 17 33 -20 71 66 50 82 67 0.016
Data are presented as: N, n+ and P are the total amount of events, the amount of positive cases, and the prevalence, respectively. Se, Sp, PPV, NPV, Acc and p are sensitivity, specificity, positive and negative predictive values, accuracy and the statistical significance of rejecting AUC=0.5, respectively. A positive event is a change from uncontrolled (ACQ score ≥ 1.5) to controlled (ACQ score < 1.5) asthma. A true positive case is defined as FeNO change≤cut-off value (e.g. -40% ) associated with a positive event. FeNO exhibits similar operating characteristics in both non-smoking and smoking group. Particularly, a high NPV is observed.
17
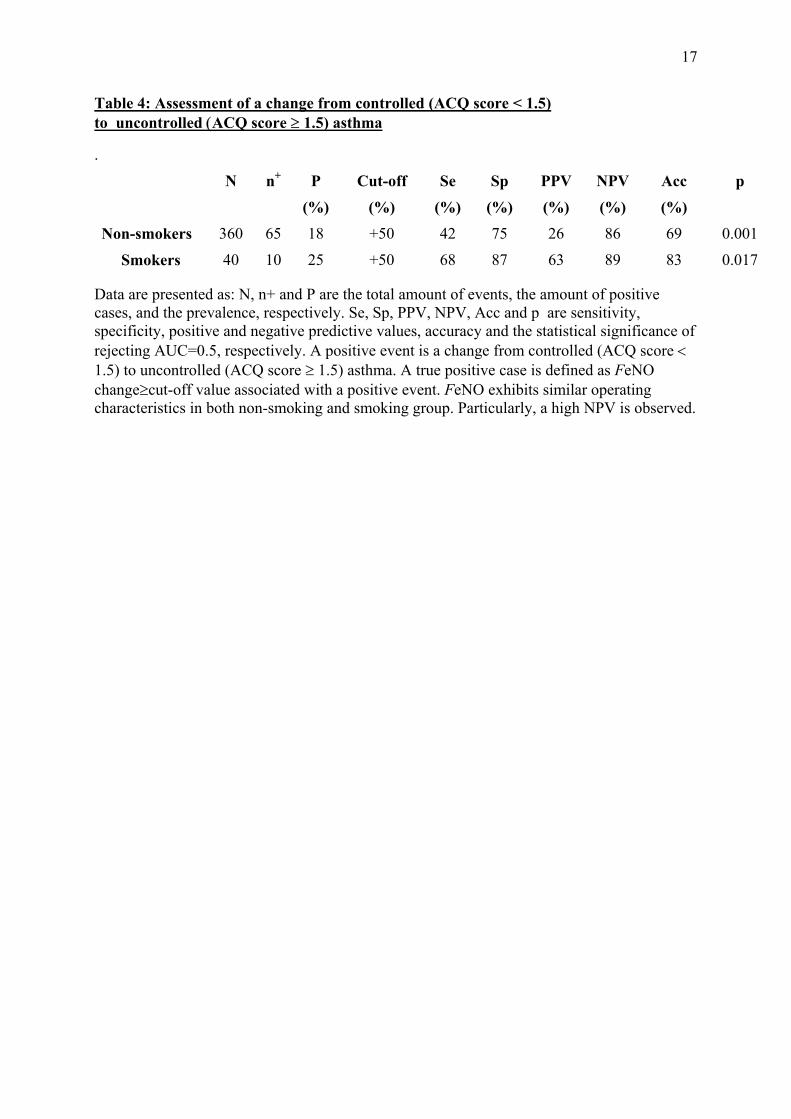
Table 4: Assessment of a change from controlled (ACQ score < 1.5) to uncontrolled (ACQ score ≥ 1.5) asthma
.
N n+ P
(%)
Cut-off
(%)
Se
(%)
Sp
(%)
PPV
(%)
NPV
(%)
Acc
(%)
p
Non-smokers 360 65 18 +50 42 75 26 86 69 0.001
Smokers 40 10 25 +50 68 87 63 89 83 0.017
Data are presented as: N, n+ and P are the total amount of events, the amount of positive cases, and the prevalence, respectively. Se, Sp, PPV, NPV, Acc and p are sensitivity, specificity, positive and negative predictive values, accuracy and the statistical significance of rejecting AUC=0.5, respectively. A positive event is a change from controlled (ACQ score < 1.5) to uncontrolled (ACQ score ≥ 1.5) asthma. A true positive case is defined as FeNO change≥cut-off value associated with a positive event. FeNO exhibits similar operating characteristics in both non-smoking and smoking group. Particularly, a high NPV is observed.
18
Table 5: Assessment of asthma control improvement (∆ACQ < -0.5)
N n+ P (%)
Se (%)
Sp (%)
PPV (%)
NPV (%)
Acc p
Non-smokers (-20%)& Total 643 257 40 64 71 61 74 68 <0.001 D ≤ 500§ 306 116 38 74 67 58 80 70 <0.001 D > 500§ 337 141 42 55 74 60 70 66 <0.001 ACQ<2 432 112 26 60 70 41 83 66 <0.001 ∆D = 0 301 108 36 53 66 47 72 65 0.002
Smokers (-20%)& Total 92 40 43 57 74 62 70 66 <0.001 D ≤ 500§ 35 14 41 62 84 75 78 77 <0.001 D > 500§ 57 26 46 50 71 59 63 61 0.070 ACQ<2 53 18 34 56 77 56 77 70 <0.001 ∆D = 0 47 15 32 67 75 57 83 72 <0.001
Data are presented as: § : ICS dose (D) in µg equ BDP.day-1; & : cut-off value. ACQ<2 row tests the subgroup with an initial ACQ score < 2 and ∆D=0 row tests the sub-group without treatment modification between consecutive visits. N, n+ and P are the total amount of events, the amount of positive events, and the prevalence, respectively. Se, Sp, PPV, NPV, Acc and p are sensitivity, specificity, positive and negative predictive values, accuracy and the statistical significance of rejecting AUC=0.5, respectively. A positive event is defined as an improvement in asthma control. A true positive case is defined as a FeNO change ≤ cut-off value (e.g. -25%) associated with an improvement of asthma control between consecutive visits. When smoking patients are treated with high ICS dose, FeNO loses its ability to assess a control improvement (p=0.07).
19
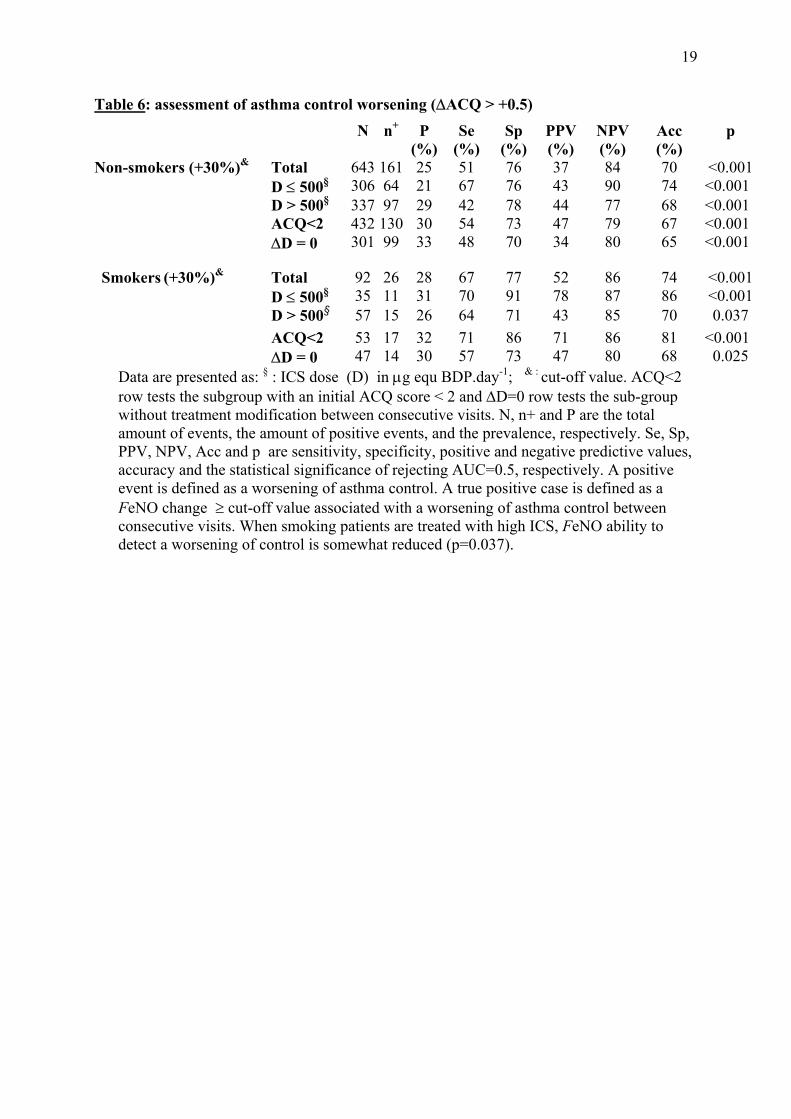
Table 6: assessment of asthma control worsening (∆ACQ > +0.5)
N n+ P (%)
Se (%)
Sp (%)
PPV (%)
NPV (%)
Acc (%)
p
Non-smokers (+30%)& Total 643 161 25 51 76 37 84 70 <0.001 D ≤ 500§ 306 64 21 67 76 43 90 74 <0.001 D > 500§ 337 97 29 42 78 44 77 68 <0.001 ACQ<2 432 130 30 54 73 47 79 67 <0.001 ∆D = 0 301 99 33 48 70 34 80 65 <0.001
Smokers (+30%)& Total 92 26 28 67 77 52 86 74 <0.001 D ≤ 500§ 35 11 31 70 91 78 87 86 <0.001 D > 500§ 57 15 26 64 71 43 85 70 0.037 ACQ<2 53 17 32 71 86 71 86 81 <0.001 ∆D = 0 47 14 30 57 73 47 80 68 0.025
Data are presented as: § : ICS dose (D) in µg equ BDP.day-1; & : cut-off value. ACQ<2 row tests the subgroup with an initial ACQ score < 2 and ∆D=0 row tests the sub-group without treatment modification between consecutive visits. N, n+ and P are the total amount of events, the amount of positive events, and the prevalence, respectively. Se, Sp, PPV, NPV, Acc and p are sensitivity, specificity, positive and negative predictive values, accuracy and the statistical significance of rejecting AUC=0.5, respectively. A positive event is defined as a worsening of asthma control. A true positive case is defined as a FeNO change ≥ cut-off value associated with a worsening of asthma control between consecutive visits. When smoking patients are treated with high ICS, FeNO ability to detect a worsening of control is somewhat reduced (p=0.037).
20
References 1. Jones SL, Kittelson J, Cowan JO, Flannery EM, Hancox RJ, McLachlan CR, Taylor
DR. The predictive value of exhaled nitric oxide measurements in assessing changes in asthma control. Am J Respir Crit Care Med 2001; 164: 738-743.
2. Smith AD, Cowan JO, Brassett KP, Herbison GP, Taylor DR. Use of exhaled nitric oxide measurements to guide treatment in chronic asthma. N Engl J Med 2005; 352: 2163-2173.
3. Shaw DE, Berry MA, Thomas M, Green RH, Brightling CE, Wardlaw AJ, Pavord ID. The use of exhaled nitric oxide to guide asthma management: a randomized controlled trial. Am J Respir Crit Care Med 2007; 176: 231-237.
4. Turner S. Exhaled nitric oxide in the diagnosis and management of asthma. Curr Opin Allergy Clin Immunol 2008; 8: 70-76.
5. Szefler SJ, Mitchell H, Sorkness CA, Gergen PJ, O'Connor GT, Morgan WJ, Kattan M, Pongracic JA, Teach SJ, Bloomberg GR, Eggleston PA, Gruchalla RS, Kercsmar CM, Liu AH, Wildfire JJ, Curry MD, Busse WW. Management of asthma based on exhaled nitric oxide in addition to guideline-based treatment for inner-city adolescents and young adults: a randomised controlled trial. Lancet 2008; 372: 1065-1072.
6. Olin AC, Rosengren A, Thelle DS, Lissner L, Bake B, Toren K. Height, age, and atopy are associated with fraction of exhaled nitric oxide in a large adult general population sample. Chest 2006; 130: 1319-1325.
7. Taylor DR, Pijnenburg MW, Smith AD, De Jongste JC. Exhaled nitric oxide measurements: clinical application and interpretation. Thorax 2006; 61: 817-827.
8. Persson MG, Zetterstrom O, Agrenius V, Ihre E, Gustafsson LE. Single-breath nitric oxide measurements in asthmatic patients and smokers. Lancet 1994; 343: 146-147.
9. Kharitonov SA, Robbins RA, Yates D, Keatings V, Barnes PJ. Acute and chronic effects of cigarette smoking on exhaled nitric oxide. Am J Respir Crit Care Med 1995; 152: 609-612.
10. Verleden GM, Dupont LJ, Verpeut AC, Demedts MG. The effect of cigarette smoking on exhaled nitric oxide in mild steroid-naive asthmatics. Chest 1999; 116: 59-64.
11. Hogman M, Holmkvist T, Walinder R, Merilainen P, Ludviksdottir D, Hakansson L, Hedenstrom H. Increased nitric oxide elimination from the airways after smoking cessation. Clin Sci (Lond) 2002; 103: 15-19.
12. Horvath I, Donnelly LE, Kiss A, Balint B, Kharitonov SA, Barnes PJ. Exhaled nitric oxide and hydrogen peroxide concentrations in asthmatic smokers. Respiration 2004; 71: 463-468.
13. McSharry CP, McKay IC, Chaudhuri R, Livingston E, Fraser I, Thomson NC. Short and long-term effects of cigarette smoking independently influence exhaled nitric oxide concentration in asthma. J Allergy Clin Immunol 2005; 116: 88-93.
21
14. Travers J, Marsh S, Aldington S, Williams M, Shirtcliffe P, Pritchard A, Weatherall M, Beasley R. Reference ranges for exhaled nitric oxide derived from a random community survey of adults. Am J Respir Crit Care Med 2007; 176: 238-242.
15. Dressel H, de la MD, Reichert J, Ochmann U, Petru R, Angerer P, Holz O, Nowak D, Jorres RA. Exhaled nitric oxide: independent effects of atopy, smoking, respiratory tract infection, gender and height. Respir Med 2008; 102: 962-969.
16. Gaston B, Drazen JM, Loscalzo J, Stamler JS. The biology of nitrogen oxides in the airways. Am J Respir Crit Care Med 1994; 149: 538-551.
17. Thomson NC, Chaudhuri R, Livingston E. Asthma and cigarette smoking. Eur Respir J 2004; 24: 822-833.
18. Michils A, Baldassarre S, Van Muylem A. Exhaled nitric oxide and asthma control: a longitudinal study in unselected patients. Eur Respir J 2008; 31: 539-546.
19. Juniper EF, O'Byrne PM, Guyatt GH, Ferrie PJ, King DR. Development and validation of a questionnaire to measure asthma control. Eur Respir J 1999; 14: 902-907.
20. Global initiative for Asthma. Global strategy for asthma management and prevention: NHLBI/WHO Workshop Report. Washington, DC, Government Printing Office, 2002. NHLBI Publication 02-3659.
21. Siroux V, Pin I, Oryszczyn MP, Le MN, Kauffmann F. Relationships of active smoking to asthma and asthma severity in the EGEA study. Epidemiological study on the Genetics and Environment of Asthma. Eur Respir J 2000; 15: 470-477.
22. Juniper EF, Bousquet J, Abetz L, Bateman ED. Identifying 'well-controlled' and 'not well-controlled' asthma using the Asthma Control Questionnaire. Respir Med 2006; 100: 616-621.
23. Juniper EF, Svensson K, Mork AC, Stahl E. Measurement properties and interpretation of three shortened versions of the asthma control questionnaire. Respir Med 2005; 99: 553-558.
24. ATS/ERS recommendations for standardized procedures for the online and offline measurement of exhaled lower respiratory nitric oxide and nasal nitric oxide, 2005. Am J Respir Crit Care Med 2005; 171: 912-930.
25. Youden WJ. Index for rating diagnostic tests. Cancer 1950; 3: 32-35.
26. Jatakanon A, Lim S, Kharitonov SA, Chung KF, Barnes PJ. Correlation between exhaled nitric oxide, sputum eosinophils, and methacholine responsiveness in patients with mild asthma. Thorax 1998; 53: 91-95.
27. Chalmers GW, Macleod KJ, Little SA, Thomson LJ, McSharry CP, Thomson NC. Influence of cigarette smoking on inhaled corticosteroid treatment in mild asthma. Thorax 2002; 57: 226-230.
28. Lazarus SC, Chinchilli VM, Rollings NJ, Boushey HA, Cherniack R, Craig TJ, Deykin A, DiMango E, Fish JE, Ford JG, Israel E, Kiley J, Kraft M, Lemanske RF, Jr., Leone
22
FT, Martin RJ, Pesola GR, Peters SP, Sorkness CA, Szefler SJ, Wechsler ME, Fahy JV. Smoking affects response to inhaled corticosteroids or leukotriene receptor antagonists in asthma. Am J Respir Crit Care Med 2007; 175: 783-790.
29. Jatakanon A, Kharitonov S, Lim S, Barnes PJ. Effect of differing doses of inhaled budesonide on markers of airway inflammation in patients with mild asthma. Thorax 1999; 54: 108-114.
30. Jones SL, Herbison P, Cowan JO, Flannery EM, Hancox RJ, McLachlan CR, Taylor DR. Exhaled NO and assessment of anti-inflammatory effects of inhaled steroid: dose-response relationship. Eur Respir J 2002; 20: 601-608.
23
Legend to the figure
Figure 1: ROC curve characterizing the ability of FeNO to assess an improvement of asthma
control defined as a significant ACQ score decrease (∆ ACQ score > 0.5) between two
consecutive visits. The solid line and the dashed lines represent non-smoking and smoking
patients, respectively. FeNO exhibits similar operating characteristics in both populations.