21
Exhibit 5

Exhibit 5
1
April 19, 2013 [Corrected April 30, 2013]
Aimee Wilson
Air Permits Section (R6 PD-R)
U.S. EPA Region 6
1445 Ross Avenue, Suite 1200
Dallas, TX 75202
RE: La Paloma Energy Center –Permit No. PSD-TX-1288-GHG
Dear Ms. Wilson:
These comments are submitted on behalf of Sierra Club and its 600,000 members, including
over 21,000 members in Texas. The issues addressed below regarding the proposed Draft
Greenhouse Gas Prevention of Significant Deterioration Preconstruction Permit for the La
Paloma Energy Center, LLC (LPEC) are based off of the March, 2013 Statement of Basis (SOB)
prepared by EPA Region 6 (the Region), the draft permit, and the application.
Texas suffered its driest year ever in 2011, and the three years from 2011 to 2013 have been
among the driest on record. Cities are struggling to keep reservoirs full, and the Texas coast is
experiencing accelerating sea level rise. Places like Galveston Island are spending substantial
sums of money to keep the Gulf of Mexico at bay. Texas is very vulnerable to the effects of
climate change and the Region must keep those serious impacts in mind as it considers the
appropriate control technologies for the millions of tons of CO2 that this plant would emit each
year.
LPEC is subject to greenhouse gas (GHG) prevention of significant deterioration (PSD)
regulations. New construction projects that are expected to emit at least 100,000 tpy of total
GHGs on a CO2e basis, or modifications at existing facilities that are expected to increase total
GHG emissions by at least 75,000 tpy CO2e, are subject to PSD permitting requirements even if
they do not significantly increase emissions of any other PSD pollutant. LPEC estimates that it
will potentially result in GHG emissions of 3,292,862 tons per year (tpy) of CO2e. The proposed
LPEC facility would add two new natural gas-fired combustion turbines with duct burner Heat
Recovery Steam Generation (HRSG). LPEC would emit GHGs at a rate far greater than 100,000

2
tpy CO2e; therefore, the project is subject to PSD review for all pollutants emitted in a significant
amount.
1. The Region Must Establish the GHG BACT Limit Based on the Most-
Efficient, Lowest Polluting Turbine Design Technology.
The draft permit failed to set GHG emission rate limits based on the most efficient, and
therefore lowest emitting, combustion cycle turbine design. The Region cannot set different
emission limits for the project that are dependent on the turbine design the applicant chooses.
Nevertheless, the SOB and draft permit proposed to allow LPEC to choose two identical turbines
from any of the following three designs:
General Electric 7FA (183 MW each + 271 MW steam turbine)
Siemens SGT6-5000F(4) (205 MW each + 271 MW steam turbine)
Siemens SGT6-5000F(5) (232 MW each + 271 MW steam turbine)
The SOB states that the BACT limits for CO2 will vary depending on which turbine design
LPEC ultimately selects. The emission rate limits for CO2 range from 909.2 lb/MWh for the
Siemens SGT6-5000F(4) to 934.5 lb/MWh for the GE 7FA. (SOB at pp. 16, 31-36.) The draft
permit does not comply with PSD requirements because the relative efficiency of the three
turbine designs is different, and therefore the GHG emission rates are different. The most
efficient turbine design must be used as the basis for the BACT limit unless the applicant
demonstrates a sufficient site-specific basis to reject that technology. Here, the applicant cannot
make this claim because there is no evidence that different, more efficient turbines would be
infeasible at the LPEC site. To the contrary, LPEC indicates that it is able to choose among the
most efficient turbine technology, which clearly demonstrates that the project is flexible enough
to allow for different turbine designs. The PSD permit must require LPEC to meet a GHG
emission rate that is achievable by the most efficient unit. In this case, the most energy efficient
turbine design in the size class identified by LPEC is the Alstom KA24-2 turbine design. The
applicable BACT emission limit is therefore 758 lb CO2e /MWh (net) on a “new and clean”
ISO basis, and 833 lb CO2e /MWh (net) on a rolling annual average limit as demonstrated by
continuous emissions monitoring of CO2, net generation.1
The Region Cannot Set Different BACT Limits Based on Different a)
Turbine Designs
Clean Air Act § 165(a)(4) requires LPEC to install the Best Available Control Technology
(BACT), which is defined as “an emissions limitation … based on the maximum degree of
reduction for each pollutant subject to regulation under the Act…” 42 USC 7479(3); 40 CFR
52.21(b)(12). Reducing GHG emissions is directly related to minimizing the quantity of fuel
required to make electricity. In this case, the proposed CO2e emission rate of the Siemens SGT6-
500F(4) design is 909.2 lb/MW-hr. The least efficient unit, the GE 7FA, has a proposed CO2e
emission rate that is 2.7 percent higher at 934.5 lb/MW-hr. (SOB at p.16.) This difference in
efficiency is important, particularly because the SOB concludes that energy efficiency options
are the preferred option for BACT as opposed to an add-on technology.
1 See Table 1, infra.

3
The PSD provisions do not allow the permitting authority to select a higher emitting
technology based on the applicant’s preference of different turbine designs. The BACT
requirement is defined as “the maximum degree of reduction for each pollutant.” 42 USC
7479(3). LPEC does not suggest that the Siemens SGT6-500F(4) units are infeasible or
inconsistent with the purpose of the project. Since LPEC states that the technologies that would
meet its needs range from 637 to 735 MW,2 two Siemens SGT6-5000F(4) turbines at a combined
405 MW, plus the 271 MW steam turbine (total 676 MW) can meet that need.3 Therefore, the
top-down BACT analysis requires Ecology to select the lowest emitting technology as the basis
for setting the BACT emission limit. In this case, LCEP’s own application should have resulted
in the Region selecting the Siemens SGT6-5000F(4) as the basis for setting BACT. Sierra Club’s
review of other turbine designs shows that an even lower limit is achievable by the Alstom
KA24-2 unit, which in turn should provide the basis for setting the BACT limit.
Energy efficiency is a critical component of the BACT analysis, particularly for GHGs.
EPA’s PSD and Title V Permitting Guidance for Greenhouse Gases is clear on this point: “Use
of inherently lower-emitting technologies, including energy efficiency measures, represents an
opportunity for GHG reductions in these BACT reviews.”4 The energy efficiency of a
technology forms the base of the BACT determination. “Initially, in many instances energy
efficient measures may serve as the foundation for a BACT analysis for GHGs, with add-on
pollution control technology and other strategies added as they become more available.”5 In this
case, in addition to considering add-on technologies such as carbon capture and sequestration
(CCS), the Region must first establish the BACT limit foundation by setting the limit based on
the most energy efficient technology design. The applicant may not choose a less efficient
design. “When a permit applicant proposes to construct a facility using a less efficient boiler
design…a BACT analysis for this source should include more efficient options.”6 In this case,
some of those more efficient options were considered, but the Region improperly set the BACT
limit based on the least-efficient turbine design.
There is no dispute that different turbine designs result in different energy efficiencies. The
Region dismisses the importance of the 2.7 percent difference in energy efficiency of the
turbines designs analyzed in the SOB, concluding that the three designs “are some of the most
efficient combined cycle turbines.” (SOB at pp. 12, 16.) This dismissal of recognizable and
achievable energy efficiency gains is contrary to the Region’s PSD and Title V Permitting
Guidance for Greenhouse Gases, which expressly addresses an example of energy efficiency at a
coal plant:
In general, a more energy efficient technology burns less fuel than a less
energy efficient technology on a per unit of output basis. For example,
coal-fired boilers operating at supercritical steam conditions consume
2Prevention of Significant Deterioration Greenhouse Gas Permit Application for a Combined Cycle Power Plant at
the La Paloma Energy Center: Revised 03-12-2013, (“Revised Application”), March 3, 2013, p.11. 3 Revised Application, p.12.
4 PSD and Title V Permitting Guidance for Greenhouse Gases, March 2011, p.29.
5 Id.
6 Id.

4
approximately 5 percent less fuel per megawatt hour produced than boilers
operating at subcritical steam conditions.7
The EPA guidance makes clear that energy efficiency must be considered in the BACT analysis.
There is no basis for determining that “some of the most efficient” designs all constitute BACT.
The NSR Manual provides: “The reviewing authority…specifies an emissions limitation for the
source that reflects the maximum degree of reduction achievable…” (NSR Manual, p.B.2
(emphasis added)). Without a showing that the most efficient design is either technically
infeasible or that it should be eliminated due to disproportionate site-specific energy, economic
or environmental impacts, the Region must set the GHG BACT emission rate limit based on the
most efficient turbine design.
It is irrelevant for purposes of the BACT analysis that the applicant may wish to make a final
selection of the turbine design based on “other considerations [such as] capacity of the turbine,
cost, reliability, and predicted longevity.” (SOB at p.16.) BACT is required by law and is not an
afterthought that can be subordinated to other considerations. (NSR Manual at p.B.31.) The
Region must set the GHG emission limit based on the most energy efficient turbine design.
Turbine vendors that can meet that limit are free to compete for PSE’s business. This feature of
the BACT program has been remarkably successful in encouraging development of more
effective pollution controls for over 40 years.
The Region Must Consider Additional Turbine Models in its BACT b)
Analysis
The applicant states that the purpose of the project is to generate 637 to 735 MW of power.8
Assuming that this is a true description of the project, the Region’s BACT analysis must consider
the entire range of electric generation technologies that can meet this purpose. In this case, as
discussed in more detail below, the emissions limitation that reflects the maximum degree of
reduction is based on the 664 MW Alstom KA24-2 turbine design. The applicable BACT
emission limit is therefore 758 lb CO2e /MWh (net) on a “new and clean” ISO basis, and 833 lb
CO2e /MWh (net) on a rolling annual average limit as demonstrated by continuous emissions
monitoring of CO2, net generation.9
In this case, the proposed LPEC is close to the next size class of CCGT’s that can perform at
more efficient heat rates. The Region should therefore also require the applicant to demonstrate
that the use of larger, more efficient designs is infeasible or would fundamentally change the
project. The 820 MW Siemens SCC6-8000H combined cycle gas turbine can achieve an
emission rate of 738 lb CO2e /MWh (net) on a “new and clean” ISO basis, at full load and
corrected for temperature and humidity, and it can achieve 811 lb CO2e /MWh (net) on in-use
rolling annual average basis as demonstrated by continuous emissions monitoring of CO2, net
generation.
7 PSD and Title V Permitting Guidance for Greenhouse Gases, March 2011, p.21 (citing: U.S. Department of
Energy, Cost and Performance Baseline for Fossil Energy Plants - Volume 1: Bituminous Coal and Natural Gas to
Electricity, DOE/NETL-2007/1281, Final Report, Revision 1 (August 2007) at 6 (finding that the absolute efficiency
difference between supercritical and subcritical boilers is 2.3% (39.1% compared to 36.8%), which is equivalent to a
5.9% reduction in fuel use), available at
http://www.netl.doe.gov/energyanalyses/pubs/Bituminous%20Baseline_Final%20Report.pdf ). 8 Revised Application, p.11.
9 In each case, small emission factors for CH4 and N2O should be incorporated.

5
Sierra Club reviewed several turbine design makes and models to determine the most energy
efficient combined cycle generator turbines (CCGT). Potential candidate energy efficient BACT
technologies include the following turbine designs:
Table 1. Candidate BACT Technologies
Design Capacity
(MW)
Efficiency
(%)
Heat rate
(Btu/kWh)
LHV
ISO
Emission
Rate (CO2lb/MWh)
Annual
Emission
Rate (net)10
(CO2lb/MWh)
Alstom
KA24-211
664 58.4 5844 758 833
GE 7FA12
632 58 5990 (5884) 777 (763) 854 (839)
Siemens SGT
6-5000F(5)13
735 ? 6264
(14) 812 893
Siemens
SGT6-
5000F(4)15
690 58 5882 763 839
Siemens
SCC6-
8000H16
820 >60 5687(17)
738 811
Mitsubishi
M50118
801 58.6 5823 755 830
Mitsubishi
M501 GAC 811 59.4 5744 745 819
The most efficient CCGT available in a 60 Hz configuration in the capacity range identified
by the applicant is the Alstom KA24-2, with a capacity rating of greater than 660 MW (net), and
efficiency of greater than 58.3 percent and a heat rate of less than 5,853 Btu/kWh. The Siemens
SGT6-5000F(4) is 0.5 percent less efficient. This unit has a rated generation capacity of 690 MW
10
Sierra Club applied a 10 percent compliance margin to the ISO emission rate. 11
http://gsgnet.net/c/c.aspx/ALS001/productspecs 12
GE now rates the GE7FA CCGT at 58 percent efficiency, but has a published heat rate of 5990 Btu/kWh.
However, the heat rate is simply 3412.75 Btu/kWH divided by the efficiency. Thus, assuming that the efficiency
rating is correct, the GE units would have essentially the same heat rate as the Siemens SGT6-5000F(4), which is
also rated at 58 percent efficiency. Updated numbers are shown in parentheses. http://www.ge-
energy.com/products_and_services/products/gas_turbines_heavy_duty/7fa_heavy_duty_gas_turbine.jsp 13
Revised Application at p 15. The Region should this data with current figures. 14
Id. The Region should this data with current figures. 15
http://www.energy.siemens.com/hq/en/fossil-power-generation/gas-turbines/sgt6-
5000f.htm#content=PAC%20%26amp%3B%20SCC 16
http://www.energy.siemens.com/us/en/fossil-power-generation/gas-turbines/sgt6-8000h.htm#content=SCC 17
2012 GTW Handbook. 18
Id.

6
(net), efficiency of 58 percent and an ISO heat rate of 5,882 Btu/kWh (net, LHV). Units with
greater efficiency are available in 50 Hz configurations and in 60 Hz configurations in the 400
MW range and in the 800 MW range. Larger CCGTs in the 800 MW range, including the
Mitsubishi M501 and M501GAC turbines, demonstrate efficiencies of 58.6 percent and 59.4
percent, respectively, with heat rates of 5,687 and 5,744 Btu/kWh, respectively. The Siemens
SCC6-8000H is the best performer in this group.
The Alstom KA24-2 has a “new and clean” ISO emission rate of 758 lb CO2e /MWh on an
HHV basis. Sierra Club applied a 10 percent compliance margin to the new and clean rates to
account for degradation losses and performance variability.19
Applying the 10 percent
compliance margin to the Alstom unit results in an adjusted emission limit of 833 lb CO2e /MWh
(net). EPA data show that this limit has been reliably met for several years.20
EPA’s BACT limit is further skewed because it calculates the limit based on gross output
rather than net output. Net emission rates are more appropriate because they account for all of
the pollution emitted from the turbines, whereas gross emission rates do not account for energy
that is used on-site. The difference between net and gross emission rates at LPEC range from
1.13 percent to 5.5 percent.21
This means that the actual GHG emissions at LPEC will be
significantly higher than the permitted limits. The Region should set BACT limits based on net
emission rates.
2. The Region’s Adjustments to Manufacturer Ratings Are Not Supported
The Region adjusted the “new and clean” ISO emission rates to account for equipment
variation, in-use degradation, part load performance and duct firing. While Sierra Club agrees
that some adjustment for these factors might be appropriate if adequately supported in the record
with data and analysis, the Region must demonstrate an objective basis for allowing the type and
magnitude of adjustments suggested by the applicant. Neither the application nor the SOB
provides any information or citations to any independent or objective basis for the proposed
adjustments.
The draft permits BACT limits include a combined 12.3 percent compliance margin (not
including duct firing) for design variation, performance losses, and degradation. (SOB at p.15.)
This compliance margin is excessive. Sierra Club agrees that some correction to design data
could be necessary to address certain operational variables if it is justified by record evidence.
However, the Region’s proposed corrections in the draft permit here are not supported by
information in the record and are either overly large or entirely unwarranted. Finally, the Gas
Turbine World Handbook points out that the performance specifications are conservative and
19
The basis for Sierra Club’s use of a 10 percent compliance margin is discussed in Section 2, infra. 20
In the course of its GHG NSPS rulemaking, EPA developed a spreadsheet and series of analyses of CCGTs that
had been introduced into service since 2006. See, Docket No. EPA-HQ-OAR-2011-0660-10887, Sierra Club
Comments, Appendix D, July 9, 2012 (available at: http://www.regulations.gov/#!documentDetail;D=EPA-HQ-
OAR-2011-0660-10887) (included here as Attachment A). 21
Revised Application, Tables 5-1 to 5-3. LPEC does not explain this difference in duct firing impacts. Sierra
Club’s review of the manufacturers’ specifications on company websites and the 2012 Gas Turbine World
Handbook provided different reference heat ratings than listed by the applicant in these tables. Some of these
differences might be attributable to ongoing improvements by manufacturers, but it also appears that the applicant
may have made unidentified adjustment to the published figures. The Region should review and update the current
performance specifications.
7
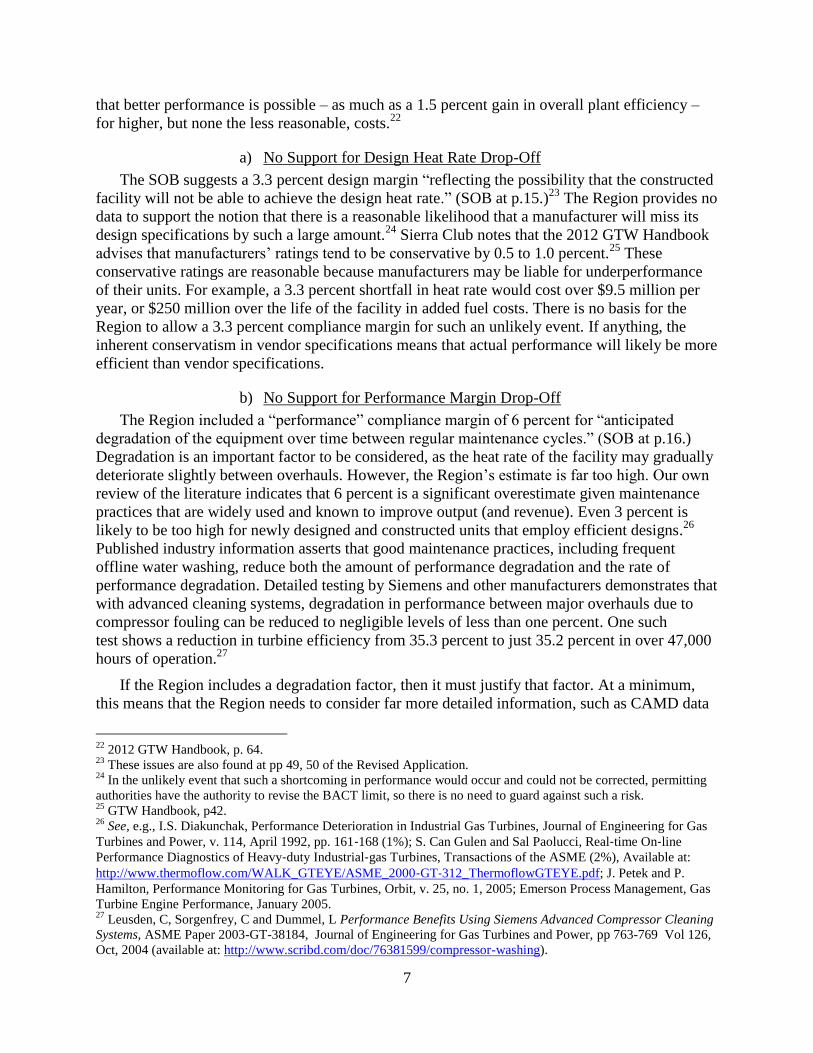
that better performance is possible – as much as a 1.5 percent gain in overall plant efficiency –
for higher, but none the less reasonable, costs.22
No Support for Design Heat Rate Drop-Off a)
The SOB suggests a 3.3 percent design margin “reflecting the possibility that the constructed
facility will not be able to achieve the design heat rate.” (SOB at p.15.)23
The Region provides no
data to support the notion that there is a reasonable likelihood that a manufacturer will miss its
design specifications by such a large amount.24
Sierra Club notes that the 2012 GTW Handbook
advises that manufacturers’ ratings tend to be conservative by 0.5 to 1.0 percent.25
These
conservative ratings are reasonable because manufacturers may be liable for underperformance
of their units. For example, a 3.3 percent shortfall in heat rate would cost over $9.5 million per
year, or $250 million over the life of the facility in added fuel costs. There is no basis for the
Region to allow a 3.3 percent compliance margin for such an unlikely event. If anything, the
inherent conservatism in vendor specifications means that actual performance will likely be more
efficient than vendor specifications.
No Support for Performance Margin Drop-Off b)
The Region included a “performance” compliance margin of 6 percent for “anticipated
degradation of the equipment over time between regular maintenance cycles.” (SOB at p.16.)
Degradation is an important factor to be considered, as the heat rate of the facility may gradually
deteriorate slightly between overhauls. However, the Region’s estimate is far too high. Our own
review of the literature indicates that 6 percent is a significant overestimate given maintenance
practices that are widely used and known to improve output (and revenue). Even 3 percent is
likely to be too high for newly designed and constructed units that employ efficient designs.26
Published industry information asserts that good maintenance practices, including frequent
offline water washing, reduce both the amount of performance degradation and the rate of
performance degradation. Detailed testing by Siemens and other manufacturers demonstrates that
with advanced cleaning systems, degradation in performance between major overhauls due to
compressor fouling can be reduced to negligible levels of less than one percent. One such
test shows a reduction in turbine efficiency from 35.3 percent to just 35.2 percent in over 47,000
hours of operation.27
If the Region includes a degradation factor, then it must justify that factor. At a minimum,
this means that the Region needs to consider far more detailed information, such as CAMD data
22
2012 GTW Handbook, p. 64. 23
These issues are also found at pp 49, 50 of the Revised Application. 24
In the unlikely event that such a shortcoming in performance would occur and could not be corrected, permitting
authorities have the authority to revise the BACT limit, so there is no need to guard against such a risk. 25
GTW Handbook, p42. 26
See, e.g., I.S. Diakunchak, Performance Deterioration in Industrial Gas Turbines, Journal of Engineering for Gas
Turbines and Power, v. 114, April 1992, pp. 161‐168 (1%); S. Can Gulen and Sal Paolucci, Real‐time On‐line
Performance Diagnostics of Heavy‐duty Industrial‐gas Turbines, Transactions of the ASME (2%), Available at:
http://www.thermoflow.com/WALK_GTEYE/ASME_2000‐GT-312_ThermoflowGTEYE.pdf; J. Petek and P.
Hamilton, Performance Monitoring for Gas Turbines, Orbit, v. 25, no. 1, 2005; Emerson Process Management, Gas
Turbine Engine Performance, January 2005. 27
Leusden, C, Sorgenfrey, C and Dummel, L Performance Benefits Using Siemens Advanced Compressor Cleaning
Systems, ASME Paper 2003-GT-38184, Journal of Engineering for Gas Turbines and Power, pp 763-769 Vol 126,
Oct, 2004 (available at: http://www.scribd.com/doc/76381599/compressor-washing).

8
referenced in Table 2 below, than it has to date and ascertain the extent to which top‐performing
units – including units with better initial designs and units that employ appropriate maintenance
practices –experience the assigned degradation factor. The Region must make a record
demonstrating that a degradation factor is necessary and that the degradation factor used in the
permit appropriately represents the reasonable and unavoidable degradation of the facility.
No Support for Drop-Off due to Auxiliary Plant Equipment c)
The Region compounds the compliance margins by adding yet another 3 percent degradation
margin, this one “reflecting the variability in operation of auxiliary plant equipment due to use
over time.” (SOB at pp. 15-16.) This margin purports to account for “other elements” of the
combined cycle plant such as the heat recovery steam generator (HRSG), steam turbine, ancillary
equipment, etc. The SOB assumes that these other elements will cause plant-wide degradation of
3 percent. This ancillary equipment consumes only 3-4 per cent of gross generation total, and
therefore degradation in the performance of auxiliary plant equipment could not cause an
additional 3 percent loss in overall plant efficiency. The Region provides no support or
calculations for this compliance factor and it should be eliminated. As with the degradation
factor for the turbine discussed above, the Region can only include an auxiliary plant degradation
factor if it is adequately justified in the record—including evidence of both the fact that the
auxiliary equipment degrades and that the percentage determined to be the necessary degradation
factor represents the actual and unavoidable degradation.
The Region Should Consider Actual Reported Emissions Data d)
Rather than relying solely on vendor estimates, the Region should also analyze the
achievable BACT limit based on available data from turbine designs that have been in operation.
The following table includes reported emissions rates for efficient CCGTs.
Table 2. In-use Emission Rates for Low Emitting CCGTs28
Unit Capacity
(MW)
Average CO2
emission rate -
lb/ MWh
(gross)
Highest reported
CO2 emission rate
- lb/ MWh (gross)
TVA Lagoon Creek 1, TN 275 731 742
TVA Lagoon Creek 2, TN 275 757 774
Caithness LI Energy Center 330 795 812
Harry Allen Unit 5, NV 500 798 804
Harry Allen Unit 6, NV 500 797 803
Jack McDonough, GA29
840 802 802
The Lagoon Creek Plant employs the Mitsubishi 501F turbines in a 2x1 configurations. In
2009, this technology was rated at 57.3 percent efficiency and a heat rate of 5,955 Btu/kWh. The
28
Data from CAMD CEMS Annual Data, as of May 3, 2012 (Included as Attachment A). 29
http://www.mhi.co.jp/en/news/story/200801161212.html

9
Harry Allen plant employs an earlier version of the GE Frame 7 configuration and reported gross
emission rates of 803-804 lb CO2e/MWh.30
The Jack McDonough plant uses 3 Mitsubishi
CCGTs in a 2x2x1 configuration, each of which is based on the M501G turbine. As noted above
in Table 1, the M501G turbine is also available in a 2x1 configuration with a capacity of 800
MW. The McDonough gross emission rate converts to 826 lb/MWh (net). Sierra Club’s Table 1
above projects an emission limit of 830 lb/MWh for this unit, which is very close to the actual
reported emission rate. This comparison demonstrates that the in-use emissions data from the
M501G unit correlates well with the “new and clean” rate, plus a 10 percent compliance margin.
3. Adjustments Based on Duct Firing are Excessive and Unsupported
The LPEC facility proposed to direct high temperature exhaust produced by the combustion
turbine to the heat recovery steam generator (HRSG). The HRSG will have supplemental duct
firing of up to 750 MMBtu/hr. The HRSG can produce an additional 271 MW at design
temperature. (SOB at p. 5) The duct burners result in additional emissions, including additional
CO2 emissions ranging from 22.4 lb/MWh (Siemens SGT6-5000F(4)) to 60 lb/MWh (GE 7FA).
According to the applicant, duct firing reduces efficiency of the turbines between 2.5 percent and
6.4 percent, respectively.31
The Region adjusts the total BACT limit by this amount, which is in
addition to the 12.3 percent compliance adjustments discussed above. The Region’s adjustment
for duct firing is flawed for two reasons.
First, a top-down BACT analysis should look at cleaner production processes for achieving
the additional on-peak energy that the duct burners would provide. Alternatives to duct burners
could include battery storage, solar hybrid configuration (or a combination battery and solar
hybrid), a small combustion turbine, or using the auxiliary boiler for supplemental steam. Sierra
Club notes that the heat rate from duct burning is approximately the same, or worse, than the
efficiency of new internal combustion engine generators. Addressing the least efficient part of
the proposed plant—the duct burning peak topping generation—can significantly increase the
plant’s overall efficiency without redefining the project. There are numerous alternatives for
short-term, peak power generation at the scale proposed for duct burning at LPEC that would
achieve significant reductions in not only GHGs, but in other pollutants. The Region has not
addressed any of these alternatives in the draft permit.
Second, the calculation of the BACT limits is inconsistent with the draft permit’s compliance
monitoring provisions. The SOB calculates the BACT limit based on 100 percent load, which
includes duct firing. (SOB at p.17.)32
However, the draft permit measures initial performance
compliance without duct firing. Condition §III(A)(1)(a) of the draft permit provides: “To
determine this BACT emission limit, Permittee shall calculate the limit based on the measured
hourly energy output (MWh (gross)), the CTG is operating at, or above 90% of its design
capacity without duct burning firing and the results shall be corrected to ISO conditions.” (Draft
Permit, p.13.) This discrepancy further demonstrates that the Region’s adjustment of BACT
limits based on inefficient duct firing is improper.
30
https://www.nvenergy.com/company/energytopics/images/Harry_Allen_Fact_Sheet.pdf 31
Revised Application, p.50. The efficiency penalty from duct firing is much higher for the GE 7FA. If LPEC
eliminated duct firing, the most efficient turbine design would be the GE 7FA rather than the Siemens SGT6-
5000F(4). This interaction should be noted and analyzed in the Region’s BACT analysis. 32
See, also, Revised Application, Tables 5-1 to 5-3 (calculating applicable BACT limits with duct firing).

10
4. The Emission Limit Should Include a “New and Clean” Limit to Be
Determined At the Time of Commencement of Commercial Operations.
Manufacturers’ performance ratings provide a reasonable starting point to establish a BACT
limit for simple and combined cycle gas turbines. These ratings are necessarily conservative,
since the manufacturer may be liable for damages if the advertised performance is not achieved.
But competitive pressures tend to limit the degree to which performance is understated and the
GTW Handbook estimates that the safety margin in these ratings is between 0.5 and 1.0
percent.33
The correction to the rated efficiencies and associated heat rates for ambient operating
temperature and barometric pressure and pressure drop associated with pollution controls is also
reasonably well defined. However, the combustion efficiency and therefore the CO2e/MWh
emission rate can be affected by variations in the load that the unit is asked to provide and by
degradation in performance over time. Some of this degradation in performance can be recovered
by routine maintenance while some cannot. These latter two factors lead sources to request
substantial compliance margins compared to “new and clean” performance at full load.
While some margin for in-use operation is appropriate, the amount of margin suggested by
LPEC is excessive and undocumented. In the case of GHG emissions, excessive compliance
margins can quickly outpace any efficiency gains from turbine design or other best practices.
The percentage difference between the best technologies and poor performing units is far smaller
than permitting agencies have been accustomed to addressing with other criteria pollutants. As a
consequence, there is a real risk that by providing a compliance margin that attempts to address
operating conditions, the BACT limit no longer serves its purpose of requiring the use of the best
available technology. To illustrate the problem, consider the difference in performance between
available turbine technologies discussed above. The difference between the least efficient turbine
technology and the most efficient turbine technology would result in millions of tons of CO2 over
the life of the unit, even though those differences may amount to only a few percentage points.
However, the compliance margins proposed by the Region are so large that every CCGT design
in the size range sought by the applicant, including the oldest and least efficient designs, would
be able to comply with the proposed BACT emission limit of 934.5 lb CO2e/MWh.
In addition to the comments above regarding adjustment factors, one solution is to apply a
“new and clean” emission rate where compliance is established at the time of the start of
commercial operations. This rate would be based on the manufacturer’s published ratings.
Testing would be conducted at full rated load and as close to ISO temperature and humidity
conditions as reasonably possible. The test results would be adjusted to correct for differences in
temperature and humidity from ISO conditions. This limit would ensure that the most efficient
unit is installed. Thereafter, a separate, rolling annual emission limit would be enforced to assure
that the unit is maintained and operated in an efficient manner. Earlier in this comment we have
provided the emission rates for each of these limits that we believe are appropriate.
5. The Region Improperly Ignored Other BACT Limits
The Region compared the proposed LPEC BACT limits to several other BACT limits
established for other combined cycle/heat recovery steam generating units. (SOB at p.17.) The
33
See, 2012 GTW Handbook at p.40.

11
application included a more detailed discussion of these facilities and their corresponding BACT
limits.34
All of the facilities cited by the applicant have lower permitted GHG emission rates.
The Palmdale Hybrid Power Project has a permitted GHG BACT limit of 774 lb CO2/MWh.
The SOB notes that this limit is “reduced due to the offset of emissions from the use of a 50 MW
solar-thermal plant.” (SOB at p.14.) The Region’s reasoning for rejecting this permit limit as a
useful comparison is unclear. If Palmdale is able to achieve 774 lb CO2/MWh, then the control
technologies – including solar-thermal hybrid configuration – and the associated emission rates
must be considered as part of the BACT analysis for LPEC. Even without the offset from the
solar-thermal heating, the plant’s permitted heat rate limit is 7,319 Btu/kW-hr, which correspond
857 lb CO2/MWh.35
Even this higher rate is much better than LPEC’s proposed BACT limit of
934.5 lb CO2/MWh. The Region did not adequately explain why the site-specific conditions at
LPEC prevent the facility from using a solar-thermal hybrid configuration and from achieving
similar emissions.
The Pioneer Valley Energy Center (PVEC) similarly has a much lower permitted GHG
BACT limit. The initial GHG limit is 825 lb CO2/MWh, and the rolling average limit is 895
lb/CO2 MWh.36
Both of these limits are far below LPEC’s permitted rate of 934.5 lb CO2/MWh.
The Region rejects this limit because PVEC is “more likely to operate as baseload conditions,
whereas LPEC will operate as a load cycling unit.” (SOB at p.17) However, neither the proposed
permit nor the application require the LPEC to operate as a load cycling units, and there is no
justification provided for setting the emission rates differently based on a different level of
operation. Notably, the draft permit would allow LPEC to operate at full load 8,260 hours per
year, plus 500 hours of startup, shutdown and maintenance (i.e. continuously). (SOB at pp. 31-
36.) This limit is not consistent with the assumption that the plant will operate on a limited basis
as a load cycling facility.
All of the other units cited in the application have lower BACT limits than LPEC’s proposed
limit of 934.5 lb CO2/MWh. Comparing heat rates, LPEC’s proposed limit of 7,861 Btu/kWh is
higher than Lower Colorado River Authority Ferguson Plant (7,720 Btu/kWh), Cricket Valley
Energy Center (7,605 Btu/kWhr), Deer Park Energy Center (7,730 Btu/kWh), and Channel
Energy Center (7,730 Btu/kWh).37
The Region states that these facilities are “comparable” to the
proposed limit for LPEC. (SOB at p.17.) These permitted limits are not comparable; they are
lower. BACT requires the maximum degree of reduction of GHG pollutants. There are no site-
specific reasons explaining why LPEC cannot meet the lower limits established in numerous
other BACT permits. The Region cannot justify an undefined “comparable” limit that is
objectively higher than other BACT limits. The Clean Air Act requires the maximum limit
achievable.
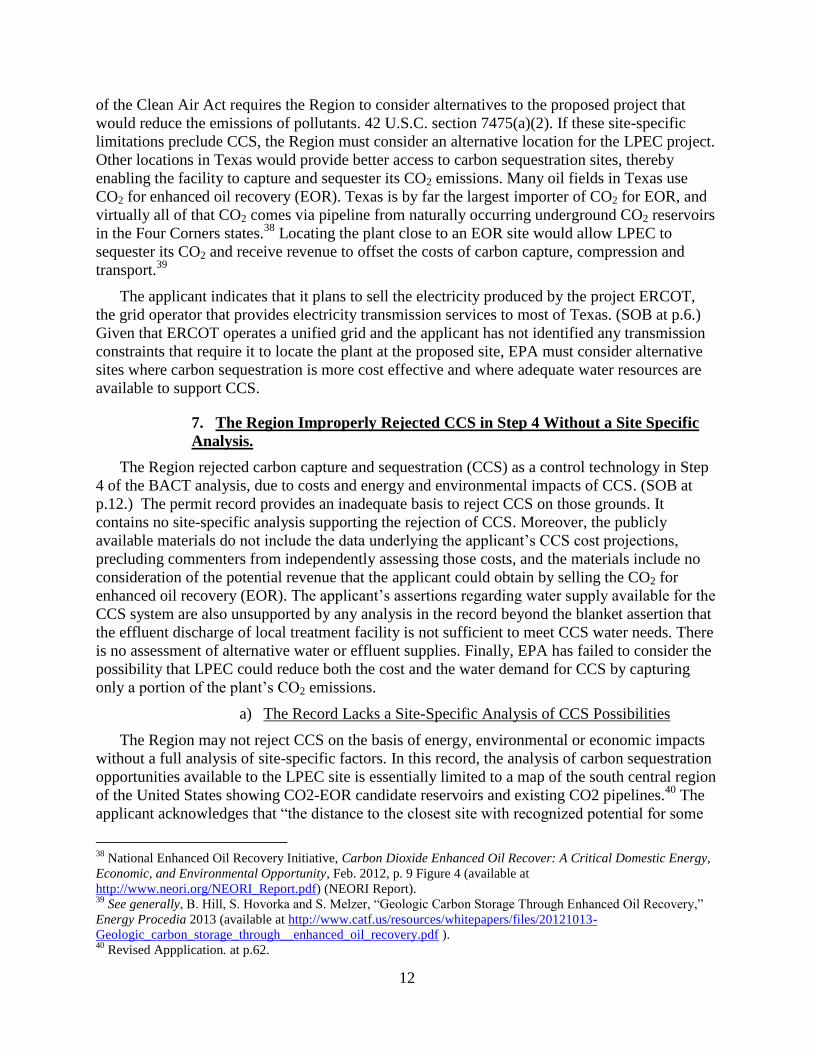
6. The Region Should Have Considered Alternative Locations for the
Proposed Project Where Carbon Sequestration Is More Readily Available
The applicant claims that carbon capture and sequestration (CCS) is not appropriate because
the project site is too distant from locations that provide carbon sequestration opportunities and
the water supply is not adequate to support the plant if it were equipped with CCS. Section 165
34
Revised Application, pp.51-54. 35
Id. at p.52. 36
Id. at p.53. 37
Id. at pp.52-54.
12
of the Clean Air Act requires the Region to consider alternatives to the proposed project that
would reduce the emissions of pollutants. 42 U.S.C. section 7475(a)(2). If these site-specific
limitations preclude CCS, the Region must consider an alternative location for the LPEC project.
Other locations in Texas would provide better access to carbon sequestration sites, thereby
enabling the facility to capture and sequester its CO2 emissions. Many oil fields in Texas use
CO2 for enhanced oil recovery (EOR). Texas is by far the largest importer of CO2 for EOR, and
virtually all of that CO2 comes via pipeline from naturally occurring underground CO2 reservoirs
in the Four Corners states.38
Locating the plant close to an EOR site would allow LPEC to
sequester its CO2 and receive revenue to offset the costs of carbon capture, compression and
transport.39
The applicant indicates that it plans to sell the electricity produced by the project ERCOT,
the grid operator that provides electricity transmission services to most of Texas. (SOB at p.6.)
Given that ERCOT operates a unified grid and the applicant has not identified any transmission
constraints that require it to locate the plant at the proposed site, EPA must consider alternative
sites where carbon sequestration is more cost effective and where adequate water resources are
available to support CCS.
7. The Region Improperly Rejected CCS in Step 4 Without a Site Specific
Analysis.
The Region rejected carbon capture and sequestration (CCS) as a control technology in Step
4 of the BACT analysis, due to costs and energy and environmental impacts of CCS. (SOB at
p.12.) The permit record provides an inadequate basis to reject CCS on those grounds. It
contains no site-specific analysis supporting the rejection of CCS. Moreover, the publicly
available materials do not include the data underlying the applicant’s CCS cost projections,
precluding commenters from independently assessing those costs, and the materials include no
consideration of the potential revenue that the applicant could obtain by selling the CO2 for
enhanced oil recovery (EOR). The applicant’s assertions regarding water supply available for the
CCS system are also unsupported by any analysis in the record beyond the blanket assertion that
the effluent discharge of local treatment facility is not sufficient to meet CCS water needs. There
is no assessment of alternative water or effluent supplies. Finally, EPA has failed to consider the
possibility that LPEC could reduce both the cost and the water demand for CCS by capturing
only a portion of the plant’s CO2 emissions.
The Record Lacks a Site-Specific Analysis of CCS Possibilities a)
The Region may not reject CCS on the basis of energy, environmental or economic impacts
without a full analysis of site-specific factors. In this record, the analysis of carbon sequestration
opportunities available to the LPEC site is essentially limited to a map of the south central region
of the United States showing CO2-EOR candidate reservoirs and existing CO2 pipelines.40
The
applicant acknowledges that “the distance to the closest site with recognized potential for some
38
National Enhanced Oil Recovery Initiative, Carbon Dioxide Enhanced Oil Recover: A Critical Domestic Energy,
Economic, and Environmental Opportunity, Feb. 2012, p. 9 Figure 4 (available at
http://www.neori.org/NEORI_Report.pdf) (NEORI Report). 39
See generally, B. Hill, S. Hovorka and S. Melzer, “Geologic Carbon Storage Through Enhanced Oil Recovery,”
Energy Procedia 2013 (available at http://www.catf.us/resources/whitepapers/files/20121013-
Geologic_carbon_storage_through__enhanced_oil_recovery.pdf ). 40
Revised Appplication. at p.62.

13
geological storage of CO2 . . . is an enhanced oil recovery (EOR) reservoir site located within 15
miles of the proposed project,”41
yet it makes no effort to research or characterize that reservoir.
Instead, the applicant simply notes that “none of the South and Southeast Texas EOR reservoir or
other geologic formation sites have yet been technically demonstrated for large-scale, long-term
CO2 storage.”42
The applicant bears the burden of showing that a particular control technology is
not feasible or cost-effective, and the broad conclusions in this record do not suffice. Considering
that fossil fuel-fired power plants are the nation’s largest individual sources of greenhouse gas
emissions, it is incumbent on proponents of new plants to characterize potential CCS
opportunities more precisely. The Region should require a more detailed analysis of
sequestration opportunities near the proposed site.
Cost Estimates are Unsupported and Incorrect b)
The applicant provided a summary table with a CCS cost estimate,43
but the record does not
include a breakdown of those costs that would allow the Region and commenters to understand
and assess them. Moreover, neither the applicant nor the Region attempted to perform a site-
specific evaluation of the cost of CCS. The Region accepted the applicant’s cost projections
without any record of an independent analysis. The SOB simply states, “EPA Region 6 reviewed
La Paloma’s CCS cost estimate and believes it adequately approximates the cost of a CCS
control for this project and demonstrates those costs are high in relation to the overall cost of the
proposed project without CCS . . . .” (SOB at p. 11-12.) This blank record deprives the public of
an opportunity to review and comment on the cost projections of the most effective CO2 control
technology available.
Even the little information on CCS costs in the record demonstrates that the cost projections
are incorrect because they do not include any estimate of revenue that the applicant could obtain
from selling CO2 from LPEC for EOR. The Texas market for CO2 for use in EOR is robust, and
EOR opportunities exist near the project site and elsewhere in Texas.44
A conservative estimate
of the market price of CO2 is $33/tonne.45
The Region must correct the CCS cost analysis to
include a reasonable projection of revenues from CO2.
Basis for Rejecting CCS in Relation to Overall Costs of Project is c)
Invalid
The Region’s exclusion of CCS based on cost is inappropriate because there is no evidence
that CCS at LPEC would be different from the cost of CCS or other BACT options at similar
plants. When determining if a pollution control option has sufficiently adverse economic impacts
to justify rejecting that option and establishing BACT based on a less effective option, a
permitting agency must determine that the cost-per-ton of emissions reduced is beyond “the cost
borne by other sources of the same type in applying that control alternative.” (NSR Manual at
B.44.) This high standard for eliminating a feasible BACT technology exists because the
collateral impacts analysis in BACT step 4 is intended only as a safety valve for when impacts
unique to the facility make application of a technology inapplicable to that specific facility. The
Region inappropriately compares the cost of CCS to the overall costs of the proposed project.
41
Id. at p.46 42
Id. at pp.46-47. 43
Id. at p.48. 44
Id. at p.62. 45
NEORI Report, Appendix D, Figure D1.

14
(SOB at p.12.) This is expressly prohibited by the NSR Manual. “[A]pplicants generally should
not propose elimination of control alternatives on the basis of economic parameters that provide
an indication of the affordability of a control alternative relative to the source.” (NSR Manual at
p.B.31 (emphasis added).) To reject CCS, BACT requires a demonstration that the costs of
pollutant removal are disproportionately high for the specific facility compared to the cost of
control at other facilities. (NSR Manual, p.B.45.) No such CCS comparison was made here. The
Region merely stated that the cost of CCS would “more than double” the cost of the current
project. The Region must evaluate the incremental cost of CCS based on the amount of CO2
pollution that would be eliminated. It must then compare those costs to similar sources using that
control technology, such as Southern Company’s Kemper IGCC Plant, which is currently under
construction in Mississippi, and the Summit Texas Clean Energy Project. If those costs are not
disproportionately high at LPEC relative to other facilities, then there is no basis to reject CCS
due to economic impact.
Environmental (Water) and Energy Penalty Are Not Sufficiently d)
Supported.
The Region bases its rejection of CCS in part on the lack of available water:
The LPEC will utilize the effluent discharge from the local waste water
treatment facility to provide both the cooling water and the boiler make-up
water requirements. The local waste treatment facility currently processes
and discharges a daily average of seven million gallons of effluent. This
volume of effluent cannot support the daily water requirements of an F-
class natural gas fired combined cycle facility if equipped with CCS. The
water use for a combined cycle plant with CCS would be 7.6 - 9.5 million
gallons per day. The additional GHG emissions resulting from additional
fuel combustion would either further increase the cost of the CCS system,
if the emissions were also captured for sequestration, or reduce the net
amount GHG emission reduction, making CCS even less cost effective
than expected.
(SOB at p.12.) This analysis suffers from numerous flaws. It assumes that no other water is
available to satisfy the needs of the plant. The applicant must affirmatively demonstrate that it
cannot get water from any other source. Even if the water from the waste treatment facility is the
only source available, EPA should require consideration of a smaller facility that would demand
less water rather than eliminating the most effective control technology because of water supply
limitations. If the water supply at the chosen site is inadequate to accommodate effective
pollution controls, then the project should be down-sized or relocated so that the selected site
meets the needs of the project.
EPA Must Consider Partial CCS. e)
If a proper analysis of CCS demonstrates that water supply and cost warrant rejecting CCS as
a control technology, then EPA must consider the option of partial CCS, which would reduce the
amount of water required and would lower the cost. Partial CO2 capture results from applying
CCS only to a part of the unit’s CO2 emissions (a slip stream), or from capturing CO2 from some
but not all units at a plant. Partial capture allows a plant to maximize electrical output in peak
periods to increase revenue and limit CCS costs. It also reduces water requirements. The Region
must consider the option of partial CCS as part of the BACT analysis.

15
8. The Region Rejected Fugitive Emission Leak Detection and Repair
(LDAR) and Remote Sensing Without doing Site-Specific Analysis
Similar to its rejection of CCS discussed above, the Region improperly rejected the best
available technology for controlling natural gas fugitive emissions. The SOB identifies leak
detection and repair (LDAR) handheld analyzers and remote sensing technologies as the most
effective controls. The Region then considered the next level of control from as-observed audio,
visual, and olfactory (AVO). The SOB characterized AVO as “generally somewhat less effective
than instrument LDAR and remote sensing.” (SOB at p.24.) However, the Region does not
quantify this difference.
The Region’s rejection of LDAR and remote sensing does not comply with the required
BACT analysis. In the BACT Step 4 analysis, the Region rejects LDAR and remote sensing as
not “economically practicable” because of the costs of implementing the controls and relatively
small amount of GHG emissions from fugitive emissions compared to the entire facility. As
stated above regarding CCS, Step 4 of the BACT analysis considers the energy, environmental,
and economic impacts of each feasible control option. (NSR Manual, pp. B.26-B.53.) The
presumption is that the highest ranked feasible control technology is the basis for the BACT limit
unless there is a specific determination that cost and impacts borne by the specific source in
question are disproportionately higher than other sources in the same category.
The Region does not provide any incremental cost analysis or any analysis showing that
installing LDAR or remote sensing would be disproportionately expensive compared to other
facilities. The relative emissions reduction impact for controlling fugitive emissions compared to
controlling the plant-wide emissions of GHGs are irrelevant. BACT requires the maximum
degree of control from a technically feasible technology unless there is a demonstrated adverse
economic, energy or environmental impact. In this case, there is no evidence in the SOB or the
application indicating that installing and operating LDAR or remote sensing would cause
uniquely excessive costs at LPEC compared to other electric generating facilities. The Region
therefore has no basis to reject the most efficient and lowest GHG emitting technology based on
adverse economic impacts.
9. Upstream Natural Gas Drilling and Distribution in Area Produces
Associated Emissions
South Texas has recently experienced significant increases in crude oil and natural gas
production from the Eagle Ford Shale basin.46
LPEC is in the center of this large increase in
natural gas drilling and production. Figure 1 below shows the extent of the Eagle Ford Shale
basin, which includes the proposed LPEC site.
46
http://www.eia.gov/todayinenergy/detail.cfm?id=3770

16
Figure 1:47
In addition to the large-scale development of natural gas production, there is also significant
development of natural gas distribution pipelines for domestic use and for export occurring near
the proposed LPEC site. The following Figure 2 shows the substantial existing natural gas
pipelines and planned new developments for exports near the LPEC facility in Cameron County,
Texas.
47
http://www.eia.gov/analysis/studies/usshalegas/

17
Figure 2: 48
Air emissions from drilling operations are incredibly high. Wells, compressor stations,
venting and blow down operations, processing plants, and other operations related to this
substantial surge in development all contribute to GHG emissions and other pollutants. The
proposed LPEC plant and other new natural gas facilities are products of this major increase in
natural gas extraction and distribution. The Region must analyze in its PSD permitting process
the increased air pollution that will result from growth in upstream natural gas production and
distribution associated with increased natural gas use at LPEC. 42 USC 7475(a)(6). GHG
impacts from these upstream operations include significant methane emissions. Indeed,
petroleum and natural gas production, transmission and distribution are second only to power
plants as a source of GHG emissions.49
In addition, growth in natural gas production and
distribution associated with LPEC will result in increased emissions of volatile organic
compounds, fine particulate matter, and toxic air pollutants.
The Region should also consider these upstream emissions in its evaluation of alternatives to
the proposed project and in its analysis of CCS as BACT. 42 USC 7475(a)(2), (4). Requiring
CCS, either at the proposed location or at an alternative site closer to sequestration options, is
especially critical in view of the high life cycle GHG emissions associated with burning natural
gas for electricity
48
http://www.eia.gov/todayinenergy/detail.cfm?id=10351 49
http://ghgdata.epa.gov/ghgp/main.do

18
.
10. Solar Thermal Auxiliary Preheat Must be Considered in the BACT
Analysis
The application identified the Palmdale Hybrid Power Project, which included a 2-on-1
combined-cycle configuration with two GE 7FA gas turbines and one steam turbine producing a
nominal electrical output of 563 megawatts (MW), of which up to 50 MW is produced from a
solar thermal collection field.50
This project used the solar thermal auxiliary, in combination with
the HRSG, to power the steam generator. This hybrid configuration resulted in a much better
source-wide GHG emission rate because solar thermal energy displaced some of the duct firing
for the steam turbine. EPA Region 9 determined that the source-wide GHG BACT limit was 774
lb CO2/MWh.51
Another similar hybrid facility, the Victorville 2 plant, is a 563 MW facility that achieves a
thermal efficiency of 59.0 percent when using thermal solar hybrid technology to preheat water
(steam) to provide a supplement to the combustion turbine exhaust that flows to a HRSG that
feeds to the steam turbine. This configuration achieves a 6.3 percent gain in thermal efficiency
compared to the Victorville 2 plant with duct burners.52
It is also 9.1 percent higher than the
proposed LPEC heat rate of 49.9 percent.53
Several utilities in the United States are installing hybrid concentrated solar thermal
technology to increase generation and increase efficiency of fossil fuel power plants. The
concentrated solar provides a separate line of steam to the steam turbine to displace some of the
fossil fuel requirements. Such systems can decrease fuel use and thereby decrease emissions by
10 percent in a combined cycle power plant.
Further efficiency gains are possible by using the solar hybrid technology in place of duct
burning. The proposed LPEC plant’s duct burning element significantly reduces the systems’
overall efficiency. Duct burning is an inefficient method of generating a few additional units of
power, compared to the many other options for generating the same incremental power. For
example, at the proposed LPEC facility the steam generator will have supplemental duct firing of
up to 750 MMBtu/hr. This system results in a heat rate of 7,649 Btu/kWh for the Siemens SGT-
5000F(4) unit, which is not nearly as efficient as the rest of the proposed combined cycle plant.54
The Region’s BACT analysis did not consider the potential increase in efficiency achievable by
using a solar hybrid design configuration in place of duct burners.
Use of solar hybrid technology to increase capacity in the steam turbine could provide similar
generation capabilities as the proposed project without redefining the project and without
sacrificing the load shaping capabilities of the facility. Given the greater efficiencies identified at
the Palmdale and Victorville 2 facilities with the use of solar hybrid technology in lieu of duct
burners, the Region should include a solar hybrid configuration in its BACT analysis for LPEC.
50
Application for Prevention of Significant Deterioration Permit for Palmdale Hybrid Power Project, p.1-1
(available at: http://www.regulations.gov/#!documentDetail;D=the Region-R09-OAR-2011-0560-0002). 51
Revised Application, p.52. 52
See, Application for Prevention of Significant Deterioration Permit for Victorville 2 Hybrid Power Project
(available at: http://www.regulations.gov/#!documentDetail;D=EPA-R09-OAR-2008-0406-0001). 53
Revised Application, p.48. 54
Id. at p.50.

19
Absent site-specific considerations that preclude the use of solar hybrid technology, that
technology should be the basis for the BACT emission limit.
11. Total Annual Emissions Limits are Excessive
The Region sets the annual emissions limits based on operating LPEC at 100 percent duct
burner firing for 8,260 hours per year, and operating during maintenance, startup and shutdown
(MSS) for 500 hours per year. (SOB at pp.31-36, n.4.) The total combined operating hours are
therefore 8,760 hours per year, which is the entire year. This assumption means that the plant
would operate either at full load or at SSM for every single hour of the year. There would be not
be a single hour of down time. The SOB directly contradicts itself on this issue. In another part
of the analysis, the SOB rejects a comparison to lower permitted GHG emission rates at another
facility on the basis that the LPEC will not operate as a baseload unit: “LPEC will operate as a
load cycling unit.” (SOB at p.17.) The applicant cannot have it both ways. The Region cannot set
a weaker lb/MWh based on one set of assumptions while simultaneously allowing for constant
operation of the facility when setting the annual emission limits. The Region’s continuous
operation assumption also contradicts the requirement LPEC undergo periodic burner tuning as
part of a regularly scheduled maintenance program. (SOB at p.17.) Scheduled maintenance
outages would mean that the unit is offline and therefore cannot operate every hour in the year.
The annual operating hours assumption is clearly impractical and excessive. It unnecessarily
inflates the annual emissions limits.
The Region similarly errs by assuming 100 percent duct firing for the entire year (excluding
500 hours of MSS). As noted above, duct firing reduces the efficiency of the facility, and
therefore assuming constant duct firing at 100 percent does not ensure that emissions are
controlled to BACT levels during all operating hours. The draft permit includes an efficiency
adjustment based on the assumption that the installed supplemental duct burners would operate
at 100 percent capacity throughout all operating hours. This results in a calculation of emission
rates ranging between 909.2 to 934.5 lb CO2e/MWh. (SOB at p.16.) However, duct burners are
highly inefficient. They are not intended, and should not be permitted, to operate at 100 percent
for the entire year. Duct burners may serve a useful purpose in serving short-term peak demands
(although more efficient options are available), but they are not as efficient as combined-cycle
units. The Region must base its BACT determination for LPEC on the larger, higher-efficiency
CCGT, such as the larger units identified in Table 1. To the extent that duct burners are
permitted, the Region should set a separate annual hour of operation limit for duct burners at
LPEC with a capacity limit that reflects the reasonable system-wide operation. For example, if
one assumes a 10 percent capacity factor for duct burners, which represents the typical operation
of peaking units, then the adjustment for duct burning would result in an increase of only 3.5 to 7
lb CO2e /MWh for the proposed units over the emissions limit without duct burners. In contrast,
the draft permit’s increase of 35 to 70 lb CO2e /MWh is far too high and distorts the BACT rate
based on an operating scenario that will never happen.55
The Region must revise the draft permit
to reflect more realistic annual emission limits.
55
Sierra Club’s figure 2, above, is based on CAMD data that includes duct burning operations. As noted previously,
the actual reported emissions rates of those facilities (including duct burning) are within 10 percent of “new and
clean” estimates.
20
12. The Region Must Require LPEC to Meet BACT Emission Limits During
Maintenance, Startup and Shutdown
The Region fails to require LPEC to meet any GHG emission limit during MSS. Footnote 5
in Tables 1A-1C provides: “The BACT limit for combustion turbines does not apply during MSS
[sic].” (Draft Permit, §II; SOB at pp.16, 31-36.) The Region cannot summarily exempt LPEC
from GHG BACT limits during MSS. “[The permitting agency] must make an on-the-record
determination as to whether compliance with existing permit limitations is infeasible during
startup and shutdown, and, if so, what design, control, methodological or other changes are
appropriate for inclusion in the permit to minimize the excess emissions during these periods.”
Rockgen Energy Center, 8 E.A.D. 536, 544 (EAB 1999). There is no discussion in the SOB
about any impediments to meeting the GHG BACT limit during MSS. The blanket exemption
from meeting any GHG BACT limit during MSS therefore fails to comply with BACT
requirements. The Region must revise the draft permit to ensure that emissions are minimized to
the maximum extent achievable during periods of MSS.
Sierra Club appreciates the opportunity to provide these comments.
Sincerely,
/s/ Travis Ritchie____
Travis Ritchie
Associate Attorney
Sierra Club
85 Second Street, Second floor
San Francisco, CA 94105
(415) 977-5727


