JPL Document D-60326 Exoplanet Interferometry Technology Milestone #3 Report Broadband Starlight Suppression Demonstration Editors: R. D. Peters, R. O. Gappinger, P. R. Lawson, and O. P. Lay February 2, 2009 National Aeronautics and Space Administration Jet Propulsion Laboratory California Institute of Technology Pasadena, California
Broadband Starlight Suppression Demonstration Editors: R. D. Peters, R. O. Gappinger, P. R. Lawson, and O. P. Lay February 2, 2009 National Aeronautics and Space Administration Jet Propulsion Laboratory California Institute of Technology Pasadena, California
Released by ____________________________________________ _________________ Robert D. Peters, Adaptive Nuller Testbed Cog. E. ____________________________________________ _________________ Robert O. Gappinger, Achromatic Nulling Testbed Cog. E. Approved by ____________________________________________ _________________ Peter R. Lawson, Exoplanet Interferomery Technology Manager, JPL ____________________________________________ _________________ Michael Devirian Exoplanet Exploration Program Manager, JPL ____________________________________________ _________________ Zlatan Tsvetanov Exoplanet Exploration Program Scientist, NASA HQ ____________________________________________ _________________ Lia LaPiana Exoplanet Exploration Program Executive, NASA HQ
2.1.Adaptive Nuller.............................................................................................................22.2.Differences between Flight and Lab Demonstration .............................................5
3.1.Definitions .....................................................................................................................63.2.Measurement of the null..............................................................................................73.3.Milestone #3 Validation Procedure...........................................................................8
6.1.Fractional Bandwidth and Central Wavelength .....................................................106.2.Length and Timeline of Data Sets ...........................................................................126.3.Mean Null Depth........................................................................................................12
1. Objective This document reports the achievement of Exoplanet Interferometry Technology Milestone #3, a demonstration of broadband starlight suppression in the mid-infrared. We review the milestone specification from the Milestone Whitepaper (October 10, 2007), summarize the experiments per-formed in the Adaptive Nuller testbed, detail the procedures and analysis of the resulting data, and describe and present the data itself. For completeness, an appendix is included that documents the performance of the Achromatic Nulling Testbed.
2. Introduction The intent of this technology milestone was established in the TPF-I Technology Plan (JPL Pub. 05-5, June 2005) to gauge the developmental progress of the TPF-I project and its readiness to proceed from pre-Phase A to Phase A. Completion of this milestone is here documented by the Project, af-ter having been reviewed by the External Independent Readiness Board (EIRB), and approved by NASA Headquarters. The milestone described here addresses broadband starlight suppression. Milestone #3: Broadband Starlight Suppression
Using either the Adaptive Nuller or the Achromatic Nulling Testbed, demonstrate that mid-infrared light in the 7–12 µm range can be suppressed by a factor of ≥ 105 over a waveband of ≥ 25%. This demonstrates the approach to broadband starlight suppression (dimming of light across a range of wavelengths) needed to characterize terrestrial planets for habitability. Flight-like nulls are to be demonstrated at room (non-flight) temperature. Milestone TRL 5.
The 105 suppression requirement is sufficient to reduce the residual starlight photon rate to below the background level set by the local zodiacal emission. It is worthwhile noting that the Sun-Earth flux ratio is ~107 at 10 µm, and further noise rejection is necessary to achieve a detection. This addi-tional rejection is realized through a combination of phase chopping, the fact that the residual star-light is diluted over many pixels in the synthesized image, and the use of a spectral fitting technique that isolates the planet signal (Lay 2006). Although this additional rejection is not addressed by this Milestone, it will be demonstrated by the Planet Detection Testbed and is the subject of Milestone #4 (chopping and averaging) and Milestone #5 (spectral fitting). A two-beam nuller is the basic building block of all flight architectures that have been considered so far. Four approaches to achromatic phase shifting have been investigated at JPL, with the aim of demonstrating, through one of the approaches, two-beam nulling to a level of 1 part in 100,000 with a 25% bandwidth. These methods are as follows: (1) using pairs of dispersive glass plates to intro-duce a wavelength-dependent delay; (2) using a through-focus field-flip of the light in one arm of the interferometer; (3) using successive and opposing field-reversals on reflection off flat mirrors in a
periscope arrangement; and (4) through adaptive nulling. The first two methods were tested in the Achromatic Nulling Testbed (ANT) prior to 2006. The third approach was then commissioned for the ANT (using periscope mirrors) and was evaluated beginning in 2005. The fourth approach, adaptive nulling, was the subject of TPF-I Milestone #1 that demonstrated mid-infrared amplitude and phase compensation over a broad band. The Adaptive Nuller performed so well that a single-pixel detector was included in the testbed specifically for broad-band nulling experiments. Both the ANT and the Adaptive Nuller testbeds worked toward Milestone #3, which is the subject of this Report. The criteria of Milestone #3 were specifically drafted to allow either testbed to accomplish this Milestone; the Milestone would be deemed complete with the first qualifying results from either testbed, and it was not made mandatory that both testbeds arrive at the same perform-ance level. Although the ANT was originally designed with Milestone #3 specifically in mind, its performance was eventually surpassed by the Adaptive Nuller in May of 2007. The Adaptive Nuller seemed sufficiently promising that in February 2008 work with the ANT was halted, and the testbed was decommissioned. The results achieved by the ANT will appear in the journal Applied Optics as an experimental evaluation of mid-infrared achromatic phase shifters (Gappinger et al. 2009). A copy of the paper is attached in Appendix A. This Milestone Report presents the milestone data recorded with the Adaptive Nuller. The Adaptive Nuller was described in detail in the publication by Peters, Lay & Jeganathan (2008). It is only briefly reviewed here. Note that all of the designs under consideration for TPF-I include a single-mode spatial filter through which the combined light is passed before being detected. The wavefront from the star is incident on the collecting apertures of the instrument and delivered by the respective beam trains to a central beam combiner that couples the combined light into a single-mode filter. With just a single mode for each polarization state, the problem of nulling the on-axis light is simplified. Higher order wavefront aberrations that would reduce the visibility of the fringes (depth of the null) are rejected by the spatial filter. Small errors in tilt in each arm of the interferometer thus translate into small errors in received intensity. Nulling testbeds that use single-mode spatial filters need not adjust wavefront errors across each pupil, as these are rejected independently by the filter itself. For further information about the mid-infrared spatial filters to be used with TPF-I, the interested reader is re-ferred to Ksendzov et al. (2007) and Ksendzov et al. (2008).
2.1. Adaptive Nuller
The adaptive nuller uses a broadband thermal source to generate light with a spectral width > 3 µm centered at a wavelength of ~10 µm. This light is put through a simple interferometer with one arm holding the adaptive nuller components, and the other serving as a reference arm. There will be in-tensity and phase dispersion in this interferometer due to normal manufacturing tolerances which are compensated by the adaptive nuller. There is no achromatic phase shifter between the arms of the interferometer. The Adaptive Nuller introduces a half-wavelength delay (approximately 5 microns path difference) and adjusts the resid-ual path difference at each wavelength using the adaptive compensator. The adaptive nuller meas-ures the intensity and phase dispersion as a function of intensity and phase differences between the arms of the interferometer versus wavelength. From this measurement, the required adjustments to
the deformable mirror (DM) actuator are calculated and the correction is applied. Through an itera-tive process the intensity dispersion is corrected to ≤ 0.2% rms (1 σ) intensity difference between the arms. The phase dispersion is corrected so that it is ≤ 5nm rms (1 σ). The layout of the Adaptive Nuller is shown in Fig. 1. This layout was slightly modified for this mile-stone. A single-pixel detector was included at the output of the interferometer so that all the light, normally dispersed in a spectrometer, could be re-directed by a flip-mirror to be focused onto a sin-gle pixel for the measurement of a time-series of the null.
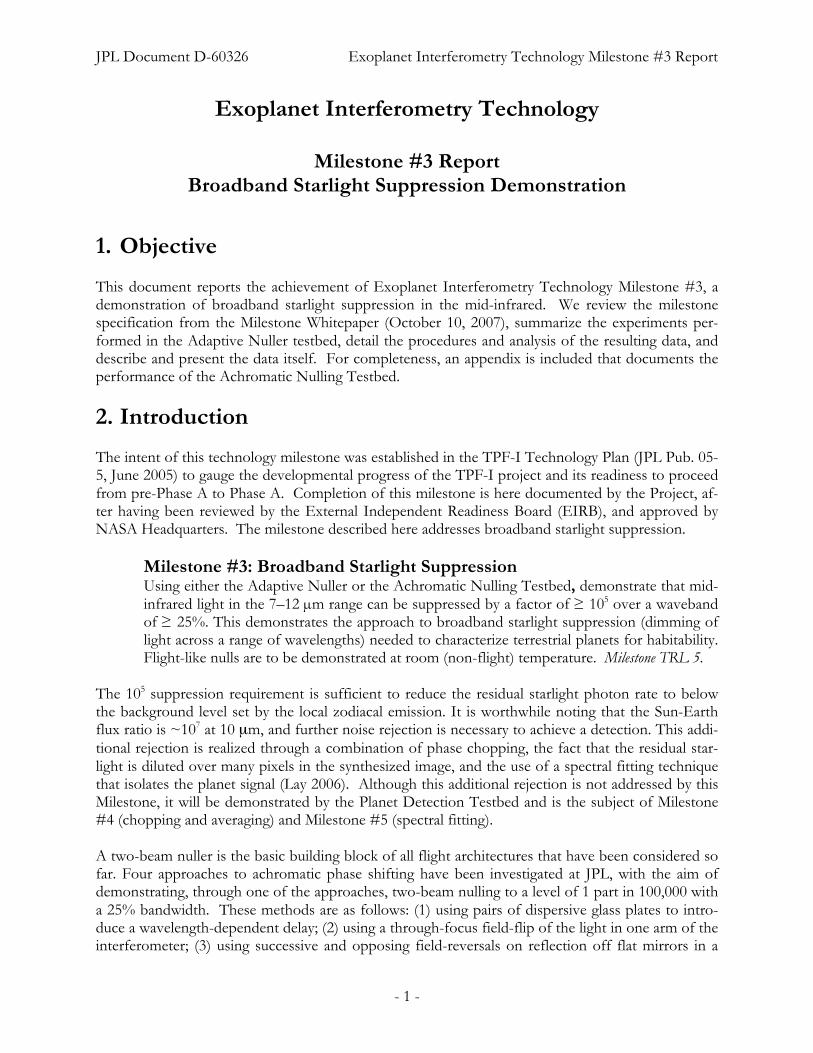
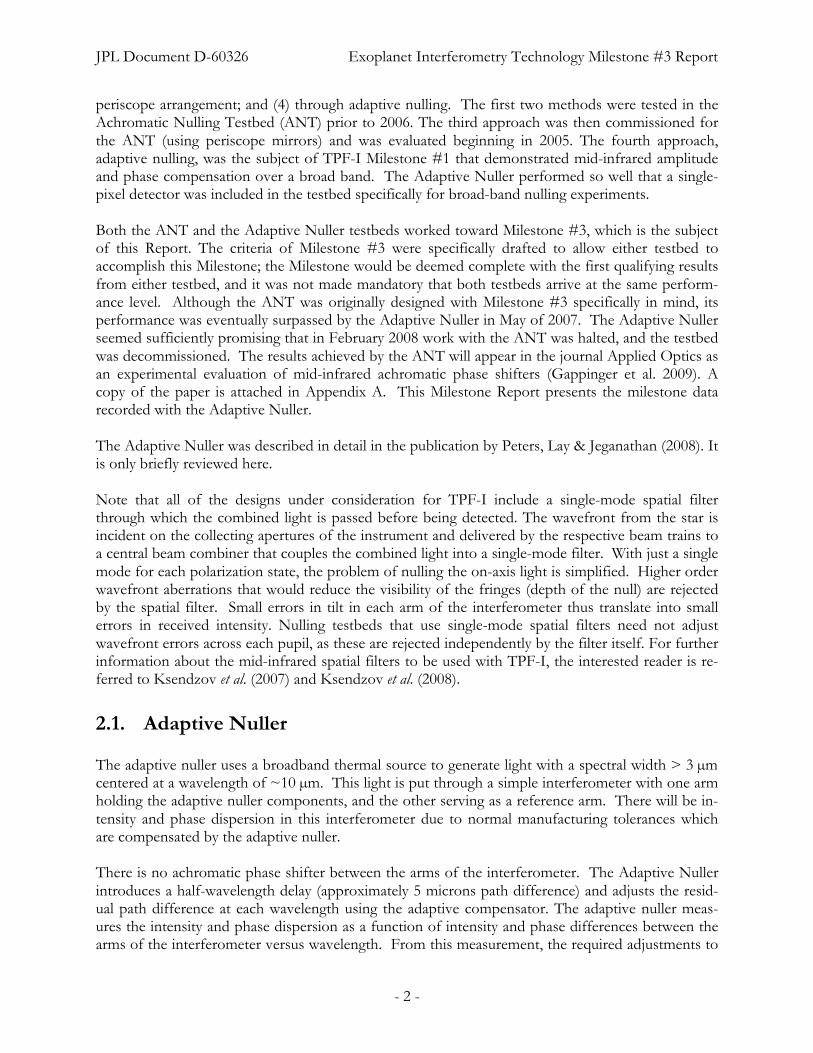
Figure 1: Layout of the Adaptive Nuller, showing the laser and thermal source, chopper wheel, beam splitter and beam combiner, as well as the delay line, the adaptive compensating arm (right, having a parabolic mirror with a deformable mirror at its focus), and the reference arm (left, having a parabolic mirror with only a flat mirror at its focus). The Single Mode Spatial Filter (SMSF) is shown prior to a grating and line detector. For this milestone, the above layout was slightly modified after the SMSF to include a flip-mirror that could redirect light to a single-pixel detector. The single-pixel detector was used to measure the broadband null depths that are the subject of this report. In addition, an acoustic enclosure was installed over the testbed to reduce the ambient acoustic noise. Such enclosures are used for industrial applications to either reduce the noise of loud equip-ment or provide a noise-isolated environment in which to work. Figures 2 and 3 show the Adaptive Nuller testbed before and after the installation of the enclosure. The enclosure provided more than 15 dB of acoustic noise suppression and improved the achievable rejection ratios (inverse of the null depth) from about 80,000:1 to slightly above 100,000:1. Although the null depths only exceeded the milestone requirement by a slim margin, they were extremely stable and repeatable. Of the nulling experiments that were conducted for this milestone, not a single experiment failed to meet the crite-ria because of the achievable null depth: an early attempt failed because a dewar warmed up 5.5 hours into the experiment, and one subsequent run failed because a circuit breaker tripped that pro-vided high-voltage to the DM.
Figure 2: View of the Adaptive Nuller prior to the installation of its acoustic enclosure (April 14, 2008).
Figure 3: View of the Adaptive Nuller after the installation of its acoustic enclosure (January 29, 2009). The enclosure was installed for this milestone and reduced the measured ambient acoustic noise by more than 15 dB. The testbed PI, Robert Peters, is shown in the foreground. The enclosure was manufactured by DB Engineering.
2.2. Differences between Flight and Lab Demonstration
Based on discussions from past Milestone reviews, we note here several important differences be-tween the lab demonstrations and the baselined flight implementation: 2 beams vs. 4 beams, space-craft dynamics, air vs. cryo-vacuum, and the source intensity. Each is addressed briefly below.
2 beams vs 4 beams: The baseline array configuration for TPF-I combines 4 beams to form the null. This is implemented in two stages: pair-wise nulling followed by cross-combination of the two nulled beams. Since all the nulling occurs at the first stage, the two-beam broadband lab demonstra-tions of the Achromatic Nulling Testbed and the Adaptive Nuller provide a meaningful representa-tion of achievable flight performance. Four-beam combination will be demonstrated in the lab with the Planet Detection Testbed. Spacecraft dynamics: A control system is required in flight to stabilize the beams against motions of the spacecraft. It is assumed that the tip/tilt, optical path difference, and shear of each beam is stabilized at the input to the nuller. The lab demonstration has active path length control only. The active stabilization of 4 beams is demonstrated in the Planet Detection Testbed. Polarization: In the case of the Adaptive Nuller, the flight system will split the two linear polariza-tion states and correct each independently. The Adaptive Nuller lab demonstration operates on un-polarized light without splitting the components, and therefore has fewer degrees of freedom to make a correction. Cryo-vacuum: The flight system operates in vacuum at low temperature (~ 40 K), compared to the ambient air environment of the lab demonstration. The lab is a more challenging disturbance envi-ronment, and the room temperature thermal background is a significant source of noise in the ex-periment. Future engineering will have to address the need for a cryogenic Deformable Mirror (DM) in a version of the Adaptive Nuller that will operate in vacuum at low temperature, as well as the need for cryovacuum compatible pathlength control and dispersion compensation. Other aspects of the design, including the cryogenic stability of the periscope monolith, may also be investigated.
Table 1. Comparison of Flight Requirements with Pre-Phase A Testbed Specifications and Actuals
Parameter Flight Performance
Achromatic Nulling Tesbed1,2
Planet Detection Testbed
Adaptive Nuller3
Null depth 1 × 10⁻⁵ 1 × 10⁻⁵ 1 × 10⁻⁵ 1 × 10⁻⁵
Amplitude control 0.13% Derived 0.12% 0.2% (static)
Phase control 1.5 nm Derived 2 nm 5 nm (static)
Stability timescale 50,000 s + 21,600 s 5,000 s 21,600 s
1 The Milestone #3 criteria are listed here: mean null ≤ 1 × 10⁻⁵, bandwidth ≥ 25% (with actual bandwidth of the testbed noted in parentheses), measurements to span ≥ 6-hour.
2 The final results from the Achromatic Nulling Testbed are given in the paper by Gappinger et al. (2009). 3 The Milestone #1 criteria are listed here (with actual bandwidth noted in parentheses). Further details can be found in the
paper by Peters et al. (2008). Note the specifications of the Adaptive Nuller are compatible with the Milestone #3 criteria.
Source intensity: The broadband sources in the lab provide a higher photon flux than the target stars to be observed by the mission. This is offset by the higher detector readout noise in the lab. The goal of this milestone is to demonstrate the fundamental broadband null depth that can be achieved, which is independent of the source intensity. If a 10–5 null is measured with the bright lab source, then the same null would be obtained if the source brightness were suddenly reduced to the level expected from a typical star—but it then wouldn’t be measurable in the presence of lab detec-tor noise and the room-temperature background.
3. Milestone Procedure: Adaptive Nuller
3.1. Definitions
Milestone #3, the broadband starlight suppression demonstration, requires measurement of the null depth or rejection ratio in an interferometer. In the following paragraphs we define the terms in-volved in this process, spell out the measurement steps, and specify the data products. 3.1.1. “Star”. We define the “star” to be a 75 µm diameter pinhole illuminated with ceramic
heater thermal source with a temperature of 1250–1570 K. This “star” is the only source of light in the optical path of the adaptive nuller. It is a stand-in for the star signal that would have been collected by the telescope systems in TPF-I; however it is not intended to simu-late any particular collector design or expected flux.
3.1.2. “Dispersion”. We define dispersion to be the difference in either amplitude or phase as a function of wavelength between the two arms of an interferometer.
3.1.3. “Algorithm”. We define the “algorithm” to be the computer code that takes as input the measured amplitude and calculated phase dispersion, and produces as output a voltage value to be applied to each element of the DM, with the goal of reducing the dispersion.
3.1.4. “Cross coupling”. We define cross coupling to be the unintended adjustment of phase while amplitude is being corrected or the unintended adjustment of amplitude while phase is being corrected.
3.1.5. “Monochromatic source”. We define a monochromatic source to be a carbon dioxide laser with an operating wavelength near 10 µm with narrow spectral line width that is co-aligned with the “star” source. As we are only able to control dispersion, we do not expect to achieve a null deeper than the null obtained with this source.
3.1.6. “Active metrology”. We define active metrology as a system which uses a laser at 1.3 µm wavelength to measure the difference in optical paths of the two arms of the interferometer. This information is then fed back to the delay line control to maintain a set path difference.
3.1.7. “Spectrometer”. We define a spectrometer to be a device to measure intensity as a func-tion of wavelength. The device consists of a grating to disperse the incoming light. The dispersed light is then focused by an off-axis parabola onto a linear mercury cadmium tellu-
ride array with 16 elements. Each element produces a voltage proportional to the intensity in a wavelength range selected by the grating. The output voltages are then sent through a multiplexer to a lock-in amplifier with an integration time set from 100 ms to 30 s depending on the signal level. The output of the lock-in amplifier is then read by the computer for each element of the linear array. Noise may be reduced by averaging up to 10 frames taken from the spectrometer.
3.1.8. “Single Pixel Detector”. We define the single-pixel detector to be a single mercury cad-mium telluride detector, which can be used in parallel with the spectrometer. A pick-off mirror placed before the grating directs the undispersed light from the single mode spatial filter to be focused on this detector.
3.1.9. “Adaptive nulling”. We define the process of adaptive nulling to be the following 4 step process, iteratively repeated for as many cycles as necessary to reach the desired level of am-plitude and phase dispersion. a) Measure the intensity dispersion in the interferometer by measuring the intensity spectrum of each arm independently while shuttering off the other arm. b) Compute the required tilts to equalize the intensity difference in each channel of the de-formable mirror (DM) and apply these voltages. c) Calculate the phase dispersion in the interferometer by actuating the delay line several fringes off the null and measuring the dispersed spectral fringes with the spectrometer and applying an algorithm to the output. d) Compute the required piston settings to equalize the path lengths in each channel of the DM and apply these voltages.
3.1.10. “Null Depth”. We define the null depth to be the ratio of the peak signal caused by con-structive interference in the interferometer to the null signal caused by destructive interfer-ence in the interferometer.
3.1.11. “Rejection Ratio”. We define the rejection ratio to be the inverse of the null depth.
3.2. Measurement of the null
Each null measurement is obtained as follows after intensity and phase correction have been ap-plied: 3.2.1. The delay line is actuated by the computer to locate the approximate position of the mini-
mum integrated power as measured on the single pixel detector. 3.2.2. The delay line is then actuated by the computer to the peak integrated power. The set point
is slowly scanned on the active metrology to locate the peak. The peak integrated power is used to normalize the null depth.
3.2.3. The delay line is then actuated by the computer back to the null. 3.2.4. The metrology set point is then slowly scanned by the computer to find the minimum inte-
grated power as measured on the single-pixel detector.
3.2.5. The active metrology system can then be used to hold this position to measure the time evo-
lution of the null.
3.3. Milestone #3 Validation Procedure
3.3.1. All DM actuators are set to half their control range. 3.3.2. The active metrology system and the star are turned on. The delay line is then actuated by
the computer to locate the null position. 3.3.3. An initial uncorrected null is measured as described in Sec. 3.2. 3.3.4. The delay line is actuated away from the null by several fringes and adaptive nulling is per-
formed to correct the measured intensity dispersion to ≤ 0.2% and correct the measured phase dispersion to ≤ 5nm.
3.3.5. The delay line is actuated by the computer to locate the null position. 3.3.6. The corrected null is measured as described in Sec. 3.2 3.3.7. To measure the stability, step 3.3.6 is repeated while the DM voltages are held constant and
the active metrology holds the delay line position to measure the time evolution of the null. 3.3.8. The following data are to be archived for future reference: (a) raw spectrometer output of
null and peak of star before and after correction, (b) phase and intensity dispersion before and after correction, and (c) raw output of the null and peak measured at each time interval after correction.
3.3.9. The following data are to be presented in the final report: (a) Plot showing peak and null as
a function of wavelength before and after correction, (b) plot of time series of null depth. 3.3.10. Repeat steps 3.3.1–3.3.7 on two more occasions on different days, with at least 48 hours be-
tween each demonstration.
4. Success Criteria The following is a statement of the 3 elements that must be demonstrated to close Milestone #3. Each element includes a brief rationale. The success criteria are common to both the Achromatic Nulling Testbed and the Adaptive Nuller. However, the Milestone criteria need only be met by one of the two testbeds in order to close the Milestone. 4.1 A null depth measured over a fractional bandwidth of ∆λ/λ ≥ 25%, where the central wave-
length, λ, lies in the range 7 µm < λ < 12 µm. Rationale: The bandwidth is large enough to give confidence that a small number of instruments would be necessary to cover the full TPF-I science band of 7–18 µm.
4.2 A time series showing mean null depth to be less than or equal to 1× 10⁻⁵ observed in single
or dual-polarization light for a 6 hour period. The mean null depth is defined as the average measured power at the null fringe over a contiguous 6 hour time period. The data from which the average is estimated will be a continuous data set, without gaps, that spans at least a 6-hour period. Although the null depth may be allowed to exceed 1× 10⁻⁵ for long peri-ods, the average as measured over the entire 6 hours must be less than or equal to 1× 10⁻⁵. The brightness of the experimental source need not be representative of a typical stellar source. The room temperature will be monitored but not controlled beyond the facility con-trols for the room.
Rationale: The null depth to be demonstrated is the flight requirement and would allow planet signal extraction when methods of instability noise compensation are employed. As this milestone emphasizes broadband performance, a sin-gle-polarization measurement is sufficient; dual-polarization performance, if not demonstrated here, will be addressed in a subsequent milestone. The null depth is independent of the source brightness, and thus there is no requirement im-posed for the use of representative light levels for this milestone. A representative science observation would require an array rotation period of 50,000 s (~14 hrs), and thus the time-series duration of 6 hrs demonstrates long-term stabil-ity of the system, approaching flight-level requirements. 4.3 Elements 4.1 – 4.2 must be satisfied simultaneously on three separate occasions with at least
48 hours between each demonstration. Rationale: This provides evidence of the repeatability of the broadband starlight suppression.
5. Certification Process
The Project will assemble a milestone certification data package for review by the EIRB. In the event of determination that the success criteria have been met, the project will submit the finding of the review board, together with the certification data package, to NASA HQ for official certification of milestone compliance. In the event of disagreement between the project and the EIRB, NASA HQ will determine whether to accept the data package and certify compliance or request additional work.
5.1. Certification Data Package
The milestone certification data package will contain the following explanations, charts, and data products. 5.1.1. A narrative report, including a discussion of how each element of the milestone was met, an
explanation of each plot or group of plots, appropriate tables and summary charts, and a narrative summary of the overall milestone achievement.
5.1.2. Although the body of the report will document the performance of the testbed that met the
milestone requirements, the report will also include an appendix to document the perform-ance of the other testbed. This appendix is not included as part of the success criteria, but is for completeness and information only.
6. Lab Results Here we describe how each element of the milestone was met, with an explanation of the data ob-tained, analysis of the data, and a narrative summary of the overall milestone achievement.
6.1. Fractional Bandwidth and Central Wavelength
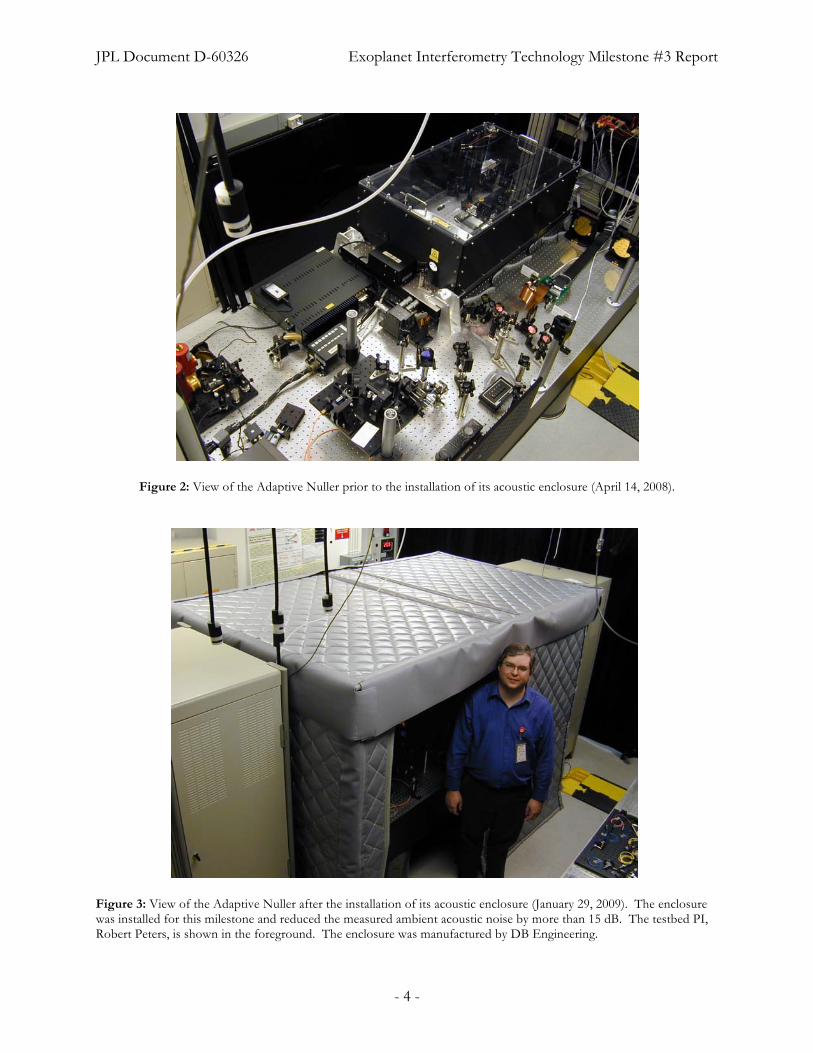
Requirement 4.1 (see Section 4.1) states the minimum fractional bandwidth, ∆λ/λ, and central wave-length, λ, that will be used for the experiments. The spectra shown in Figure 4 have been measured with and without a calibrated filter. This demonstrates the response across the 16 pixels on the line detector used for the adaptive compensation of amplitude and phase. The filter is used here as a reference only. When the experiments were conducted, there were no filters in place.
Figure 4: Measured intensity as a function of wavelength without a filter (blue open circles) and with a 1. 3 micron FWHM bandwidth filter (green open diamonds). The details of the reference filter are given in Figure 5. The above plot shows the response of the 16 pixels on the line detector used for adaptive compensation. The FWHM of the “No filter” bandwidth used for the experiments spans a wavelength range of 8.2 microns to 11.6 microns, with a central wavelength of 9.9 microns. This corresponds to a fractional bandwidth of 34% centered at λ = 9.9 micron, demonstrat-ing that the fractional bandwidth and central wavelength criteria have been met by the experiment.
When the nulling experiments were conducted, the light was re-directed to a single-pixel detector used to measure null depth. As shown in Fig. 4, the “No filter” spectrum peaks with an intensity of ~7.3. The Full-Width at Half Maximum (FWHM), measured at an intensity level of ~3.7, spans a wavelength range from 8.2–11.6 µm (3.4 µm bandwidth) with a central wavelength of 9.9 µm. The “No filter” response was the bandwidth actually used for the experiments. The FWHM of 3.4 µm and central wavelength of 9.9 µm correspond to a fractional bandwidth of 34%. The fractional bandwidth of 34% is greater than 25%, and central wavelength of λ = 9.9 µm is within the range of 7 µm < λ < 12 µm. The fractional bandwidth and central wavelength thus meet Requirement 4.1 (Section 4.1). It should be noted as well that no polarizing filters were used in these experiments.
6.2. Length and Timeline of Data Sets
Requirement 4.2 (see Section 4.2) states the required duration of the tests. Requirement 4.3 (see Section 4.3) states the required time line over which the nulling experiments are to be conducted. Table 2 indicates the times when data was taken and the total duration of each experiment. The data sets each have a duration longer than 6 hours. More than 48 hours elapses between data sets. The duration of the tests and their time-line thus meets the requirements as stipulated in 4.2 and 4.3.
Table 2. Acquisition dates and times for the three sets of measurements.
Data Set Date Start End Duration
1 12/10/2008 6:07 pm 12:18 am (12/11/2008) 6:11
2 01/09/2009 6:12 pm 12:20 am (01/10/2009) 6:08
3 01/15/2009 6:18 pm 12:22 am (01/16/2009) 6:04
6.3. Mean Null Depth
Requirement 4.2 (see Section 4.2) also states the success criteria for null depth to be demonstrated. Requirement 4.2 states that the mean null depth, measured as the average over an entire 6-hour data set, must be less than or equal to 1× 10⁻⁵. We show here that this requirement has been met.
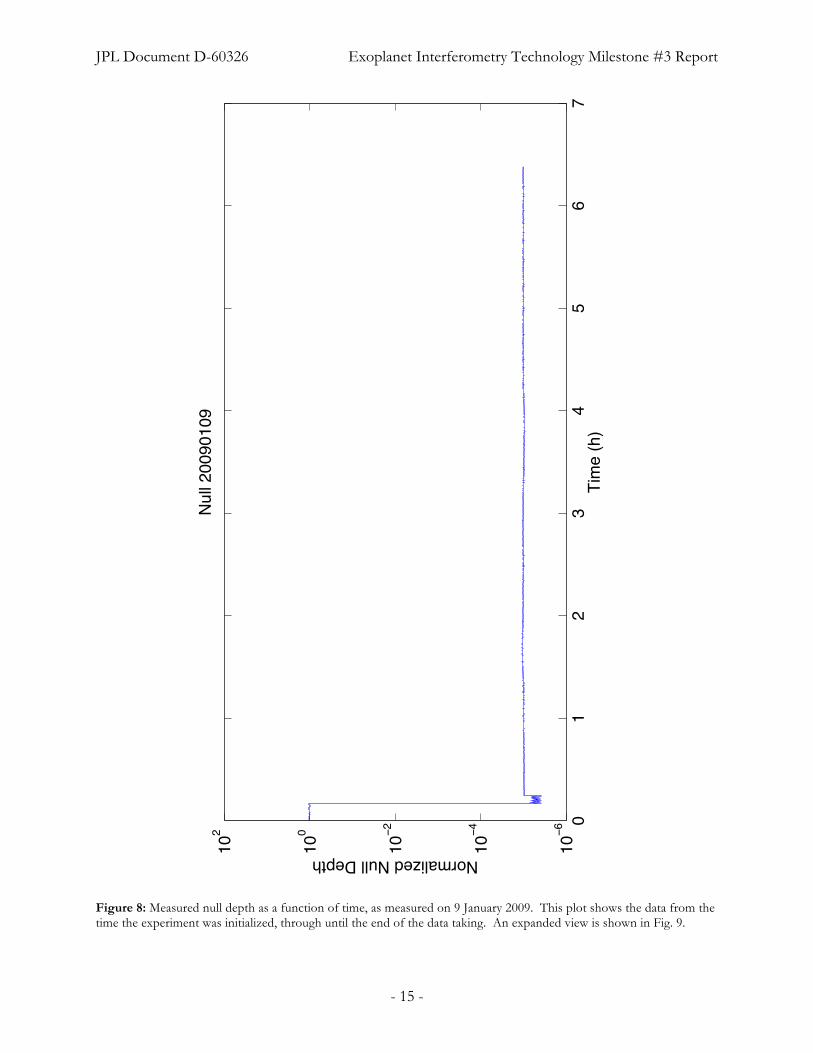
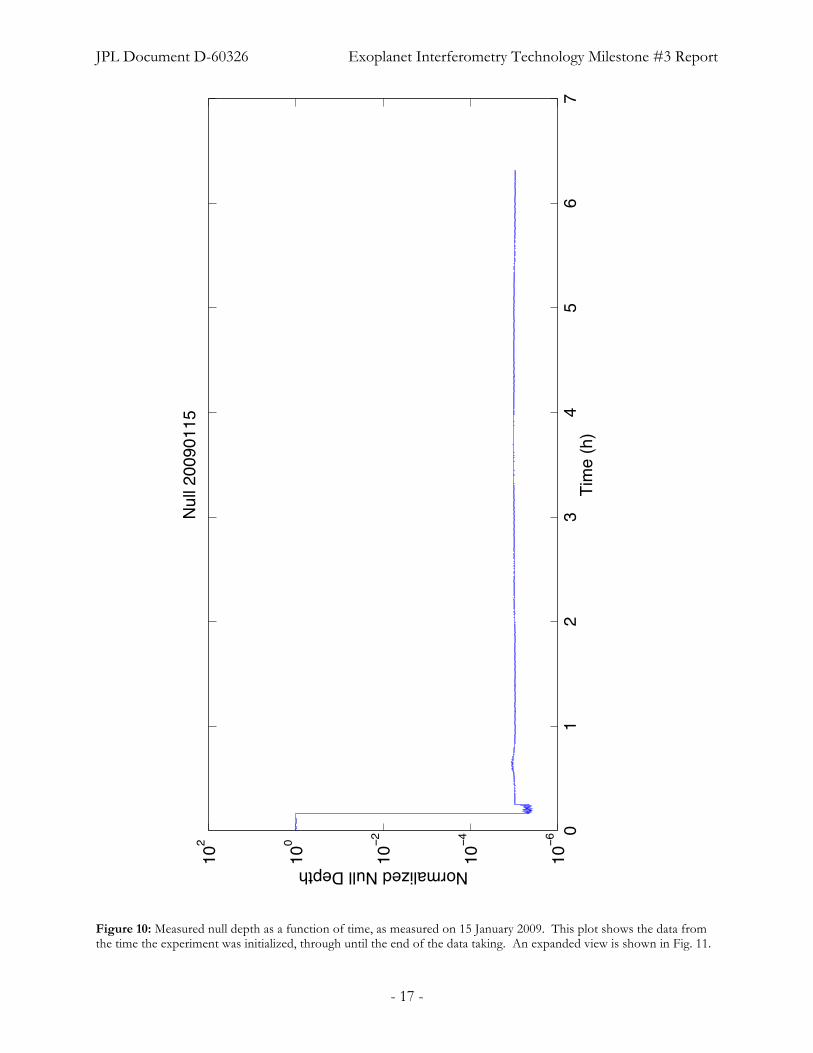
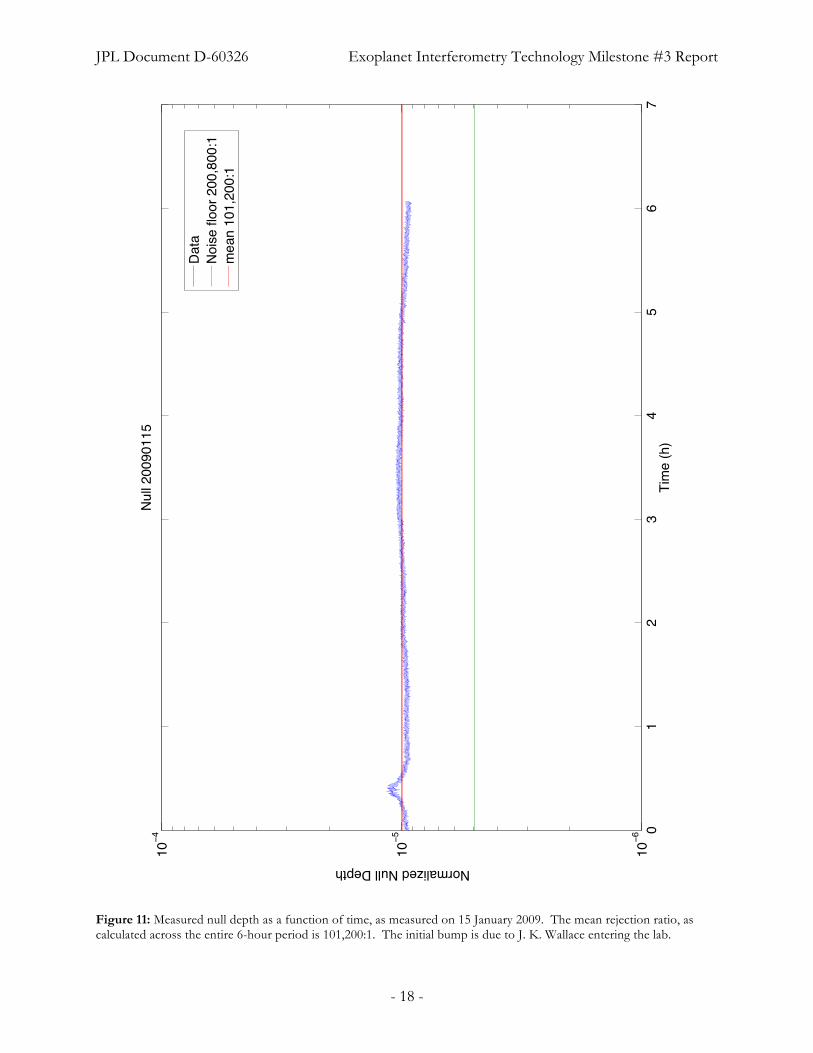
Figure 6 to Figure 11 show plots of the null depth measured as a function of time for data sets 1, 2, and 3. Data set 1 is shown in Figures 6 & 7. Data set 2 is shown in Figures 8 & 9. Data set 3 is shown in Figures 10 & 11. In each case the data is shown twice to illustrate the full scale of the null, but to also show fine variations in null depth at the level of 1 × 10⁻⁵. It should be noted that the performance of the Adaptive Nuller only slightly exceeds the performance called out for in the Mile-stone criteria. Thus, in each plot the null depth is on average less than 1 × 10⁻⁵, but for long peri-ods also rises above that level. The criteria states that the average as measured across the entire 6-hour data set must be less than 1× 10⁻⁵; this level of performance has indeed been demonstrated in each case.
Figure 6: Measured null depth as a function of time, as measured on 10 December 2008. This plot shows the data from the time the experiment was initialized, through until the end of the data taking. The data begin with a measurement of the reference level (at 1 × 100), then a measurement of the noise floor with both shutters off (the dip below 1 × 10⁻⁵), then both shutters open and the nulling data are recorded. An expanded view of the subsequent data is shown in Fig. 7.
Figure 7: Measured null depth as a function of time, as measured on 10 December 2008. The origin of the time axis (t = 0) is shifted from Fig. 6. The mean rejection ratio, as calculated across the entire 6-hour period is 100,800:1.
Figure 8: Measured null depth as a function of time, as measured on 9 January 2009. This plot shows the data from the time the experiment was initialized, through until the end of the data taking. An expanded view is shown in Fig. 9.
Figure 9: Measured null depth as a function of time, as measured on 9 January 2009. The mean rejection ratio, as calcu-lated across the entire 6-hour period is 101,000:1.
Figure 10: Measured null depth as a function of time, as measured on 15 January 2009. This plot shows the data from the time the experiment was initialized, through until the end of the data taking. An expanded view is shown in Fig. 11.
Figure 11: Measured null depth as a function of time, as measured on 15 January 2009. The mean rejection ratio, as calculated across the entire 6-hour period is 101,200:1. The initial bump is due to J. K. Wallace entering the lab.
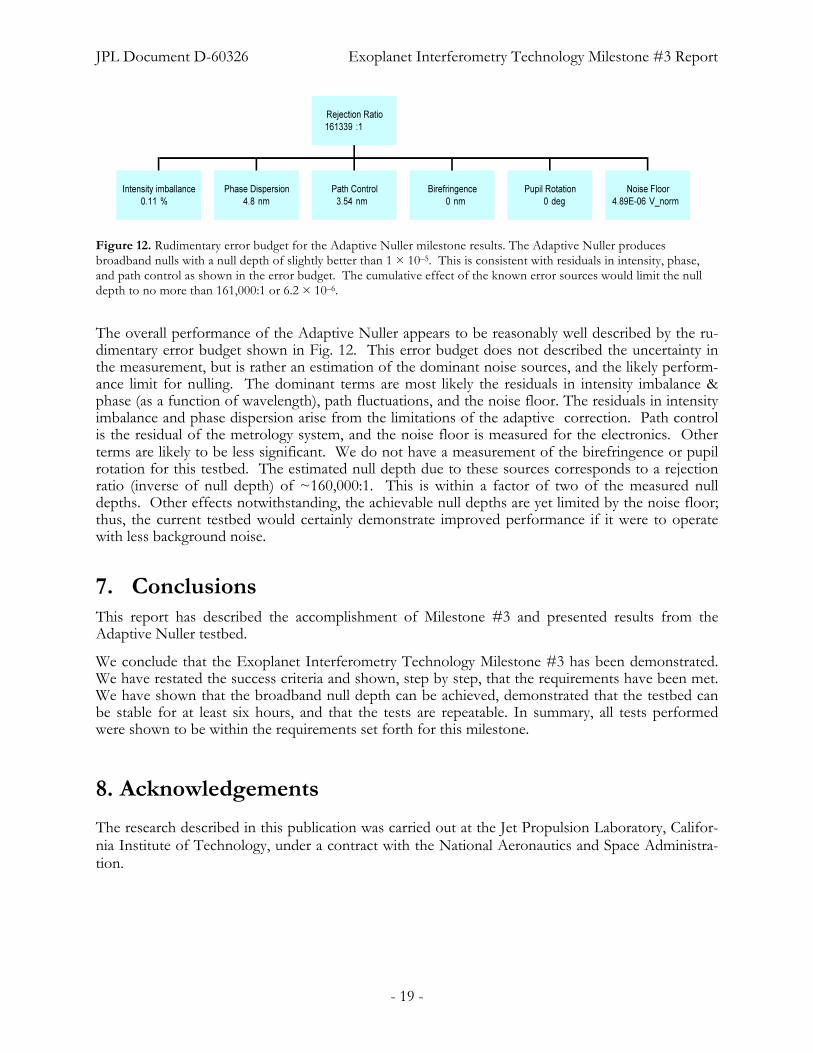
Figure 12. Rudimentary error budget for the Adaptive Nuller milestone results. The Adaptive Nuller produces broadband nulls with a null depth of slightly better than 1 × 10⁻⁵. This is consistent with residuals in intensity, phase, and path control as shown in the error budget. The cumulative effect of the known error sources would limit the null depth to no more than 161,000:1 or 6.2 × 10⁻⁶.
The overall performance of the Adaptive Nuller appears to be reasonably well described by the ru-dimentary error budget shown in Fig. 12. This error budget does not described the uncertainty in the measurement, but is rather an estimation of the dominant noise sources, and the likely perform-ance limit for nulling. The dominant terms are most likely the residuals in intensity imbalance & phase (as a function of wavelength), path fluctuations, and the noise floor. The residuals in intensity imbalance and phase dispersion arise from the limitations of the adaptive correction. Path control is the residual of the metrology system, and the noise floor is measured for the electronics. Other terms are likely to be less significant. We do not have a measurement of the birefringence or pupil rotation for this testbed. The estimated null depth due to these sources corresponds to a rejection ratio (inverse of null depth) of ~160,000:1. This is within a factor of two of the measured null depths. Other effects notwithstanding, the achievable null depths are yet limited by the noise floor; thus, the current testbed would certainly demonstrate improved performance if it were to operate with less background noise.
7. Conclusions This report has described the accomplishment of Milestone #3 and presented results from the Adaptive Nuller testbed.
We conclude that the Exoplanet Interferometry Technology Milestone #3 has been demonstrated. We have restated the success criteria and shown, step by step, that the requirements have been met. We have shown that the broadband null depth can be achieved, demonstrated that the testbed can be stable for at least six hours, and that the tests are repeatable. In summary, all tests performed were shown to be within the requirements set forth for this milestone.
8. Acknowledgements
The research described in this publication was carried out at the Jet Propulsion Laboratory, Califor-nia Institute of Technology, under a contract with the National Aeronautics and Space Administra-tion.
R. O. Gappinger, R.T. Diaz, A. Ksendzov, P. R. Lawson, O. P. Lay, K. M. Liewer, F. M. Loya, S. R. Martin, E. Serabyn, and J. K. Wallace, “Experimental evaluation of achromatic phase shifters for mid-infrared starlight suppression,” Appl. Opt. 48, 868–880 (2009).
A. Ksendzov, O. Lay, S. Martin, J. S. Sanghera, L. E. Busse, W. H. Kim, P. C. Pureza, V. Q. Nguyen, and I. D. Aggarwal, “Characterization of mid-infrared single mode fibers as model filters,” Appl. Opt. 46, 7957–7962 (2007).
A. Ksendzov, T. Lewi, O. P. Lay, S. R. Martin, R. O. Gappinger, P. R. Lawson, R. D. Peters, S. Sha-lem, A. Tsun, and A. Katzir, “Model filtering for midinfrared nulling interferometry using single mode silver halide fibers,” Appl. Opt. 47, 5728–5735 (2008).
P. R. Lawson and J. A. Dooley, Editors, Technology Plan for the Terrestrial Planet Finder Interferometer, JPL Pub 05-5 (Jet Propulsion Laboratory: Pasadena, CA, 2005). http://planetquest.jpl.nasa.gov/Navigator/library/tpfI414.pdf
P. R. Lawson, R. O. Gappinger, R. D. Peters, and O. P. Lay, “TPF-I Technology Milestone #3 Whitepaper: Broadband Starlight Suppression Demonstration,” JPL, Pasadena, CA, October 10, 2007. http://planetquest.jpl.nasa.gov/TPF-I/TPF-I_M3_WhitepaperFinalSignatures.pdf
O. P. Lay, “Removing instability noise in nulling interferometers”, Proc. SPIE 6268, 62681A (2006)
R. D. Peters, O. P. Lay, M. Jeganathan, “Broadband phase and intensity compensation with a de-formable mirror for an interferometric nuller,” Appl. Opt. 47, 3920–3926 (2008).
Appendix A: Results from the Achromatic Nulling Testbed
The Milestone #3 Whitepaper stipulated that the certification data package include an appendix to document the performance of the other testbed. The main body of the report has documented the performance of the Adaptive Nuller. This appendix documents the performance of the Achromatic Nulling Testbed (ANT). This appendix is not included as part of the success criteria, but is for completeness and information only.
Included here is a reprint copy of the paper
R. O. Gappinger et al. “Experimental evaluation of achromatic phase shifters for mid-infrared star-light suppression,” Appl. Opt. 48, 868–880 (2009).
The paper details the performance of the ANT and includes an error budget for single-polarization measurements with the periscope (field-flip using flat mirrors) phase shifter. The paper is repro-duced by permission of the Optical Society of America.
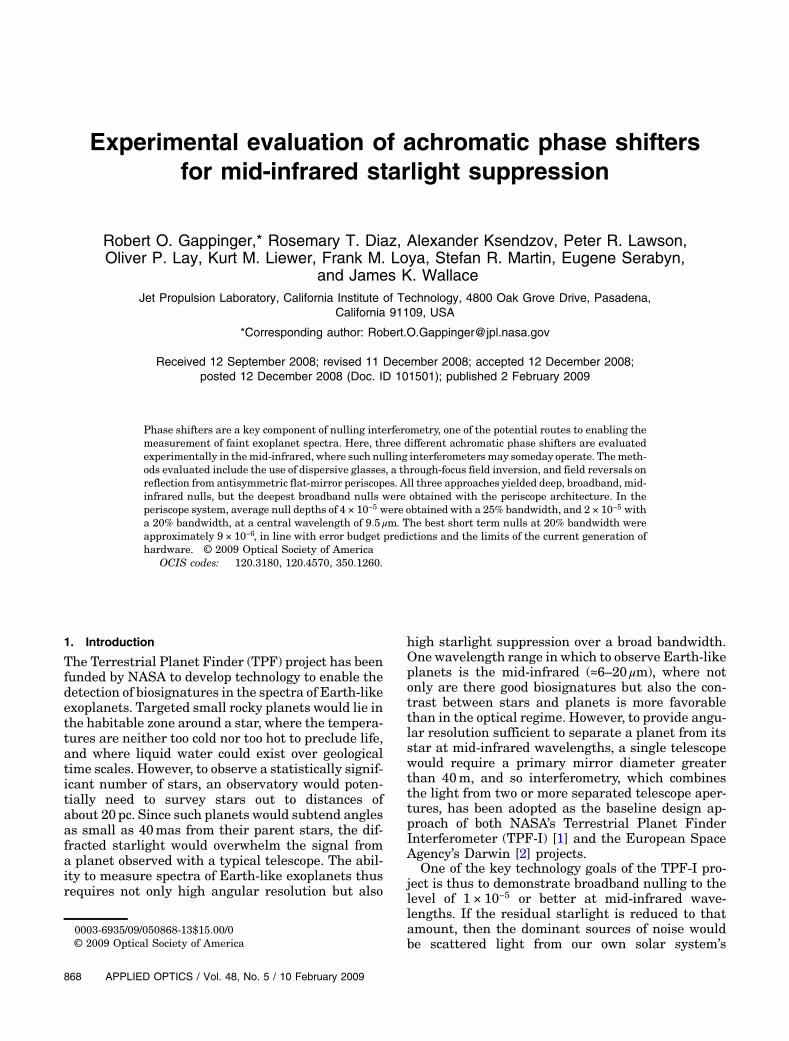
Experimental evaluation of achromatic phase shiftersfor mid-infrared starlight suppression
Robert O. Gappinger,* Rosemary T. Diaz, Alexander Ksendzov, Peter R. Lawson,Oliver P. Lay, Kurt M. Liewer, Frank M. Loya, Stefan R. Martin, Eugene Serabyn,
and James K. WallaceJet Propulsion Laboratory, California Institute of Technology, 4800 Oak Grove Drive, Pasadena,
The Terrestrial Planet Finder (TPF) project has beenfunded by NASA to develop technology to enable thedetection of biosignatures in the spectra of Earth-likeexoplanets. Targeted small rocky planets would lie inthe habitable zone around a star, where the tempera-tures are neither too cold nor too hot to preclude life,and where liquid water could exist over geologicaltime scales. However, to observe a statistically signif-icant number of stars, an observatory would poten-tially need to survey stars out to distances ofabout 20pc. Since such planets would subtend anglesas small as 40mas from their parent stars, the dif-fracted starlight would overwhelm the signal froma planet observed with a typical telescope. The abil-ity to measure spectra of Earth-like exoplanets thusrequires not only high angular resolution but also
high starlight suppression over a broad bandwidth.One wavelength range in which to observe Earth-likeplanets is the mid-infrared (≈6–20 μm), where notonly are there good biosignatures but also the con-trast between stars and planets is more favorablethan in the optical regime. However, to provide angu-lar resolution sufficient to separate a planet from itsstar at mid-infrared wavelengths, a single telescopewould require a primary mirror diameter greaterthan 40m, and so interferometry, which combinesthe light from two or more separated telescope aper-tures, has been adopted as the baseline design ap-proach of both NASA’s Terrestrial Planet FinderInterferometer (TPF-I) [1] and the European SpaceAgency’s Darwin [2] projects.
One of the key technology goals of the TPF-I pro-ject is thus to demonstrate broadband nulling to thelevel of 1 × 10⁻⁵ or better at mid-infrared wave-lengths. If the residual starlight is reduced to thatamount, then the dominant sources of noise wouldbe scattered light from our own solar system’s
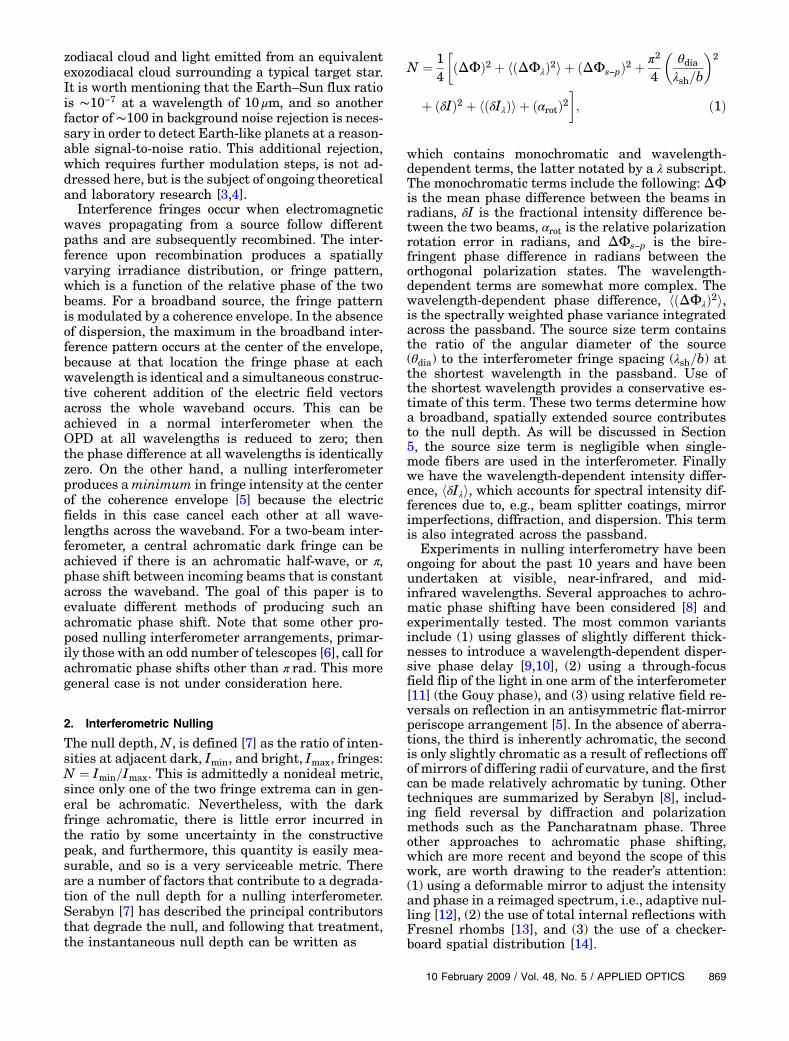
zodiacal cloud and light emitted from an equivalentexozodiacal cloud surrounding a typical target star.It is worth mentioning that the Earth–Sun flux ratiois ∼10−7 at a wavelength of 10 μm, and so anotherfactor of∼100 in background noise rejection is neces-sary in order to detect Earth-like planets at a reason-able signal-to-noise ratio. This additional rejection,which requires further modulation steps, is not ad-dressed here, but is the subject of ongoing theoreticaland laboratory research [3,4].Interference fringes occur when electromagnetic
waves propagating from a source follow differentpaths and are subsequently recombined. The inter-ference upon recombination produces a spatiallyvarying irradiance distribution, or fringe pattern,which is a function of the relative phase of the twobeams. For a broadband source, the fringe patternis modulated by a coherence envelope. In the absenceof dispersion, the maximum in the broadband inter-ference pattern occurs at the center of the envelope,because at that location the fringe phase at eachwavelength is identical and a simultaneous construc-tive coherent addition of the electric field vectorsacross the whole waveband occurs. This can beachieved in a normal interferometer when theOPD at all wavelengths is reduced to zero; thenthe phase difference at all wavelengths is identicallyzero. On the other hand, a nulling interferometerproduces aminimum in fringe intensity at the centerof the coherence envelope [5] because the electricfields in this case cancel each other at all wave-lengths across the waveband. For a two-beam inter-ferometer, a central achromatic dark fringe can beachieved if there is an achromatic half-wave, or π,phase shift between incoming beams that is constantacross the waveband. The goal of this paper is toevaluate different methods of producing such anachromatic phase shift. Note that some other pro-posed nulling interferometer arrangements, primar-ily those with an odd number of telescopes [6], call forachromatic phase shifts other than π rad. This moregeneral case is not under consideration here.
2. Interferometric Nulling
The null depth, N, is defined [7] as the ratio of inten-sities at adjacent dark, Imin, and bright, Imax, fringes:N ¼ Imin=Imax. This is admittedly a nonideal metric,since only one of the two fringe extrema can in gen-eral be achromatic. Nevertheless, with the darkfringe achromatic, there is little error incurred inthe ratio by some uncertainty in the constructivepeak, and furthermore, this quantity is easily mea-surable, and so is a very serviceable metric. Thereare a number of factors that contribute to a degrada-tion of the null depth for a nulling interferometer.Serabyn [7] has described the principal contributorsthat degrade the null, and following that treatment,the instantaneous null depth can be written as
N ¼ 14
�ðΔΦÞ2 þ hðΔΦλÞ2i þ ðΔΦs−pÞ2 þ
π24
� θdiaλsh=b
�2
þ ðδIÞ2 þ hðδIλÞi þ ðαrotÞ2�; ð1Þ
which contains monochromatic and wavelength-dependent terms, the latter notated by a λ subscript.The monochromatic terms include the following: ΔΦis the mean phase difference between the beams inradians, δI is the fractional intensity difference be-tween the two beams, αrot is the relative polarizationrotation error in radians, and ΔΦs−p is the bire-fringent phase difference in radians between theorthogonal polarization states. The wavelength-dependent terms are somewhat more complex. Thewavelength-dependent phase difference, hðΔΦλÞ2i,is the spectrally weighted phase variance integratedacross the passband. The source size term containsthe ratio of the angular diameter of the source(θdia) to the interferometer fringe spacing (λsh=b) atthe shortest wavelength in the passband. Use ofthe shortest wavelength provides a conservative es-timate of this term. These two terms determine howa broadband, spatially extended source contributesto the null depth. As will be discussed in Section5, the source size term is negligible when single-mode fibers are used in the interferometer. Finallywe have the wavelength-dependent intensity differ-ence, hδIλi, which accounts for spectral intensity dif-ferences due to, e.g., beam splitter coatings, mirrorimperfections, diffraction, and dispersion. This termis also integrated across the passband.
Experiments in nulling interferometry have beenongoing for about the past 10 years and have beenundertaken at visible, near-infrared, and mid-infrared wavelengths. Several approaches to achro-matic phase shifting have been considered [8] andexperimentally tested. The most common variantsinclude (1) using glasses of slightly different thick-nesses to introduce a wavelength-dependent disper-sive phase delay [9,10], (2) using a through-focusfield flip of the light in one arm of the interferometer[11] (the Gouy phase), and (3) using relative field re-versals on reflection in an antisymmetric flat-mirrorperiscope arrangement [5]. In the absence of aberra-tions, the third is inherently achromatic, the secondis only slightly chromatic as a result of reflections offof mirrors of differing radii of curvature, and the firstcan be made relatively achromatic by tuning. Othertechniques are summarized by Serabyn [8], includ-ing field reversal by diffraction and polarizationmethods such as the Pancharatnam phase. Threeother approaches to achromatic phase shifting,which are more recent and beyond the scope of thiswork, are worth drawing to the reader’s attention:(1) using a deformable mirror to adjust the intensityand phase in a reimaged spectrum, i.e., adaptive nul-ling [12], (2) the use of total internal reflections withFresnel rhombs [13], and (3) the use of a checker-board spatial distribution [14].
Monochromatic null depths between roughly 1 ×10⁻⁷ and 1 × 10⁻⁶ have been demonstrated usinglaser light at visible [4,15,17] and mid-infrared [16]wavelengths. At near-infrared wavelengths nullshave been achieved between 1 × 10⁻⁶ and 1 × 10⁻⁵
using diode lasers with bandwidths of up to about5% [18,19]. Wider bandwidth nulling interferometershave attained null depths between 1 × 10⁻⁵ and1 × 10−3; see, for example, Refs. [16,20–23]. Recently,Samuele et al. [15] demonstrated an almost 1 × 10⁻⁶
null at visible wavelengths with a bandwidth of 15%.The goals of the work described in this paper were totest and compare the three techniques listed abovefor achromatic phase shifters at mid-infrared wave-lengths, including both performance and ease ofsetup, alignment, and use, aiming at achievingbroadband null depths at roughly the 1 × 10⁻⁵ levelcurrently envisioned as necessary for TPF-I.
3. Achromatic Nulling Testbed
The Achromatic Nulling Testbed (ANT) was de-signed to explore the three different methods ofachieving an achromatic π phase shift describedabove in a single laboratory space. The dispersiveglass plates and through-focus methods were thesubject of experimental work at JPL prior to 2006,and the dispersive plates method is the techniqueused in the Keck nuller [4,16,24–26]. The resultsof that research are summarized only briefly belowbecause much of that work was published earlier.Subsequent work has been devoted to the periscopeapproach, which is describedmore fully in the sectionthat follows. A comparison of the results from the dif-ferent achromatic phase shifting techniques is givenin Table 1.
A. Testbed Overview
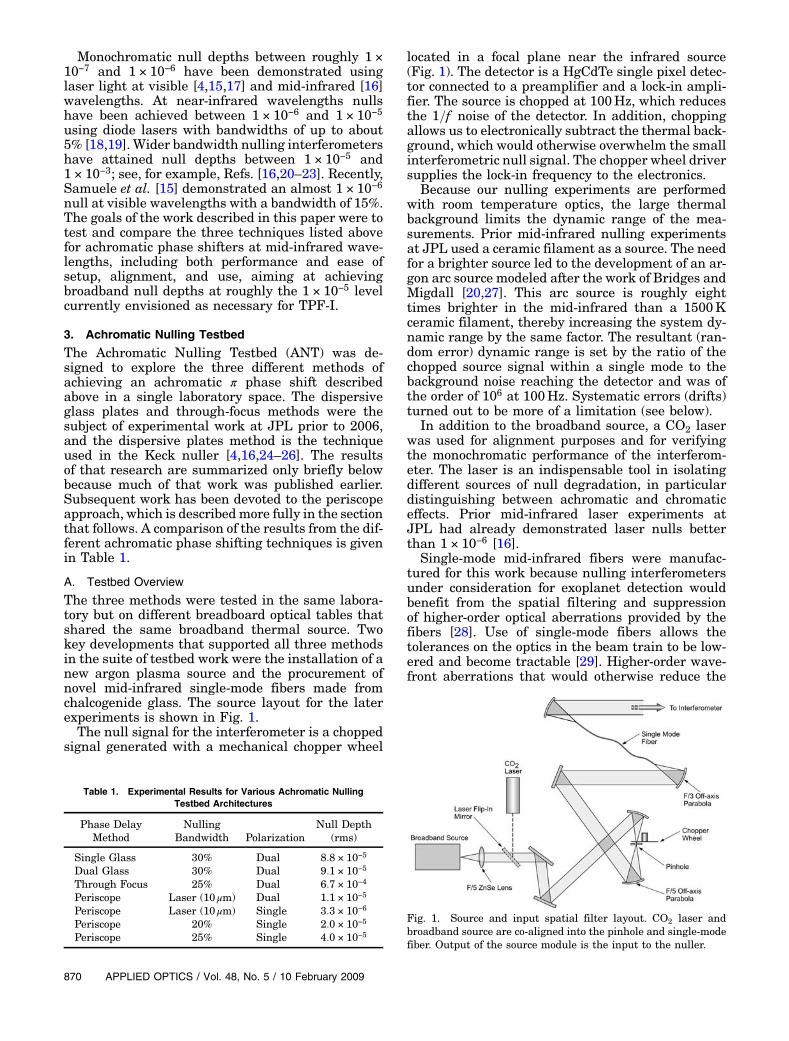
The three methods were tested in the same labora-tory but on different breadboard optical tables thatshared the same broadband thermal source. Twokey developments that supported all three methodsin the suite of testbed work were the installation of anew argon plasma source and the procurement ofnovel mid-infrared single-mode fibers made fromchalcogenide glass. The source layout for the laterexperiments is shown in Fig. 1.The null signal for the interferometer is a chopped
signal generated with a mechanical chopper wheel
located in a focal plane near the infrared source(Fig. 1). The detector is a HgCdTe single pixel detec-tor connected to a preamplifier and a lock-in ampli-fier. The source is chopped at 100Hz, which reducesthe 1=f noise of the detector. In addition, choppingallows us to electronically subtract the thermal back-ground, which would otherwise overwhelm the smallinterferometric null signal. The chopper wheel driversupplies the lock-in frequency to the electronics.
Because our nulling experiments are performedwith room temperature optics, the large thermalbackground limits the dynamic range of the mea-surements. Prior mid-infrared nulling experimentsat JPL used a ceramic filament as a source. The needfor a brighter source led to the development of an ar-gon arc source modeled after the work of Bridges andMigdall [20,27]. This arc source is roughly eighttimes brighter in the mid-infrared than a 1500Kceramic filament, thereby increasing the system dy-namic range by the same factor. The resultant (ran-dom error) dynamic range is set by the ratio of thechopped source signal within a single mode to thebackground noise reaching the detector and was ofthe order of 106 at 100Hz. Systematic errors (drifts)turned out to be more of a limitation (see below).
In addition to the broadband source, a CO2 laserwas used for alignment purposes and for verifyingthe monochromatic performance of the interferom-eter. The laser is an indispensable tool in isolatingdifferent sources of null degradation, in particulardistinguishing between achromatic and chromaticeffects. Prior mid-infrared laser experiments atJPL had already demonstrated laser nulls betterthan 1 × 10⁻⁶ [16].
Single-mode mid-infrared fibers were manufac-tured for this work because nulling interferometersunder consideration for exoplanet detection wouldbenefit from the spatial filtering and suppressionof higher-order optical aberrations provided by thefibers [28]. Use of single-mode fibers allows thetolerances on the optics in the beam train to be low-ered and become tractable [29]. Higher-order wave-front aberrations that would otherwise reduce the
Table 1. Experimental Results for Various Achromatic NullingTestbed Architectures
Phase DelayMethod
NullingBandwidth Polarization
Null Depth(rms)
Single Glass 30% Dual 8:8 × 10⁻⁵
Dual Glass 30% Dual 9:1 × 10⁻⁵
Through Focus 25% Dual 6:7 × 10⁻⁴
Periscope Laser (10 μm) Dual 1:1 × 10⁻⁵
Periscope Laser (10 μm) Single 3:3 × 10⁻⁶
Periscope 20% Single 2:0 × 10−5
Periscope 25% Single 4:0 × 10−5
Fig. 1. Source and input spatial filter layout. CO2 laser andbroadband source are co-aligned into the pinhole and single-modefiber. Output of the source module is the input to the nuller.
visibility of the fringes (depth of the null) are rejectedby the spatial filter. Moreover, errors in tilt in eacharm of the interferometer are translated into smallerrors in received intensity, which are relativelystraightforward to correct. The experiments de-scribed in this paper make use of single-mode chal-cogenide fibers developed for the TPF-I project andtested by Ksendzov et al. [29]. For all three versionsof the testbed, the output light from the single-modefiber is collimated by an off-axis parabolic mirror toprovide a 25mm diameter input source beam for thenuller (Fig. 1).To minimize vibrations and unwanted path length
fluctuations, the achromatic phase shifters and inter-ferometers were vibrationally isolated using multi-ple levels of isolation. Each interferometer wasbuilt on an optical breadboard that sat on passiveair-filled isolators supported on an optical table.The optical table was floated on compressed-air filledisolation legs. These table legs rested on an isolationpad built into the floor of the laboratory, which has aseparate foundation from the rest of the building. Inorder to minimize acoustic vibrations and the effectsof room air flow, each interferometer was surroundedby a plexiglas housing that was supported from thefloor of the laboratory. This housing enclosed eachinterferometer without contacting it. Acoustic vibra-tions that might otherwise interfere with the mea-surements were therefore transmitted to the floor.Finally, note that deep nulling requires a high de-
gree of symmetry, which is most easily achieved byusing a beam combiner based on a reversed pair ofbeam splitters, in, e.g., a modified Mach–Zehnderconfiguration [6,7]. However, such an arrangementdoes lead to somewhat increased complexity, andto somewhat lower signal levels (individual signalsare a factor of 2 lower in the case of an extra50=50 beam splitter). On the other hand, since ina laboratory interferometric testbed the source itselffirst needs to be split in two to provide two equivalentinput beams, it is possible to make use of the neces-sary source beam splitter to provide a simplified la-boratory arrangement. In this case the first beamsplitter is used to split the source beam, and a re-versed beam splitter is used to recombine the beams.This combination of beam splitters of course definesa normal Mach–Zehnder configuration and thus pro-duces exactly the same effect as a modified Mach–Zehnder beam combiner would, i.e., each combiningbeam sees one beam splitter reflection and one beamsplitter transmission. Thus, the desired symmetry ismaintained with this simpler system, and so it is pos-sible to make use of a normal Mach–Zehnder config-uration in the laboratory with no loss of fidelity.
1. Dielectric Phase Shifters
The first implementation of dispersive phase correc-tors used a single pair of ZnSe plates to introduce aquasi-achromatic dispersive phase delay. This workfollowed on the previous experience obtained during
development of the nulling combiner of the Keck in-terferometer [20,21]. The nulling bandwidth for thisapproach is limited by the wavelength dependence ofthe phase delay. Experimental results gave rms nulldepths of 8:8 × 10⁻⁵, which were within approxi-mately a factor of 3 of the 3:7 × 10⁻⁵ theoretical limitfor a 3-μm bandwidth centered at 10:0 μm [24].
The successful results obtained using a single-glass dispersive phase delay led to the constructionof a dual-glass phase delay architecture [26] as seenin Fig. 2. The overall balancing of chromatic effectsobtained using two glasses can extend the π phaseshift over a larger bandwidth, or provide a deepernull depth over a narrower bandwidth. The challengefor the dual-glass architecture is the increased com-plexity involved in optimizing the differential thick-nesses of the two glasses. The solution space for twoglasses allows very deep nulling over a large range ofglass thicknesses but requires fine thickness adjust-ment in one glass [30]. Thickness adjustments assmall as 100nm are needed to optimize the null.
The dual-glass phase shifter used motorized rota-tion stages to turn ZnSe and ZnS plates (Fig. 3) ofapproximately 15mm thickness with a 2 arcminwedge. The wedge prevents parasitic fringes due tothe Fabry–Perot effect in a plane parallel plate.The optimal thickness differences were calculatedwith lens design software to give minimum OPD be-tween two beams over the chosen passband. The op-timal differential thicknesses for ZnSe and ZnS overour 25% passband centered at 9:5 μm are 454.03 and172:48 μm, respectively. The results vary slightly(�0:5 μm thickness difference) depending on the op-timization method chosen. Thickness measurementsof the glass plates were made using a laser metrologysystem with submicrometer accuracy [31], showing athickness difference near optimal for ZnSe of449:0 μm but a poorer match of 144:9 μm for ZnS.The plate rotation required to compensate the thick-ness error in ZnS was over 7°. This introduced apolarization-dependent intensity imbalance due toFresnel reflection effects and decreased the thick-ness adjustment resolution, which is angularlydependent. In addition, deviation from normal inci-dence introduces beam shear as the glass thicknessis adjusted. This beam shear contributes to beamintensity mismatch when coupled into single-modefiber, thus degrading the null depth.
Theoretical calculations predicted that an idealdual-glass compensator could produce deeper nullsfor a given bandwidth than a single glass. However,this testbed achieved results only comparable to pre-vious single-glass experiments (see Table 1), likelydue to the nonideal thickness of the ZnS plates,and the consequent need to rotate the glass platesto nonoptimal angles. The beam shear, glassthickness, and polarization issues can be avoidedby using pairs of opposed laterally translatablewedges of glass, as in the case of the Keck interfero-meter nuller [32], but as this would double the num-ber of glass elements, it has not yet been employed in
our laboratory testbed work. It is also possible to im-plement the two-glass solution with two opposingwedges of different materials [19], but this has notbeen implemented here.
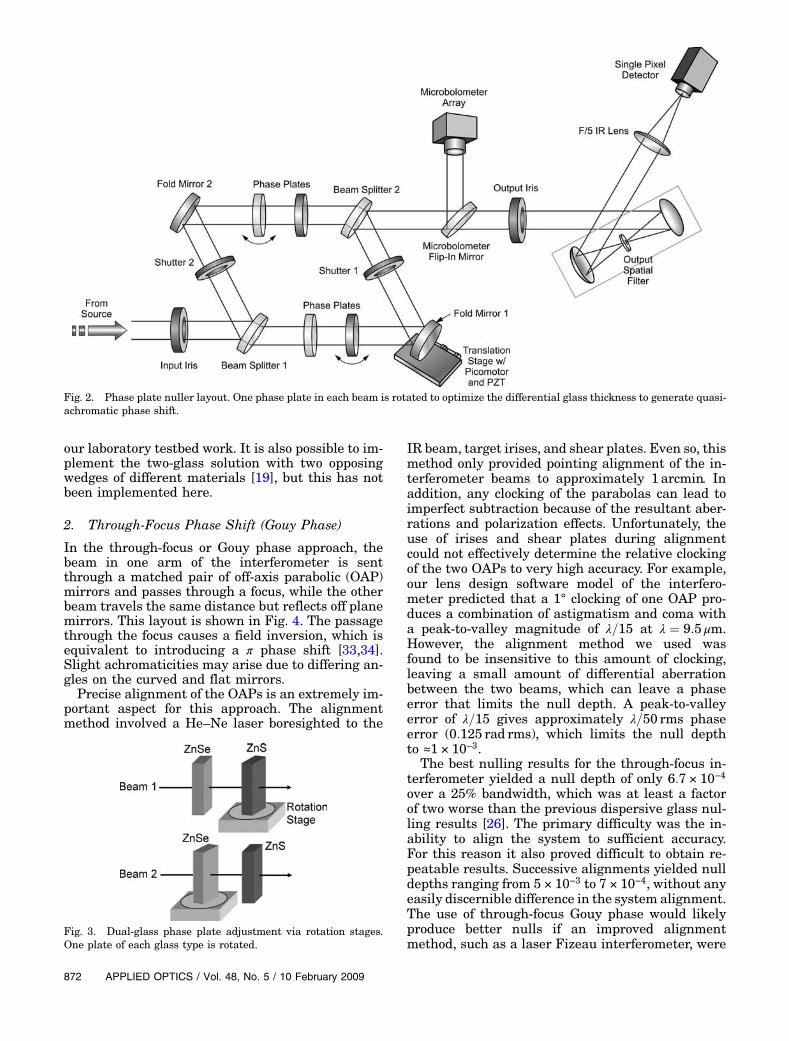
2. Through-Focus Phase Shift (Gouy Phase)
In the through-focus or Gouy phase approach, thebeam in one arm of the interferometer is sentthrough a matched pair of off-axis parabolic (OAP)mirrors and passes through a focus, while the otherbeam travels the same distance but reflects off planemirrors. This layout is shown in Fig. 4. The passagethrough the focus causes a field inversion, which isequivalent to introducing a π phase shift [33,34].Slight achromaticities may arise due to differing an-gles on the curved and flat mirrors.Precise alignment of the OAPs is an extremely im-
portant aspect for this approach. The alignmentmethod involved a He–Ne laser boresighted to the
IR beam, target irises, and shear plates. Even so, thismethod only provided pointing alignment of the in-terferometer beams to approximately 1 arcmin. Inaddition, any clocking of the parabolas can lead toimperfect subtraction because of the resultant aber-rations and polarization effects. Unfortunately, theuse of irises and shear plates during alignmentcould not effectively determine the relative clockingof the two OAPs to very high accuracy. For example,our lens design software model of the interfero-meter predicted that a 1° clocking of one OAP pro-duces a combination of astigmatism and coma witha peak-to-valley magnitude of λ=15 at λ ¼ 9:5 μm.However, the alignment method we used wasfound to be insensitive to this amount of clocking,leaving a small amount of differential aberrationbetween the two beams, which can leave a phaseerror that limits the null depth. A peak-to-valleyerror of λ=15 gives approximately λ=50 rms phaseerror (0:125 rad rms), which limits the null depthto ≈1 × 10⁻³.
The best nulling results for the through-focus in-terferometer yielded a null depth of only 6:7 × 10⁻⁴
over a 25% bandwidth, which was at least a factorof two worse than the previous dispersive glass nul-ling results [26]. The primary difficulty was the in-ability to align the system to sufficient accuracy.For this reason it also proved difficult to obtain re-peatable results. Successive alignments yielded nulldepths ranging from 5 × 10⁻³ to 7 × 10⁻⁴, without anyeasily discernible difference in the system alignment.The use of through-focus Gouy phase would likelyproduce better nulls if an improved alignmentmethod, such as a laser Fizeau interferometer, were
Fig. 2. Phase plate nuller layout. One phase plate in each beam is rotated to optimize the differential glass thickness to generate quasi-achromatic phase shift.
Fig. 3. Dual-glass phase plate adjustment via rotation stages.One plate of each glass type is rotated.
implemented. It is also possible that longer focallength OAPs might reduce the sensitivity to misa-lignment, and thereby improve the achievable nulldepths.
4. Periscope Phase Shifter and Nuller
The periscope phase shifter [5] has no powered opticsin the arms of the interferometer and is therefore ea-sier to align. The phase shift is accomplished throughan electric field flip (or pupil inversion) of one pupilrelative to the other within an antisymmetric peri-scopelike arrangement of mirrors, as shown in Fig. 5.The periscope layout is fully antisymmetric, and be-cause of the geometric nature of the field flip, the πphase shift is intrinsically achromatic for matchedoptical trains. Our field inversion periscope is com-posed of four mirrored prisms optically bonded to asingle glass block, referred to here as the periscopemonolith. Because this approach yielded the bestresults, we now discuss it in more detail.
A. Input and Output Optics
The periscope nuller used single-mode spatial filtersboth at the input and the output. Each spatial filteris composed of two OAP mirrors with a single-modemid-infrared fiber made from chalcogenide glass inbetween. The single-mode chalcogenide fiber has acore diameter of 23 μm and a cladding diameter of170 μm. Characterization of the fibers was done atJPL by Ksendzov et al. [29]. As shown in Fig. 1, anOAP mirror focuses light from the broadband sourceonto the single-mode fiber and the output of this fiber
is collimated using another OAP. The first spatial fil-ter is used at the interferometer input to provide abroadband artificial star that is spatially coherent(i.e., an unresolved point source). This input fiberis not strictly required, although it greatly simplifiesthe alignment tolerances by reducing sensitivity tobeam shear. The beam is then steered into the nulleras shown labeled “From Source” in Figs. 6 and 7.
The CO2 laser and arc sources, which were com-mon to all ANT layouts, were effectively co-alignedbymeans of injection into the same single-mode fiber.This guarantees that the laser and broadbandsources are injected into the interferometer identi-cally. The second spatial filter is implemented at
Fig. 4. Through-focus nuller layout. Matched focal length parabolic mirrors provide the mechanism for the Gouy phase shift.The microbolometer array is used to view the infrared beam during alignment.
Fig. 5. Electric field (pupil) inversion in the periscope nullingarchitecture.
the output of the interferometer. This additionalchalcogenide fiber filters the wavefronts in the com-bined beam. Tilt errors between the interferometerarms are converted to an intensity mismatch whenthe beams are coupled into the single-mode fiberat the output.
B. Mach–Zehnder Interferometer
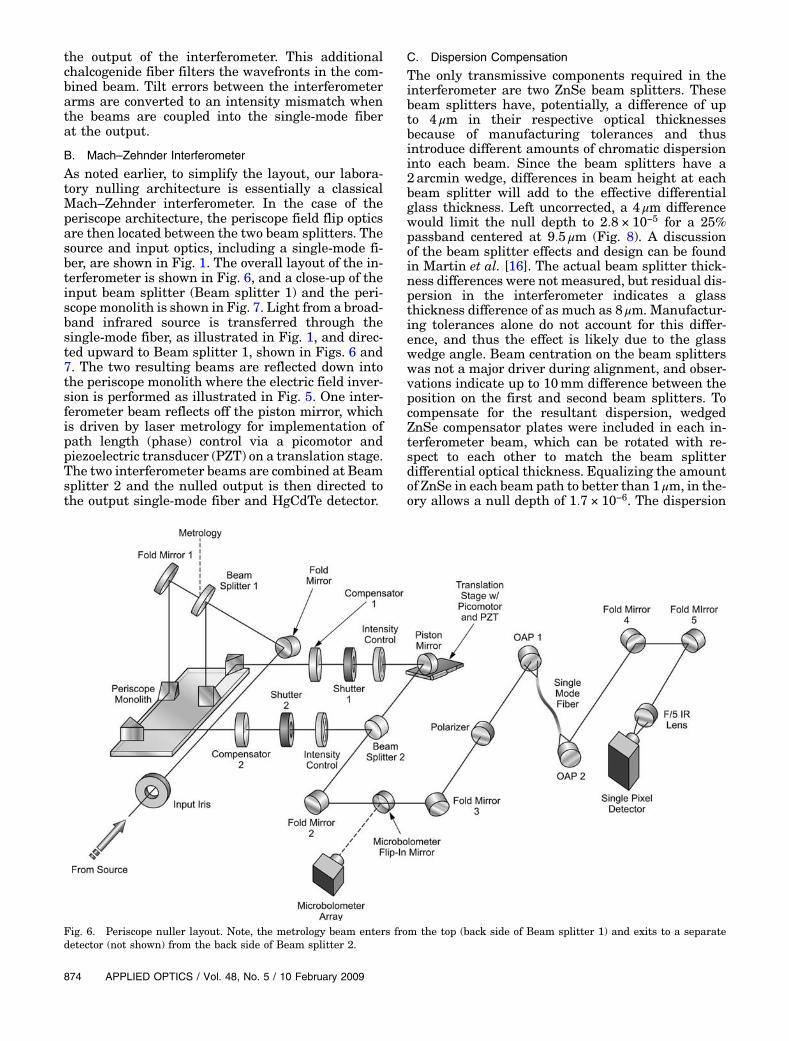
As noted earlier, to simplify the layout, our labora-tory nulling architecture is essentially a classicalMach–Zehnder interferometer. In the case of theperiscope architecture, the periscope field flip opticsare then located between the two beam splitters. Thesource and input optics, including a single-mode fi-ber, are shown in Fig. 1. The overall layout of the in-terferometer is shown in Fig. 6, and a close-up of theinput beam splitter (Beam splitter 1) and the peri-scopemonolith is shown in Fig. 7. Light from a broad-band infrared source is transferred through thesingle-mode fiber, as illustrated in Fig. 1, and direc-ted upward to Beam splitter 1, shown in Figs. 6 and7. The two resulting beams are reflected down intothe periscope monolith where the electric field inver-sion is performed as illustrated in Fig. 5. One inter-ferometer beam reflects off the piston mirror, whichis driven by laser metrology for implementation ofpath length (phase) control via a picomotor andpiezoelectric transducer (PZT) on a translation stage.The two interferometer beams are combined at Beamsplitter 2 and the nulled output is then directed tothe output single-mode fiber and HgCdTe detector.
C. Dispersion Compensation
The only transmissive components required in theinterferometer are two ZnSe beam splitters. Thesebeam splitters have, potentially, a difference of upto 4 μm in their respective optical thicknessesbecause of manufacturing tolerances and thusintroduce different amounts of chromatic dispersioninto each beam. Since the beam splitters have a2 arcmin wedge, differences in beam height at eachbeam splitter will add to the effective differentialglass thickness. Left uncorrected, a 4 μm differencewould limit the null depth to 2:8 × 10⁻⁵ for a 25%passband centered at 9:5 μm (Fig. 8). A discussionof the beam splitter effects and design can be foundin Martin et al. [16]. The actual beam splitter thick-ness differences were not measured, but residual dis-persion in the interferometer indicates a glassthickness difference of as much as 8 μm. Manufactur-ing tolerances alone do not account for this differ-ence, and thus the effect is likely due to the glasswedge angle. Beam centration on the beam splitterswas not a major driver during alignment, and obser-vations indicate up to 10mm difference between theposition on the first and second beam splitters. Tocompensate for the resultant dispersion, wedgedZnSe compensator plates were included in each in-terferometer beam, which can be rotated with re-spect to each other to match the beam splitterdifferential optical thickness. Equalizing the amountof ZnSe in each beam path to better than 1 μm, in the-ory allows a null depth of 1:7 × 10⁻⁶. The dispersion
Fig. 6. Periscope nuller layout. Note, the metrology beam enters from the top (back side of Beam splitter 1) and exits to a separatedetector (not shown) from the back side of Beam splitter 2.
compensating plates are shown in the interferometerlayout of Fig. 6.
D. Intensity and Phase Control
One of the most important requirements for a deepnull is equal intensities in the two beams, so a precisemeans of adjusting the actual intensity is needed.The degree of required control is discussed below.Intensity balancing is accomplished by the insertionof a pair of crossed wires in each beam, which aremoved laterally by a picomotor translation stage todifferentially adjust the intensity. (Note, this adjust-ment does not provide control of wavelength-dependent amplitude differences, which may bepresent due to different beam splitter coatings,diffraction effects, or other sources within the inter-ferometer.)Phase control is split up into several contributions.
The OPD between the arms of the interferometer isaffected by vibration (high frequency), thermal drifts(low frequency), and dispersion (static). While nul-ling, the phase difference between the interferometerarms is maintained using an active control loop todrive the piston mirror in Beam 1. Although the pas-sive vibration isolation effectively minimizes thehigher frequency OPD effects, a laser-based hetero-
dyne metrology control system operating at 633nmis used to actively control the OPD for frequenciesbelow 10Hz. The metrology control loop operatesat a 100kHz sampling rate and a 10kHz controlbandwidth. A 1mm diameter metrology beam is in-jected through the back side of Beam splitter 1 decen-tered by approximately 5mm from the infraredoptical axis as shown in Fig. 7. This allows the me-trology signal to measure the OPD along virtuallythe same path as the broadband infrared beam.The metrology beam is combined with a local oscilla-tor, and the resultant signals are detected from theback side of Beam splitter 2.
5. Error Budget for the Periscope Nuller
As introduced earlier, Eq. (1) expresses the primaryfactors affecting nulling performance. For the single-polarization case discussed here, we can neglect thepolarization term, ΔΦs−p. We used two infrared po-larizers with a rejection ratio of 10−4 each to achievea total linear polarization purity of ∼10−8. Table 2summarizes the factors affecting null depth on theperiscope nuller, the measured level of control, andthe estimated contribution to null depth for eachfactor. These factors are discussed in detail in thefollowing sections.
A. Polarization Rotation
An alignment error within the periscope monolithwould cause a polarization rotation error. This rota-tion can also be understood as a pupil rotation. Toachieve a null of 1 × 10⁻⁵ for the system, the pupil ro-tation must be within 3mrad of π. This turns out tobe relatively easy to accomplish during constructionof the periscope monolith. An autocollimator wasused to monitor alignment of each mirror surfaceof the monolith. The mirrors were optically contactedto a glass base plate to form the monolith. Using awet optical contacting method allowed each mirrorto be adjusted to 15 arcsec tolerance [35], at least afactor of 4 better than the pupil rotation errorrequirement.
Alignment of the incidence angle at the beam split-ters is a much more difficult process. Due to thethree-dimensional layout of the periscope nuller, er-rors in alignment angle result in shear and pathlength errors through the monolith. Also, differencesin reflectance angle on the two beam splitters maycause wavelength-dependent intensity differencesin the beams. An autocollimator, a coordinate mea-surement arm, and mechanical alignment targetswere used to align the interferometer such thatthe incidence angles on the two beam splittersmatched to within 2 arcmin. Broadband beam split-ter coatings are generally insensitive to incident an-gle changes of this magnitude. Based on thismodeling, the wavelength-dependent intensity ef-fects should be negligible. In addition, the alignmentmethod ensured that the beams exiting the monolithwere parallel to better than 1 arcmin, and each mir-ror surface within the monolith was correct to within
Fig. 7. Photograph of the periscope nulling interferometer in-cluding Beam splitter 1 and the field flip mirrors in the periscopemonolith.
Fig. 8. Null depth versus differential glass thickness. Bandwidthfor calculation is 25% centered at 9:45 μm.
1 arcmin of the nominal 45° angle. For a statisticallylikely case, in which all four monolith componentshave opposite 30 arcsec angular errors, the resultantpupil rotation difference between interferometerarms is 2arcmin (1:2mrad). We can therefore allo-cate a tolerance of pupil rotation of αrot ¼ 1:2×10⁻³ rad. This allocation alone would limit the nulldepth to a negligible contribution of (1=4) αrot2 ¼3:6 × 10⁻⁷.
B. Intensity and Phase Balance
As mentioned previously, beam intensity balance iscontrolled with thin wires in each beam. Measure-ment of the individual beam power for the inter-ferometer arms shows that adjustment of the wiresallows the average intensity difference to be con-trolled to better than 0.25%. If we set δI ¼ 2:5×10⁻³, this residual intensity difference alone shouldlimit the achievable null depth to NδI ¼ ð1=4ÞðδIÞ2 ¼1:6 × 10⁻⁶.The heterodynemetrology system provides data on
both the passive path length control through vibra-tion isolation and the active path control when thecontrol loop is on. Calculation of the cumulativerms phase error from open loop metrology data indi-cates that the passive vibration isolation provides re-sidual optical path stability of 2–3nmrms forfrequencies above 10Hz, as shown in Fig. 9. Perform-ing the same calculation on closed loop metrologydata shows that OPD control maintains the same2–3nmrms path stability for frequencies below10Hz. If we set x ¼ 3nm in ΔΦ ¼ ð2π=λÞx, this levelof path fluctuation alone should limit the achievablenull depth to NΔΦ ¼ ð1=4ÞðΔΦÞ2 ¼ 1:0 × 10−6.The rotation, intensity, and phase terms consid-
ered above are all monochromatic contributions tothe null. Given that the best measured monochro-matic (laser) null measured on the periscope nulleris N laser ¼ 3:3 × 10⁻⁶, the agreement with the sumof the three estimated monochromatic contributions,3:0 × 10−6, is excellent. This monochromatic lasernull is a factor of a few worse than earlier CO2 laserwork [16], because the goals of the ANT were notdeep laser nulls per se. Instead, the laser only needed
to be nulled to a level below that required by thebroadband experiments to follow.
C. Chromatic Dispersion
In addition to monochromatic terms, there are twowavelength-dependent terms that contribute to de-gradation of the null. The first is chromatic disper-sion due primarily to thickness differences in thebeam splitter and recombiner that must be ac-counted for. As described previously, ZnSe compensa-tor plates are used to balance this dispersion. Adifferential glass thickness will cause the broadbandfringe envelope to be asymmetric about the centralnull fringe. The asymmetry can be adjusted by rotat-ing the compensator plates to balance the intensity ofthe fringes immediately adjacent to the central null.(Alternatively, a long-scan Fourier transform can beused, but this technique, when implemented, provedno more sensitive than the balancing of fringe mini-ma.) A corrected fringe asymmetry of approximately2% was routinely achievable, which corresponds to adifferential glass thickness calculated to be approxi-mately 1 μm. The index of refraction of ZnSe at λ ¼10 μm is 2.4, and therefore the null fringe wouldbe found when 1 μm of ZnSe is matched with
Table 2. Contributing Factors for Single-Polarization Null Depth on Periscope Nuller
Predicted single polarization null(arithmetic sum of null contributions)
5:7 × 10⁻⁶
Best measured single polarization null 9 × 10⁻⁶
Fig. 9. Metrology data showing path length stability. The uppertrace shows the raw, unprocessed metrology signal, indicating thereal-time path length stability. The lower trace shows the cumu-lative rms path difference as a function of vibration frequency.
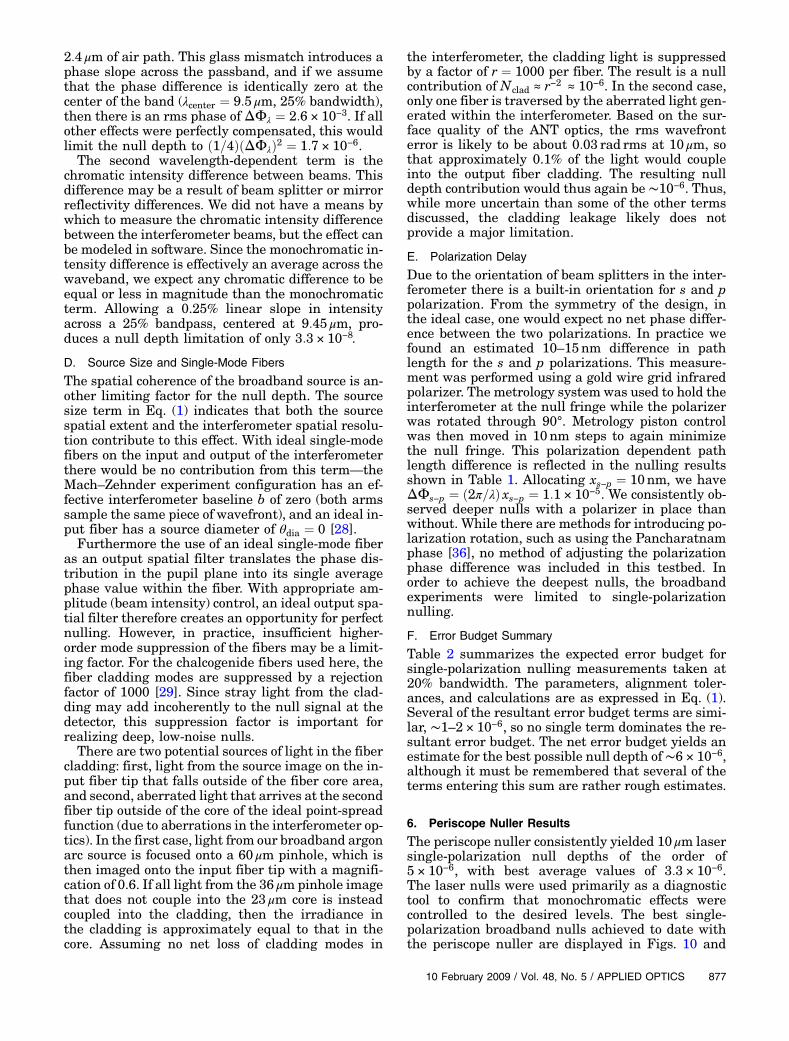
2:4 μm of air path. This glass mismatch introduces aphase slope across the passband, and if we assumethat the phase difference is identically zero at thecenter of the band (λcenter ¼ 9:5 μm, 25% bandwidth),then there is an rms phase of ΔΦλ ¼ 2:6 × 10⁻³. If allother effects were perfectly compensated, this wouldlimit the null depth to ð1=4ÞðΔΦλÞ2 ¼ 1:7 × 10⁻⁶.The second wavelength-dependent term is the
chromatic intensity difference between beams. Thisdifference may be a result of beam splitter or mirrorreflectivity differences. We did not have a means bywhich to measure the chromatic intensity differencebetween the interferometer beams, but the effect canbe modeled in software. Since the monochromatic in-tensity difference is effectively an average across thewaveband, we expect any chromatic difference to beequal or less in magnitude than the monochromaticterm. Allowing a 0.25% linear slope in intensityacross a 25% bandpass, centered at 9:45 μm, pro-duces a null depth limitation of only 3:3 × 10⁻⁸.
D. Source Size and Single-Mode Fibers
The spatial coherence of the broadband source is an-other limiting factor for the null depth. The sourcesize term in Eq. (1) indicates that both the sourcespatial extent and the interferometer spatial resolu-tion contribute to this effect. With ideal single-modefibers on the input and output of the interferometerthere would be no contribution from this term—theMach–Zehnder experiment configuration has an ef-fective interferometer baseline b of zero (both armssample the same piece of wavefront), and an ideal in-put fiber has a source diameter of θdia ¼ 0 [28].Furthermore the use of an ideal single-mode fiber
as an output spatial filter translates the phase dis-tribution in the pupil plane into its single averagephase value within the fiber. With appropriate am-plitude (beam intensity) control, an ideal output spa-tial filter therefore creates an opportunity for perfectnulling. However, in practice, insufficient higher-order mode suppression of the fibers may be a limit-ing factor. For the chalcogenide fibers used here, thefiber cladding modes are suppressed by a rejectionfactor of 1000 [29]. Since stray light from the clad-ding may add incoherently to the null signal at thedetector, this suppression factor is important forrealizing deep, low-noise nulls.There are two potential sources of light in the fiber
cladding: first, light from the source image on the in-put fiber tip that falls outside of the fiber core area,and second, aberrated light that arrives at the secondfiber tip outside of the core of the ideal point-spreadfunction (due to aberrations in the interferometer op-tics). In the first case, light from our broadband argonarc source is focused onto a 60 μm pinhole, which isthen imaged onto the input fiber tip with a magnifi-cation of 0.6. If all light from the 36 μmpinhole imagethat does not couple into the 23 μm core is insteadcoupled into the cladding, then the irradiance inthe cladding is approximately equal to that in thecore. Assuming no net loss of cladding modes in
the interferometer, the cladding light is suppressedby a factor of r ¼ 1000 per fiber. The result is a nullcontribution of Nclad ≈ r−2 ≈ 10−6. In the second case,only one fiber is traversed by the aberrated light gen-erated within the interferometer. Based on the sur-face quality of the ANT optics, the rms wavefronterror is likely to be about 0:03 rad rms at 10 μm, sothat approximately 0.1% of the light would coupleinto the output fiber cladding. The resulting nulldepth contribution would thus again be ∼10−6. Thus,while more uncertain than some of the other termsdiscussed, the cladding leakage likely does notprovide a major limitation.
E. Polarization Delay
Due to the orientation of beam splitters in the inter-ferometer there is a built-in orientation for s and ppolarization. From the symmetry of the design, inthe ideal case, one would expect no net phase differ-ence between the two polarizations. In practice wefound an estimated 10–15nm difference in pathlength for the s and p polarizations. This measure-ment was performed using a gold wire grid infraredpolarizer. The metrology system was used to hold theinterferometer at the null fringe while the polarizerwas rotated through 90°. Metrology piston controlwas then moved in 10nm steps to again minimizethe null fringe. This polarization dependent pathlength difference is reflected in the nulling resultsshown in Table 1. Allocating xs−p ¼ 10nm, we haveΔΦs−p ¼ ð2π=λÞ xs−p ¼ 1:1 × 10⁻⁵. We consistently ob-served deeper nulls with a polarizer in place thanwithout. While there are methods for introducing po-larization rotation, such as using the Pancharatnamphase [36], no method of adjusting the polarizationphase difference was included in this testbed. Inorder to achieve the deepest nulls, the broadbandexperiments were limited to single-polarizationnulling.
F. Error Budget Summary
Table 2 summarizes the expected error budget forsingle-polarization nulling measurements taken at20% bandwidth. The parameters, alignment toler-ances, and calculations are as expressed in Eq. (1).Several of the resultant error budget terms are simi-lar, ∼1–2 × 10⁻⁶, so no single term dominates the re-sultant error budget. The net error budget yields anestimate for the best possible null depth of∼6 × 10⁻⁶,although it must be remembered that several of theterms entering this sum are rather rough estimates.
6. Periscope Nuller Results
The periscope nuller consistently yielded 10 μm lasersingle-polarization null depths of the order of5 × 10−6, with best average values of 3:3 × 10⁻⁶.The laser nulls were used primarily as a diagnostictool to confirm that monochromatic effects werecontrolled to the desired levels. The best single-polarization broadband nulls achieved to date withthe periscope nuller are displayed in Figs. 10 and
11. Both the 20% and the 25% bandwidth data wereobtained using infrared bandpass filters with a cen-ter wavelength of 9:45 μm. The only change to the in-terferometer between the two data sets was thebandpass filter used. The data show average nullsof 2 × 10⁻⁵ for 20% bandwidth and 4 × 10⁻⁵ for 25%bandwidth, with a few best nulls of the order of 9 ×10⁻⁶ for the 20% case. The null clearly drifts slowlyand regularly between ∼9 × 10⁻⁶ and 3–4 × 10⁻⁵.This slow drift is also present in “dark” data, shownin Fig. 12, suggesting that a low level electronic driftor instability is limiting the long-term average nulldepths attainable with white light to ∼10−5. Thisdrift is not as much a limiting factor for laser mea-surements, because of the higher signal levels.Nevertheless, even in the presence of this drift, thebest short-term nulls seen, ∼9 × 10⁻⁶, are very closeto the prediction of the error budget, ∼6 × 10⁻⁶.
7. Conclusion
Of the three nulling approaches that were examined,the periscope nuller yielded the best broadband sin-gle-polarization nulls. This may have been the resultof the inherently achromatic architecture of thisphase shifter, however this nuller was implementedwithin an interferometer that used potentiallydispersive elements: a matched beam splitter/recombiner pair with an inevitable thickness differ-ence. The best nulling results obtained with the peri-scope nuller are quite close to the null depthpredicted by a detailed error budget, and the attain-able long-term average null is limited by a slightelectronic instability or drift at approximately the10−5 level. These broadband nulls are, to ourknowledge, the best broadband mid-infrared nullingresults achieved to date without the use of activeoptics. The periscope nuller has thus been able to de-monstrate performance levels close to those de-manded by mid-infrared terrestrial exoplanetobservations. Of course as a result, the performancealready exceeds that required for nulling observa-tions of Hot Jupiters [37].The performance of the other two approaches
tested might also have yielded improved resultshad the testbeds been equipped with higher-
resolution alignment techniques. The limitations inthe dual-glass approach were attributed to insuffi-cient resolution in the adjustment of differentialglass thickness. In particular, opposed pairs ofwedged glass elements [32] can provide improvedthickness resolution and would also remove manyother issues from the table (such as beam shearand polarization effects). The limitations in thethrough-focus approach, attributed to insufficient re-solution in pointing and clocking alignment, can ofcourse also be improved upon. Accurate alignmentand balancing of the relevant parameters is of coursecritical to the success of any nuller, and as pointedout earlier, symmetry and stability are paramount[6,7]. It should also be noted that both these architec-tures were implemented in a dual polarization ar-rangement. Given the polarization limitations inthe periscope nuller, it is possible that single-polarization measurements for the dual-glass andthrough focus methods could have yieldedcomparable results.
In parallel with this research, work in adaptivenulling has also been conducted at JPL [12], whichhas yielded null depths of 1:1 × 10⁻⁵ at 32% band-width, slightly exceeding the performance reportedhere. In fact, the static and active methods of com-pensation are complementary, in that the stroke ofactive nulling components is limited, especially in re-lation to long mid-infrared wavelengths. Thus, a
Fig. 10. Null fringe measurement using a bandpass filter with afull width at half-maximumwidth of 20%, centered at 9:45 μm. Thefringe signal is normalized to the constructive peak signal.
Fig. 11. Null fringemeasurement for 25% bandwidth, centered at9:45 μm.
Fig. 12. Electronic noise on the periscope nuller. The verticalscale is the same as the null measurements. This is the signal mea-sured by the detector and electronics with the infrared sourceblocked.
flight nulling system would likely rely on both typesof nuller, with a classical broadband nuller to getwithin the stroke range of the final active nullingstage. Thus, assuming such a hybrid approach, manyof the necessary phase shifting capabilities neededfor a TPF-I-like flight system have been demon-strated to approximately the levels required for exo-planet observations in the mid-infrared.
The work described in this paper was performed atthe Jet Propulsion Laboratory, California Institute ofTechnology, under contract with the National Aero-nautics and Space Administration (NASA).
References1. P. R. Lawson, O. P. Lay, S. R. Martin, R. D. Peters, R. O. Gap-
pinger, A. Ksendzov, D. P. Scharf, A. J. Booth, C. A. Beichman,E. Serabyn, K. J. Johnston, andW. C. Danchi, “Terrestrial Pla-net Finder Interferometer: 2007–2008 progress and plans,”Proc. SPIE 7013, 70132N (2008).
2. C. S. Cockell, T. Herbst, A. Leger, M. Fridlund, T. Herbst, L.Kaltenegger, O. Absil, C. Beichman, W. Benz, M. Blanc, A.Brack, A. Chelli, L. Colangeli, H. Cottin, V. Coude du Foresto,W. Danchi, D. Defrere, J.-W. den Herder, C. Eiroa, J. Greaves,T. Henning, K. Johnston, H. Jones, L. Labadie, H. Lammer, R.Launhardt, P. Lawson, O. P. Lay, J.-M. LeDuigou, R. Liseau, F.Malbet, S. R. Martin, D. Mawet, D. Mourard, C. Moutou, L.Mugnier, F. Paresce, A. Quirrenbach, Y. Rabbia, J. A. Raven,H. J. A. Rottgering, D. Rouan, N. Santos, F. Selsis, E. Serabyn,H. Shibai, M. Tamura, E. Thiebaut, F. Westall, White, and J.Glenn, “Darwin—Amission to detect and search for life on ex-trasolar planets,” Astrobiology, available at http://arxiv.org/abs/0805.1873.
3. O. P. Lay, “Removing instability noise in nulling interfero-meters,” Proc. SPIE 6268, 62681A (2006).
4. S. Martin, P. Szwaykowski, and F. Loya, “Testing exo-planetsignal extraction using the Terrestrial Planet Finder PlanetDetection Testbed,” Proc. SPIE 5905, 590508 (2005).
5. E. Serabyn and M. M. Colavita, “Fully symmetric nullingbeam combiners,” Appl. Opt. 40, 1668–1671 (2001).
6. B. Mennesson, A. Leger, and M. Ollivier, “Direct detection andcharacterization of extrasolar planets: The Mariotti space in-terferometer,” Icarus 178, 570–588 (2005).
7. E. Serabyn, “Nulling interferometry: symmetry requirementsand experimental results,” Proc. SPIE 4006, 328–339 (2000).
8. E. Serabyn, “Nulling interferometry progress,” Proc. SPIE4838, 594–608 (2003).
9. R. Angel, “Use of a 16m telescope to detect earth-like planets,”in The Next Generation Space Telescope, P. Bely, C. Burrows,and G. Illingworth, eds. (Space Telescope Science Institute,1989), p. 81.
10. R. M. Morgan, J. H. Burge, and N. J. Woolf, “Final laboratoryresults of visible nulling with dielectric plates,” Proc. SPIE4838, 644–655 (2003).
11. P. Baudoz, J. Gay, and Y. Rabbia, “Interfero-coronagraphy: atool for detection of faint companions,” Astron. Soc. Pac. Conf.Ser. 134, 254–261(1998).
12. R. D. Peters, O. P. Lay, and M. Jeganathan, “Broadband phaseand intensity compensation with a deformable mirror for aninterferometric nuller,” Appl. Opt. 47, 3920–3926 (2008).
13. D. Mawet, C. Hanot, C. Lenaerts, P. Riaud, D. Defrere,D. Vandormael, J. Loicq, K. Fleury, J.-Y. Plesseria, J. Surdej,and S. Habraken, “Fresnel rhombs as achromatic phaseshifters for infrared nulling interferometry,” Opt. Express15, 12850–12865 (2007).
14. D. Rouan and D. Pelat, “The achromatic chessboard, anew concept of a phase shifter for nulling interferometry.I. Theory,” Astron. Astrophys. 484, 581–589 (2008).
15. R. Samuele, J. K. Wallace, E. Schmidtlin, M. Shao, B. M.Levine, and S. Fregoso, “Experimental progress and resultsof a visible nulling coronagraph,” in Proceedings of IEEEAerospace Conference (Institute of Electrical and ElectronicEngineers, 2007), paper 1333.
16. S. R. Martin, R. O. Gappinger, F. M. Loya, B. P. Mennesson,S. L. Crawford, and E. Serabyn, “A mid-infrared nuller forTerrestrial Planet Finder: design, progress, and results,”Proc. SPIE 5170, 144–154 (2003).
17. P. Haguenauer and E. Serabyn, “Deep nulling of laser lightwith a single-mode-fiber beam combiner,” Appl Opt 45, 2749–2754 (2006).
18. K. Ergenzinger, R. Flatscher, U. Johann, R. Vink, andZ. Sodnik, “EADS Astrium nulling interferometer breadboardfor Darwin and GENIE,” in Proceedings of the InternationalConference on Space Optics 2004 (European Space Agency,2004), pp. 223–230.
19. C. Buisset, X. Rejeaunier, Y. Rabbia, and M. Barillot, “Stabledeep nulling in polychromatic unpolarized light with multi-axial beam combination,” Appl. Opt. 46, 7817–7822(2007).
20. J. K. Wallace, G. Hardy, and E. Serabyn, “Deep and stableinterferometric nulling of broadband light with implicationsfor observing planets around nearby stars,” Nature 406,700–702 (2000).
21. B. Mennesson, S. L. Crawford, E. Serabyn, S. Martin, M.Creech-Eakman, and G. Hardy, “Laboratory performance ofthe Keck Interferometer nulling beam combiner,” in TowardsOther Earths: Darwin/TPF and the Search for Extrasolar Ter-restrial Planets (European Space Agency, 2003), Vol. SP-539,pp. 525–529.
22. A. J. Booth, S. R. Martin, and F. Loya, “Exoplanet explorationprogram, planet detection test-bed: latest results of planetlight detection in the presence of starlight,” Proc. SPIE7013, 701320 (2008).
23. B. Mennesson, P. Haguenauer, E. Serabyn, and K. Liewer,“Deep broad-band infrared nulling using a single-mode fiberbeam combiner and baseline rotation,” Proc. SPIE 6268,626830 (2006).
24. J. K.Wallace, V. Babtiwale, R. Bartos, K. Brown, R. Gappinger,F. Loya, D. MacDonald, S. Martin, J. Negron, T. Truong, and G.Vasisht, “Mid-IR interferometric nulling for TPF,” Proc. SPIE5491, 862–873 (2004).
25. J. K.Wallace, R. Bartos, R. Gappinger, F. Loya, S. Moser, and J.Negron, “Progress in broadband infrared nulling technologyfor TPF,” Proc. SPIE 5905, 590505 (2005).
26. R. O. Gappinger, J. K. Wallace, R. D. Bartos, D. R. MacDonald,and K. A. Brown, “Current progress on TPFI nulling architec-tures at Jet Propulsion Laboratory,” Proc. SPIE 5905, 590506(2005).
27. J. M. Bridges and A. L. Migdall, “Characterization of argon arcsource in the infrared,” Metrologia 32, 625–628 (1996).
28. B. Mennesson, M. Ollivier, and C. Ruilier, “Use of single-modewaveguides to correct the optical defects of a nulling inter-ferometer,” J. Opt. Soc. Am. A. 19, 596–602 (2002).
29. A. Ksendzov, O. P. Lay, S. Martin, J. S. Sanghera, L. E. Busse,W. H. Kim, P. C. Pureza, V. Q. Nguyen, and I. D. Aggarwal,“Characterization of mid-infrared single-mode fibers as modalfilters,” Appl. Opt. 46, 7957–7962 (2007).
30. F. Brachet, A. Labeque, A. Leger, M. Ollivier, C. Lizambert,V. Hervier, B. Chazelas, B. Pellet, T. Lepine, and C. Valette,“Nulling interferometry for the Darwin mission: polychro-matic laboratory test bench,” Proc. SPIE 5491, 991–998(2004).
31. O. Lay, S. Dubovitsky, R. Peters, J. Burger, W. Steier, S. Ahn,and H. Fetterman, “MSTAR: an absolute metrology systemwith submicrometer accuracy,” Proc. SPIE 5491, 1068–1078(2004).
32. E. Serabyn, A. J. Booth, M.M. Colavita, M. J. Creech-Eakman,S. L. Crawford, J. Garcia, R. L. Johnson Jr., E. Hovland, C.Koresko, E. R. Ligon III , S. R. Martin, B. P. Mennesson, J.D. Moore, D. L. Palmer, C. G. Paine, M. Shao, M. R. Swain,R. F. Smythe, and G. Vasisht, “The Keck Interferometer Nul-ler: system architecture and laboratory performance,” Proc.SPIE 5491, 806–815 (2004).
33. J. Gay and Y. Rabbia, “Principe d’un coronagraphe interféren-tiel,” Comptes Rendus de l’Academie des Sciences Paris, SerieII b, Astronomical Techniques (1996), Vol. 322, pp. 265–271.
34. L. G. Gouy, “Sur une propriété nouvelle des ondes lumi-neuses,” C. R. Acad. Sci. 110, 1251–1253, (1890).
35. R. O. Gappinger, R. T. Diaz, S. R. Martin, F. M. Loya, and P. R.Lawson, “Current progress on TPF-I mid-infrared achromaticnulling at the Jet Propulsion Laboratory,” Proc. SPIE 6693,669318 (2007).
36. W. J. Tango and J. Davis, “Application of geometric phasetechniques to stellar interferometry,” Appl. Opt. 35, 621–623(1996).
37. W. Danchi and B. Lopez, “The Fourier-Kelvin Stellar Inter-ferometer (FKSI)—A practical infrared space interferometeron the path to the discovery and characterization of Earth-like planets around nearby stars,” C. R. Phys. 8, 396–407(2007).