PPX Learning Event – January 27, 2015 1 “Expand Your Horizons” Webinar Series Input to Output Performance – Advances in Costing January 27, 2015 8:30 – 10:00am The Webinar will begin shortly. You can ask a question in the box on the right hand side. We will answer them during our Q&A at the end of the webinar.
Transcript
PPX Learning Event – January 27, 2015 1
“Expand Your Horizons” Webinar Series
Input to Output Performance – Advances in Costing January 27, 2015 8:30 – 10:00am
The Webinar will begin shortly. You can ask
a question in the box on the right hand
side. We will answer them during our Q&A
at the end of the webinar.
A “Rapid Ride” Through
Input to Output Costing and
Options for Measuring Efficiency
Mike Haley
PPX Learning Event – January 27, 2015
PPX Learning Event – January 27, 2015 3
Presentation Agenda
• Current Drivers for Improved GOC Cost Information
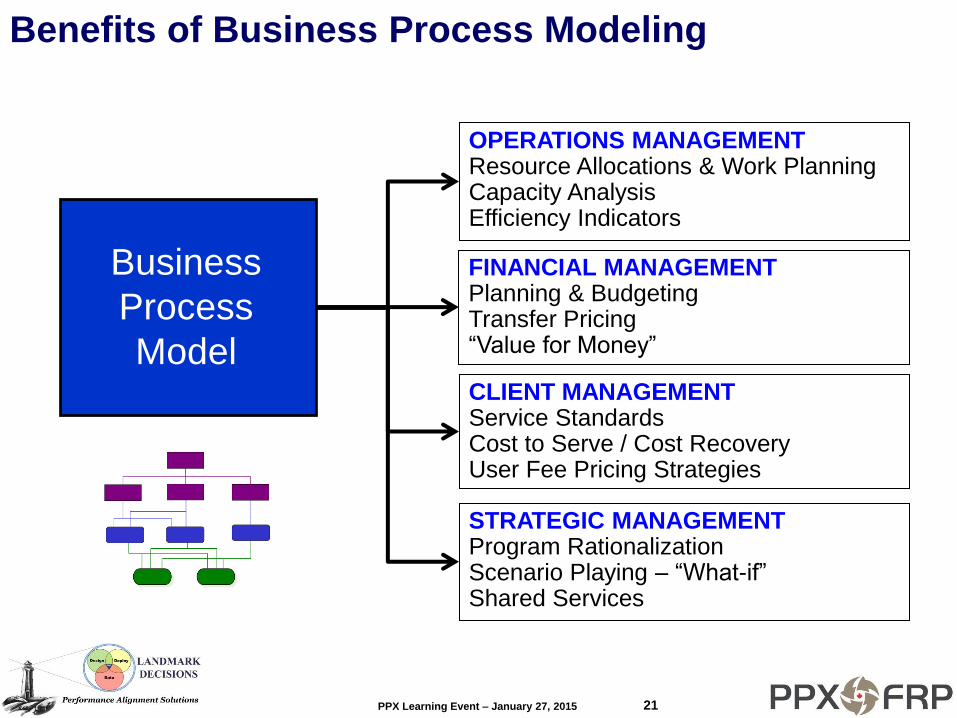
• The Role and Value of Logic Models and Business
Process Mapping
• The “Efficiency Management Continuum”
• Fundamentals of Activity-Based Costing (ABC) and
Activity-Based Planning (ABP)
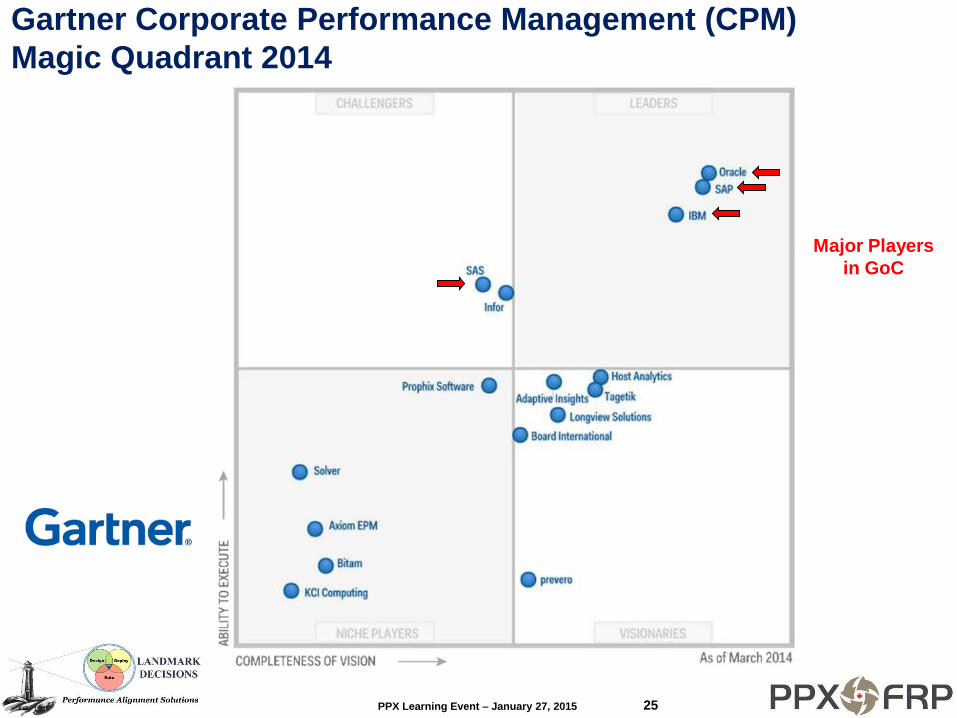
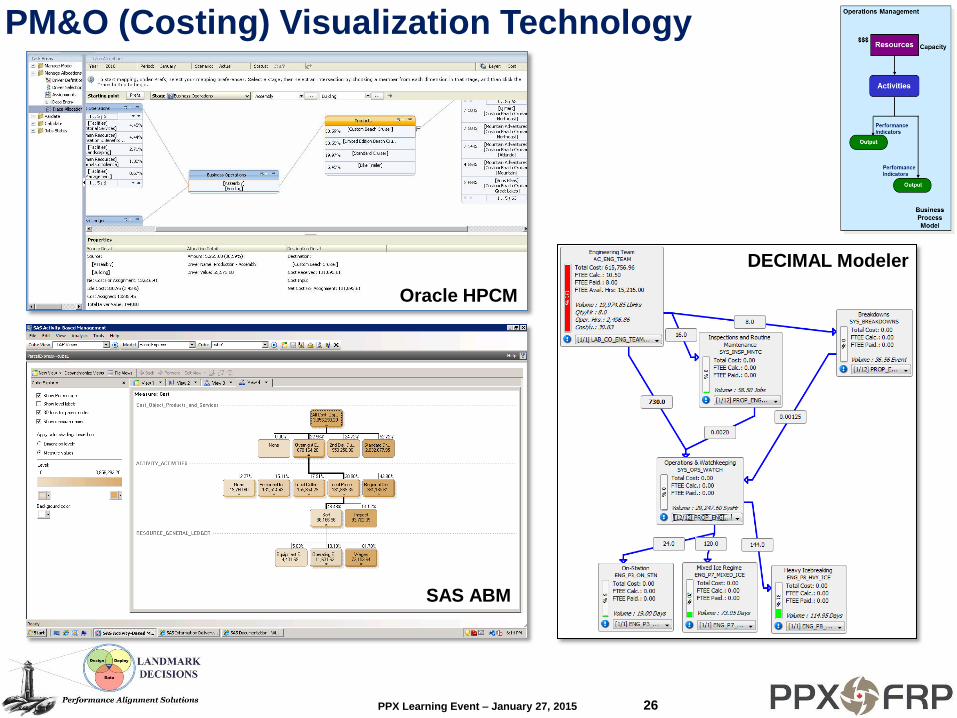
• The Role and Value of Technology for Costing
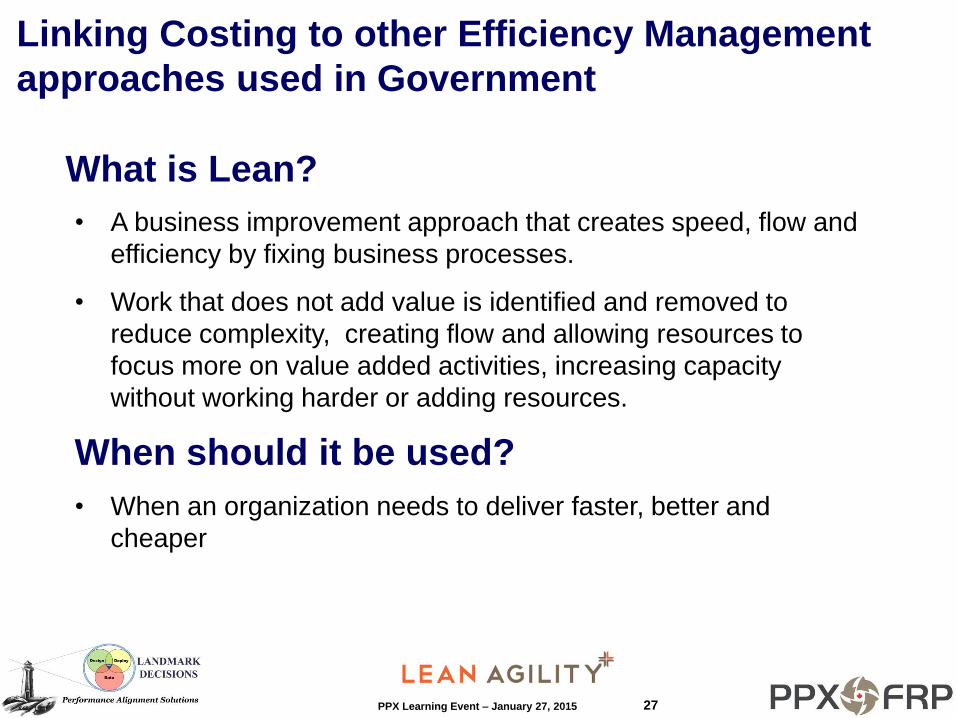
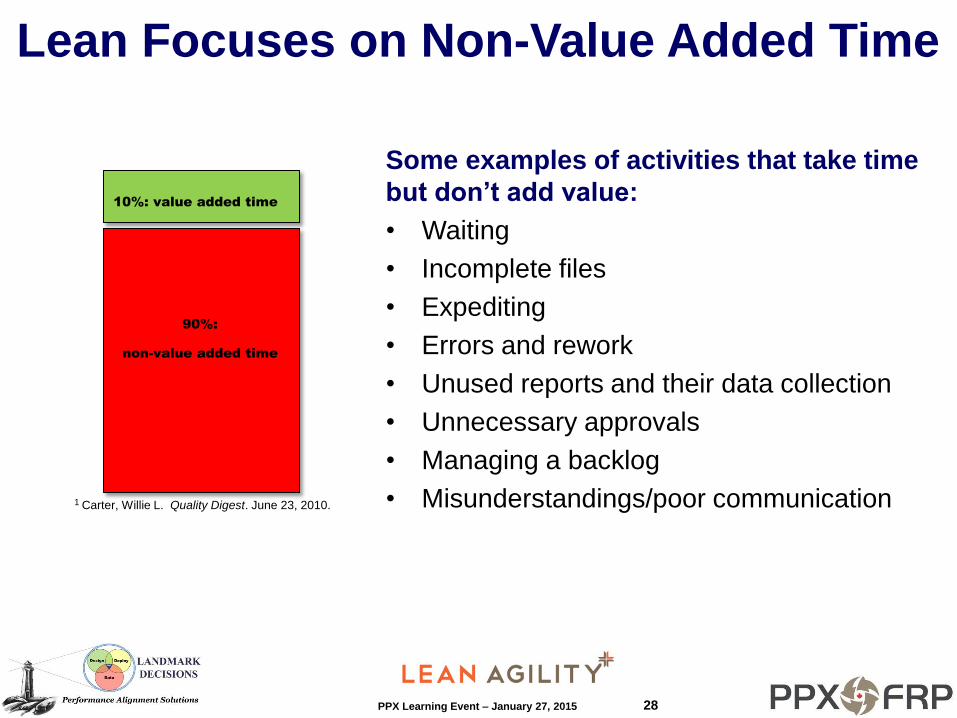
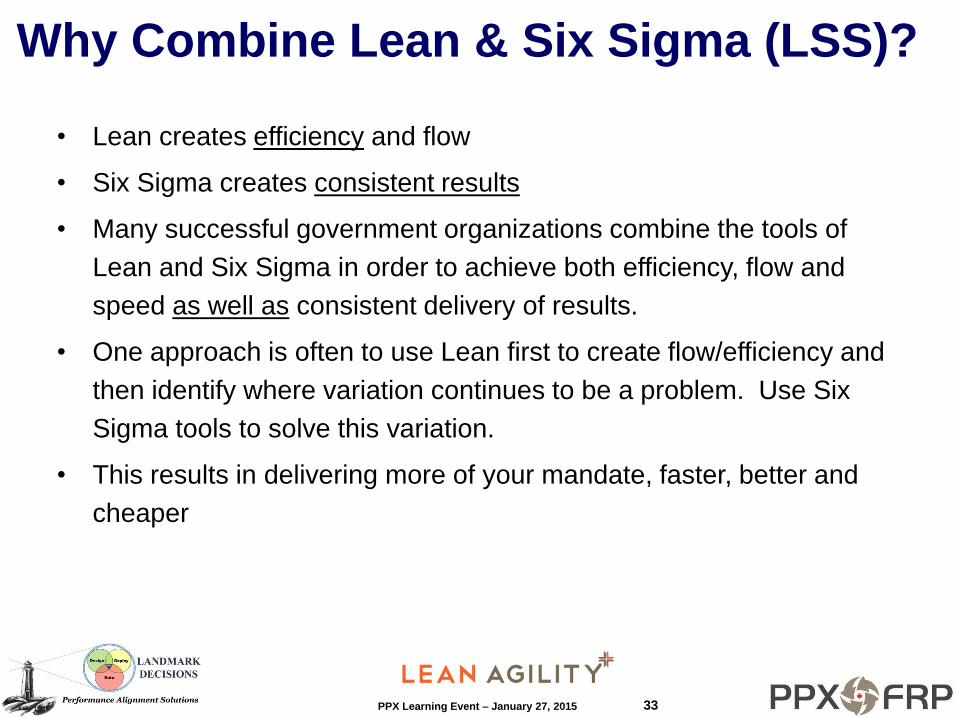
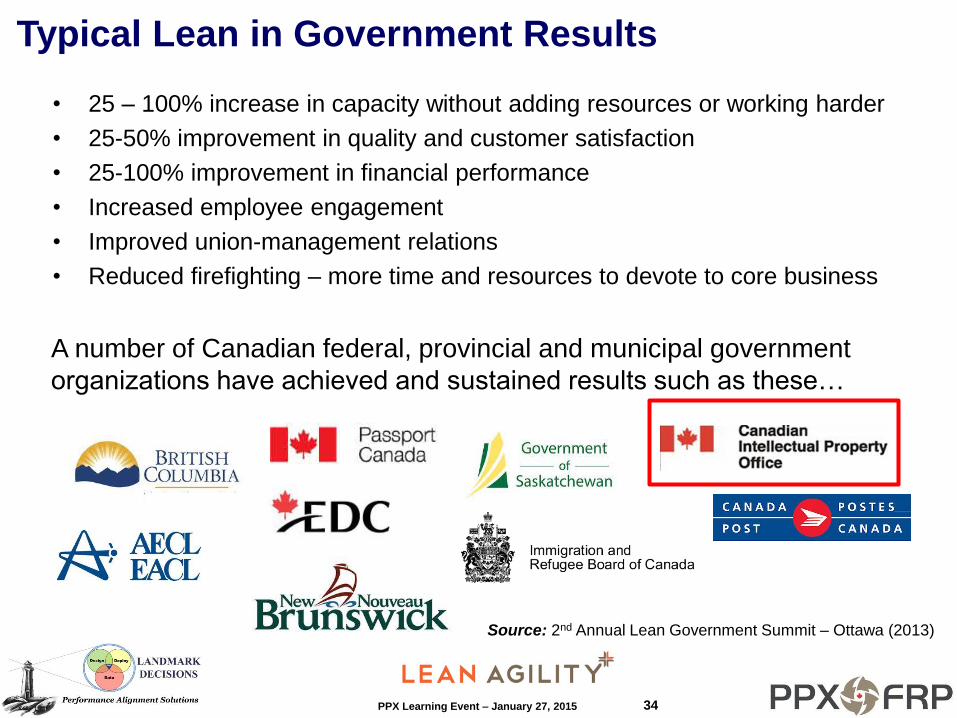
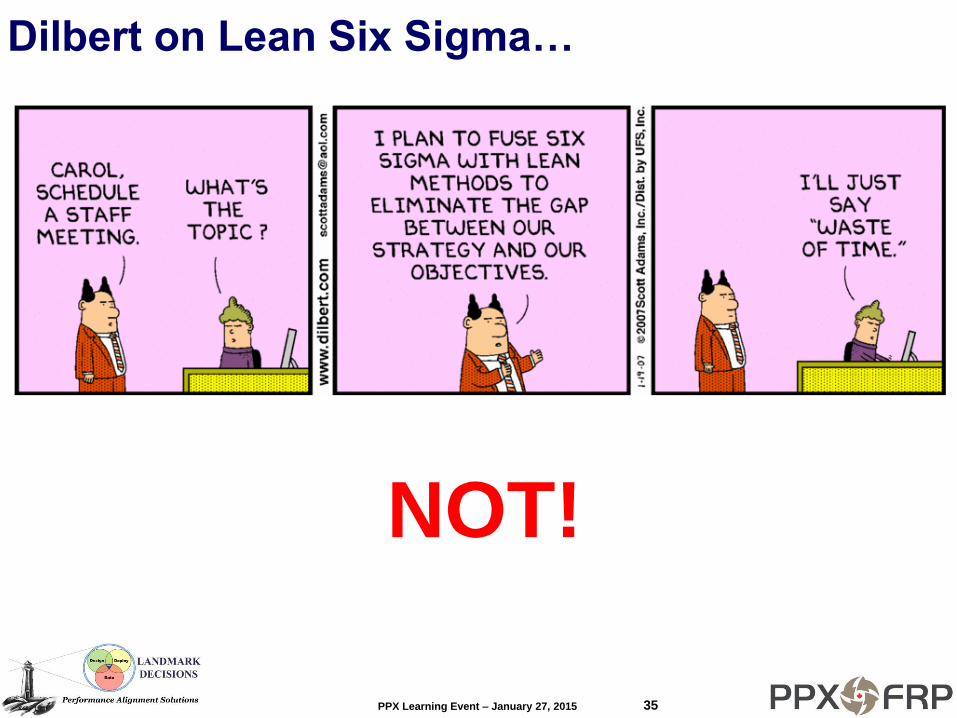
• Linking Costing to Lean and Six Sigma
…and like Pizza Pizza “in 30 minutes or Less”!
PPX Learning Event – January 27, 2015 4
Dilbert on Costing…
PPX Learning Event – January 27, 2015 5
• Effective and efficient business
processes that draw on collective
expertise to achieve economies of scale in
areas of common interest across the
Public Service while maintaining high
standards of quality, accessibility and
equity of services to Canadians.
• Regular review of programs and
services to help the Government
determine whether they are still required
and whether adjustments are needed to
ensure that they are effective, efficient
and focused on the needs of Canadians.
Blueprint/Destination 2020
• Interoperable systems to ensure timely access to
information and management data needed to
support trend analysis and scenario-building.
PPX Learning Event – January 27, 2015 6
MRRS guidance issued in 2012 requires departments to
demonstrate the efficiency of their programs.
Aims:
Gain insights into program delivery costs relative to the
work performed
Provide trend information into program delivery costs to
facilitate decision making
Identify opportunities for efficiency gains
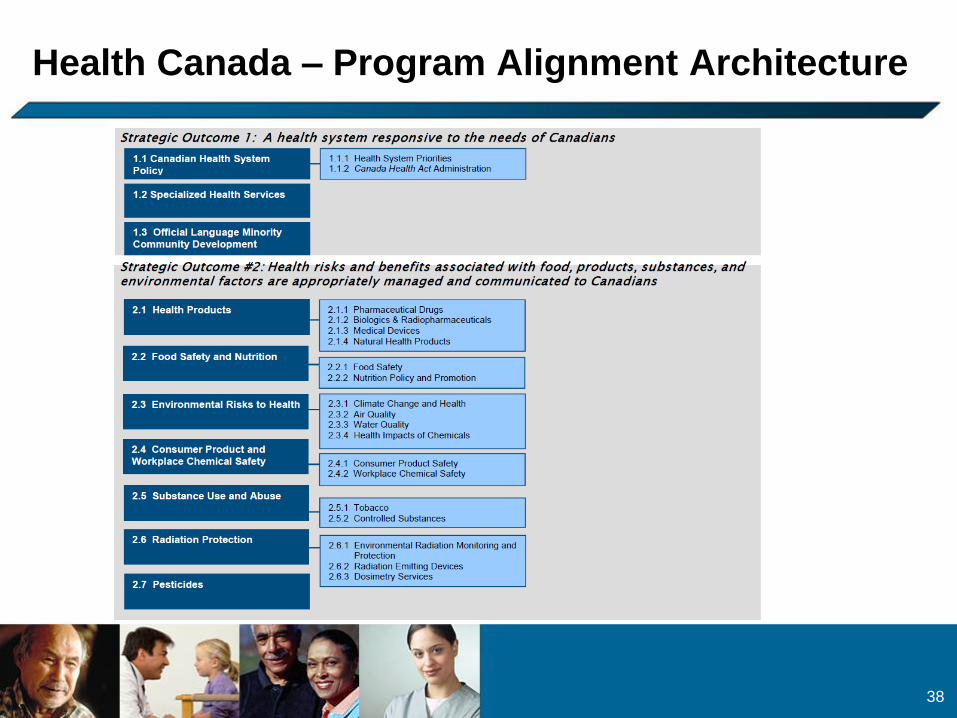
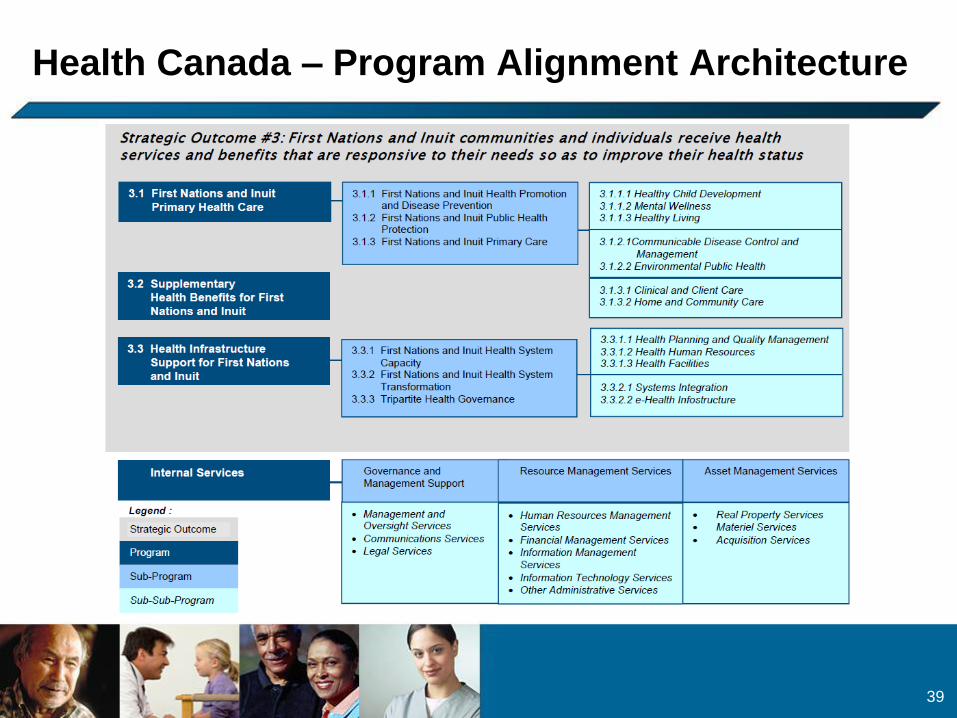
One efficiency indicator (EI) for each lowest-level program in
departments’ Program Alignment Architectures (PAA)
EIs in 2014-15 Performance Measurement Frameworks (PMFs)
Lead time to 2014-15 to be used to build capacity to measure
efficiency and develop initial set of EIs.
Management, Resources and Results Structure (MRRS)
PPX Learning Event – January 27, 2015 7
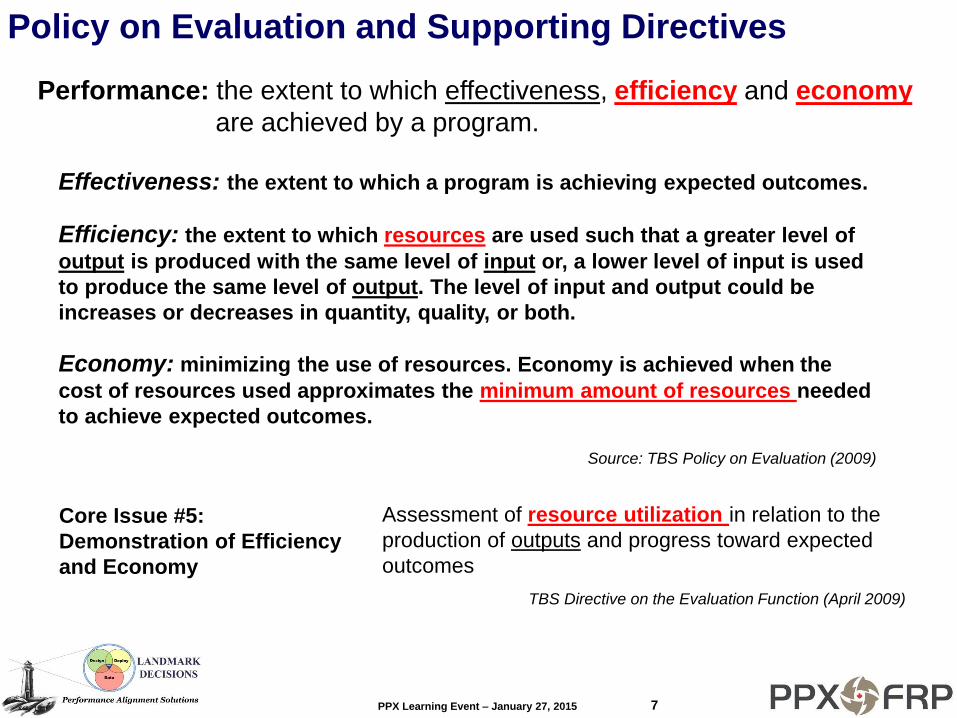
Source: TBS Policy on Evaluation (2009)
Policy on Evaluation and Supporting Directives
Effectiveness: the extent to which a program is achieving expected outcomes.
Efficiency: the extent to which resources are used such that a greater level of
output is produced with the same level of input or, a lower level of input is used
to produce the same level of output. The level of input and output could be
increases or decreases in quantity, quality, or both.
Economy: minimizing the use of resources. Economy is achieved when the
cost of resources used approximates the minimum amount of resources needed
to achieve expected outcomes.
Performance: the extent to which effectiveness, efficiency and economy
are achieved by a program.
TBS Directive on the Evaluation Function (April 2009)
Core Issue #5:
Demonstration of Efficiency
and Economy
Assessment of resource utilization in relation to the
production of outputs and progress toward expected
outcomes
PPX Learning Event – January 27, 2015 8
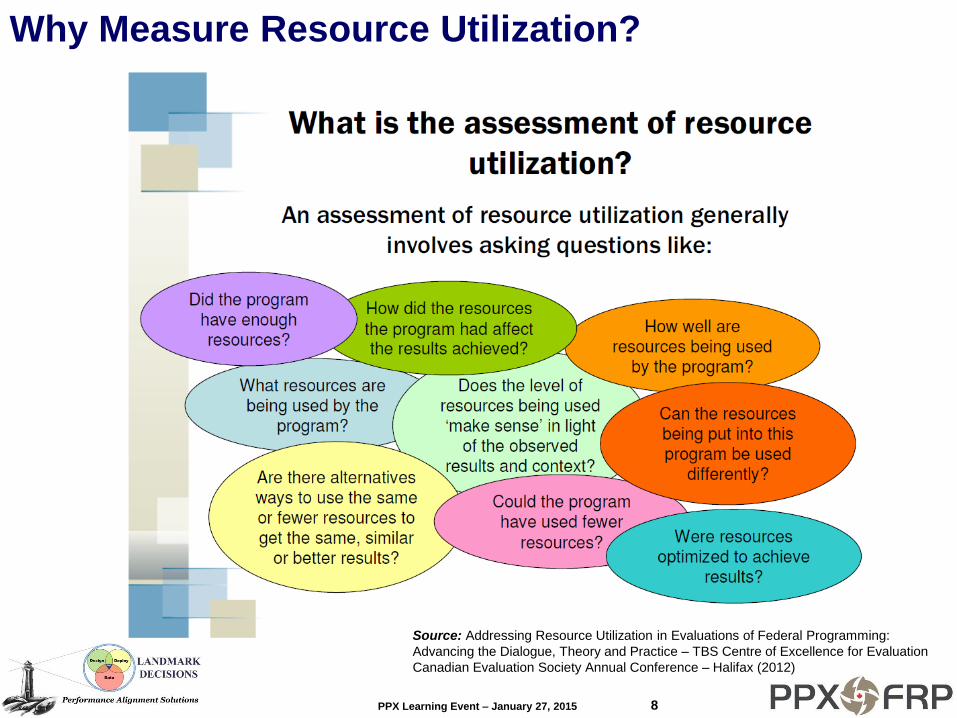
Why Measure Resource Utilization?
Source: Addressing Resource Utilization in Evaluations of Federal Programming:
Advancing the Dialogue, Theory and Practice – TBS Centre of Excellence for Evaluation
Canadian Evaluation Society Annual Conference – Halifax (2012)
PPX Learning Event – January 27, 2015 9
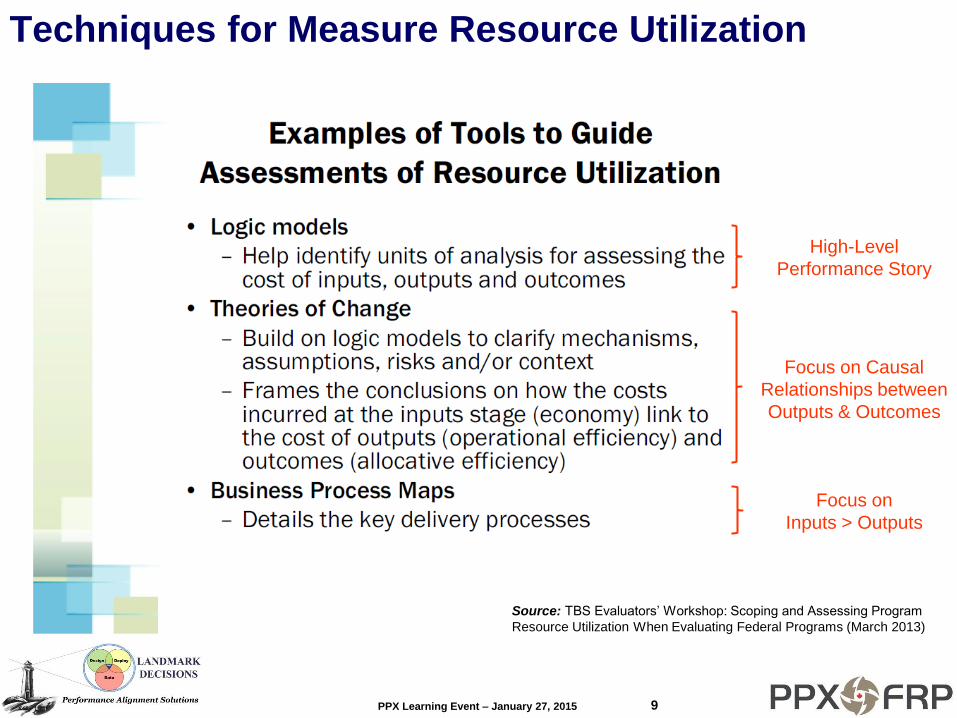
Techniques for Measure Resource Utilization
Source: TBS Evaluators’ Workshop: Scoping and Assessing Program
Resource Utilization When Evaluating Federal Programs (March 2013)
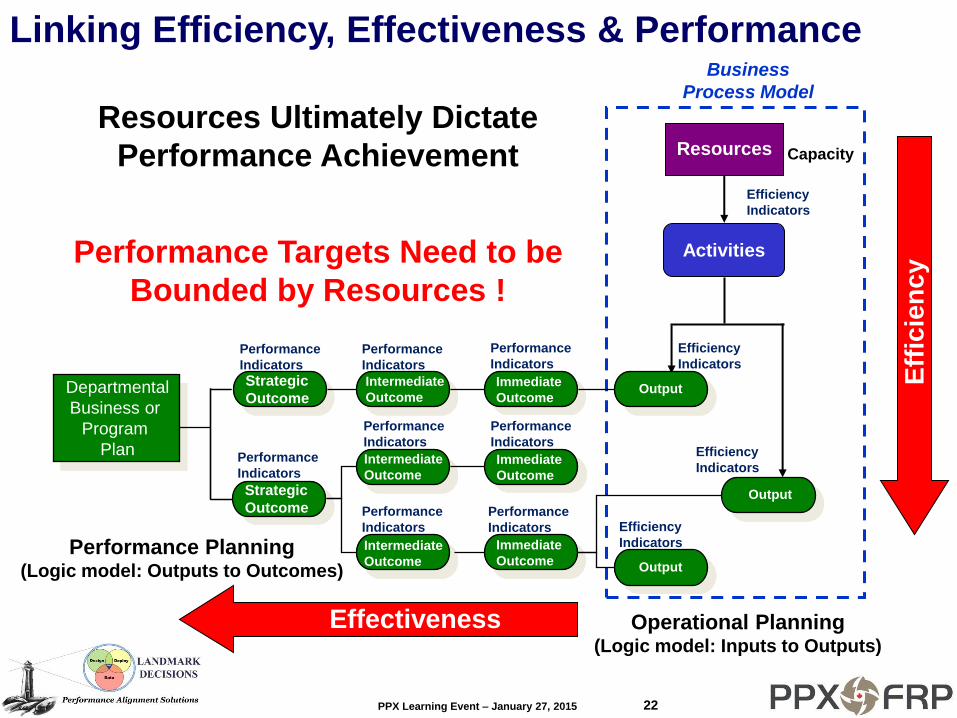
High-Level
Performance Story
Focus on Causal
Relationships between
Outputs & Outcomes
Focus on
Inputs > Outputs
PPX Learning Event – January 27, 2015 10
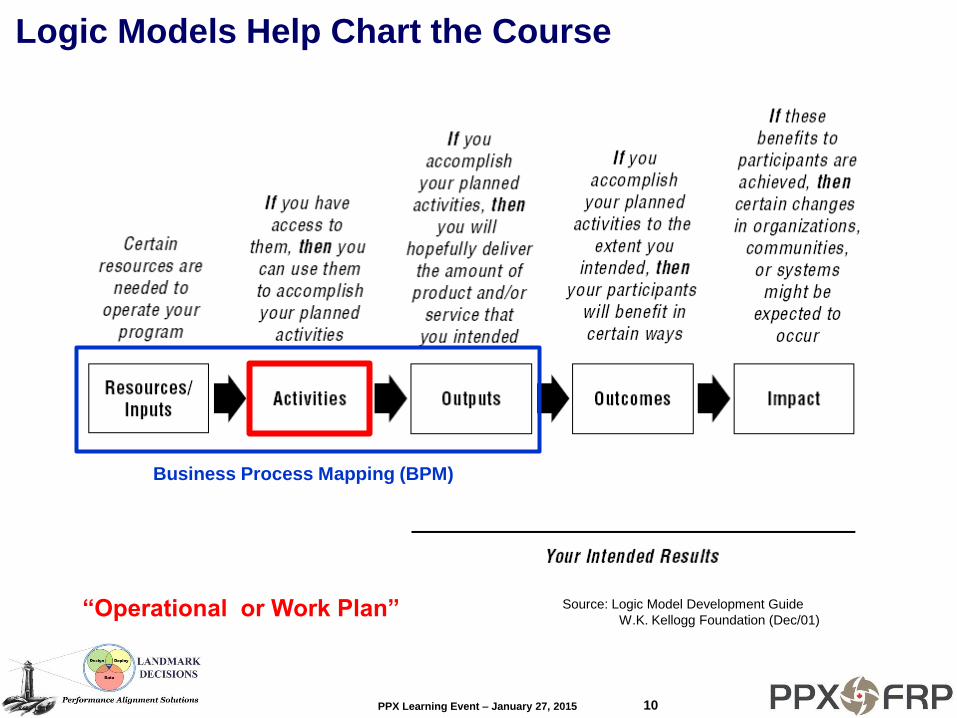
Source: Logic Model Development Guide
W.K. Kellogg Foundation (Dec/01)
Logic Models Help Chart the Course
“Operational or Work Plan”
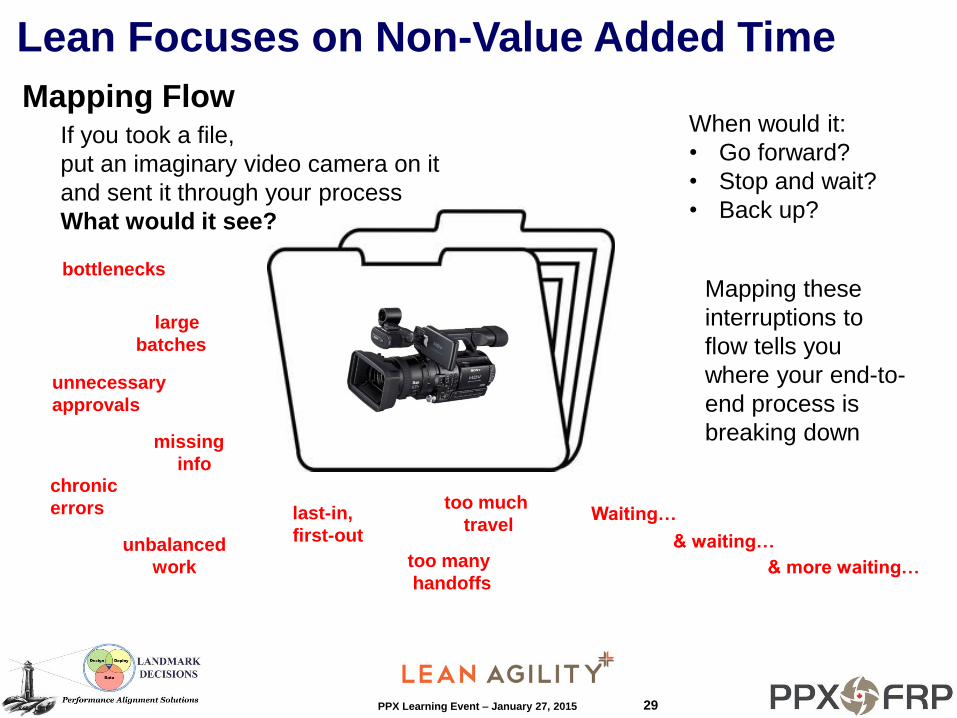
Business Process Mapping (BPM)
PPX Learning Event – January 27, 2015 11
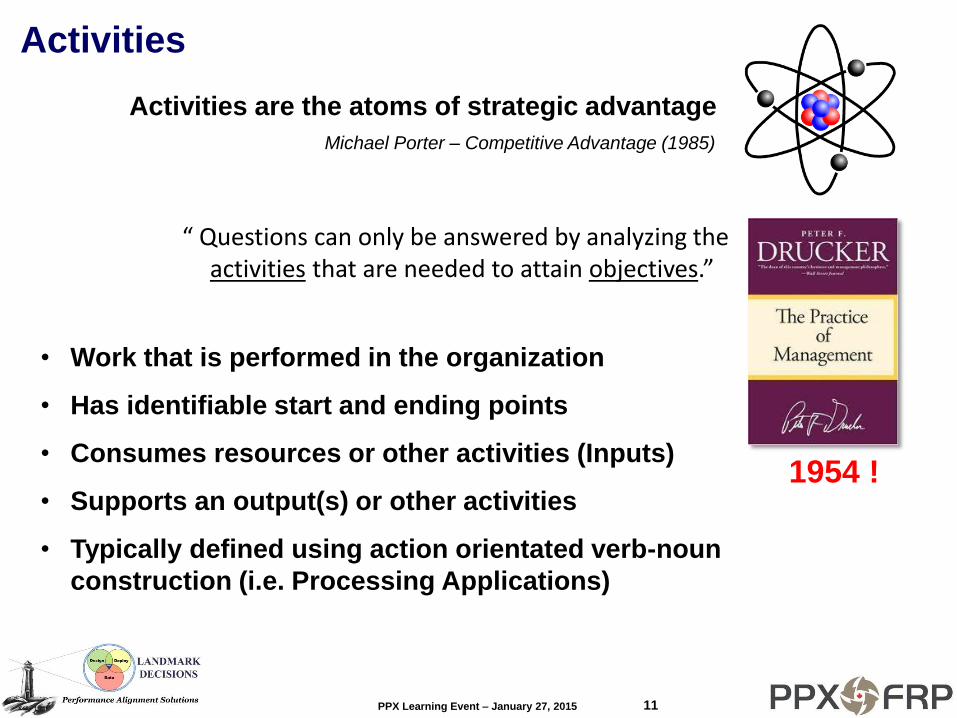
Activities
• Work that is performed in the organization
• Has identifiable start and ending points
• Consumes resources or other activities (Inputs)
• Supports an output(s) or other activities
• Typically defined using action orientated verb-noun
construction (i.e. Processing Applications)
Activities are the atoms of strategic advantage
Michael Porter – Competitive Advantage (1985)
“ Questions can only be answered by analyzing the activities that are needed to attain objectives.”
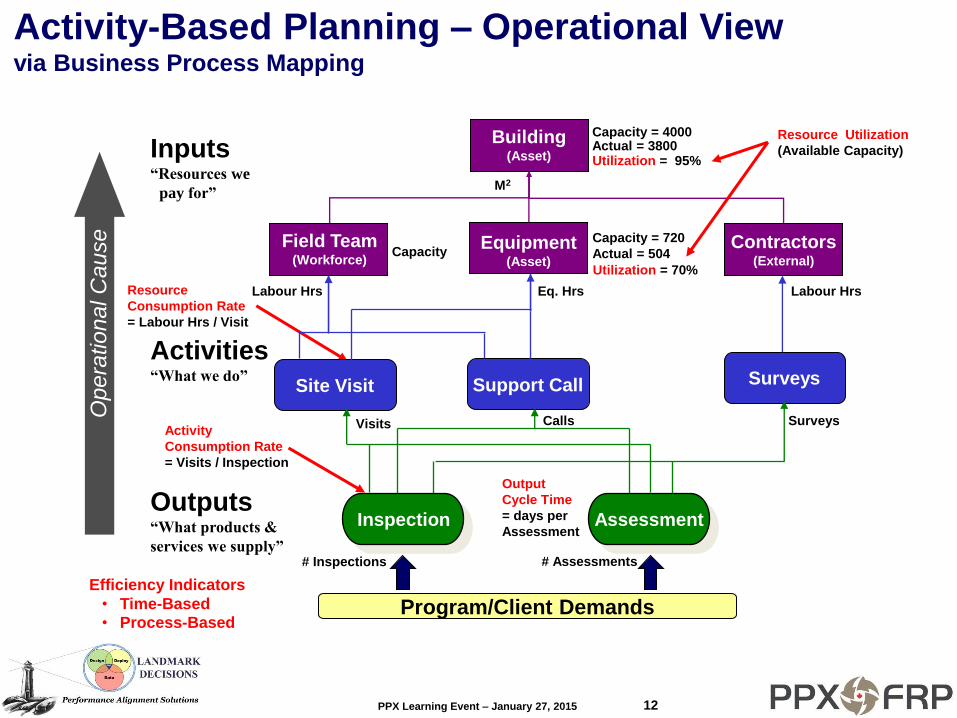
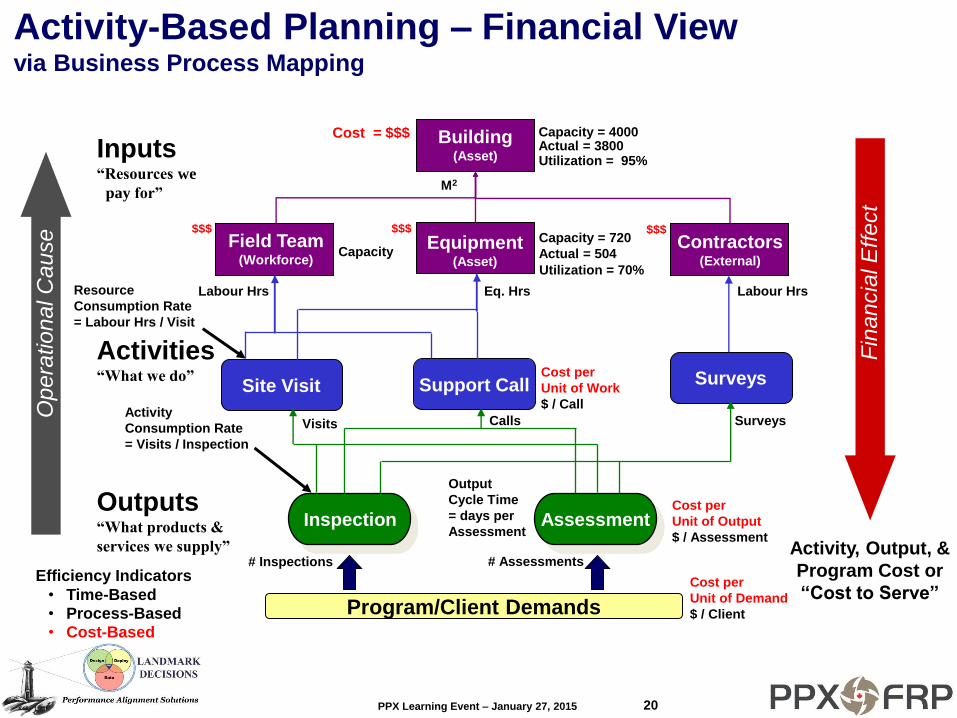
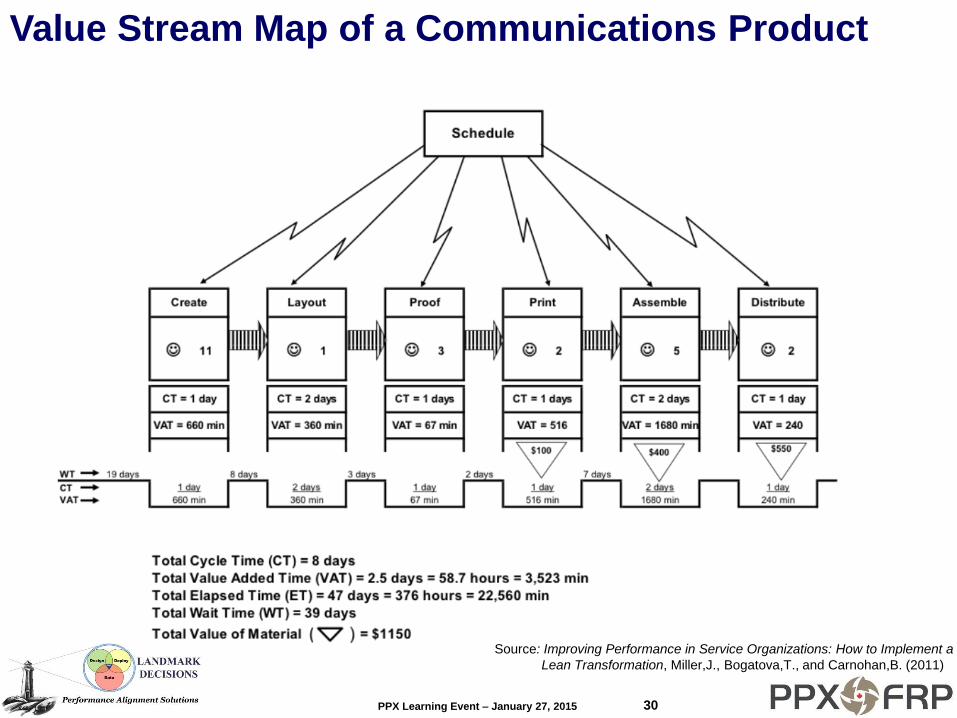
Activity-Based Planning – Operational View via Business Process Mapping
• Time-Based • Process-Based
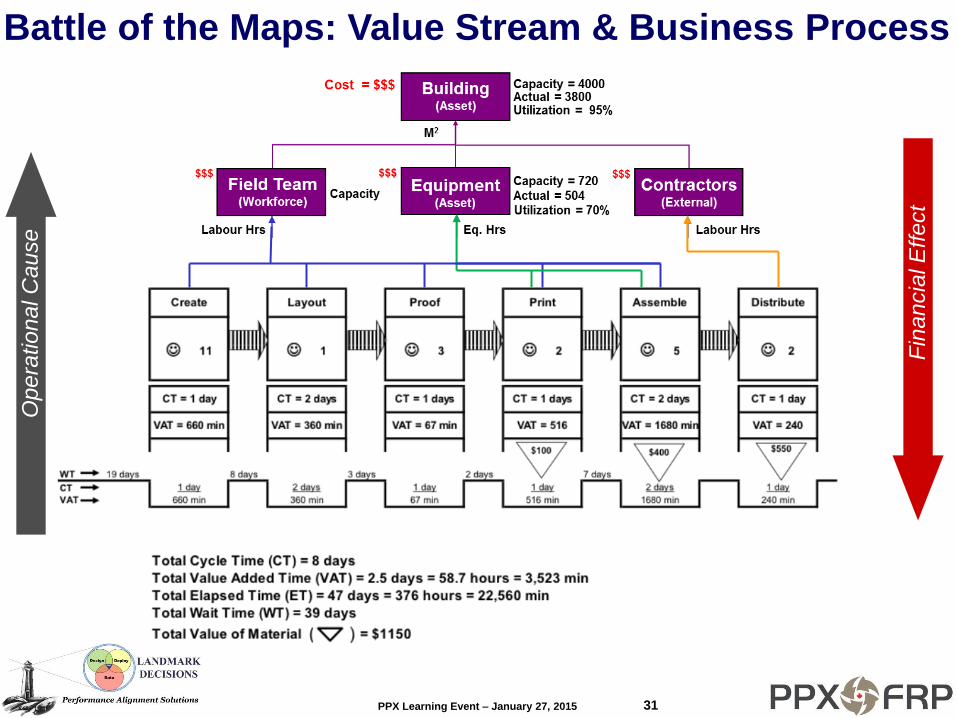
Utilization = 95%
Utilization = 70%
Resource Utilization
(Available Capacity)
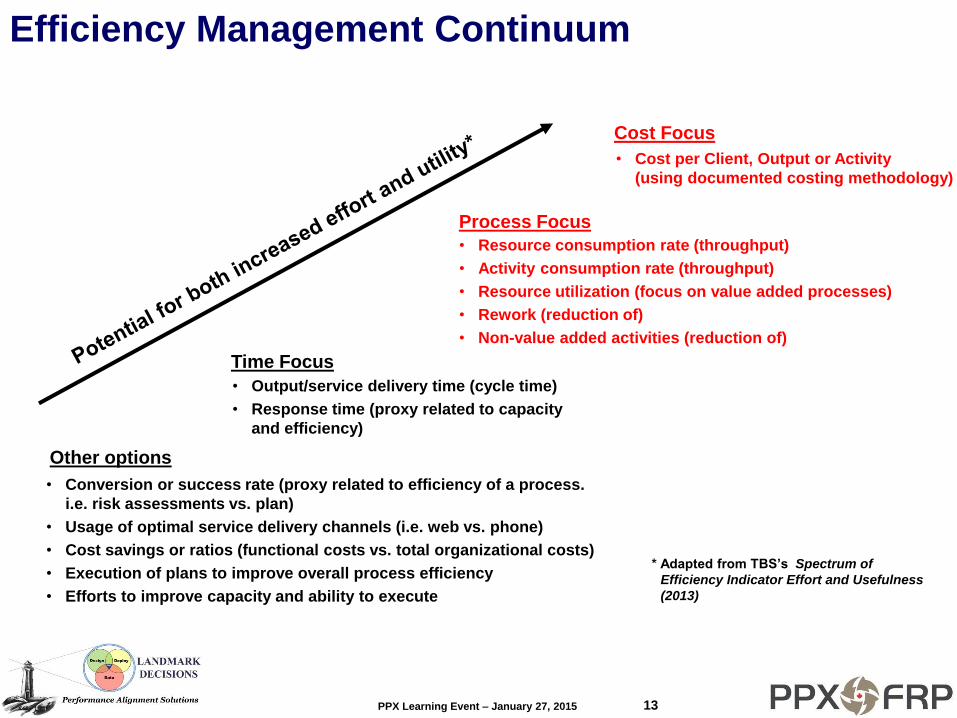
PPX Learning Event – January 27, 2015 13
Efficiency Management Continuum
• Cost per Client, Output or Activity
(using documented costing methodology)
Cost Focus
• Output/service delivery time (cycle time)
• Response time (proxy related to capacity
and efficiency)
Time Focus
• Resource consumption rate (throughput)
• Activity consumption rate (throughput)
• Resource utilization (focus on value added processes)
• Rework (reduction of)
• Non-value added activities (reduction of)
Process Focus
• Conversion or success rate (proxy related to efficiency of a process.
i.e. risk assessments vs. plan)
• Usage of optimal service delivery channels (i.e. web vs. phone)
• Cost savings or ratios (functional costs vs. total organizational costs)
• Execution of plans to improve overall process efficiency
• Efforts to improve capacity and ability to execute
Other options
* Adapted from TBS’s Spectrum of
Efficiency Indicator Effort and Usefulness
(2013)
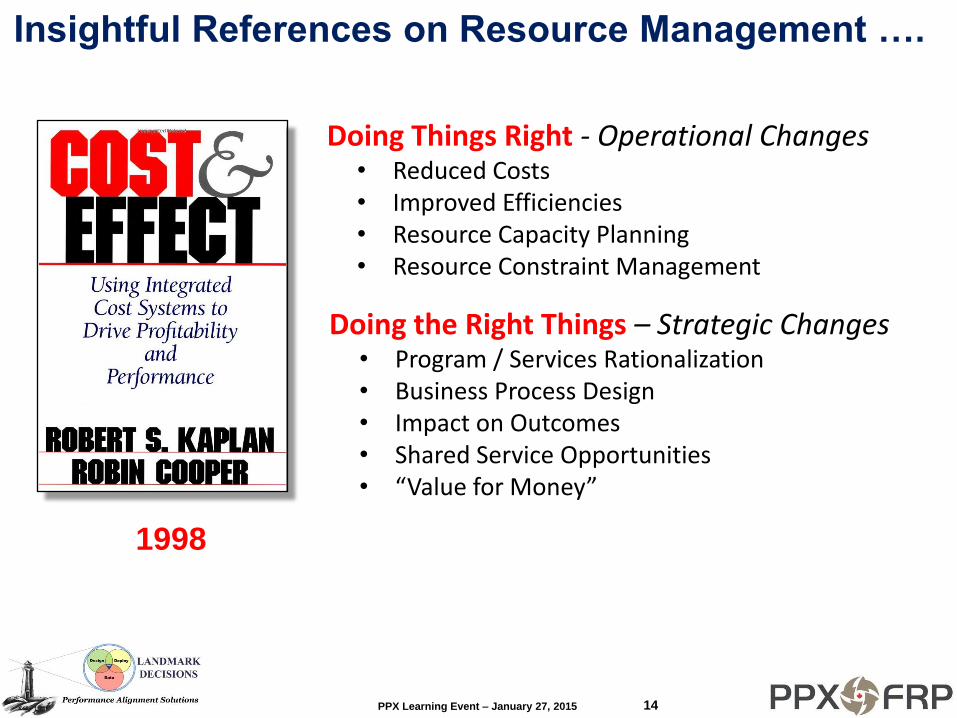
PPX Learning Event – January 27, 2015 14
Insightful References on Resource Management ….
Doing Things Right - Operational Changes • Reduced Costs • Improved Efficiencies • Resource Capacity Planning • Resource Constraint Management
1998
Doing the Right Things – Strategic Changes • Program / Services Rationalization • Business Process Design • Impact on Outcomes • Shared Service Opportunities • “Value for Money”
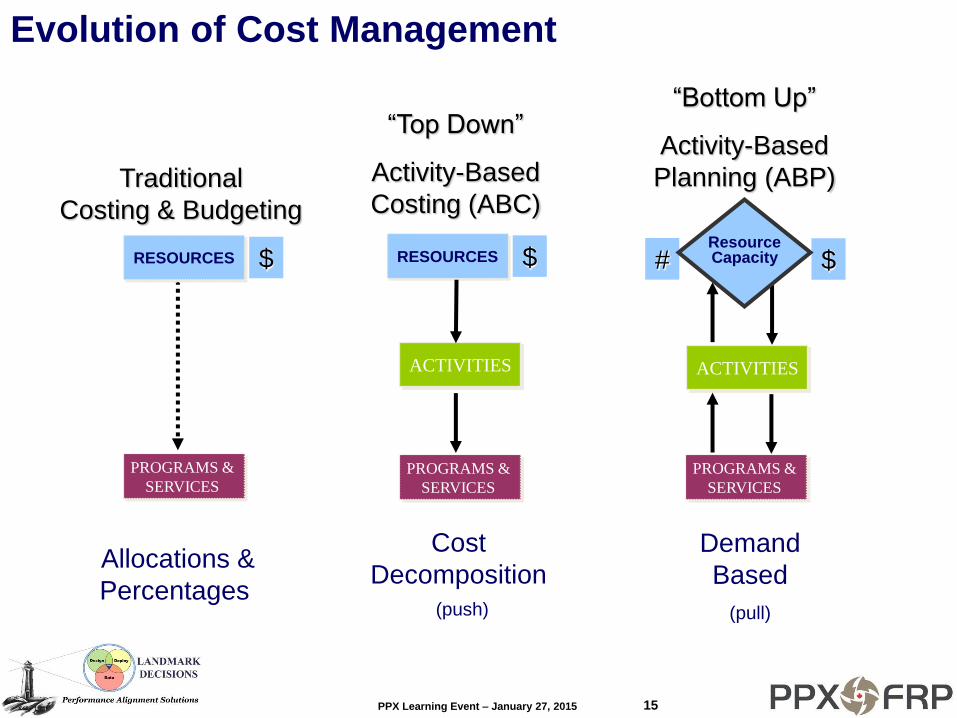
PPX Learning Event – January 27, 2015 15
Evolution of Cost Management
Traditional
Costing & Budgeting
PROGRAMS &
SERVICES
Allocations &
Percentages
RESOURCES $ $
“Bottom Up”
Activity-Based
Planning (ABP)
Demand
Based
(pull)
PROGRAMS &
SERVICES
# Resource Capacity
ACTIVITIES
“Top Down”
Activity-Based
Costing (ABC)
RESOURCES $
ACTIVITIES
PROGRAMS &
SERVICES
Cost
Decomposition
(push)
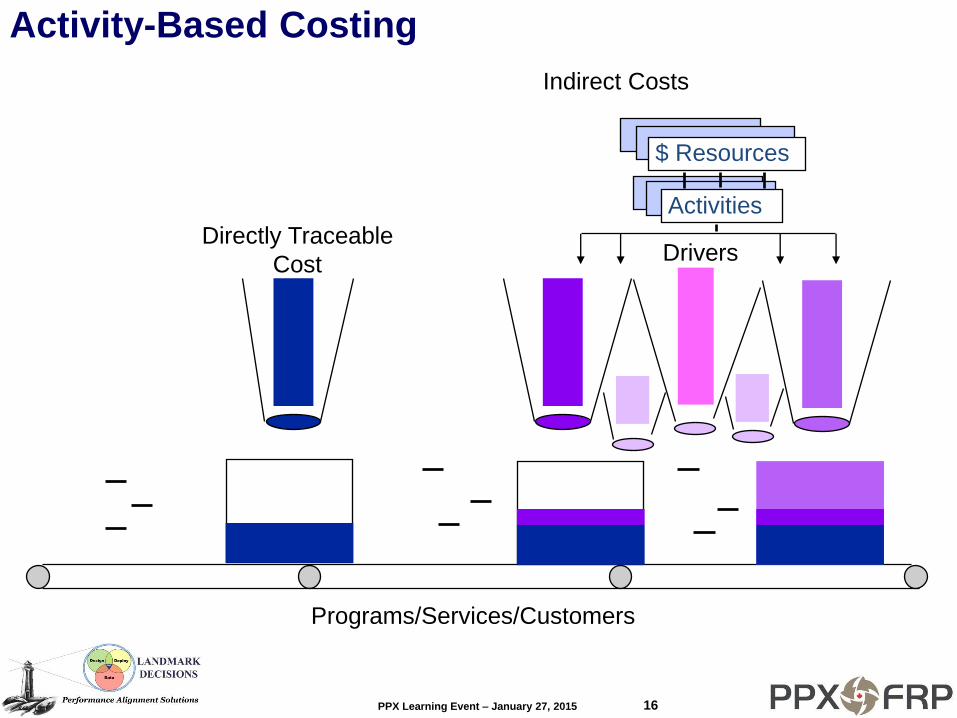
PPX Learning Event – January 27, 2015 16
Programs/Services/Customers
Activity-Based Costing
Directly Traceable
Cost Drivers
Activities
$ Resources
Indirect Costs
PPX Learning Event – January 27, 2015 17
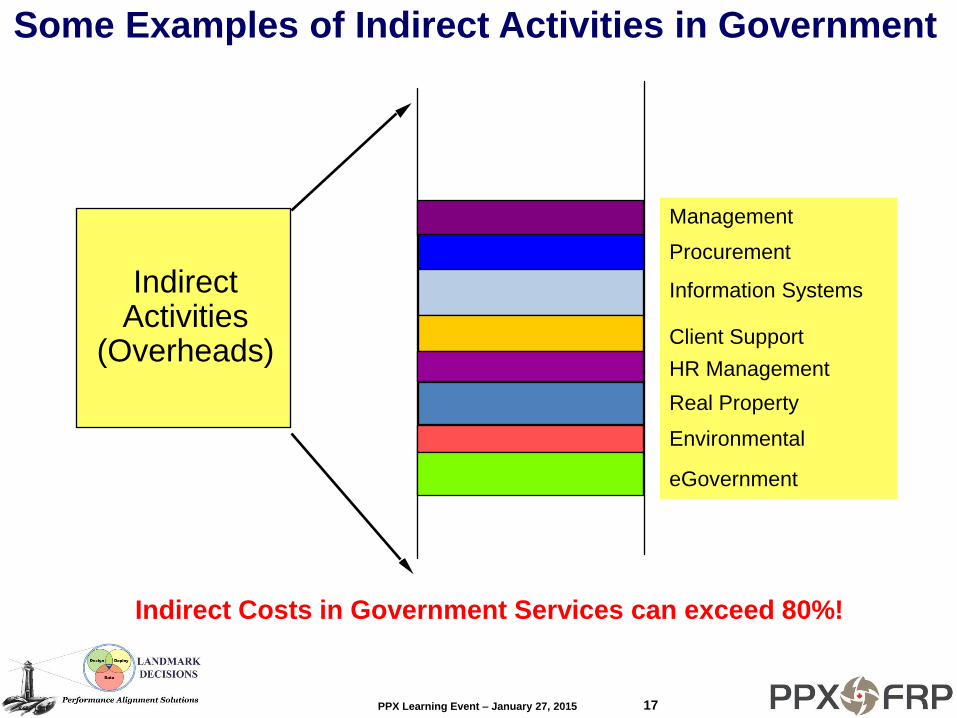
Some Examples of Indirect Activities in Government
Indirect Activities
(Overheads)
Management
Information Systems
Client Support
Real Property
eGovernment
Environmental
Procurement
HR Management
Indirect Costs in Government Services can exceed 80%!
PPX Learning Event – January 27, 2015 18
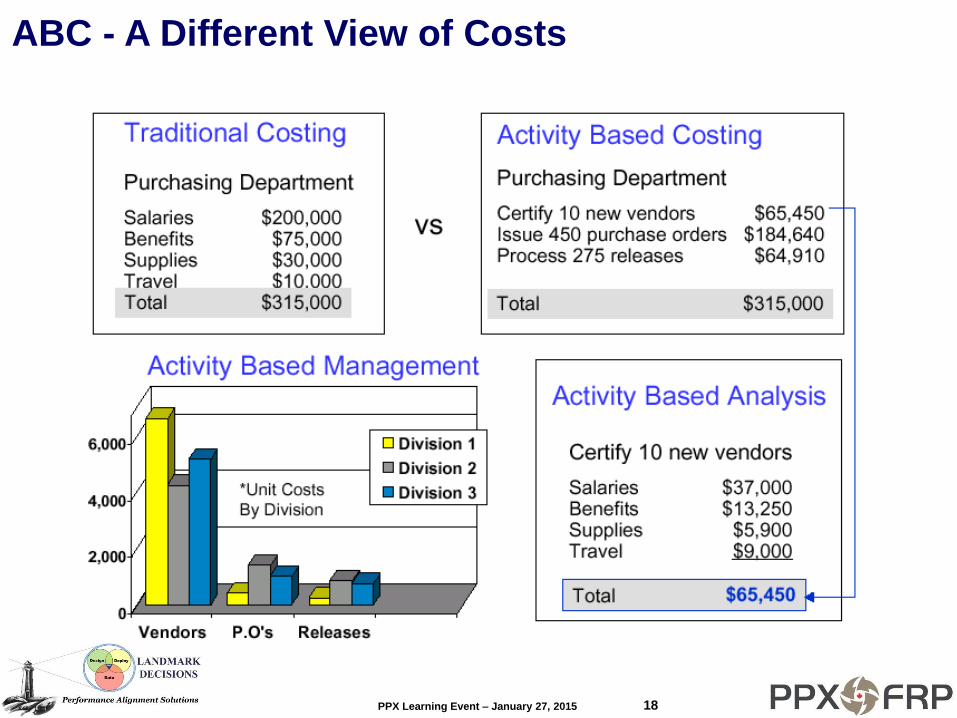
ABC - A Different View of Costs
PPX Learning Event – January 27, 2015 19
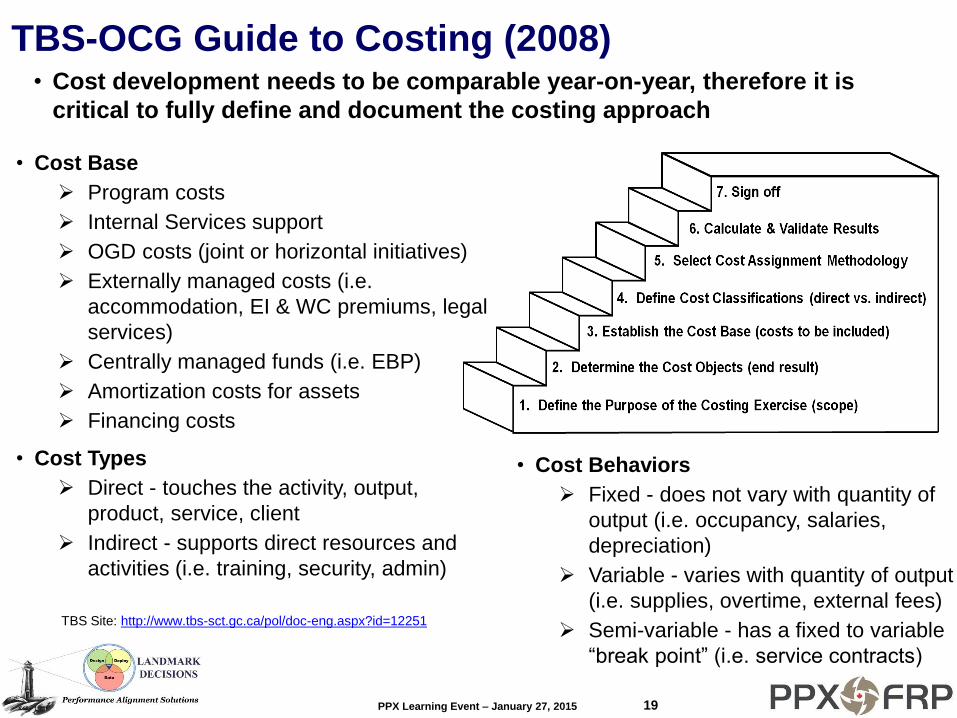
TBS-OCG Guide to Costing (2008) • Cost development needs to be comparable year-on-year, therefore it is
critical to fully define and document the costing approach