Sponsored by the Propel Schools Foundation Expanding Charter School Capacity The Case of Propel Montour LOUIS T. MARIANO, ELIZABETH D. STEINER, JOSEPH D. PANE, REBECCA ANN LAWRENCE C O R P O R A T I O N
Transcript
Sponsored by the Propel Schools Foundation
Expanding Charter School CapacityThe Case of Propel Montour
LOUIS T. MARIANO, ELIZABETH D. STEINER, JOSEPH D. PANE, REBECCA ANN LAWRENCE
For more information on this publication, visit www.rand.org/t/RRA1184-1.
About RANDThe RAND Corporation is a research organization that develops solutions to public policy challenges to help make communities throughout the world safer and more secure, healthier and more prosperous. RAND is nonprofit, nonpartisan, and committed to the public interest. To learn more about RAND, visit www.rand.org.
Research IntegrityOur mission to help improve policy and decisionmaking through research and analysis is enabled through our core values of quality and objectivity and our unwavering commitment to the highest level of integrity and ethical behavior. To help ensure our research and analysis are rigorous, objective, and nonpartisan, we subject our research publications to a robust and exacting quality-assurance process; avoid both the appearance and reality of financial and other conflicts of interest through staff training, project screening, and a policy of mandatory disclosure; and pursue transparency in our research engagements through our commitment to the open publication of our research findings and recommendations, disclosure of the source of funding of published research, and policies to ensure intellectual independence. For more information, visit www.rand.org/about/principles.
RAND’s publications do not necessarily reflect the opinions of its research clients and sponsors.
Limited Print and Electronic Distribution RightsThis document and trademark(s) contained herein are protected by law. This representation of RAND intellectual property is provided for noncommercial use only. Unauthorized posting of this publication online is prohibited. Permission is given to duplicate this document for personal use only, as long as it is unaltered and complete. Permission is required from RAND to reproduce, or reuse in another form, any of its research documents for commercial use. For information on reprint and linking permissions, please visit www.rand.org/pubs/permissions.
In fall 2017, Propel Schools initiated the expansion of one of its schools, Propel Montour. Originally a single K–8 school with two classrooms per grade, Montour added a new high school and expanded into separate elementary and middle schools over four years, adding a classroom to each grade. In this report, we used difference-in-difference and doubly robust regression models to examine the academic and behavioral experiences of both continuing and expansion Montour students from fall 2017 through the onset of the coronavirus disease 2019 (COVID-19) pandemic in spring 2020. Our analyses did not find evidence that the academic and behavioral experiences of either the continuing or expansion students fell below what would have been expected absent expansion.
Although the expansion experiences of a single charter management organization (CMO) network might be idiosyncratic to that entity and the locale and population it serves, this report should be of interest to similarly structured CMOs, the organizations from which they might seek expansion funding, those involved in school choice policy, and state and local education leaders and policymakers.
RAND Education and Labor This study was undertaken by RAND Education and Labor, a division of the RAND
Corporation that conducts research on early childhood through postsecondary education programs, workforce development, and programs and policies affecting workers, entrepreneurship, and financial literacy and decisionmaking. This study was sponsored by The U.S. Department of Education through a subcontract with Propel Schools Foundation. Propel Schools is a nonprofit charter school network based in Pittsburgh, Pennsylvania.
More information about RAND can be found at www.rand.org. Questions about this report should be directed to [email protected], and questions about RAND Education and Labor should be directed to [email protected].
Acknowledgments We thank our RAND colleagues Stephanie Lonsinger, Sophie Meyers, Laura Hamilton, and
John F. Pane for their contributions to this project, and we thank Propel Schools for partnering with us on this work. This report benefited substantively from feedback from Katherine Carman, Benjamin Master, Jonathan Schweig, and Robin Lake, as well as Tina Chekan, Sandra Bly, Anthony Esoldo, and their colleagues at Propel Schools. Brittany Joseph provided expert administrative support.
About This Report .......................................................................................................................... iiiFigures and Tables .......................................................................................................................... v1. Introduction ................................................................................................................................. 1
Propel Schools and the Expansion of Propel Montour ............................................................................. 3Focus of This Report ................................................................................................................................. 6
2. Data Sources and Methods .......................................................................................................... 7Student Outcome Data and Analyses ........................................................................................................ 7Limitations .............................................................................................................................................. 11
3. Results ....................................................................................................................................... 13Achievement of Continuing Students ..................................................................................................... 13Achievement of Expansion Students ...................................................................................................... 16Behavior Outcomes of Continuing Students .......................................................................................... 21Behavior Outcomes of Expansion Students ............................................................................................ 25
Figures Figure 3.1. Estimates of the Effect of Montour Expansion on Continuing Students
Relative to Comparable Non-Montour Propel Students—MAP Assessment ....................... 15Figure 3.2. Estimates of the Effect of Montour Expansion on Continuing Students
Relative to Comparable Non-Montour Propel Students—PSSA Assessment ...................... 16Figure 3.3. Estimates of the Effect of Montour Expansion on Expansion Students
Relative to Comparable Non-Montour Propel Students—MAP Assessment ....................... 18Figure 3.4. Estimates of the Effect of Montour Expansion on Expansion Students
Relative to Comparable Continuing Montour Students—MAP Assessment ....................... 19Figure 3.5. Estimates of the Effect of Montour Expansion on Expansion Students
Relative to Comparable Non-Montour Propel Students—PSSA Assessment ...................... 20Figure 3.6. Estimates of the Effect of Montour Expansion on Expansion Students
Relative to Comparable Continuing Montour Students—PSSA Assessment ...................... 21Figure 3.7. Estimates of the Effect of Montour Expansion on Continuing Students
Relative to Comparable Non-Montour Propel Students—Attendance ................................. 23Figure 3.8. Estimates of the Effect of Montour Expansion on Continuing Students
Relative to Comparable Non-Montour Propel Students—Office Referrals ......................... 24Figure 3.9. Estimates of the Effect of Expansion on Continuing Students Relative to
Comparable Non-Montour Propel Students—Suspensions .................................................. 25Figure 3.10. Estimates of the Effect of Montour Expansion on Expansion Students
Relative to Comparable Non-Montour Propel Students—Attendance ................................. 26Figure 3.11. Estimates of the Effect of Montour Expansion on Expansion Students
Relative to Comparable Continuing Montour Students—Attendance .................................. 27Figure 3.12. Estimates of the Effect of Montour Expansion on Expansion Students
Relative to Comparable Non-Montour Propel Students—Office Referrals ......................... 28Figure 3.13. Estimates of the Effect of Montour Expansion on Expansion Students
Relative to Comparable Continuing Montour Students—Office Referrals .......................... 29Figure 3.14. Estimates of the Effect of Montour Expansion on Expansion Students
Relative to Comparable Non-Montour Propel Students—Suspensions ............................... 30Figure 3.15. Estimates of the Effect of Montour Expansion on Expansion Students
Relative to Comparable Continuing Montour Students—Suspensions ................................ 31Figure A.1. Estimates of MAP Performance: Continuing Students Versus VCG Students ......... 57Figure A.2. Estimates of MAP Performance: Expansion Students Versus VCG Students .......... 58
vi
Tables Table 1.1. Propel Schools in 2017 and 2021 .................................................................................. 4Table 1.2. Propel Montour Expansion Plan .................................................................................... 4Table A.1. Propel Student Characteristics .................................................................................... 36Table A.2. Continuing Montour Students Follow a Normal Grade Progression .......................... 41Table A.3. Expansion Montour Grades Available for Comparison with Non-Montour
Students ................................................................................................................................. 42Table A.4. Expansion Montour Grades Available for Comparison with Continuing
Montour Students .................................................................................................................. 42Table A.5. Difference-in-Difference Sample: Continuing Montour Versus Non-Montour
Propel .................................................................................................................................... 43Table A.6. Sample: Expansion Montour Versus Non-Montour Propel ........................................ 43Table A.7. Sample: Expansion Montour Versus Continuing Montour ........................................ 44Table A.8. Prebaseline (2015–2016 to 2016–2017) Balance Table: Continuing Montour
Versus Non-Montour Propel ................................................................................................. 45Table A.9. Year 1 Outcomes (2016–2017 to 2017–2018) Balance Table: Continuing
Montour Versus Non-Montour Propel .................................................................................. 46Table A.10. Year 2 Outcomes (2016–2017 to 2018–2019) Balance Table: Continuing
Montour Versus Non-Montour Propel .................................................................................. 47Table A.11. Year 3 Outcomes (2016–2017 to 2019–2020) Balance Table: Continuing
Montour Versus Non-Montour Propel .................................................................................. 48Table A.12. Year 1 Outcomes (2017–2018) Balance Table: Expansion Montour Versus
Non-Montour Propel ............................................................................................................. 49Table A.13. Year 2 Outcomes (2018–2019) Balance Table: Expansion Montour Versus
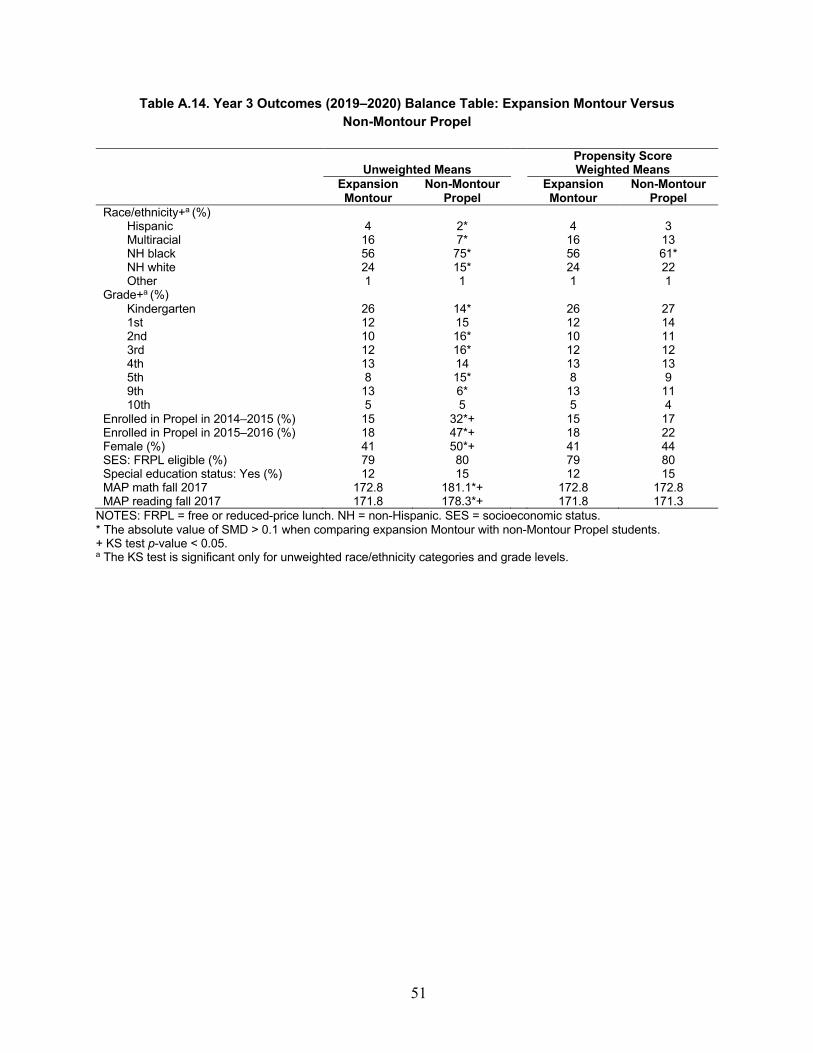
Non-Montour Propel ............................................................................................................. 50Table A.14. Year 3 Outcomes (2019–2020) Balance Table: Expansion Montour Versus
Non-Montour Propel ............................................................................................................. 51Table A.15. Year 1 Outcomes (2017–2018) Balance Table: Expansion Montour Versus
Continuing Montour ............................................................................................................. 52Table A.16. Year 2 Outcomes (2018–2019) Balance Table: Expansion Montour Versus
Continuing Montour ............................................................................................................. 53Table A.17. Year 3 Outcomes (2019–2020) Balance Table: Expansion Montour Versus
Continuing Montour ............................................................................................................. 54Table A.18. Balance Between Continuing Montour and VCG Groups on Variables Not
Exactly Matched ................................................................................................................... 55Table A.19. Balance Between Expansion Montour and VCG Groups on Variables Not
Charter schools are public schools that operate with the authorization—that is, the charter—of the local public school district or state. According to the National Charter School Resource Center (NCSRC), “Charter schools are exempt from significant state or local regulations related to operation and management but otherwise adhere to regulations of public schools—for example, charter schools cannot charge tuition or be affiliated with a religious institution” (NCSRC, undated). Like district-operated schools, charter schools are accountable to the families that choose to enroll their students, but they generally have more flexibility in school operations and management.
According to the National Alliance for Public Charter Schools, a majority of charter schools operate as independent, stand-alone schools; only about one-third are operated by charter management organizations (CMOs) (Gerstenfeld and Xu, 2021). CMOs are nonprofit entities that operate groups of charter schools regionally or nationally. Charter schools have proliferated in the United States in recent years. In 2010, approximately 1.75 million students attended charter schools (National Center for Education Statistics, 2021). By the 2018–2019 school year, there were about 7,500 charter schools nationally, and these schools were attended by approximately 3 million students (NCSRC, undated). This growth likely can be attributed to (1) substantial public and philanthropic investment from the Obama administration and from large, national foundations and (2) policy support for charter school expansion at the state level (e.g., in California, Florida, and Arizona) (Smith et al., 2009). Together, these factors likely allowed existing charter schools to increase capacity, existing CMOs to expand, and new single charter schools to proliferate.
The apparent success of some CMOs in raising achievement among vulnerable student populations (see, e.g., Angrist et al., 2010, 2012; Dobbie and Fryer, 2011; and Hoxby and Rockoff, 2004) sparked national interest in whether charter schools that had demonstrated some success could be expanded—or replicated—to serve more students. In a national study of CMO effectiveness, Furgeson and colleagues, 2012, noted that a key mission of a CMO is to replicate promising practices and “promote consistent results across multiple schools” (p. xxix). Of course, this is easier said than done. Efforts to replicate successful schools raise questions about whether the new school will be immediately successful or to what extent the model will evolve—with positive or negative effects—as existing schools expand or as more schools are added to the network (Peltason and Raymond, 2013).
Prior research has identified numerous common challenges among charter schools seeking to replicate or expand. In a comprehensive 2010 study, Lake and colleagues found that CMOs that operated elementary and middle schools had difficulty transferring their models to high school.
2
CMOs operating schools at all grade levels experienced challenges hiring and retaining highly qualified staff in schools that offered longer school days and had demanding approaches to instruction and student discipline. According to Baker, 2016, financial sustainability also was a common challenge. Lake and colleagues also note that charter schools tend to receive less funding than public schools that are operated by districts, and many rely heavily on philanthropic support to break even (Lake et al., 2010).
CMO performance varies widely; some CMOs have more positive impacts on student achievement as they expand, while others have declining impacts, but there is no evidence that the number of schools in a CMO is linked to positive (or negative) effects on student academic outcomes (Furgeson et al., 2012). More than one study has found that new expansion schools within a CMO produce comparable or slightly better student academic outcomes than the preexisting schools (Cohodes, Setren, and Walters, 2021; Peltason and Raymond, 2013).
Beyond academic achievement, charter schools—like all schools—aim to support students’ social and behavioral development. Few studies examine these topics in the context of charter school attendance broadly (McEachin et al., 2020), and we did not find any empirical studies that examined the impact of charter school expansion or replication on such student behavioral outcomes as attendance, office referrals, or suspensions. However, there is some evidence that charter school attendance can have positive effects on short-term behavioral outcomes, such as absenteeism and suspensions, and on long-term outcomes, such as voting behavior and incarceration (Dobbie and Fryer, 2015; Gill et al., 2018; McEachin et al., 2020).
Exploring how the expansion of a single school in a small, regional charter school network affects the achievement and behavioral outcomes of continuing and expansion students is timely given the coronavirus disease 2019 (COVID-19) pandemic. By some accounts, parents who are frustrated with their district-run public schools are enrolling their students elsewhere, and some are choosing charter schools (Peterson, 2021). If this pattern continues, some charter schools and networks will need to expand their capacity while maintaining their school cultures and academic standards.
In this report, we examine the expansion of Propel Schools from 2017 through 2021. Propel Schools is a small, regional charter school network in southwestern Pennsylvania. Over the course of four years, Propel Schools expanded one of its schools—Propel Montour—from a K–8 school with all grades housed in a single building to separate elementary, middle, and high schools, with grades K–5 housed in one building and grades 6–12 located in another building. The expansion involved adding one classroom of students at each existing grade level (K–8) and adding a high school to serve grades 9 through 12 (see Table 1.2 later in this chapter). These changes were expected to increase enrollment by about 500 students over the four years of the expansion. Broadly, the goal of the expansion was to replicate the Propel model to assist educationally disadvantaged students to meet high academic and behavioral standards. Therefore, we investigate the Propel Montour expansion and its impact on academic and
3
behavioral outcomes for both continuing students (i.e., students who attended Propel Montour prior to and during the expansion) and expansion students (i.e., students who newly enrolled at Propel Montour during the expansion).1
In the next section, we provide a brief description of the Propel Schools network and the goals and design of the Montour expansion. We then describe our research questions, the scope of the evaluation. In the next chapter, we discuss the data and methodologies used in this study. Next, we share our findings on the achievement and behavioral outcomes of continuing and expansion students. We conclude with a discussion of our findings and implications for policy and practice. A technical appendix accompanying this report provides greater detail regarding our data, samples, and methodology. We hope that the findings in this report will help charter school leaders think about how expanding a school could affect both continuing and expansion students and the broader school community of teachers and parents.
Propel Schools and the Expansion of Propel Montour Propel Schools was founded in 2003 in Pittsburgh, Pennsylvania, and initially educated about
170 elementary school students in a single location. Since then, the Propel network has grown to include 13 schools in the Pittsburgh region and to serve about 4,000 students in grades K–12. As of the writing of this report, in spring 2021, Propel included two elementary schools, six K–8 schools, two middle schools, and three high schools. In the school year before the expansion of Propel Montour, in 2016–2017, the network served about 3,600 students in grades K–12 and included ten schools, as shown in Table 1.1. Propel’s mission is to provide high-quality education to students in high-poverty communities. A majority of Propel students qualify for free or reduced-price lunch and identify as black or African American. A sizable minority of students—about 20 percent—have special needs. Table A.1 in the technical appendix presents a full description of Propel student characteristics.2
1 The small number of students (13) who attended other Propel schools in the 2016–2017 school year but transferred to Propel Montour during the initial expansion year (2017–2018) were categorized as expansion students. 2 In comparison, the Pittsburgh Public School District, which is the largest public school district in the region, operated 54 schools and served slightly more than 21,000 students in 2021.
4
Table 1.1. Propel Schools in 2017 and 2021
Grade Levels Served
Number of Schools
2017 2021 Elementary (K–5) 1 2
K–8 7 6
Middle (grades 6–8) 0 2
High (grades 9–12) 2 3
Since its founding in 2003, Propel has expanded slowly. The network began with one school,
which opened in 2003, followed by two more schools in 2005, one in 2007, two each in 2008 and 2010, and one each in 2011, 2012, and 2013. Propel’s size as of 2021—13 schools serving about 3,600 students—is on par with a majority of CMOs nationally (Lake et al., 2010).
In 2014–2015, Propel faced lengthening student waiting lists for existing grade levels and increased parental demand for high school seats at Propel Montour. To accommodate the growing demand, Propel applied for U.S. Department of Education funding to expand Propel Montour and partnered with the RAND Corporation to serve as the independent evaluator.3 In 2017, Propel Montour served about 400 students in grades K–8. The expansion plan, which would approximately double the number of students served, is shown in Table 1.2.
Table 1.2. Propel Montour Expansion Plan
Expansion Year School Year Classrooms Added to Existing
Grades Grade Levels Added
1 2017–2018 1 classroom in each of grades K–5 9th, plus about 25 10th-graders
2 2018–2019 1 classroom in grade 6 10th, plus about 25 11th-graders
3 2019–2020 1 classroom in grade 7 11th, plus about 25 12th-graders
4 2020–2021 1 classroom in grade 8 12th NOTE: The 9th grade 2017–2018 class size was approximately 82 students, an increase of approximately 30 students from the previous year.
As noted earlier, the high-level goal of the expansion was to replicate the Propel model to
assist educationally disadvantaged students to meet high academic and behavioral standards. The expansion aimed to continue the pace of learning for continuing students; ensure that expansion students’ academic outcomes were positive and comparable with those of continuing students;
3 Propel originally planned to expand two schools under this grant. Plans to expand the second school, Propel Northside, were not carried out because of decreased parental demand between the time at which the grant proposal was written and the time at which expansion began.
5
and maintain a healthy, positive school culture and climate. Thus, our research questions (RQs), which we discuss in the next section, focus on these topics.
According to Propel administrative data, the Montour expansion was implemented as planned; estimated enrollment increased by one classroom (20 to 30 students) in each of the K–5 grades, a 9th-grade level was added, and there were approximately 25 additional 10th-grade students in the initial expansion year. These estimated enrollment increases follow the standard grade progression in years 2 and 3 of the expansion, given standard rates of attrition.
According to Propel program documents, the new Montour Middle School, which served grades 6–8, adopted the same curriculum, instructional practices, and behavioral norms (as age-appropriate) that were in use in the prior K–8 school. Montour High School translated existing Propel Montour behavioral norms into age-appropriate norms for high school students and adopted a blend of curricula, instructional practices, and behavioral practices that were in use at other Propel schools. Replication also involved staffing the new schools with experienced Propel principals and teachers who could perpetuate the Propel school culture and model it for new students and staff. New teachers received coaching support from Propel coaches, veteran teachers, and the school principal. The gradual expansion, in which new (i.e., expansion) students entered the school alongside continuing Propel Montour students in the same grade level also was intended to facilitate replication. Continuing students would be familiar with Propel Montour culture and values and, in theory, would model and impart those values to expansion students. The principal of each Montour school was responsible for implementing the expansion with support from central administration.
According to interviews with Propel central office administrators, the three principals hired in the first year of the expansion were all Propel veterans. One principal remained in the role throughout the four years of the evaluation, one principal remained in the role for the first two years of the expansion, and the third principal remained in the role for only the first year of the expansion. One of the two principals who left was replaced by a Propel veteran; the other principal was replaced by an outside hire. Propel made an effort to staff the three Montour schools with veteran Propel teachers.
At the same time, Propel was implementing two network-wide initiatives that were in place at Propel Montour and that might have played a role in the way the expansion affected student outcomes. The first initiative focused on reducing behavioral incidents, such as suspensions and office referrals. This initiative grew out of the national emphasis (at the time) on addressing disparities in discipline incidents between white students and students of color. At Propel, this initiative focused on training school staff in the use of restorative practices, which emphasize building positive adult-student relationships that foster belonging, social engagement, and accountability to foster positive school climates. The approach discourages the use of such punitive measures as office referrals, suspensions, and expulsions (Institute for Restorative Justice and Restorative Dialogue, undated).
6
The second initiative was the Pittsburgh Urban Leadership Corps, through which Propel aimed to improve student achievement and school climate by training and supporting new principals. The program, which transitioned to a teacher residency program in 2020, aimed to decrease principal turnover and improve retention of a diverse group of principals by implementing a residency model. In the residency model, principals in training were paired with a mentor principal in a Propel school and afforded on-the-job learning, coaching, and support. Propel Montour hosted one such principal in training during the time we were studying the expansion. Propel Montour also hosted three teachers through the Propel Teacher Residency Program.
Focus of This Report We used a combination of data sources to explore the impacts of the expansion on student
achievement and behavioral outcomes. Although our study also examined school climate in the context of the expansion, because of the context of implementation at a single school (i.e., because individuals are identifiable), we are not able to report the findings. We address the following four broad RQs in this report:
1. Achievement of continuing students: How did the expansion of grades K–5, expansion and relocation of grades 6–8, and creation of Montour High School impact the achievement of continuing Montour students?
2. Achievement of expansion students: How did the achievement of Propel Montour expansion students compare with that of continuing Propel Montour students and non-Montour Propel students?
3. Behavioral outcomes of continuing students: Were there changes in the attendance and student disciplinary outcomes of continuing Montour students during the expansion period relative to non-Montour Propel students?
4. Behavioral outcomes of expansion students: How did the attendance and student disciplinary actions of Montour expansion students compare with those of continuing Propel Montour students and non-Montour Propel students?
The final 18 months of the study coincided with the COVID-19 pandemic. Although the phased approach to expansion allowed Propel to proceed with year-four additions as planned, the Commonwealth of Pennsylvania suspended the statewide assessment in spring 2020, and Propel similarly suspended administering its internal spring assessments. The necessity of remote learning led to gaps in the collection of student attendance data and measures of behavioral outcomes, such as suspensions and referrals. Thus, our ability to measure student academic and behavioral outcomes in the final two years of the study was curtailed. In consequence, this report focuses on student academic and behavioral outcomes in the first three years of the expansion: school years 2017–2018, 2018–2019, and 2019–2020 until the onset of the COVID-19 pandemic. In the next chapter, we summarize our data sources and analytic methods; additional details are available in the technical appendix.
7
2. Data Sources and Methods
Student Outcome Data and Analyses We used secondary student data that are regularly collected by Propel for all students to
evaluate our four RQs. Our analysis of the impact of the Montour expansion on student achievement was informed by four assessment measures: the MAP Growth assessments for reading and math, which were developed by NWEA, and the Pennsylvania System of School Assessment (PSSA) for English language arts (ELA) and math (NWEA, undated; NWEA, 2016; Pennsylvania Department of Education, undated-b).
The MAP Growth assessment is a computer adaptive test that is administered three times annually (in fall, winter, and spring) in grades K–12. Content is mapped to state standards, and the assessment scores are vertically equated such that scores from adjacent grades are on the same scale and may be compared to inform growth. We treated the spring MAP assessment as a primary assessment outcome measure that informs student academic proficiency in each year. Propel did not administer the spring 2020 MAP assessment because of the COVID-19 pandemic, so we used the winter 2020 MAP results to inform academic outcomes in the third expansion year up to the point of the COVID-19 disruption.
The PSSA is administered annually in grades 3–8 to measure student proficiency relative to the Pennsylvania state curriculum standards. Pennsylvania did not administer the PSSA in spring 2020, and spring 2021 scores were not available at the time of this writing (we discuss additional concerns related to the COVID-19 disruption in the limitations section). We used the spring 2018 and 2019 PSSA student results in tandem with the MAP as a primary assessment outcome measure in the first two years of the expansion. Dual assessment measures, when available, provided a robustness check to the results and allowed us to identify sensitivities that might be idiosyncratic to one of the assessments.
We considered the impact of the Propel Montour expansion on student behavior by examining attendance, office referrals, and suspensions. We examined attendance by considering the proportion of school days in which the student had an unexcused absence and whether the student was a regular attendee—which is defined by the Pennsylvania Department of Education as “enrolled in a school for 90 or more school days and present 90 percent or more of these school days” (Pennsylvania Department of Education, undated-a).4 We examined office referrals in terms of whether the student had any and the proportion of days that the student experienced an office referral. Similarly, we evaluated suspensions by considering whether the student was
4 Propel monitors attendance using the Pennsylvania Department of Education’s definition of regular attendance (Pennsylvania Department of Education, undated-a).
8
ever suspended and, if so, the proportion of days that the student was suspended.5 We used proportions instead of counts (e.g., the proportion of school days with an unexcused absence instead of the number of days with an unexcused absence) to enable observations from the third implementation year—in which in-person attendance was cut short by the onset of the COVID-19 pandemic—to be interpreted on the same scale as those of the first two implementation years.
We used two primary methods to evaluate the effects of the Propel Montour expansion on the academic and behavioral outcomes of Montour students: difference-in-difference regression models for estimating effects on continuing students and doubly robust regression for estimating effects on expansion students. We briefly discuss each method next; additional detail can be found in the technical appendix.
Modeling Effects on Continuing Student Outcomes
We used difference-in-difference regression models to evaluate the impact of the Montour expansion on continuing Montour students (i.e., to address RQ1 and RQ3). These models compare the experiences of the continuing Montour students both before and after the start of expansion with those of similar students attending Propel schools other than Montour (who we refer to as non-Montour Propel students). Comparing the pre-post differences of continuing Montour students with those of non-Montour Propel students allowed us to control for changes that we would have expected to occur for Propel students absent the expansion because they were present for all Propel students. Student population characteristics varied across Propel campuses. To account for these differences, we used propensity scoring to weight the non-Montour Propel students to resemble continuing Montour students on a set of observed covariates that are potentially associated with our outcomes of interest. We used this propensity weighted comparison group in estimating the difference-in-difference estimates of the impact of expansion on continuing Montour students. Using propensity weighting helped ensure that any differences we observe between continuing Montour students and the non-Montour weighted comparison group were caused by the expansion and were not because the two groups differ on other important factors that might be influencing the outcomes. The covariates we used for propensity scoring included demographics (e.g., grade at baseline, whether the student was new to Propel in the year before the baseline year, gender, race/ethnicity, special education status, socioeconomic status), baseline behavioral data from the 2016–2017 school year (percentage
5 As a sensitivity analysis, we also examined the number of suspension incidents the student experienced. These results mirrored the results for the proportion of days suspended and are omitted from this report for brevity.
9
attendance, days with an office referral, days suspended), and baseline assessment data (MAP reading and math scores, PSSA ELA and math scores).6
We implemented the difference-in-difference regression models for preimplementation trends and then we estimated the effects of implementation.7 Differences on a given outcome between Montour students and comparable non-Montour students in this preimplementation period would indicate instability in that particular outcome before the expansion, which might complicate the interpretation of the difference-in-difference estimates.
After considering preimplementation trends, we implemented the difference-in-difference models for each outcome for each expansion year in which the outcome was available. Examining each outcome sequentially, as opposed to at just the first available or latest available time point, provides a window into how the implementation effects evolved over successive school years. Individual difference-in-difference models considered the relative change from just before implementation (i.e., the outcome measure in 2016–2017) to the time point considered by the model.
We expected the distributions of student behavior outcomes—unexcused absences, office referrals, and suspensions—to be asymmetrical, with a mode closer to zero. That is, we expected most students to attend regularly and that adverse events, such as an office referral or suspension, would be uncommon. However, this asymmetrical distribution was not consistent with the assumptions of a standard regression model. As is typical for such asymmetry, we considered the natural logarithm of the student behavior outcomes when we implemented difference-in-difference models for these outcomes.8 Because of the logarithmic transformation, it is most efficient to express the difference-in-difference effect estimates from these models as ratios of means. As noted earlier, we also considered binary versions of these outcome variables (e.g.,
6 Students who were enrolled at Propel before the baseline might be more accustomed to the culture and/or be used to Propel-specific tendencies that may or may not influence changes in outcomes. Socioeconomic status is Propel’s indicator of whether a student’s family is economically disadvantaged. Propel students receive this classification if the family meets the U.S. Department of Agriculture guidelines for free or reduced-price lunch, is receiving assistance under the Temporary Assistance to Needy Families program, or if any of the family’s children are eligible to receive medical assistance under the Medicaid program. Socioeconomic status was available starting in the 2016–2017 school year; it was included for the estimation of implementation effects but was unavailable when considering preimplementation trends. 7 The preimplementation trends difference-in-difference model considers differences on each academic and behavioral outcome from the 2015–2016 academic year (two years before implementation) to the 2016–2017 academic year (the year before implementation; i.e., the baseline year). 8 In particular, we used gamma regressions (McCullagh and Nelder, 1989) that featured a logarithmic transformation of the outcome, but with additional distributional flexibility than the standard logarithmic transformation for skewed data. See the technical appendix for details.
10
whether the student had any suspensions). We used a logistic regression framework for these binary difference-in-difference outcomes, with effect estimates expressed as odds ratios.9
Modeling Effects on Expansion Student Outcomes
To estimate the effects of the Montour expansion on the outcomes of expansion students (i.e., to address RQ2 and RQ4) we used propensity-weighted doubly robust regression models (Bang and Robins, 2005; Ridgeway and McCaffrey, 2007). We considered these effects relative to two separate comparison groups: non-Montour Propel students and continuing Montour students. These two comparison groups allowed us to estimate (1) the experiences of students who were new to Propel in an expansion environment relative to the expected outcomes of typical Propel students who were not experiencing expansion and (2) how the expansion students would have fared if they had been continuing students experiencing expansion.
As noted earlier, student population characteristics varied across Propel campuses. In addition, the characteristics of the expansion Montour students were different from those of their continuing peers (see Table A.1 in the technical appendix). Our doubly robust estimation procedure used a two-step process to account for these differences. For each comparison group, we first used propensity scores to weight the comparison students to be as similar as possible to the expansion students. Then, we used these propensity score–based weights to fit a weighted multiple regression model to estimate the effect of the expansion on each student outcome. The procedure is considered doubly robust because if either the propensity score model in the first step or the outcome regression model in the second step is correct, a consistent estimate of the expansion effect is produced (Bang and Robins, 2005). The covariates in the propensity score and outcome regression models included demographics (e.g., grade at the beginning of the 2017–2018 school year, gender, race/ethnicity, socioeconomic status, special education status) and fall 2017 MAP reading and math scores.10 We again considered student behavior outcomes on a logarithmic scale to account for asymmetry in the behavioral outcome variables and logistic regression for binary versions of these outcomes, with effect estimates expressed as a ratio of means or an odds ratio, respectively.11
9 In the difference-in-difference setting, the logistic regression model produces an estimate of the pre-post odds ratio for the continuing students, scaled by the pre-post odds ratio of the non-Montour comparison group. Similarly, the difference-in-difference gamma regression model produces an estimate of the pre-post ratio of means for the continuing students, scaled by the pre-post ratio of means for the non-Montour comparison group. 10 Although the fall 2017 reading and math MAP assessment technically occurred after the start of the initial expansion year, we view these measures as close enough to the beginning of the school year to capture reading and math proficiency at the outset of expansion. 11 We also used gamma regressions and natural logarithm transformations to address the asymmetry of behavioral outcomes in the doubly robust models for the effects on expansion student behavior. See the technical appendix for details.
11
In addition to the respective comparison groups within the Propel CMO for both the continuing and expansion Montour students, we considered an external nationally representative comparison group for spring MAP outcomes in the first expansion year. This external comparison group, labeled a virtual comparison group (VCG), was provided by NWEA and was curated from a national pool of students taking the MAP assessment in spring 2018 who were similar to Montour students on available measures. The results from this additional external comparison were consistent with those discussed later in this report. A description of the VCG, along with methods and results for these additional comparisons, can be found in the technical appendix.
Limitations The academic and behavioral outcomes analyses were limited in several ways. Like all quasi-
experimental designs, the interpretation of treatment effect estimates as causal relies on a set of assumptions. In particular, the difference-in-difference analyses rely on an assumption of parallel trends in the continuing Montour treatment and non-Montour comparison groups prior to implementation of the expansion. That is, in order for us to interpret the results as causal, the differences between these groups on the relevant outcomes need to be stable leading up to the expansion. We examine this stability assumption for each individual outcome in the next chapter.
A second assumption in our analytic designs is that bias from omitted variables is not present. In the doubly robust models, we cannot be sure that this assumption is met. For example, an estimated expansion effect actually might be attributable to an unobserved variable that is uncorrelated with those that are already in the model. Similarly, an expansion effect could be masked by the omission of a variable. Analogous concerns are present for both the pre-trend and effect estimates in the difference-in-difference approach.
An additional concern is that other changes in the schools that were concurrent with the expansion could have influenced the effects we observed. An example of this is mid-expansion turnover in school leadership. Although school-level leadership changes are commonplace, the individual philosophies and judgment of principals might differ and could cause substantial shifts in the school’s approach to instruction, student behavior, or operations. In our analyses, this concern could materialize if, for example, a new principal was more or less likely to suspend a student for a particular infraction, leading to a change in outcomes that was more about the leadership change than about the expansion. We discuss the potential for such concurrent exposures in our presentation of behavioral results in the next chapter.
Turnover in enrollment is a common experience, and the Propel schools experienced changes in enrollment over time. Thus, we observed attrition in the continuing Montour, expansion Montour, and non-Montour Propel comparison student groups over the course of the expansion. Although the expected student sample size and power to detect differences diminished over time,
12
we did not find evidence of differential attrition. That is, the enrollment turnover experienced by the continuing and expansion Montour students was similar to that of the non-Montour Propel students over the study period and to that in recent historical trends prior to expansion. We discuss the available student sample sizes further in the technical appendix.
13
3. Results
Achievement of Continuing Students In this chapter, we consider how the Montour expansion of grades K–5, relocation and
expansion of grades 6–8, and creation of Montour High School impacted the achievement of continuing Montour students. Figure 3.1 displays difference-in-difference estimates of the effect of Montour expansion on continuing students’ MAP scores, and Figure 3.2 displays the analogous results for the PSSA assessment results. In these figures, the height of the bar represents the difference-in-difference effect estimate in standard deviations of the assessment reporting scale.12 The vertical black bands provide 95-percent confidence intervals for each estimate. For the assessment outcomes, zero represents no difference between the continuing students and the comparison non-Montour students. We might interpret a confidence interval that does not include zero (i.e., that does not cross the horizontal dotted line) as evidence that the continuing Montour students exhibited average proficiency on the assessment that differed from what would have been expected in the absence of the expansion, such that an expansion effect was present. The panel for each outcome displays a prebaseline trend from 2015–2016 to 2016–2017, followed by an expansion effect estimate for each expansion year in which the outcome is available.
The mathematics performance of continuing Montour students indicated no evidence of diminished proficiency relative to that of their non-Montour peers. The pre-expansion baseline estimates for the MAP math assessment showed no evidence of a difference in the trend of MAP performance between continuing Montour and comparison students prior to expansion. Similarly, through each of the first three years of expansion, we found no evidence of differing math proficiency as measured by the MAP test. The PSSA math scores also exhibited no significant difference between continuing Montour and comparison students in either the pre-expansion baseline or first-year expansion estimates.
Continuing Montour students performed about 0.2 standard deviations higher, on average, than expected relative to their non-Montour counterparts, according to the second-year PSSA math estimates. This divergence of math results between the MAP and PSSA assessments in the second expansion year could have been caused by several factors. First, the MAP test includes more grades than the PSSA. Expansion year two MAP results included scores for students in 2nd, 9th, and 10th grades, which are excluded from the PSSA results. Second, although both tests map to Pennsylvania math curriculum standards, the content is not parallel, which limits
12 We standardized the assessment scores within each grade to have a mean of zero and a standard deviation of one. We then used the standardized scores as the outcome in the difference-in-difference regression model.
14
direct comparability of the respective scores (NWEA, 2016). Third, to the extent that there was a difference in proficiency between continuing Montour and other comparable Propel students, content strands in which such differences were strongest might be featured more prominently in one test than in the other. Fourth, as a computer adaptive test, the MAP assessment offers greater precision in estimating student proficiency than the paper-and-pencil PSSA, particularly for students who were at the upper and lower ends of the PSSA reporting scale. The PSSA result also could be a false positive or the MAP result could be a false negative signal captured by random chance, which is always a possibility with hypothesis testing. Finally, and most importantly, neither the PSSA nor the MAP results indicated any diminishment in math proficiency among continuing Montour students relative to what would have been expected had they not experienced expansion.
The ELA performance of continuing Montour students did not show evidence of diminishing during the expansion relative to that of their non-Montour peers. The MAP reading and PSSA ELA results indicate that the performance of continuing Montour students relative to that of their comparison peers was unstable in the time leading up to expansion. In each case, continuing students were underperforming in 2016–2017 relative to what we would have expected, given their 2015–2016 results. This fluctuation limits the interpretability of the difference-in-difference results during the expansion. Results from both tests show that continuing Montour students performed significantly higher, on average, relative to the comparison Propel students by the second expansion year. Given the prebaseline trend, it is more likely that these positive expansion effect estimates were corrections of coincidental underperformance among Montour students leading up to implementation than a benefit of expansion. Such a correction, however, would not be consistent with any detrimental effect because expansion was simultaneously present. Thus, we still interpret these results as lacking any evidence of diminished ELA performance among continuing Montour students in the expansion period.
15
Figure 3.1. Estimates of the Effect of Montour Expansion on Continuing Students Relative to Comparable Non-Montour Propel Students—MAP Assessment
NOTE: The period from 2015–2016 to 2016–2017 represents the pre-expansion baseline trend. The periods from 2016–2017 to 2017–2018, 2016–2017 to 2018–2019, and 2016–2017 to 2019–2020 represent effect estimates through years one, two, and three of the expansion, respectively.
16
Figure 3.2. Estimates of the Effect of Montour Expansion on Continuing Students Relative to Comparable Non-Montour Propel Students—PSSA Assessment
NOTE: The period from 2015–2016 to 2016–2017 represents the pre-expansion baseline trend. The periods from 2016–2017 to 2017–2018 and 2016–2017 to 2018–2019 represent effect estimates through years one and two of the expansion, respectively.
Achievement of Expansion Students In this section, we consider how the Montour expansion impacted the achievement of
expansion Montour students—that is, those who enrolled at the time of expansion—relative to both non-Montour Propel students and continuing Montour students. Figures 3.3 and 3.4 display expansion effect estimates for expansion students’ math and reading proficiency on the MAP assessments compared with non-Montour Propel students and continuing Montour students, respectively. Figures 3.5 and 3.6 display expansion effects on expansion students as measured on the PSSA assessment. The panels in these figures can be interpreted similarly to those in Figures 3.1 and 3.2, with one notable exception: The estimates are from a doubly robust regression estimate of the differences in outcomes between the expansion and comparison groups and are not a difference in pre-post differences. This is because, by definition, pre-expansion observations do not exist for expansion students. Thus, Figures 3.3–3.6 do not feature pre-expansion trends.
17
Before we discuss the model estimates, we note that the propensity weighting of the continuing Montour students as a comparison group, which we did to make it look as similar as possible to the expansion students group, did not achieve the desired balance between continuing and expansion students. The expansion students differed from the continuing students on some key covariates that we expected to be correlated with the outcomes considered. These include race, sex, socioeconomic status, and baseline MAP scores. When considering estimates of the impact of expansion on the expansion students relative to the continuing Montour students, estimated effects of expansion could be biased by this imbalance. Conversely, propensity weighting did achieve a non-Montour comparison group that was properly balanced with the group of expansion students. We discuss the propensity scoring results in detail in the technical appendix.
Overall, the academic achievement of Montour expansion students in math and ELA was not significantly different from that of their non-Montour peers. We examined the impact of expansion on the academic proficiency of expansion students relative to that of comparable non-Montour Propel students as measured by the MAP assessments and found that the expansion students lagged behind their non-Montour counterparts by the second year of expansion by about 0.16 standard deviations in both math and reading. This negative result was mitigated by the winter of year three, and we found no remaining significant differences in the available expansion and comparison non-Montour MAP outcomes. Although the comparison students were similar to expansion students on observable characteristics and fall baseline MAP scores, they were not new to Propel, and the shorter-term negative estimates could be attributed to assimilation to Propel or to the expansion itself. The positive point estimate in year 3, although it is not significant, indicates that power to identify effects was not an issue in this case. It is possible that student attrition, which was roughly 15 percent for expansion students between expansion years two and three (see Table A.6 in the technical appendix), could have biased the year three result; however, attrition patterns across the comparison group were similar, making such bias less likely.
The year two MAP effect estimates for the expansion students, relative to non-Montour students (Figure 3.3), were the only significant results we discovered for expansion students. The analogous results for the PSSA assessments for expansion students, relative to comparable non-Montour students, did not reveal any measurable differences (Figure 3.5). The potential reasons for the divergent MAP and PSSA results that we discussed previously for continuing students apply in this case as well. Finally, we did not find any significant effects—either positive or negative—when comparing the MAP and PSSA results of expansion students with those of continuing Montour students. It is possible that the imbalance discussed earlier could mask a difference in proficiency between these two groups.
18
Figure 3.3. Estimates of the Effect of Montour Expansion on Expansion Students Relative to Comparable Non-Montour Propel Students—MAP Assessment
NOTE: The 2017–2018, 2018–2019, and 2019–2020 school years represent effect estimates through years one, two, and three of the expansion, respectively.
19
Figure 3.4. Estimates of the Effect of Montour Expansion on Expansion Students Relative to Comparable Continuing Montour Students—MAP Assessment
NOTE: The 2017–2018, 2018–2019, and 2019–2020 school years represent effect estimates through years one, two, and three of the expansion, respectively.
20
Figure 3.5. Estimates of the Effect of Montour Expansion on Expansion Students Relative to Comparable Non-Montour Propel Students—PSSA Assessment
NOTE: The 2017–2018 and 2018–2019 school years represent effect estimates through years one and two of the expansion, respectively.
21
Figure 3.6. Estimates of the Effect of Montour Expansion on Expansion Students Relative to Comparable Continuing Montour Students—PSSA Assessment
NOTE: The 2017–2018 and 2018–2019 school years represent effect estimates through years one and two of the expansion, respectively.
Behavior Outcomes of Continuing Students We next consider how the Montour expansion impacted the behavior of continuing Montour
students, as measured by attendance, office referrals, and suspensions, as shown in Figures 3.7, 3.8, and 3.9. These figures can be interpreted similarly to those of Figures 3.1 and 3.2, with one notable exception: As noted in the methods discussion, we express the effect estimates for the behavioral outcomes as ratios. This means that no effect is expressed as a ratio estimate of one, and a confidence interval that does not contain a ratio value of one (i.e., that does not cross the dotted horizontal line in the charts) indicates a significant effect.
There is no evidence that the expansion had a negative effect on the attendance of continuing Montour students. As shown in Figure 3.7, we did not find evidence of a difference in attendance trends between continuing Montour and comparison students immediately prior to expansion in either attending regularly (i.e., attending at least 90 percent of possible days) or in the proportion of days with an unexcused absence. In the first two years of the expansion, 2017–2018 and 2018–2019, we similarly found no evidence that the likelihood of continuing Montour students attending regularly departed from expectations absent expansion. In 2019–2020, the
22
odds of regular attendance were about 80 percent greater for continuing Montour students than for comparable non-Montour Propel students relative to their respective pre-expansion baseline levels, up to the COVID-19 disruption. A slightly different pattern emerged for unexcused absences. Continuing Montour students were significantly less likely to have unexcused absences in the first two expansion years. The average proportion of days with an unexcused absence for continuing Montour students in the first two expansion years were, respectively, 74 percent and 82 percent of what would have been expected when compared with non-Montour Propel students, given baseline attendance rates before the expansion. However, there were no significant differences in unexcused absences in the third year.
The divergence in attendance results is likely the result of differences in the way that attendance is calculated in each measure. In each implementation year, we found that either the proportion of days with an unexcused absence or the regular attendance measure was significantly different, but not both. This pattern of attendance results is consistent with other studies (Martorell and Mariano, 2018). Although both outcomes derive from attendance, differences in the average proportion of days with an unexcused absence use the actual proportion of days for each student, while the binary regular attendance measure simply considers whether that proportion is less than 0.90. Because they consider different sets of information, different results might occur. For example, if the attendance rates among continuing Montour and comparison non-Montour Propel students differed only among students who are not regular attendees, the proportion of regular attendees would not differ but the average proportion of unexcused days would. Importantly, although the attendance results diverge, in each case, either there is no difference between continuing Montour and comparison non-Montour Propel students or the difference present favors the continuing Montour students. Thus, there is no evidence that the expansion negatively impacted the attendance of continuing Montour students.
23
Figure 3.7. Estimates of the Effect of Montour Expansion on Continuing Students Relative to Comparable Non-Montour Propel Students—Attendance
NOTE: The period from 2015–2016 to 2016–2017 represents the pre-expansion baseline trend. The periods from 2016–2017 to 2017–2018, 2016–2017 to 2018–2019, and 2016–2017 to 2019–2020 represent effect estimates through years one, two, and three of the expansion, respectively.
There is no evidence that the expansion was linked to a change in the number of office referrals or suspensions experienced by continuing Montour students. We found no differences in the likelihood of continuing Montour students experiencing any office referrals relative to comparable non-Montour Propel students in any of the years examined, as shown in Figure 3.8. In 2016–2017, the year prior to the expansion, continuing Montour students had 19 percent more days with an office referral than expected, relative to non-Montour Propel student office referrals, given their respective prebaseline referral rates in 2015–2016. During the expansion, we found either no difference or we found that the continuing students experienced a lower average proportion of days with an office referral. Although we did not find clear evidence of a negative impact of expansion on the continuing students, the prebaseline instability weakens the interpretability of these results for the proportion of days with an office referral. Propel also added principal and vice principal positions for both the middle school and high school grades, and the individuals serving in these positions also changed over the study period. It is possible that philosophical differences between the individuals serving in leadership positions at Montour and leaders at the other Propel schools could influence these results. Relatedly, implementation
24
of the Propel-wide initiative to reduce behavioral incidents and the presence of Pittsburgh Urban Leadership Corps principal trainees at select schools had the potential to influence these results.
Figure 3.9 reveals a prebaseline trend in whether continuing Montour students experienced any suspensions and the proportion of days they were suspended, relative to their non-Montour counterparts, that is similar to the trends in the frequency of office referrals we discussed previously. We did not find any significant differences for these measures during the expansion years. The prebaseline trend and the other concurrent factors mentioned in the office referral results discussion might again complicate the interpretation of these results.
Figure 3.8. Estimates of the Effect of Montour Expansion on Continuing Students Relative to Comparable Non-Montour Propel Students—Office Referrals
NOTE: The 2015–2016 to 2016–2017 period represents the pre-expansion baseline trend. The periods from 2016–2017 to 2017–2018, 2016–2017 to 2018–2019, and 2016–2017 to 2019–2020 represent effect estimates through years one, two, and three of the expansion, respectively.
25
Figure 3.9. Estimates of the Effect of Expansion on Continuing Students Relative to Comparable Non-Montour Propel Students—Suspensions
NOTE: The 2015–2016 to 2016–2017 period represents the pre-expansion baseline trend. The periods from 2016–2017 to 2017–2018, 2016–2017 to 2018–2019, and 2016–2017 to 2019–2020 represent effect estimates through years one, two, and three of the expansion, respectively.
Behavior Outcomes of Expansion Students Finally, we explore how the Montour expansion impacted the behavior of Montour
expansion students using the same measures of attendance, office referrals, and suspensions, as displayed in Figures 3.10 through 3.15. These figures indicate doubly robust estimates of the effects on expansion student behavior, with effect estimates expressed as ratios. Similar to Figures 3.7 through 3.9, no effect is expressed as a ratio estimate of one, and a confidence interval that does not contain a ratio value of one (i.e., that does not cross the dotted horizontal line in the charts) indicates a significant effect.
There is no evidence that the attendance rates of expansion students were different from those of their peers. Figures 3.10 and 3.11 display estimates of the impact of the Montour expansion on attendance for expansion students relative to non-Montour Propel and continuing Montour students, respectively. We did not find any significant differences in the proportion of students attending regularly using either comparison group, and the proportion of days in which expansion students had an unexcused absence was not demonstrably different from that of their
26
continuing Montour student counterparts. In the first two years of expansion, the expansion students had a significantly lower average proportion of unexcused absences than comparable non-Montour Propel students; however, this advantage did not carry into the third year.
Figure 3.10. Estimates of the Effect of Montour Expansion on Expansion Students Relative to Comparable Non-Montour Propel Students—Attendance
NOTE: The 2017–2018, 2018–2019, and 2019–2020 school years represent effect estimates through years one, two, and three of the expansion, respectively.
27
Figure 3.11. Estimates of the Effect of Montour Expansion on Expansion Students Relative to Comparable Continuing Montour Students—Attendance
NOTE: The 2017–2018, 2018–2019, and 2019–2020 school years represent effect estimates through years one, two, and three of the expansion, respectively.
There is no sustained evidence that expansion students were more likely to be referred to the office for misbehavior than were comparable non-Montour Propel students or continuing Montour students. Figures 3.12 and 3.13, respectively, display estimates of expansion student office referrals relative to those of non-Montour Propel students and continuing Montour students during the expansion. We did not find any evidence of differences in office referrals between expansion and continuing students, in terms of whether students had any office referrals or in the proportion of days with a referral, through the first three years of expansion, up to the COVID-19 disruption. We identified two isolated office referral differences when comparing expansion students with non-Montour Propel students. In the second expansion year only, the odds of an expansion student receiving an office referral were nearly twice as high as the referral odds for comparable non-Montour Propel students. However, by the third expansion year, this significant difference was no longer present. In the third expansion year only, the average proportion of days in which expansion Montour students experienced an office referral was about 82 percent of the average proportion of days in which non-Montour Propel students had a referral.
28
Figure 3.12. Estimates of the Effect of Montour Expansion on Expansion Students Relative to Comparable Non-Montour Propel Students—Office Referrals
NOTE: The 2017–2018, 2018–2019, and 2019–2020 school years represent effect estimates through years one, two, and three of the expansion, respectively.
29
Figure 3.13. Estimates of the Effect of Montour Expansion on Expansion Students Relative to Comparable Continuing Montour Students—Office Referrals
NOTE: The 2017–2018, 2018–2019, and 2019–2020 school years represent effect estimates through years one, two, and three of the expansion, respectively.
There is no sustained evidence that expansion students were more likely to be suspended than comparable continuing Montour students or non-Montour Propel students. Figures 3.14 and 3.15 show the impact of the expansion on the suspension experiences of expansion students. The pattern of results matches the results for office referrals, with an isolated year-two estimate of expansion students having 70-percent higher odds of at least one suspension relative to comparable non-Montour Propel students. This increase does not persist significantly into year three, and we find the average proportion of days with a suspension for expansion students to be about 92 percent of the comparable non-Montour Propel student average in the third expansion year only. The concurrent factors mentioned earlier for the continuing student results might similarly complicate the interpretation of the expansion student behavioral results.
30
Figure 3.14. Estimates of the Effect of Montour Expansion on Expansion Students Relative to Comparable Non-Montour Propel Students—Suspensions
NOTE: The 2017–2018, 2018–2019, and 2019–2020 school years represent effect estimates through years one, two, and three of the expansion, respectively.
31
Figure 3.15. Estimates of the Effect of Montour Expansion on Expansion Students Relative to Comparable Continuing Montour Students—Suspensions
NOTE: The 2017–2018, 2018–2019, and 2019–2020 school years represent effect estimates through years one, two, and three of the expansion, respectively.
32
4. Discussion
In fall 2017, Propel Schools initiated the expansion of Propel Montour using a phased approach. Originally a single K–8 school with two classrooms per grade, Propel Montour added a new high school and expanded into separate elementary and middle schools over four years, adding a classroom to each grade. In this study, we focused on the academic and behavioral experiences of both continuing and expansion Montour students from fall 2017 through the onset of the COVID-19 pandemic in March 2020.
In the context of student academic and behavioral experiences, a successful expansion to accommodate growing demand could be viewed as one that does not have a negative impact on these outcomes. Our examination of student academic outcomes included two assessments: the MAP Growth assessment through the winter of the third expansion year (winter 2020) and the PSSA through the end of the second expansion year (spring 2019). Our analyses did not reveal any evidence of weaker performance among the continuing Montour students who were experiencing expansion than what would have been expected in the absence of expansion. Similarly, we found no sustained evidence that expansion students performed any worse on the assessments than they would have been expected to if they were students in other Propel schools. Our results also did not reveal that the expansion students performed any worse than their comparable continuing Montour peers.
The results of our examination of behavioral outcomes corresponded with the assessment outcomes in that no evidence of a sustained negative impact of expansion was found on attendance, office referrals, or suspensions for either the continuing or expansion students. Some isolated cases of both beneficial and disadvantageous significant effects were found. However, these did not span across years, and no disadvantageous effects were present in the final observation period. It is possible that concurrent factors—such as the Propel-wide rollout of a restorative practices initiative to reduce behavioral incidents, leadership turnover at Propel Montour, and the presence of additional principal trainees at select schools—might have influenced these results.
Our ability to assess longer-term student academic and behavioral outcomes was hampered by the onset of the COVID-19 pandemic. However, by winter 2020, all that remained to complete the expansion was the addition of a third classroom of 8th-grade students and the expansion of the 12th grade from a small contingent of students to its final size of two classrooms. Moreover, these final classrooms would be added as the 2019–2020 7th- and 11th-grade students, a majority of whom were present through the first three expansion years, progressed to the next grade. Given the phased expansion plan, a majority of new Montour students after the first year of the expansion were kindergarten enrollees. Although we cannot
33
eliminate the prospect of negative effects of expansion arising in the final expansion year, the prospect of adverse outcomes was expected to be higher at the outset, when classrooms were added to multiple grades and a new building was first opened to house the middle and high schools.
As we discussed in the results chapter, in a few instances, our approaches require assumptions governing cause-and-effect interpretations of our results that might not have been completely met, and we cannot rule out that an important unobserved factor might have biased our results. However, when taken as a whole, the academic and behavioral results strongly suggest that both continuing and expansion students were not placed at a disadvantage during the expansion on these metrics relative to their comparable Propel peers (i.e., relative to non-Montour Propel students for continuing students and relative to both continuing Montour students and non-Montour Propel students for expansion students). Such a neutral result might be interpreted as a positive, in that expansion occurred without a cost to students on these metrics.
Propel’s prior experience with replication and with operating high schools—two of its campuses were high schools at the time of the Montour expansion—might have facilitated the expansion at Propel Montour. Propel slowly expanded its network prior to expanding Montour and, thus, might have avoided some of the challenges related to rapid expansion, such as maintaining the consistency of the instructional model and the quality of instruction or making changes to the school mission, that have been experienced by other CMOs (Lake et al., 2010).
Propel drew heavily on existing practice within Montour and on its full organization in designing the expansion. When splitting off grades 6–8 to establish the new Montour Middle School, Propel implemented the same curriculum and instructional practices present for these grades and set the expectation of the same behavioral norms (with age-appropriate adjustments) as when these grades were part of the original K–8 Montour school. Similarly, Propel drew from curricula, instructional practices, and behavioral practices in use at other Propel schools in establishing the new Montour High School. This institutional expertise was enhanced by filling expansion staffing needs with experienced Propel administrators and teachers to the extent possible, and the gradual expansion allowed the opportunity to steadily manage growth. Although we cannot directly link these preparations as the proximal reason that the expansion did not come at an academic or behavioral cost to students, the expansion took place in the context of these careful preparations for organizational consistency, and such preparation would be prudent for similar expansion efforts.
34
Appendix. Methods, Sample, and Supplemental Results
Analytic Methods In this section, we describe the analytic methods we used for estimating the following four
main quantitative research questions: 1. Achievement of continuing students: How did the expansion of grades K–5, expansion
and relocation of grades 6–8, and creation of Montour High School impact the achievement of continuing Montour students?
2. Achievement of expansion students: How did the achievement of Propel Montour expansion students compare with that of continuing Propel Montour students and non-Montour Propel students?
3. Behavioral outcomes of continuing students: Were there changes in attendance and student disciplinary outcomes among continuing Montour students during the expansion period relative to among non-Montour Propel students?
4. Behavioral outcomes of expansion students: How did the attendance and student disciplinary actions of Montour expansion students compare with those of continuing Propel Montour students and non-Montour Propel students?
The outcome measures and study methods we used to address these research questions were previously introduced in Chapter 2 of this report. Here, we provide additional details about modeling specifications and information that is relevant to the interpretation of our results.
We obtained Propel administrative data for the following five different student outcomes: • MAP Growth math and reading Rasch unit (RIT) scores • PSSA scores on state mathematics and ELA assessments • regular attendance (i.e., attending at least 90 percent of the possible days) information
and proportion of days with an unexcused absence • any office referral and proportion of days with an office referral • any suspension and proportion of days with a suspension.
We used the MAP and PSSA scores to address RQ1 and RQ2, while the remaining measures informed RQ3 and RQ4.
We standardized outcomes in all our analyses because the third year of the expansion (2019–2020) was contextually different from prior years as a result of the COVID-19 pandemic, which led to schools being closed for in-person instruction in March 2020. Thus, the number of possible in-person school days was shortened. We standardized the MAP and PSSA outcomes within grade to standard deviation units. We standardized the behavioral outcome measures, scaling by the number of possible days, such that the shortened measures were on the same scale
35
as the annualized measures from prior expansion years. For example, instead of examining counts of office referrals, we looked at the proportion of days in which a student had an office referral. We used a proportion of days as opposed to counts of days because the school year length varied over the postexpansion period.
The characteristics of Propel students varied across campuses, and the continuing Montour, expansion Montour, and non-Montour Propel students in our analyses differed on key baseline measures. Table A.1 displays baseline Propel non-Montour and Montour student characteristics. In light of these differences, we used propensity score weighting to correct for imbalances in baseline demographic characteristics, behavior incidents, and prior achievement between treatment and comparison groups. Thus, propensity score–weighted non-Montour Propel (comparison) students mirrored continuing Montour students (treatment) on key baseline variables for RQ1 and RQ3. Similarly, continuing Montour students and non-Montour Propel students (comparison) were propensity score–weighted to be as similar as possible to Propel Montour expansion students (treatment) on key baseline variables for RQ2 and RQ4.
36
Table A.1. Propel Student Characteristics
Propel Non-Montour at Baseline
(%)
Montour Only at Baseline
(%)
Continuing Montour at Expansion Year 1
(%)
Expansion Montour at Expansion Year 1
(%) Grade
Kindergarten 11 10 0 22
1st grade 11 10 10 10
2nd grade 12 11 10 10
3rd grade 12 11 11 10
4th grade 12 12 11 10
5th grade 12 12 12 11
6th grade 11 12 13 0
7th grade 10 12 12 0
8th grade 9 11 12 0
9th grade 0 0 8 18
10th grade 0 0 0 9
Race/ethnicity
Hispanic 2 1 1 5
Multiracial 8 12 12 17
NH black 73 42 41 55
NH white 17 45 46 23
Other 1 0 0 0
Female 51 50 51 42
SES status: FRPL eligible
81 68 68 80
Special education status: Yes
15 14 17 10
NOTE: FRPL = free or reduced-price lunch. NH = non-Hispanic. SES = socioeconomic status. We used a propensity score–weighted regression model in all our analyses, but, as described
in Chapter 2 of this report, the exact method varied depending on the data that were available. We used weighted difference-in-difference models when comparing continuing Propel Montour students with non-Montour Propel students for RQ1 and RQ3. This approach identified the effect of expansion on continuing students as deviations in pre- and postexpansion outcome trends for continuing students relative to comparable non-Montour Propel students. We used propensity score–weighted doubly robust regression models for the comparisons involving Propel Montour expansion students for RQ2 and RQ4. These models identified the effect of expansion as the average difference in expected outcomes between expansion students and similarly situated students in the comparison group. The procedure is considered doubly robust because, if either
37
the model generating the propensity scores or the outcome regression model is correct, a consistent estimate of the treatment effect will be produced (Bang and Robins, 2005). We were unable to use the difference-in-difference model for comparisons involving Propel Montour expansion students because we did not have access to pre-expansion data.
Propensity Score Methods
We estimated propensity scores using a Generalized Boosted Model (Ridgeway, Madigan, and Richardson, 1999), which is a flexible, tree-based nonparametric estimation method. For a given comparison, these scores represent the probability of a student being in the treatment group, given their observed baseline characteristics: 𝑃(𝑇! = 1|𝑥!), where 𝑇! is an indicator variable for membership in the treatment group for person 𝑖 and 𝑥! is a vector of baseline covariates. We calculated propensity weights from these scores that estimate the average treatment effect for the treated students when used in our outcome models. The treatment students were given a weight of one, 𝑤! = 1, and the comparison students were weighted by their odds of being in the treatment group, 𝑤! = 𝑃(𝑇! = 1|𝑥!)/[1 − 𝑃(𝑇! = 1|𝑥!)] (McCaffrey, Ridgeway, and Morral, 2004).
We used the “twang” (Toolkit for Weighting and Analysis of Nonequivalent Groups) (Cefalu et al., 2021; Griffin et al., 2014; Ridgeway et al., 2021) package in R (R Core Team, 2021) to calculate propensity weights and assess whether the treatment and comparison groups were balanced after weighting on each baseline variable included in the propensity score model using the standardized mean differences (SMD) and the Kolmogorov-Smirnov (KS) statistic (Imbens and Rubin, 2015; Ridgeway, et al., 2021). We calculate the SMD the following way:
"#!$"#"&#
,
where �̂�'represents the estimated mean value of the variable in question for the treatment and comparison group (x = t and c, respectively), whereas 𝜎3 represents the estimated standard deviation for the variable in question using the observed variance in the unweighted condition. SMD are generally considered to be small at values less than 0.10, and it is common to declare SMD of greater than 0.10 as unbalanced (Cohen, 1992). The KS statistic is dependent on the weighted empirical cumulative distribution functions for both comparison groups. The KS statistic for each relevant covariate is computed the following way:
𝐾𝑆( = 𝑠𝑢𝑝'|𝐸𝐶𝐷𝐹)((𝑥) − 𝐸𝐶𝐷𝐹*((𝑥)|.
In addition to SMD, the KS statistic is an important metric to consider because it evaluates the entire distribution of each variable of interest, not just the mean.
38
Testing to determine whether the KS statistic is statistically different from zero assesses whether there are differences between the two distributions of interest such that the treatment and comparison groups would not be adequately balanced. We tested for statistical significance of the KS statistic by comparing the observed value to the relevant chi-square distribution. Tables A.8 through A.17 later in this appendix show balance tables for each propensity score model. These tables list which variables have SMD greater than 0.10 and a KS statistic that is significantly different from zero, indicating imbalance. We include all candidate covariates related to the outcome in both our propensity score and outcome models.
Outcome Model Methods
For the first research question, we obtained estimates of the treatment effect of expansion on continuing student assessment outcomes by implementing the following model structure. We fit the difference-in-difference regression model using stacked data (i.e., two observations per student) distinguished by a time indicator. The model formula takes the following form:
𝑦!+ = 𝛽, +𝛽-(𝑇! × 𝐷+) + 𝛽𝑋!+ + 𝜀!+ , (A. 1)
where • 𝑖 is the index for students • 𝑡 is the index for time, where 𝑡 = 1 is the baseline year and 𝑡 = 2 is the follow-up year • 𝑦!+ denotes the measured outcome for student 𝑖 at time 𝑡 • 𝑇! denotes what group student 𝑖 is in, fixed across time; 𝑇! = 1 represents continuing
Montour students and 𝑇! = 0 represents non-Montour students • 𝐷+ denotes the school year, indicating the baseline year or follow-up year of interest fixed
for student 𝑖 • 𝑋!+ denotes the baseline characteristics, fixed across time𝑡 = 1; baseline characteristics
match those used in the propensity scoring model and are specified in Chapter 2 of this report
• 𝛽, represents the intercept • 𝛽-represents the coefficient on the difference-in-difference estimate • 𝛽 represents a vector of coefficients on the baseline characteristics • 𝜀!+ denotes the residuals, defined as following a normal distribution with mean zero and
variance 𝜎.. Note that the multiple regression Equation A.1 can be re-expressed as the outcome, 𝑦!+, following a normal distribution with mean 𝐸(𝑦!+) = 𝛽, +𝛽-(𝑇! × 𝐷+) + 𝛽𝑋!+ and variance 𝜎..
We obtained estimates of the treatment effect of expansion on continuing student behavioral outcomes, the third research question, using alternative versions of Equation A.1. As previously noted, we considered both a binary and a continuous version of each behavioral outcome. For
39
example, we examined both whether a student experienced a suspension and the proportion of days that they were suspended. The distributions of the continuous student behavior outcomes were asymmetrical, with a mode closer to zero and with adverse events, such as an office referral or suspension, being less common. To better capture this asymmetry, we implemented the difference-in-difference regression models for continuous behavioral outcomes using gamma regressions (McCullagh and Nelder, 1989). The gamma regressions featured a logarithmic transformation of the outcome to account for the asymmetry, but with additional distributional flexibility than the standard logarithmic transformation for skewed data. We implemented difference-in-difference gamma regression models using the following form:
We specified the gamma regression model using the log link function, such that the regression equation described the logarithm of the mean of the outcome, as opposed to modeling the outcome mean directly, as is the case in Equation A.1. Also note that Equation A.2 did not include an additive residual error term. Unlike the Normal distribution, where the mean and variance are independent, the gamma distribution variance is proportional to the mean, and the scaling parameter, 𝜏., provides flexibility in the dispersion of the outcome variable.
We used difference-in-difference logistic regression models to consider effects on the relevant binary versions of the behavioral outcomes. Here, the outcome 𝑦!+ = 1 if the outcome of interest (regular attendance, any office referrals, or any suspensions) occurs for student 𝑖 in year 𝑡; otherwise, 𝑦!+ = 0. The model is similar to Equation A.1, except that we model the log odds of observing the outcome of interest. Setting 𝜋 = 𝐸(𝑦!+) = 𝑃(𝑦!+ = 1), the model takes the following form:
ln S𝜋
1 − 𝜋T= 𝛽, +𝛽-(𝑇! × 𝐷+) + 𝛽𝑋!+ . (A. 3)
The logistic regression model features a logit link; the regression equation models the log odds of observing the outcome of interest. Again, there is no additive residual error term because 𝜋 fully describes both the expected outcome and variance for the binary outcomes.
The doubly robust regression formulas were very similar to Equations A.1 through A.3 but did not include a 𝐷+ or an indicator for time. In Equation A.4,we use the same symbols as described earlier, but we now have an updated list of covariates,𝑋!. The doubly robust linear regression formula is as follows:
𝑦! = 𝛽, +𝛽-𝑇! + 𝛽𝑋! + 𝜀! , (A. 4)
where
40
• 𝑇! denotes what group student 𝑖 is in; 𝑇! = 1 represents Montour expansion students and 𝑇! = 0 represents the relevant control group
• 𝑋! denotes the baseline characteristics; baseline characteristics match those used in the propensity scoring model and are specified in Chapter 2 of this report.
The doubly robust gamma and logistic regression models are represented by Equations A.5 and A.6, respectively, where 𝜋 = 𝑃(𝑦! = 1):
We estimated Equations A.1 through A.6 in the software R (R Core Team, 2021), using the command svyglm from the survey package (Lumley, 2020), which incorporated the propensity weights in the model estimation.
Sample In this section, we describe the sample of students we included in the analyses based on
administrative data from Propel. We included descriptive information about the unweighted and propensity weighted samples in each of our analyses for all variables included in the propensity score models to discern how similar or different the two comparison samples were on all observable characteristics. We used weights to bridge gaps across our unweighted samples so that our weighted analytic samples were as similar as possible. Thus, the descriptive data from the propensity weighted sample summarized how well the propensity score model balanced the two groups. The more similar the descriptive data from the two samples are, the more confident we can be that we minimized the threat of selection bias. However, unobserved characteristics can always threaten the validity of our results, as we explained in the limitations section in Chapter 2.
Sample Descriptive Characteristics of Propel Administrative Data
We received administrative data from Propel Schools and processed the data for analysis at RAND. We obtained data for all Propel students across the 13 schools in the network: Andrew Street High School, Braddock Hills (K–8 prior to 2016–2017; elementary, middle, and high otherwise), East (K–8), Hazelwood (K–8), Homestead (K–8), McKeesport (K–8), Montour (K–8 prior to 2017–2018; elementary, middle, and high otherwise), Northside (K–8), and Pitcairn (K–8).
Below, we list the three main sample comparisons in which we were interested: 1. continuing Montour versus non-Montour Propel (difference-in-difference sample)
41
a. prebaseline: 2015–2016 to 2016–2017 b. year 1 outcomes: 2016–2017 to 2017–2018 c. year 2 outcomes: 2016–2017 to 2018–2019 d. year 3 outcomes: 2016–2017 to 2019–2020
2. expansion Montour versus non-Montour Propel a. year 1 outcomes: 2017–2018 b. year 2 outcomes: 2018–2019 c. year 3 outcomes: 2019–2020
3. expansion Montour versus continuing Montour a. year 1 outcomes: 2017–2018 b. year 2 outcomes: 2018–2019 c. year 3 outcomes: 2019–2020.
Tables A.2 through A.4 illustrate the grade progression for the students who were available for each of the analyses described in this report. For example, Table A.2 illustrates the grade progression of the continuing students who were available for comparison with the non-Montour Propel students (which we used to address RQ1 and RQ3). Continuing students who were present before the expansion were found in grades 1–9, 2–10, and 3–11 in years 1, 2, and 3, respectively. In each table, the checkmarks indicate the grades of students included in the analytic sample in each year.
Table A.2. Continuing Montour Students Follow a Normal Grade Progression
Grade Baseline
(2016–2017) Year 1
(2017–2018) Year 2
(2018–2019) Year 3
(2019–2020)
Kindergarten ü
1st ü ü
2nd ü ü ü
3rd ü ü ü ü
4th ü ü ü ü
5th ü ü ü ü
6th ü ü ü ü
7th ü ü ü ü
8th ü ü ü ü
9th
ü ü ü
10th
ü ü
11th
ü
12th
NOTES: PSSA results were available only for grades 3–8. Check marks denote availability for comparison with non-Montour Propel students.
42
Table A.3. Expansion Montour Grades Available for Comparison with Non-Montour Students
Grade Year 1
(2017–2018) Year 2
(2018–2019) Year 3
(2019–2020)
Kindergarten ü + +
1st ü ü +
2nd ü ü ü
3rd ü ü ü
4th ü ü ü
5th ü ü ü
6th
ü ü
7th
ü
8th
9th ü + +
10th ü* ü +
11th
ü* ü
12th
ü* NOTES: PSSA results were available only for grades 3–8. Check marks with asterisks indicate smaller-than-typical student cohorts. Check marks indicate that fall 2017 baseline information was available for comparisons. Plus signs indicate that additional students were present after the expansion.
Table A.4. Expansion Montour Grades Available for Comparison with Continuing Montour Students
Grade Year 1
(2017–2018) Year 2
(2018–2019) Year 3
(2019–2020)
Kindergarten
1st ü
2nd ü ü
3rd ü ü ü
4th ü ü ü
5th ü ü ü
6th
ü ü
7th
ü
8th
9th ü + +
10th
ü +
11th
ü
12th
NOTES: PSSA results were available only for grades 3–8. Check marks indicate that fall 2017 baseline information was available for comparisons. Plus signs indicate that additional students were present after the expansion.
43
We report year-by-year sample sizes in Tables A.5 through A.7. In these tables, the “M” following the sample size indicates mathematics, and the “R” indicates reading or ELA. These tables show the attrition in the sample sizes over time. Continuing Montour and non-Montour comparisons vary in sample size across the tables because of the different grade levels involved (e.g., the non-Montour sample size is different in Table A.5 than in Table A.6 for this reason).
Table A.5. Difference-in-Difference Sample: Continuing Montour Versus Non-Montour Propel
Prebaseline
2015–2016 to 2016–2017
Year 1 Outcomes 2016–2017 to 2017–
2018
Year 2 Outcomes 2016–2017 to 2018–
2019
Year 3 Outcomes 2016–2017 to 2019–
2020
Sample Continuing Non-
Montour Continuing Non-
Montour Continuing Non-
Montour Continuing Non-
Montour
Raw 348 2,035 385 2,324 288 1,790 222 1,375
MAP 338 M, 337 R
1,913 M, 1,913 R
370 M, 371 R
2,074 M, 2,078 R
276 M, 277 R
1,616 M, 1,617 R
212 M, 211 R
1,243 M, 1,244 R
PSSA 252 M, 252 R
1,373 M, 1,372 R
291 M, 290 R
1,560 M, 1,552 R
246 M, 246 R
1,370 M, 1,366 R
N/A N/A
Behavioral 337 1,899 370 2,072 276 1,614 212 1,241 NOTE: M = mathematics. N/A = not applicable. R = reading or ELA.
Table A.6. Sample: Expansion Montour Versus Non-Montour Propel
Behavioral 248 2,050 210 1,679 170 1,390 NOTES: Numbers in parentheses in the header row represent the grade levels contributing to the sample. M = mathematics. N/A = not applicable. R = reading or ELA.
44
Table A.7. Sample: Expansion Montour Versus Continuing Montour
Behavioral 167 234 130 184 98 155 NOTES: Numbers in parentheses in the header row represent the grade levels contributing to the sample. M = mathematics. N/A = not applicable. R = reading or ELA.
We present the demographic characteristics both before and after propensity weighting for each of our samples in Tables A.8 to A.17. All variables presented in these tables were included in the relevant propensity score models. The SMD and KS statistics indicate that the propensity score models generally did a good job of balancing in each of the treatment and control comparisons. The SMD statistic indicates some lingering imbalance, especially in the expansion Montour versus continuing Montour groups, but the KS statistics, which are all nonsignificant other than in federally reported race/ethnicity, indicate that balance has been achieved.
45
Table A.8. Prebaseline (2015–2016 to 2016–2017) Balance Table: Continuing Montour Versus Non-Montour Propel
Enrolled in Propel in 2014–2015 (%) 80 73* 80 78 Female (%) 50 51 50 50 Special education status: Yes (%) 13 14 13 13 Suspension days 0.6 0.8 0.6 0.6 MAP math fall 2015 191.7 185.9*+ 191.7 190.8 MAP reading fall 2015 188.6 182.7*+ 188.6 187.5 PSSA math spring 2016 969.8 937.4*+ 969.8 964.1 PSSA reading/ELA spring 2016 1,026.4 990.8*+ 1,026.4 1,017.8
NOTES: NH = non-Hispanic. * The absolute value of SMD > 0.1 when comparing continuing Montour with non-Montour Propel students. + KS test p-value < 0.05. a The KS test is significant only for unweighted race/ethnicity categories.
46
Table A.9. Year 1 Outcomes (2016–2017 to 2017–2018) Balance Table: Continuing Montour Versus Non-Montour Propel
Enrolled in Propel in 2014–2015 (%) 63 51*+ 63 62 Female (%) 51 51 51 48 SES: FRPL eligible (%) 69 83*+ 69 71 Special education status: Yes (%) 14 15 14 14 Suspension days 0.7 0.6 0.7 0.6 MAP math fall 2016 194.8 187.1*+ 194.8 193.2 MAP reading fall 2016 190.2 184.4*+ 190.2 189.8 PSSA math spring 2017 952.1 928.4*+ 952.1 946.7 PSSA reading/ELA spring 2017 1,008.0 992.3*+ 1,008.0 1,005.4
NOTES: FRPL = free or reduced-price lunch. NH = non-Hispanic. SES = socioeconomic status. * The absolute value of SMD > 0.1 when comparing continuing Montour with non-Montour Propel students. + KS test p-value < 0.05. a The KS test is significant only for unweighted race/ethnicity categories.
47
Table A.10. Year 2 Outcomes (2016–2017 to 2018–2019) Balance Table: Continuing Montour Versus Non-Montour Propel
Enrolled in Propel in 2014–2015 (%) 63 51*+ 63 61 Female (%) 50 52 50 49 SES: FRPL eligible (%) 69 83*+ 69 74* Special education status: Yes (%) 15 14 15 14 Suspension days 0.6 0.5 0.6 0.5 MAP math fall 2016 193.0 185.9*+ 193.0 190.0 MAP reading fall 2016 188.7 183.4*+ 188.7 187.8 PSSA math spring 2017 948.0 929.8* 948.0 939.3 PSSA reading/ELA spring 2017 1,004.7 994.7* 1,004.7 1,004.3
NOTES: FRPL = free or reduced-price lunch. NH = non-Hispanic. SES = socioeconomic status. * The absolute value of SMD > 0.1 when comparing continuing Montour with non-Montour Propel students. + KS test p-value < 0.05. a The KS test is significant only for unweighted race/ethnicity categories.
48
Table A.11. Year 3 Outcomes (2016–2017 to 2019–2020) Balance Table: Continuing Montour Versus Non-Montour Propel
Female (%) 47 52 47 49 SES: FRPL eligible (%) 72 83*+ 72 78* Special education status: Yes (%) 15 14 15 14 Suspension days 0.5 0.4 0.5 0.4 MAP math fall 2016 190.3 183.2*+ 190.3 188.4 MAP reading fall 2016 185.9 180.7*+ 185.9 185.2 PSSA math spring 2017 944.3 932.6* 944.3 942.7 PSSA reading/ELA spring 2017 994.3 995.4 994.3 996.5
NOTES: FRPL = free or reduced-price lunch. NH = non-Hispanic. SES = socioeconomic status. * The absolute value of SMD > 0.1 when comparing continuing Montour with non-Montour Propel students. + KS test p-value < 0.05. a The KS test is significant only for unweighted race/ethnicity categories.
49
Table A.12. Year 1 Outcomes (2017–2018) Balance Table: Expansion Montour Versus Non-Montour Propel
Unweighted Means
Propensity Score Weighted Means
Expansion Montour
Non-Montour Propel
Expansion Montour
Non-Montour Propel
Race/ethnicity+a (%) Hispanic 5 2* 5 5 Multiracial 17 7* 17 13 NH black 55 75* 55 60* NH white 23 15* 23 21 Other 0 1 0 1
Enrolled in Propel in 2014–2015 (%) 13 32*+ 13 14 Enrolled in Propel in 2015–2016 (%) 15 47*+ 15 18 Female (%) 42 50*+ 42 46 SES: FRPL eligible (%) 80 80 80 81 Special education status: Yes (%) 10 16*+ 10 12 MAP math fall 2017 178.9 182.7*+ 178.9 177.8 MAP reading fall 2017 177.4 179.7+ 177.4 176.2
NOTES: FRPL = free or reduced-price lunch. NH = non-Hispanic. SES = socioeconomic status. * The absolute value of SMD > 0.1 when comparing expansion Montour with non-Montour Propel students. + KS test p-value < 0.05. a The KS test is significant only for unweighted race/ethnicity categories and grade levels.
50
Table A.13. Year 2 Outcomes (2018–2019) Balance Table: Expansion Montour Versus Non-Montour Propel
Unweighted Means Propensity Score Weighted Means
Expansion Montour
Non-Montour Propel
Expansion Montour
Non-Montour Propel
Race/ethnicity+a (%) Hispanic 4 2* 4 4 Multiracial 17 7* 17 13* NH black 56 75* 56 62* NH white 22 15* 22 20 Other 0 1* 0 1
Enrolled in Propel in 2014–2015 (%) 14 33*+ 14 15 Enrolled in Propel in 2015–2016 (%) 16 48*+ 16 19 Female (%) 44 50* 44 47 SES: FRPL eligible (%) 81 80 81 81 Special education status: Yes (%) 11 16* 11 12 MAP math fall 2017 176.0 182.8*+ 176.0 175.6 MAP reading fall 2017 174.5 179.8*+ 174.5 174.0 NOTES: FRPL = free or reduced-price lunch. NH = non-Hispanic. SES = socioeconomic status. * The absolute value of SMD > 0.1 when comparing expansion Montour with non-Montour Propel students. + KS test p-value < 0.05. a The KS test is significant only for unweighted race/ethnicity categories and grade levels.
51
Table A.14. Year 3 Outcomes (2019–2020) Balance Table: Expansion Montour Versus Non-Montour Propel
Unweighted Means
Propensity Score Weighted Means
Expansion Montour
Non-Montour Propel
Expansion Montour
Non-Montour Propel
Race/ethnicity+a (%) Hispanic 4 2* 4 3 Multiracial 16 7* 16 13 NH black 56 75* 56 61* NH white 24 15* 24 22 Other 1 1 1 1
Enrolled in Propel in 2014–2015 (%) 15 32*+ 15 17 Enrolled in Propel in 2015–2016 (%) 18 47*+ 18 22 Female (%) 41 50*+ 41 44 SES: FRPL eligible (%) 79 80 79 80 Special education status: Yes (%) 12 15 12 15 MAP math fall 2017 172.8 181.1*+ 172.8 172.8 MAP reading fall 2017 171.8 178.3*+ 171.8 171.3
NOTES: FRPL = free or reduced-price lunch. NH = non-Hispanic. SES = socioeconomic status. * The absolute value of SMD > 0.1 when comparing expansion Montour with non-Montour Propel students. + KS test p-value < 0.05. a The KS test is significant only for unweighted race/ethnicity categories and grade levels.
52
Table A.15. Year 1 Outcomes (2017–2018) Balance Table: Expansion Montour Versus Continuing Montour
Unweighted Means Propensity Score Weighted Means
Expansion Montour
Continuing Montour
Expansion Montour
Continuing Montour
Race/ethnicity+a (%) Hispanic 6 1* 6 1* Multiracial 19 13* 19 13* NH black 58 41* 58 62 NH white 18 45* 18 24* Other 0 0* 0 0
Female (%) 40 48* 40 46* SES: FRPL eligible (%) 81 69*+ 81 76* Special education status: Yes (%) 12 15 12 15 MAP math fall 2017 187.1 194.9*+ 187.1 191.2* MAP reading fall 2017 185.1 189.5* 185.1 188.0*
NOTES: FRPL = free or reduced-price lunch. NH = non-Hispanic. SES = socioeconomic status. * The absolute value of SMD > 0.1 when comparing expansion Montour with continuing Montour students. + KS test p-value < 0.05. a The KS test is significant for both the unweighted race/ethnicity categories and the propensity score weighted race/ethnicity categories.
53
Table A.16. Year 2 Outcomes (2018–2019) Balance Table: Expansion Montour Versus Continuing Montour
Unweighted Means
Propensity Score Weighted Means
Expansion Montour
Continuing Montour
Expansion Montour
Continuing Montour
Race/ethnicity+a (%) Hispanic 5 1* 5 1* Multiracial 20 12* 20 11* NH black 57 39* 57 64* NH white 18 47* 18 25* Other 0 1 0 0
Female (%) 43 48* 43 44 SES: FRPL eligible (%) 80 71* 80 78 Special education status: Yes (%) 12 14 12 16 MAP math fall 2017 186.4 195.2*+ 186.4 188.5 MAP reading fall 2017 184.6 190.0* 184.6 185.7
NOTES: FRPL = free or reduced-price lunch. NH = non-Hispanic. SES = socioeconomic status. * The absolute value of SMD > 0.1 when comparing expansion Montour with continuing Montour students. + KS test p-value < 0.05. a The KS test is significant for both the unweighted race/ethnicity categories and the propensity score weighted race/ethnicity categories.
54
Table A.17. Year 3 Outcomes (2019–2020) Balance Table: Expansion Montour Versus Continuing Montour
Unweighted Means
Propensity Score Weighted Means
Expansion Montour
Continuing Montour
Expansion Montour
Continuing Montour
Race/ethnicity+a (%) Hispanic 5 1* 5 1* Multiracial 18 14* 18 13* NH black 58 38* 58 59 NH white 19 47* 19 28* Other 0 0 0 0
Female (%) 41 45 41 43 SES: FRPL eligible (%) 78 76 78 80 Special education status: Yes (%) 15 14 15 24* MAP math fall 2017 185.0 194.6*+ 185.0 191.3* MAP reading fall 2017 183.4 189.4* 183.4 187.8*
NOTES: FRPL = free or reduced-price lunch. NH = non-Hispanic. SES = socioeconomic status. * The absolute value of SMD > 0.1 when comparing expansion Montour with continuing Montour students. + KS test p-value < 0.05. a The KS test is significant for both the unweighted race/ethnicity categories and the propensity score weighted race/ethnicity categories.
Additional External Comparison: NWEA Virtual Comparison Group
Matching Methods
To complement the within-Propel comparisons described earlier, we employed an additional comparison group, external to Propel, to assess the experiences of continuing and expansion Montour students in the first year of the expansion (2017–2018). We used the MAP test data provided by NWEA for this comparison. For each Montour treatment student, NWEA provided a VCG. NWEA provided separate VCGs for continuing and expansion students in each subject. Each VCG can consist of up to 51 matched comparison students for each Montour student. NWEA drew matches from participating MAP districts nationwide using the following criteria:
• requirements for all VCG matches - valid pre- and post-test scores for Propel and VCG students - VCG students were not students in Propel schools - VCG students were the same gender and in the same grade as their matching Propel
student - VCG schools had the same locale classification (urban) as the Propel schools
55
• approximate matching criteria - VCG schools differed from Propel schools by no more than 15 percentage points on
student participation in the national free or reduced-price lunch program - VCG students scored similarly to the matching Propel student on the pre-test MAP
assessment - The time elapsed between the pre-test and post-test differed by no more than 18 days
between the VCG and Propel students. We standardized outcome differences to an annualized scale in standard deviation units to
accommodate the time differences between observed scores.
Assessment of Balance Between the Relevant Propel Montour Group and the VCG
The VCG group was designed to be similar to the Propel groups on observable variables prior to the expansion, but there is always the possibility that the two groups might not be well balanced on the approximate matching criteria. Tables A.18 and A.19 show balance on variables that were approximately matched in each of our samples. We present the unweighted means, weighted means, and SMD.
Table A.18. Balance Between Continuing Montour and VCG Groups on Variables Not Exactly Matched
NOTE: The unweighted VCG columns show sample characteristics after restricting to one observation per VCG student, per subject, per year. FRL = eligible for free or reduced-price lunch.
56
Table A.19. Balance Between Expansion Montour and VCG Groups on Variables Not Exactly Matched
Unweighted VCG Weighted VCG
Subject Variable Propel Mean Mean Difference SMD Mean Difference SMD
NOTE: The unweighted VCG columns show sample characteristics after restricting to one observation per VCG student, per subject, per year. FRL = eligible for free or reduced-price lunch.
Statistical Estimation Strategy for NWEA VCG Analyses and Results
Although the VCG consisted of up to 51 matches for each Montour student, the matches were not unique, and elapsed time between testing dates differed across VCG students. Thus, we adapted the methods described earlier for comparing Montour with non-Montour Propel students in this VCG analysis. We replicated the estimation strategy used by Pane et al., 2017, to account for these VCG-specific issues. Please see the section titled Refinements to the Statistical Estimation Strategy in Appendix B of Pane et al., 2017, for a detailed description.
Figure A.1 displays the MAP performance of continuing Montour students compared with that of students in the VCG. The results of this comparison are consistent with those of the comparison between continuing Montour students and non-Montour Propel students (i.e., continuing Montour students performed slightly lower on MAP math and significantly better on MAP reading). Although the MAP math result is significant, the effect is about one-fiftieth of the standard deviation on the MAP scale, which we interpret as lacking practical significance.
Figure A.2 demonstrates that the MAP performance of expansion students was stronger in comparison with that of the students in the VCG than when compared with both internal Propel comparison groups (non-Montour Propel and continuing Montour). The Montour expansion students performed significantly better than students in the VCG on both MAP math and reading in 2017–2018. These outside comparison results conform with the general conclusion drawn from within-Propel comparisons that the expansion students fared at least as well as would have been expected absent expansion.
57
Figure A.1. Estimates of MAP Performance: Continuing Students Versus VCG Students
NOTE: Estimates are reported on an effect size scale.
58
Figure A.2. Estimates of MAP Performance: Expansion Students Versus VCG Students
NOTE: Estimates are reported on an effect size scale.
59
Abbreviations
CMO charter management organization
COVID-19 coronavirus disease 2019
ELA English language arts
KS Kolmogorov-Smirnov
NCSRC National Charter School Resource Center
PSSA Pennsylvania System of School Assessment
RIT Rasch unit
RQ research question
SMD standardized mean differences
VCG virtual comparison group
60
References
Angrist, Joshua D., Susan M. Dynarski, Thomas J. Kane, Parag A. Pathak, and Christopher R. Walters, “Inputs and Impacts in Charter Schools: KIPP Lynn,” American Economic Review, Vol. 100, No. 2, May 2010, pp. 239–243.
Angrist, Joshua D., Susan M. Dynarski, Thomas J. Kane, Parag A. Pathak, and Christopher R. Walters, “Who Benefits from KIPP?” Journal of Policy Analysis and Management, Vol. 31, No. 4, Fall 2012, pp. 837–860.
Baker, Bruce D., Exploring the Consequences of Charter School Expansion in U.S. Cities, Washington, D.C.: Economic Policy Institute, 2016.
Bang, Heejung, and James M. Robins, “Doubly Robust Estimation in Missing Data and Causal Inference Models,” Biometrics, Vol. 61, No. 4, December 2005, pp. 962–973.
Cefalu, Matthew, Greg Ridgeway, Dan McCaffrey, Andrew Morral, Beth Ann Griffin, and Lane Burgette, “twang: Toolkit for Weighting and Analysis of Nonequivalent Groups,” R package version 2.0, July 26, 2021. As of September 10, 2021: https://CRAN.R-project.org/package=twang
Cohen, J., “A Power Primer,” Psychological Bulletin, Vol. 112, No. 1, July 1992, pp. 155–159.
Cohodes, Sarah R., Elizabeth M. Setren, and Christopher R. Walters, “Can Successful Schools Replicate? Scaling Up Boston’s Charter School Sector,” American Economic Journal: Economic Policy, Vol. 13, No. 1, 2021, pp. 138–167.
Dobbie, Will, and Roland G. Fryer, Jr., “Are High-Quality Schools Enough to Increase Achievement Among the Poor? Evidence from the Harlem Children’s Zone,” American Economic Journal: Applied Economics, Vol. 3, No. 3, 2011, pp. 158–187.
Dobbie, Will, and Roland G. Fryer, Jr., “The Medium-Term Impacts of High-Achieving Charter Schools,” Journal of Political Economy, Vol. 123, No. 5, 2015, pp. 985–1037.
Furgeson, Joshua, Brian Gill, Joshua Haimson, Alexandra Killewald, Moira McCullough, Ira Nichols-Barrer, Bing-ru Teh, Natalya Verbitsky-Savitz, Melissa Bowen, Allison Demeritt, Paul Hill, and Robin Lake, The National Study of Charter Management Organization (CMO) Effectiveness. Charter-School Management Organizations: Diverse Strategies and Diverse Student Impacts, Cambridge, Mass.: Mathematica Policy Research, January 2012.
Gerstenfeld, Adam, and Yueting Xu, “Who Manages Charter Schools?” National Alliance for Public Charter Schools, Charter School Data Digest webpage, updated July 19, 2021. As of August 6, 2021: https://data.publiccharters.org/digest/charter-school-data-digest/who-manages-charter-schools
Gill, Brian, Charles Tilley, Emilyn Whitesell, Mariel Finucane, Liz Potamites, and Sean Corcoran, The Impact of Democracy Prep Public Schools on Civic Participation, Princeton, N.J.: Mathematica Policy Research, April 2018.
Griffin, Beth Ann, Greg Ridgeway, Andrew R. Morral, Lane F. Burgette, Craig Martin, Daniel Almirall, Rajeev Ramchand, Lisa H. Jaycox, and Daniel F. McCaffrey, “Toolkit for Weighting and Analysis of Nonequivalent Groups (TWANG),” webpage, 2014. As of June 18, 2021: http://www.rand.org/statistics/twang
Hoxby, Caroline M., and Jonah E. Rockoff, “The Impact of Charter Schools on Student Achievement,” unpublished paper, May 2004.
Imbens, Guido W., and Donald B. Rubin, Causal Inference in Statistics, Social, and Biomedical Sciences, Cambridge, Mass.: Cambridge University Press, 2015.
Institute for Restorative Justice and Restorative Dialogue, “Restorative Discipline in Schools,” webpage, undated. As of June 4, 2021: https://irjrd.org/restorative-discipline-in-schools/
Lake, Robin, Brianna Dusseault, Melissa Bowen, Allison Demeritt, and Paul Hill, The National Study of Charter Management Organization (CMO) Effectiveness: Report on Interim Findings, Cambridge, Mass.: Mathematica Policy Research, June 2010.
Lumley, T., “Survey: Analysis of Complex Survey Samples,” R package version 4.0, 2020. As of September 10, 2021: https://cran.r-project.org/web/packages/survey/index.html
Martorell, Paco, and Louis T. Mariano, “The Causal Effects of Grade Retention on Behavioral Outcomes,” Journal of Research on Educational Effectiveness, Vol. 11, No. 2, 2018, pp. 192–216.
McCaffrey, Daniel F., Greg Ridgeway, and Andrew R. Morral, “Propensity Score Estimation with Boosted Regression for Evaluating Causal Effects in Observational Studies,” Psychological Methods, Vol. 9, No. 4, December 2004, pp. 403–425.
McCullagh, P., and J. A. Nelder, Generalized Linear Models, 2nd ed., New York, N.Y.: Chapman and Hall/CRC, 1989.
McEachin, Andrew, Douglas Lee Lauen, Sarah Crittenden Fuller, and Rachel M. Perera, “Social Returns to Private Choice? Effects of Charter Schools on Behavioral Outcomes, Arrests, and Civic Participation,” Economics of Education Review, Vol. 76, June 2020.
National Center for Education Statistics, “Public Charter School Enrollment,” webpage, updated May 2021. As of May 21, 2021: https://nces.ed.gov/programs/coe/indicator_cgb.asp
National Charter School Resource Center, “What Is a Charter School?” webpage, undated. As of May 21, 2021: https://charterschoolcenter.ed.gov/what-charter-school
NCSRC—See National Charter School Resource Center.
NWEA, “MAP Growth,” webpage, undated. As of September 15, 2021: https://nwea.org/map-growth/
NWEA, Linking the Pennsylvania PSSA Assessments to NWEA MAP Tests, Portland, Ore., February 2016. As of September 14, 2021: https://files.eric.ed.gov/fulltext/ED567817.pdf
Pane, John F., Elizabeth D. Steiner, Matthew D. Baird, Laura S. Hamilton, and Joseph D. Pane, Informing Progress: Insights on Personalized Learning Implementation and Effects, Santa Monica, Calif.: RAND Corporation, RR-2042-BMGF, 2017. As of June 18, 2021: https://www.rand.org/pubs/research_reports/RR2042.html
Peltason, Emily H., and Margaret E. Raymond, Charter School Growth and Replication, Volume I, Stanford, Calif.: Center for Research on Education Outcomes, 2013.
Pennsylvania Department of Education, “Future Ready PA Index: Glossary,” webpage, undated-a. As of August 11, 2021: https://futurereadypa.org/Home/Glossary#
Pennsylvania Department of Education, “Pennsylvania System of School Assessment (PSSA),” webpage, undated-b. As of September 14, 2021: https://www.education.pa.gov/K-12/Assessment%20and%20Accountability/PSSA/Pages/default.aspx
Peterson, Paul E., “Covid-19 Could Be the Moment We Turn to School Choice as a Road to Equal Opportunity,” Education Next, blog, January 12, 2021. As of June 2, 2021: https://www.educationnext.org/covid-19-could-be-moment-we-turn-to-school-choice-as-road-to-equal-opportunity/
R Core Team, R: A language and environment for statistical computing, R, Vienna, Austria: Foundation for Statistical Computing, 2021. As of September 10, 2021: https://www.R-project.org
Ridgeway, Greg, David Madigan, and Thomas Richardson, “Boosting Methodology for Regression Problems,” in D. Heckerman and J. Whittaker, eds., Proceedings of Artificial Intelligence and Statistics, 1999, pp. 152–161.
Ridgeway, Greg, and Daniel F. McCaffrey, “Comment: Demystifying Double Robustness: A Comparison of Alternative Strategies for Estimating a Population Mean from Incomplete Data,” Statistical Science, Vol. 22, No. 4, 2007, pp. 540–543.
Ridgeway, Greg, Dan McCaffrey, Andrew Morral, Matthew Cefalu, Lane Burgette, Joseph Pane, and Beth Ann Griffin, “Toolkit for Weighting and Analysis of Nonequivalent Groups: A Guide to the twang Package,” vignette, July 26, 2021. As of September 15, 2021: https://cran.r-project.org/web/packages/twang/vignettes/twang.pdf
Smith, Joanna, Caitlin Farrell, Priscilla Wohlstetter, and Michelle Nayfack, “Mapping the Landscape of Charter Management Organizations,” paper presented at the American Education Research Association and National Charter Schools Conference, San Diego, Calif. and Washington, D.C., 2009.