Research Management Review, Volume 18, Number 2 Fall/Winter 2011 1 Expectation-based Efficiency and Quality Improvements in Research Administration: Multi-institutional Case Studies Dhanonjoy C. Saha, Abrar Ahmed, and Shailaja Hanumandla Cannon Research Center, Carolinas HealthCare System, and the University of North Carolina ABSTRACT Conventional wisdom may support the presumed notion that higher expectations increase efficiency and improve quality. However, this claim may only be validated when workers are equipped with appropriate tools, training, and a conducive work environment. This study implements various interventions, observes outcomes, and analyzes data collected in three different institutions between 2003 and 2010. To increase efficiency and improve quality in research administration, an “open-expectation,” outcome-based efficiency (application review turn-around, operating costs), and quality (compliance error rate) improvement initiative was taken and data collected. Before initiation and during the observation and data collection, the stakeholders were consulted, tools generated, employees trained, conducive work environments created, and expectations clearly communicated to employees. Analyses of the data showed that implementation of the initiative with an expectation of improvement resulted in improved employee efficiency and quality of their work, resulting in improved financial performance of the operating units studied.
Transcript
Research Management Review, Volume 18, Number 2 Fall/Winter 2011
1
Expectation-based Efficiency and Quality Improvements in Research Administration:
Multi-institutional Case Studies
Dhanonjoy C. Saha, Abrar Ahmed, and Shailaja Hanumandla Cannon Research Center, Carolinas HealthCare System, and
the University of North Carolina
ABSTRACT Conventional wisdom may support the presumed notion that higher expectations increase efficiency and improve quality. However, this claim may only be validated when workers are equipped with appropriate tools, training, and a conducive work environment. This study implements various interventions, observes outcomes, and analyzes data collected in three different institutions between 2003 and 2010. To increase efficiency and improve quality in research administration, an “open-expectation,” outcome-based efficiency (application review turn-around, operating costs), and quality (compliance error rate) improvement initiative was taken and data collected. Before initiation and during the observation and data collection, the stakeholders were consulted, tools generated, employees trained, conducive work environments created, and expectations clearly communicated to employees. Analyses of the data showed that implementation of the initiative with an expectation of improvement resulted in improved employee efficiency and quality of their work, resulting in improved financial performance of the operating units studied.
Research Management Review, Volume 18, Number 2 Fall/Winter 2011
2
INTRODUCTION
Research and development are
essential factors in maintaining U.S. leadership in providing high-quality education, healthcare, and quality-of-life. Research and development aid the country in maintaining its economic strength and technological global leadership and are critical to expanding its knowledge base. They play an important role in driving improvements to advance social and economic power (Green & Langley, 2009). In addition to education, research has become a core mission of many academic health centers and universities—research is now considered a major pillar of their excellence.
Every year, the U.S. spends around 2.6% of its total Gross Domestic Product (GDP) on research and development. In 2010, the total research and development expenditure reached approximately $147.5 billion (National Science Foundation, 2011). Due to this sizable investment in research, understanding the system as well as managing and improving research activities became essential (Kirby, 1996). In recent years, the federal government has imposed stringent accountability standards in order to monitor appropriate utilization of research grant funds, both domestically and internationally. Therefore, it is important that institutions and universities alike conduct research activities with adherence
to compliance, economic, and financial guidelines and regulations, if they wish to operate their research enterprise successfully both locally and internationally.
During the past two decades, significant changes have occurred in research and its operations in most western countries. As interest in research has grown among politicians and citizens, more emphasis has been placed on the practical value of research and effective utilization of limited funds. As research and development further expand in the competitive global market, an even greater emphasis is placed on the effective use of limited resources and resultant outcomes (Decker et al., 2007; Orszag & Holdren, 2010; Rockwell, 2009). Therefore, a new approach to research administration and management has become necessary in order to successfully navigate a rapidly changing research climate (Erno-Kjolhede, 2001).
Research administration is a dynamic discipline involving a variety of processes in the delivery of research excellence. The discipline operates as a complex vehicle in carrying out research strategy formation, grant application preparation, awards negotiation and management, compliance implementation, research publication, knowledge transfer, and research product commercialization. However, the activities imposed upon or expected from research administrators and managers are growing
Research Management Review, Volume 18, Number 2 Fall/Winter 2011
3
and seem to be endless (Green & Langley, 2009). Therefore, research administrators must seek new and fresh approaches to managing the multidisciplinary system, which services employees and organizes the delivery of new research knowledge, services, and products. Concurrently, the system must also interface with state, federal, and private sponsors, the academic community, and research personnel, and aid the local and national environments in the delivery of the research product (Kirby, 1996).
“As research and development further expand in the competitive global market, an even greater emphasis is placed on the effective use of limited resources and resultant outcomes . . . .”
Traversing the heavily regulated landscape is not an easy task for research institutions and universities. The government is increasingly scrutinizing universities, expecting measurable returns on its investment and demanding greater transparency. As research regulations and compliance requirements increase and local, state, and federal funding decreases, research institutions and universities are faced with greater challenges as they seek to compensate for negative effects on their overall environments and increased operating costs. Therefore, it is imperative
that research administrators assess the efficiency and quality of the research programs they administer. In the current economic climate, without new strategies and effective management tools, it will be challenging to continue with current programs, to grow new ones, or to gain further financial support. Furthermore, it has been suggested that a system be established that is both efficient and flexible in meeting the changing demands of a competitive academic and global-research environment. A vision to improve the quality and efficiency of research has been a high priority for many universities as administrators emphasize research strategy development and set strategic objectives within their respective institutions (Green & Langley, 2009).
A variety of approaches have been implemented at various institutions to improve the efficiency and quality of research. These include institution-wide reviews, management restructuring, business process re-engineering, and process and technology improvements (Fowler et al., 2011; Frolick & Ariyachandra, 2006). Anecdotal evidence suggests that several universities have utilized other methods, such as the Lean Method, Six-sigma, and Business Process Management. However, there is scant evidence in the literature on the impact of efficiency and quality improvement initiatives utilizing these methods in research administration
Research Management Review, Volume 18, Number 2 Fall/Winter 2011
4
(Green & Langley, 2009; Stapleton et al., 2009). Nonetheless, in several national surveys, performance variables such as financial and organizational policies, procedures, and operational efficiency outcomes on a higher level, based on full-time equivalents (FTEs), were reported (Kirby & Waugaman, 2001, 2005). The results of a recent study on some performance and compliance metrics have been reported, implying the need for efficiency and quality improvement initiatives and their impact on research administration (Smith & Chen, 2011). Therefore, we undertook this project to gather information and provide interventions with expectations to improve efficiency and quality in research administration. It has been reported that higher expectations increase scholarly productivity (Anema & Byrd, 1991; Whorley & Addis, 2007) and that implementation of personal developmental strategies may increase efficiency in workplaces (Saha, 2004). We wished to examine whether these approaches would be applicable to research administration. Therefore, the purpose of this study was to examine expectation-based efficiency and quality improvement in research administration and to determine whether these processes affect the financial performance of units adapting this method.
MATERIAL AND METHODS
The main goal of the case study was to
measure the efficiency and quality of work in research administration. The case studies were conducted in three major U.S. institutions between 2003 and 2010 in which a combination of the Lean Method and Business Process Management were used (Frolick & Ariyachandra, 2006; Toyota Motor Corporation, 2009) with one exception: specific targets were not set (“open-expectation”). In addition, individuals were inspired to improve themselves with an expectation that this would improve efficiency in the workplace (Saha, 2004). Employees were inspired through formal and informal individual and group sessions. Also, opportunities were provided for the employees to reflect on their strengths and weaknesses, business processes were reviewed, a strategic plan was devised, stakeholders were consulted, institutional support was obtained, key performance indicators (KPIs) were selected, the plan was implemented, and data were collected. The plan was revised as necessary, or re-implemented. It was expected that the exercise would uncover opportunities for improvement and improve efficiency and quality, i.e., improve performance as measured by the KPIs. The institutions included: (1) a very large research-oriented metropolitan health department; (2) a mid-size research-
Research Management Review, Volume 18, Number 2 Fall/Winter 2011
5
intensive academic medical center, which included a medical school and a dental school; and (3) a very large healthcare system in which a moderate amount of research is conducted.
Efficiency is typically defined as the ratio of a program’s input (such as costs or time spent) measured against its output or outcome (amount of products or services delivered). For the purpose of these studies, efficiency was measured in terms of the turn-around time for the completion of a specific task, i.e., the amount of time taken by the respective offices to complete a task, such as reviewing and approving a grant application. In other words, the time difference from the date on which the task/application was received/accepted by the research administration (or a comparable office), to the date on which the task/application was completed/approved and the PI notified of its completion, was considered turnaround time and expressed in calendar days. Five KPIs were used; Institutional Review Board (IRB) review turnaround time (full-board), IRB review turnaround time (expedited), research and training grant application turn-around time, agreements and contracts turn-around time, and clinical trial application review turn-around time. All KPIs used in the studies are listed in Table 1. Performance is defined by the efficiency of a task or unit adjusted in
terms of total employees or total expenditures.
Measuring quality is more complicated as quality in many cases is subjective and defined differently by quality experts. A variety of perspectives was considered when defining quality, such as a customer’s perspective or a “specification-based” perspective. Quality in healthcare may be more precisely described as striving for and reaching excellence in standards of care (i.e., correct diagnosis, minimum wait time, lower cost, and private health information security). Quality in university research may be measured by the number of articles published in high-impact journals, number or dollar amount of grants received, number of patents issued, or number of products launched (i.e., technology commercialization). However, efficiency and quality measurements in research administration are complicated largely due to the lack of available data and inconsistencies in input variables. In our studies, quality was described as the number of applications with errors—two key quality indicators were measured (i.e., applications with errors) (as described in Table 1), and the number of errors in applications reviewed by institutional program officers who considered the application completed and ready for submission.
Research Management Review, Volume 18, Number 2 Fall/Winter 2011
6
Table 1. Key Performance Indicators (KPIs) Used, Duration of Study, and Data Collection Methods
* R, retrospective; P, prospective; eDR, electronic database records; FR, file records. ** Total turnaround time (turnaround), time taken by the Principal Investigator (PI) to respond and/or revise an application (PI time), and time taken by the IRB to review and approve a protocol (IRB time). # Research agreements and contract, sub-contract—incoming and outgoing, federally-funded clinical trials, intellectual property agreements. ## Research agreements, sub-contracts—incoming and outgoing, collaboration agreements.
Inst No.
Key Performance Indicators Used
Total
Duration (Months)
Pre-
implementation (Months)
Post-
implementation (Months)
Data Collection
Methods, Items Reviewed*
1 **IRB review/approval turn-around time (full-board), days
8 2 6 R, P, eDR
1 **IRB review/approval turn-around time (expedited), days
8 2 6 R, P, eDR
2 Research and training grant application review/approval turnaround, days
36 6 30 R, P, eDR
2 #Agreements and contracts/Other (A&C/Other) review/approval turnaround time, days
36 6 30 R, P, eDR
2 Clinical trial agreements/contracts review/approval turnaround time, days
36 6 30 R, P, eDR
2 Applications with error (financial, regulatory and compliance errors)1, %
18 6 12 R, P, FR, eDR
2 Number of errors per application
18 6 12 R, P; FR
2 ORSP employee performance with respect to workload2
60 24 36 R, P, FR
3 ##Agreements and contracts (AC) review/approval turn-around time, days
36 12 24 R, P, eDR
3 Employee performance with respect to workload of a core unit
48 24 24 R, P, FR
3 Financial performance of a core unit, %
48 24 24 R, P, eDR, FR
Research Management Review, Volume 18, Number 2 Fall/Winter 2011
7
“. . . efficiency and quality measurements in research administration are complicated largely due to the lack of available data and the inconsistencies in input variables.”
An Excel spreadsheet was maintained to track the following variables: reviewer name; type of review; date of initial receipt of the application/document; date on which the document was reviewed; date of initial response to Principal Investigator (PI); total number of days taken to receive revision; number of applications with errors; number of errors per application; and date on which the completion notification sent to the PI. Date and time were tracked from the application or from the electronic records. The application review errors were independently identified by a third person, verified with the employee who reviewed the application, and confirmed.
It was expected that efficiency and quality would improve; the improvements would decrease workloads and, essentially, require fewer employees to complete specific tasks. It was further envisioned that the result would improve the financial performance of the unit studied.
Employee performance was calculated by dividing the workload2 by the number of FTEs. Workload was converted to weight-adjusted units and expressed as arbitrary
unit of work (AUW). Lastly, financial performance was calculated from the difference in budgeted amounts and the actual expended amounts and expressed as a percentage.
In institution #1 the hierarchy was concerned that an IRB application review and approval process was taking longer than expected. The IRB office was asked to determine the average time taken to review and approve different types of IRB applications—full-board and expedited reviews. It was also communicated that the results would be shared with the highest institutional officials and be posted on the institutional website. While no targets were set, an expectation of faster turnaround for the reviews and approvals was implied. Following the communication policies and procedures of the entire IRB, processes were reviewed and historical turnaround data were collected. The exercise identified redundant or inefficient processes and steps, need for education and training of staff and PIs, and need for policy changes. Prospective data were collected and analyzed—this included data on the PIs and their staff’s response time to the IRB’s questions or concerns, its impact on IRB review, and approval turnaround time. In institution #2, concerns were raised that clinical trial agreements and contracts review took longer than necessary and resulted in lost opportunities. It was expected that turnaround time would
Research Management Review, Volume 18, Number 2 Fall/Winter 2011
8
decrease and improve efficiency. Based on these concerns, senior managers asked the Office of Research and Sponsored Programs (ORSP) to look into the situation and to improve efficiency—no specific target was proposed. In addition, during the exercise, a number of other areas were reviewed and data collected as presented in Table 1. Further, error rates on regulatory and financial compliance-related concerns were measured in which ORSP decision makers expected review and application quality improvements.
Similar issues were presented on grants and contracts review and approval turnaround time in one sub-unit and operational efficiency of a core unit in institution #3. Review and approval turnaround time for various grants and contracts were measured and the management and operational structures of the core unit were reviewed in which the same expectations were communicated.
Before initiating efficiency and quality measurements, a holistic efficiency and quality improvement approach was applied, which included a thorough review and revision of the following: (1) existing policies and procedures; (2) job descriptions and reporting structures; (3) roles and responsibilities of employees; (4) workflow; (5) personnel skills, expertise, education and training; (6) forms, checklists, and other tools; (7) interpersonal dynamics; and (8) total work environment. However, not all
methods were implemented in all institutions—the methods and processes used were determined by needs as uncovered during the discovery phase and analysis. The process also included development and implementation of forms, checklists, matrices, seminars, presentations, and other staff development activities, such as developing career advancement strategies. In addition to attending in-house staff developmental activities, the employees were encouraged or required to attend regional and national meetings and conferences. Because of the initiatives, redundant processes were recognized, gaps were identified, and opportunities for improvement were revealed, strategic goals were created and specific goals and KPIs were developed (Frolick & Ariyachandra, 2006; Toyota Motor Corporation, 2009). Collectively, these activities and the “change management” strategies were considered interventions. These informal initiatives and interventions did not impose additional resources from the administration but they received the approval, support, and cooperation from the stakeholders and the upper management.
The data collected include historical and prospective data from the period of two months to two years prior to initiating the study (pre-implementation data), and prospective data from the period of six months to three years after review and
Research Management Review, Volume 18, Number 2 Fall/Winter 2011
9
intervention (post-implementation data), depending on the program and specific item/task involved. Available data were collected from paper-folder records and/or computer databases and were aggregated to monthly or yearly data means (see Table 1).
The “mean of the means” of the data was calculated and analyzed by one-way analysis of variance (ANOVA), which compared the pre-implementation period data to the post-implementation period data. The consolidated data were then presented as the means in calendar days or percentages and standard deviations (SDs). Values of p<0.05 were considered significant.
RESULTS IRB Review and Approval Turn-around Time
The data presented in Figure 1A and 1B
represent the IRB turnaround time in
institution #1. Analyses of the data showed that turnaround time for full-board review and approval total turnaround time decreased from an average of 55.3 days ± 35.0 days to 35.4 days ± 7.2 days. Although the overall improvement from pre- to post-implementation period was 35.9%, it was not statistically significant (Figure 1A). However, the IRB office itself decreased the turnaround time from 30.5 days ± 11.7 days to 21.1 days ± 5.9 days, which was statistically significant (p<0.05), representing an efficiency improvement of 30.8%.
The expedited reviews and approval turnaround time decreased from an average of 31.4 days ± 16.4 days to 25.9 days ± 8.8 days (Figure 1B). Similarly, the overall improvement from pre- to post-implementation period was found to be 17.6%, but it did not reach statistical significance.
Figure 1. IRB Turnaround Time for Review and Approval of Full-board (A) and Expedited (B) Applications
Research Management Review, Volume 18, Number 2 Fall/Winter 2011
10
Research and Training Grant Application Turn-around Time
Figure 2 shows that the average time taken for research and training grant applications review and approval significantly decreased from an average of 3.8 days ± 1.5 days to 1.9 days ± 0.37 days from pre-implementation to post-implementation period (p<0.001). Analysis of the data further showed that the time taken to complete this task decreased 50.0%, which was sustained throughout the duration of the study.
Agreements and Contracts Turn-around Time in Institution #2
Analysis of the data for turnaround time for review and approval of agreements and contracts at institution #2 showed a decrease from an average of 6.3 days ± 3.6 days in the pre-implementation period to 2.6 days ± 0.9 days in the post-implementation period. The overall improvement from pre- to post-implementation was 58.7%, which was statistically significant (p<0.003).
Figure 2. Turnaround Time for Review and Approval of Research and Training Grant Applications
Research Management Review, Volume 18, Number 2 Fall/Winter 2011
11
Figure 3. Turnaround Time for Review and Approval of Agreements and Contracts in Institution #2
Clinical Trial Applications Review and Approval Turnaround Time
The turnaround time for review and approval of clinical trial applications in institution #2 is shown in Figure 4. Analysis of the data showed that turnaround time
decreased from an average of 23.0 days ± 13.6 days to 4.1 days ± 0.9 days in the pre- and post-implementation period, respectively (p<0.001), which represents an 82.2% efficiency improvement.
Research Management Review, Volume 18, Number 2 Fall/Winter 2011
12
Figure 4. Turnaround Time for Review and Approval of Clinical Trials Applications
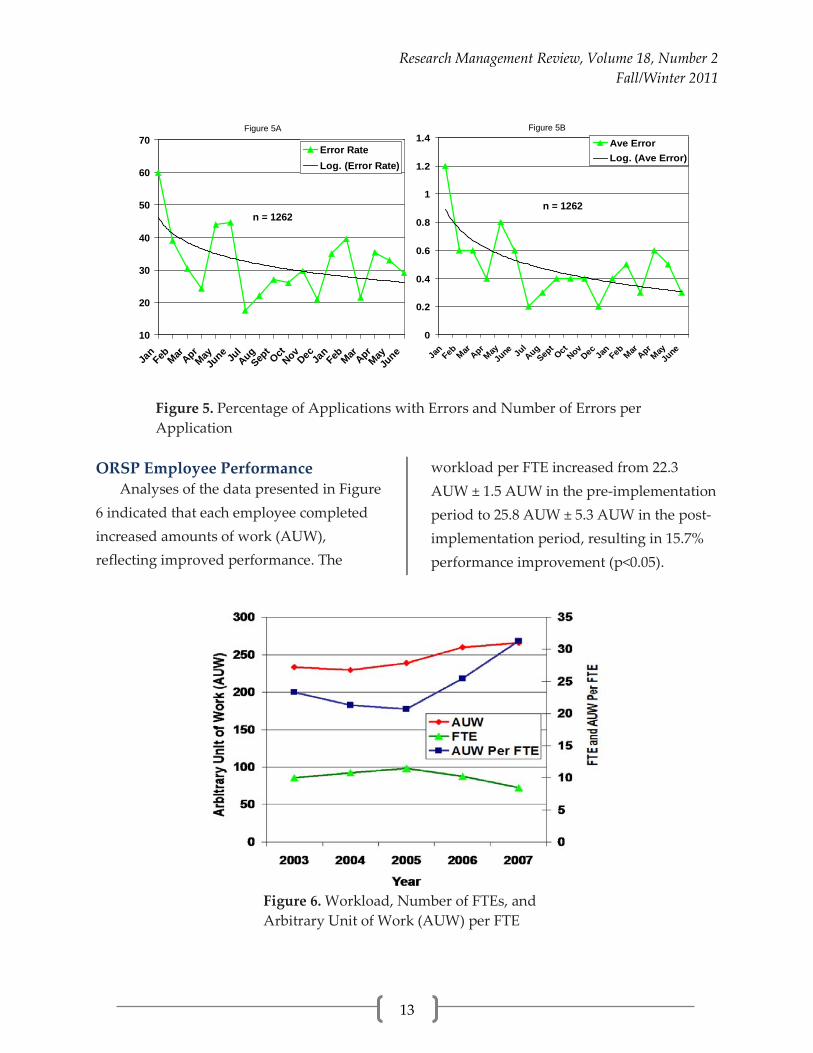
Percentage of Application with Errors and Number of Errors per Application
Figure 5A shows the percentage of applications with errors. The overall percentage of applications with errors was reduced from an average of 40.4% ± 12.4% in the pre-implementation period to 28.1% ± 6.8% in the post-implementation period, a 30.4% decrease in error rate, which is a significant improvement in the quality of
the applications reviewed (p<0.03). The data presented in Figure 5B showed that the number of errors per application decreased from an average of 0.7 errors ± 0.3 errors per application to 0.4 errors ± 0.1 errors per application. The number of errors per application decreased 42.9% in the post-implementation period compared to the pre-implementation period (p<0.05).
Research Management Review, Volume 18, Number 2 Fall/Winter 2011
13
Figure 5. Percentage of Applications with Errors and Number of Errors per Application
ORSP Employee Performance
Analyses of the data presented in Figure 6 indicated that each employee completed increased amounts of work (AUW), reflecting improved performance. The
workload per FTE increased from 22.3 AUW ± 1.5 AUW in the pre-implementation period to 25.8 AUW ± 5.3 AUW in the post-implementation period, resulting in 15.7% performance improvement (p<0.05).
Figure 6. Workload, Number of FTEs, and Arbitrary Unit of Work (AUW) per FTE
10
20
30
40
50
60
70
Jan
Feb Mar AprMay
June Ju
lAug
Sept
OctNov
Dec Jan
Feb Mar AprMay
June
Error RateLog. (Error Rate)
n = 1262
0
0.2
0.4
0.6
0.8
1
1.2
1.4
Jan
Feb Mar AprMay
June Ju
lAug
Sept
Oct NovDec Ja
nFeb Mar Apr
MayJu
ne
Ave ErrorLog. (Ave Error)
n = 1262
Figure 5A Figure 5B
Research Management Review, Volume 18, Number 2 Fall/Winter 2011
14
Agreements and Contracts Review and Approval Turnaround Time in institution #3
Data presented in Figure 7 indicated that average turnaround time significantly decreased from 34.3 days ± 27.0 days to 19.3
± 10.3 days in the pre- and post-implementation periods, respectively, resulting in a 43.9% decrease in turnaround time in the post-implementation period (p<0.05).
Figure 7. Agreements and Contracts Review and Approval Turn-around Time in Institution #3
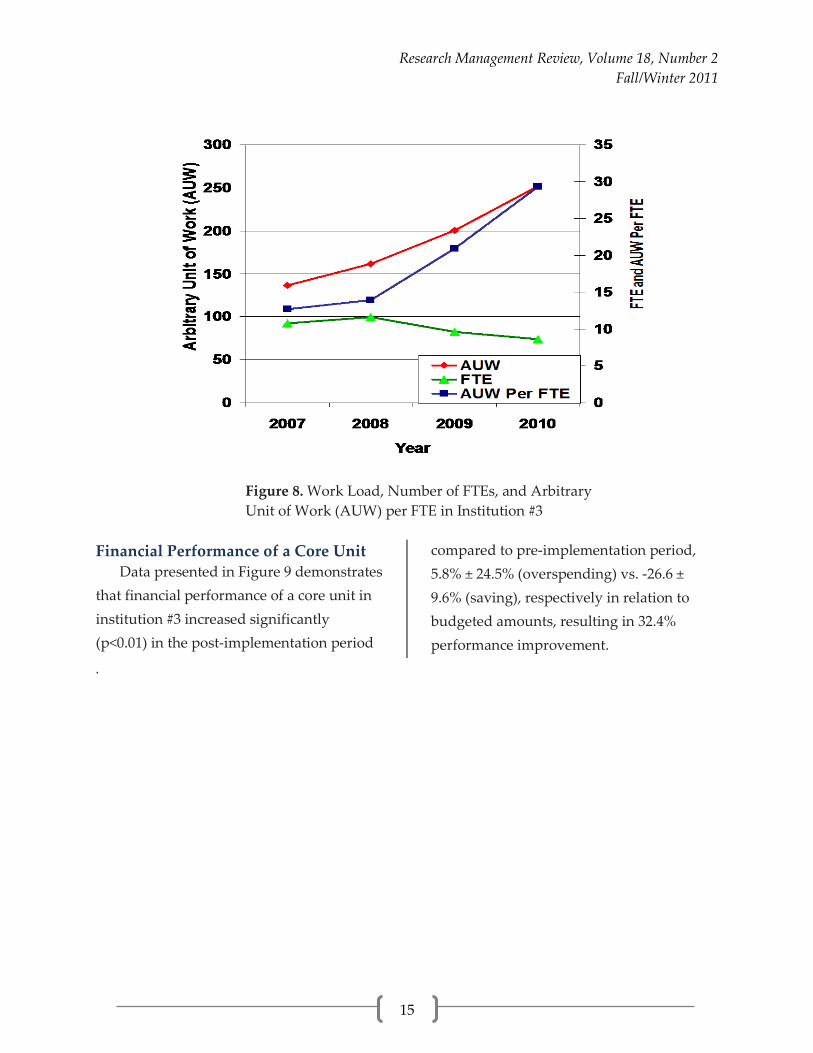
Employee Performance in a Core Unit
Employee performance data from a core unit in institution #3 are presented in Figure 8. Analyses of the data showed that the workload per FTE increased from an average of 13.3 AUW ± 1.0 AUW to 25.1
AUW ± 6.4 AUW, representing a 47.0% increase in efficiency in the post-implementation period compared to the pre-implementation period (p<0.01).
Research Management Review, Volume 18, Number 2 Fall/Winter 2011
15
Figure 8. Work Load, Number of FTEs, and Arbitrary Unit of Work (AUW) per FTE in Institution #3
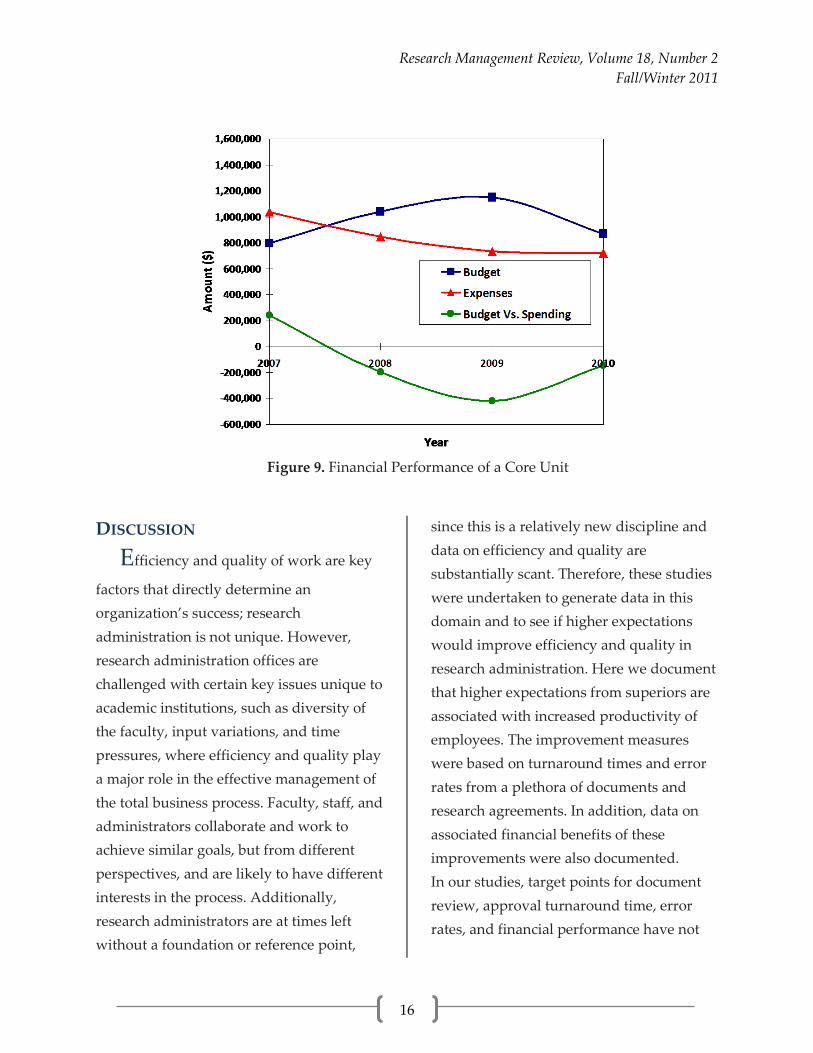
Financial Performance of a Core Unit
Data presented in Figure 9 demonstrates that financial performance of a core unit in institution #3 increased significantly (p<0.01) in the post-implementation period
compared to pre-implementation period, 5.8% ± 24.5% (overspending) vs. -26.6 ± 9.6% (saving), respectively in relation to budgeted amounts, resulting in 32.4% performance improvement.
.
Research Management Review, Volume 18, Number 2 Fall/Winter 2011
16
Figure 9. Financial Performance of a Core Unit
DISCUSSION
Efficiency and quality of work are key
factors that directly determine an organization’s success; research administration is not unique. However, research administration offices are challenged with certain key issues unique to academic institutions, such as diversity of the faculty, input variations, and time pressures, where efficiency and quality play a major role in the effective management of the total business process. Faculty, staff, and administrators collaborate and work to achieve similar goals, but from different perspectives, and are likely to have different interests in the process. Additionally, research administrators are at times left without a foundation or reference point,
since this is a relatively new discipline and data on efficiency and quality are substantially scant. Therefore, these studies were undertaken to generate data in this domain and to see if higher expectations would improve efficiency and quality in research administration. Here we document that higher expectations from superiors are associated with increased productivity of employees. The improvement measures were based on turnaround times and error rates from a plethora of documents and research agreements. In addition, data on associated financial benefits of these improvements were also documented. In our studies, target points for document review, approval turnaround time, error rates, and financial performance have not
Research Management Review, Volume 18, Number 2 Fall/Winter 2011
17
been established. However, the results indicate that almost all KPIs were improved across all three institutions. We did not attempt to determine the exact cause and effect of the results, as this was beyond the scope of these studies. Nonetheless, implementing new policies and procedures, reengineering processes, creating databases, providing employee training, and communicating clearly with the expectation that KPIs would improve, seem likely to underlie these improvements (Anema & Byrd, 1991). These authors reported that expectations improved productivity. However, higher expectations may divert people from other important endeavors (Whorley & Addis, 2007). We did not observe any such deviations, presumably because we did not set target points in order to avoid the perception of having set our expectations too high.
“ . . . higher expectations from superiors are associated with increased productivity of employees.”
In institution #1, three fundamental changes were made to improve the IRB application review and approval turnaround time. (1) An agency-wide educational program was instituted in which key stakeholders were invited to attend and educational seminars were presented; (2) applications were reviewed
by the IRB office, recommended changes were communicated to the PIs, and the revisions were made before the applications were presented to the IRB for review; and (3) checklists were prepared and office staff members were re-trained to quickly identify administratively-incomplete applications. The incomplete applications were immediately returned to the submitters for corrections.
One additional procedural change contributed significantly to the faster turnaround time for the IRB application review and approval. In each full board meeting, a subcommittee of three was instituted where appropriate to determine whether recommended changes were made and approval granted if the changes were found to be satisfactory, without waiting for the next month’s convened IRB meeting. The procedural changes were workable because the office received institutional support and the committee members were committed to the additional work. However, the decrease in IRB review and approval turnaround time did not reach statistical significance. The shorter duration of the study period, small sample size, and high input variables may have contributed to the observed statistical insignificance. Nevertheless, IRB office turnaround time showed significant improvement, implying the effectiveness of the program. Our pre-implementation data were comparable to the data recently released by the
Research Management Review, Volume 18, Number 2 Fall/Winter 2011
18
Association for the Accreditation of Human Research Protection Program (AAHRPP, 2011). Full-board approval was shown to take an average of 45.7 days while expedited review took an average of 27.9 days. Our post-implementation turnaround time was 35.9 days and 17.6 days, respectively—considerably lower than the national averages.
In institution #2, similar IRB procedural changes were made and marked improvements were reported to have been made (personal communication—data not shown here). A similar initiative implemented at Rockerfeller University also revealed improvements in IRB turnaround times (Rhonda Kost & associates, unpublished data, www.ctsaweb.org). The data indicated that pre- and post-implementation turnaround times decreased from 59 days to 32 days (full-board review) and 16 days to 10 days (expedited review). Furthermore, similar results were found at the University of Texas Health Sciences Center at Houston (Sujatha Sridhar & associates, unpublished data. www.ctsaweb.org), suggesting the effectiveness of these interventions in improving IRB review and approval turnaround time.
The data from institution #2 showed significant improvements in turnaround time for all applications, agreements and contracts, and clinical trial applications reviews and approvals (Figures 2, 3, and 4).
However, no significant improvement was found for material transfer agreements (data not shown). In addition, we found that personnel service agreement negotiation and execution (a separate process from grants and contracts negotiation and execution) turnaround time did not decease (data not shown). The reason for these findings is uncertain. However, the role of employee entitlement and political influence in preventing contributions from involved employees (Atkinson & Gilleland, 2007) or employees’ over-emphasis on meeting other expectations, thereby distracting them (Atkinson & Gilleland, 2007; Harvey & Harris, 2010) and resulting in this outcome, cannot be ruled out. A similar phenomenon was shown in the examination of institution #3, in a unit not included in this study.
A few of the steps toward process reengineering, which presumably contributed to improvements in these KPIs, are indicated in the Materials and Methods Section. Additionally, other important issues were revealed and have been brought to the administration’s through staff meetings, individual performance meetings, brainstorming meetings, small-group meetings, super-user focus group meetings, and lunch meetings. A series of other team-building efforts were implemented prior to stakeholder support and cooperation at the onset of and during data collection. The data collection method was informal and
Research Management Review, Volume 18, Number 2 Fall/Winter 2011
19
unstructured; nonetheless, the following were found to be some of the reasons associated with a lack of motivation, resulting in poor employee performance: (1) lack of knowledge, tools and resources needed for job performance; (2) personal issues; (3) interpersonal dynamics within and outside the office; (4) health-related stress; (5) lack of clear policies and procedures; (6) ambiguous job descriptions and reporting relationships; and (7) unclear or lack of accountability and expectations. The exercises also revealed that employees who were viewed as not being able to deliver on time or produced poor-quality work and offered the most resistance to change, were those who worked under ill-defined circumstances and performance expectations and fell under the “entitled employee” category (Atkinson & Gilleland, 2007; Harvey & Harris, 2010). In addition, the process flow review revealed that all applications and protocols were routed to the Dean’s Office prior to being sent to ORSP, which needed approximately three days to process these items. Traditional and customary procedures appeared not to have served any meaningful purpose. Eliminating the step not only expedited the review process, but also decreased the Dean’s workload. However, the authors recognize that this step may not apply to other institutions, which may be bound by culture or internal policies and procedures.
Studies showed that de-emphasis on written accounting positively correlated with employees’ spontaneity, and innovation. Also, high (unrealistic) expectations from supervisors negatively correlated with employees’ frustration and anger (Eisikovits et al., 1985). Nonetheless, improvements were seen in this study where employees were asked to document the time spent on completion of a specific task. Employees were encouraged, not directed, or penalized in their efficiency evaluations. The tone of the supervisor communication may have contributed to this improvement (Harvey & Harris, 2010) in which “informative communication,” as opposed to “evaluative communication,” was used. Adaptation of these strategies may have contributed to the overall improved efficiency seen in these studies. However, resistance mediated through the “culture of resistance,” employee-entitlement and political influence (Atkinson & Gilleland, 2007; Harvey & Harris, 2010) and the frustration generated against the provision for written accountability, have been mitigated in part by the perception of supervisor competency, management style, and communication (Eisikovits et al., 1985; Harvey & Harris, 2010), and also through institutional support, which is an integral part of business process management (Frolick & Aryiachandra, 2006).
Research Management Review, Volume 18, Number 2 Fall/Winter 2011
20
We found that the contract negotiation and execution process in institutions #2 and #3 varied; turnaround time for a comparable process in institution #2 significantly decreased from 114 days to 73 days (data not shown). An additional process change was implemented in which employees were instructed to send email reminders to constituents every two weeks followed by a phone call in the event of nonresponse. In an effort to develop matrices and improve efficiency, a similar approach was taken at another institution—extrapolation of data revealed that turnaround time for grants and contract negotiations was about 80 days (Smith & Citerne, 2010). In institution #3, it took much less time in both the pre- and post-implementation period (36.8 to 25.8 days, respectively) when utilizing a similar process (Figure 7). Different organizational structures, numbers of grants and contracts, complexity of contacts or organization, available FTEs, and management philosophy and expectations are considered the reasons for these differences.
Our studies have demonstrated decreased error rates in applications submitted and number of errors per application (Figure 5A & 5B). We assumed that low error rates in applications reflected one of the following scenarios: (1) reviewers were able to identify errors better and corrected them before they were marked “completed”, or (2) application preparers
generated better applications during the post-implementation period. The contribution of the latter is thought to be the major contributing factor, which may be supported by the following observations. During the discovery and strategy phase, it was clear that substantial training and staff development were needed (also, supported by external consultants) and thought to be an integral part of the efficiency improvement process. Subsequently, individual and group trainings were developed and made available to the ORSP staff, PIs, and other institutional staff. The training may have provided staff with the necessary tools to prepare better-quality applications, i.e., with decreased number of errors. Further, our data revealed that the project officers (reviewers) took a slightly longer time to review and approve applications (data not shown) and other documents. The data suggested that the reviewers might have paid closer attention to the details in their document review, which in turn improved quality. Monahan and Fortune (1995) demonstrated that providing training on the internal proposal development process significantly improved external awards, reflecting application quality improvement. Our data agreed with this report.
In our studies, we observed two interesting, but not surprising, phenomena—sudden spikes in error rates prior to or after short times off, and
Research Management Review, Volume 18, Number 2 Fall/Winter 2011
21
increased error rates in applications reviewed with unusual alacrity. After discussing these with employees, we understood that the performance problem affecting work error rates might involve factors such as employee wellness or personal problems. Of course, the employees sought to meet expectations, while compromising quality (Whorley & Addis, 2007). Our investigation found that errors spiked following minor physical or non-work-related stressors (Figure 5; May–June 2004 & February–March 2005) of certain employees (data not shown). Although no attempts were made to perform statistical analyses of these observations (outside the scope of this study), alleviating these concerns appears to have resolved inadvertent oversight by affected employees identifying regulatory, financial, or other compliance issues.
The studies also provide invaluable insight into the benefits of improved turnaround time and work quality. Some of the benefits included time saving, encouragement of new study submissions, increased customer satisfaction, and decreased complaints against ORSP. In addition to implementing the open-ended expectation model, the best results were generated through informative communication and via holding regular office staff meetings, soliciting feedback from faculty and staff, and identifying causes of delays and errors. As indicated
above, we found that increased expediency increased error rates, just as increased expediency error rates have been linked to stress-related issues. When the causes were assessed, corrections were made and immediate improvement ensued. Improved efficiency was found to be directly correlated with the work unit’s improved financial performance. Efficiency improvement decreased FTE needs and contributed to overall financial performance improvement (Figures 8 and 9).
“In addition to implementing the open-ended expectation model, the best results were generated through informative communication and via implementing regular office staff meetings, soliciting feedback from the faculty and staff, and identifying the causes for the delays and errors.”
We recognize the limitations of these studies—the pre- and post-implementation periods were arbitrarily determined since efficiency and quality improvements are continuous processes. Also, the data were obtained from only three institutions. The lack of detailed, structured, uniform tracking processes, observers’ bias, and limited analyses of the data may have caused a slight overestimation of the
Research Management Review, Volume 18, Number 2 Fall/Winter 2011
22
association between expectations and efficiency and work quality. However, our data and analyses exhibit several important strengths—they capture three different types of institutions with differing administrative and management structures, and differing expectations. These data may not be generalized; however, we are confident the results are comparable to those for other institutions and universities. Our findings revealed that implementation of similar processes will improve efficiency and quality, which in turn will improve the financial performance of research administration and sponsored programs as a whole. Again, the evidence provided by Monahan and Fortune (1995) clearly showed that improving the research administration process and providing services to faculty and staff, increase institutions' external funding.
Our data also highlight the importance of achieving a base-level working performance system prior to implementing specifically focused initiatives. However, benchmarking data from a wider and more
diverse group of institutions may further inform this analysis. In order to develop benchmarking data in research administration, we conceptualized a user-friendly data-capturing and data sharing system. Such a system may also assist institutions in planning or developing programs and in distributing resources more effectively. Currently, we are working to establish and validate the process and the system model. Furthermore, after reviewing data generated by other organizations, we have found data on efficiency improvement measures, but we were unable to find comprehensive information on the implementation process for a full quality improvement initiative. Our experiences with this form of observation and these analyses have led us to rethink and make adaptations to our management style in research administration. We hope these findings will stimulate ideas and encourage further research on the theoretical and methodological foundations for improving research administration and management.
Research Management Review, Volume 18, Number 2 Fall/Winter 2011
23
ENDNOTES
1. Wrong or inappropriate IRB or IACUC approval date; wrong F&A cost rate or cognizant agency approval date; over or under budget; undocumented or unjustified waiver of or reduced F&A; inconsistent or inappropriate time and effort estimation or report; unallowable items in the budget; allowable items not budgeted; undocumented cost-share; over-committed effort; wrong or missing other support; inappropriate cost base; undocumented use of biohazard materials; use of undocumented or non-reviewed export control items; undocumented or unapproved use of animals or human subjects, or use of these subjects where the approval expired; missing or expired training of investigators using human and animal subjects; undocumented or non-reviewed conflicts of interest; use of uncertified or unapproved facilities; inappropriate use of funds; transfer of materials without material transfer agreements; shipping and receiving items from foreign countries without license or institutional review; binding institution (signing agreements/contracts) without appropriate signatory authority; use of foreign students and investigators from prohibited countries in studies involving export control issues; unauthorized use of select agents or use of these without institutional oversight, inappropriate or undocumented cost transfer; inappropriate or unreported reduction of efforts; unreported absentee PI; change of scope; and data entry errors. Applications include new and continuation applications, or final reports. 2. Employee workload was indicated as arbitrary unit of work (AUW). AUW is calculated by considering the total amount of funding, number of applications submitted, number of awards received, number of grants and contracts processed, and number of other applications or documents reviewed by the office. An arbitrary weighted-average value was assigned to each task or value, and the total value was considered as the entire workload, or AUW.
Research Management Review, Volume 18, Number 2 Fall/Winter 2011
24
Supplemental Data/Consolidated Data Summary Inst No.
Key Performance Indicators Used
Pre-implementation
Post-implementation
Improve-ment Significance
1 IRB review/approval turn-around time (full-board), days
55.3 ± 35.0 35.4 ± 7.2 35.9% NS*
1 IRB review/approval turn-around time (expedited), days
31.4 ± 16.4 25.9 ± 8.8 17.6% NS*
2
Research and training grant Application review/approval turn-around, days
3.8 ± 1.5 1.9 ± 0.37 50.0% p<0.001
2 Agreements and contracts review/approval turn-around time, days
6.3 ± 3.6 2.6 ± 0.9 58.7% p<0.003
2
Clinical trial agreements/contracts review/approval turn-around time, days
2 Number of errors per application 0.7 ± 0.3 0.4 ± 0.1 42.9% p<0.05
2 ORSP employee performance with respect to workload, AUW
22.3 ± 1.5 25.8 ± 5.3 15.7% p<0.05
3 Agreements and contracts (AC) review/approval turn-around time, days
34.3 ± 27.0 19.3 ± 10.3 43.9% p<0.05
3 Employee performance with respect to workload of a core unit, AUW
13.3 ± 1.0 25.1 ± 6.4 47.0% p<0.01
3 Financial performance of a core unit, % 5.8 ± 24.5 - 26.6 ± 9.6 32.4% p<0.01
*NS, not significant
Research Management Review, Volume 18, Number 2 Fall/Winter 2011
25
AUTHORS’ NOTE We thank Herbert L. Bonkovsky, MD,
for his leadership, and Paul Hudobenko, Debra Kieft, Marcus Santodonato, and Cliff Williams for their commitments to the
initiative that contributed, in part, to efficiency and quality improvements. We also thank Debra Kieft for her critical reviewing and editing of the manuscript.
LITERATURE CITED
AAHRPP. (2011). Metrics on HRPP performance. http://www.aahrpp.org/www.aspx?PageID=362
Anema, M. G., & Byrd, G. L. (1991). A systems model approach to increasing faculty productivity. Journal of Nurse Education, 30(3), 114–118.
Atkinson, T. N., & Gilleland, D. S. (2007). Virtue blindness and hegemony: Qualitative evidence of negotiated ethical frameworks in social language of university research administration. Science and Engineering Ethics, 13, 195–220.
Decker, R. S., Wimsatt, L., Trice, A. G., & Konstan, J. A. (2007). Faculty Burden Survey Project: A profile of federal-grant administrative burden among federal demonstration partnership faculty. Washington, DC: National Academies Press.
Erno-Kjolhede, E. (2001). Managing collaboration research. Unveiling the microdynamics of the European Triple Helix. Copenhagen, Denmark: Copenhagen Business School Press.
Eisikovits, Z., Meier, R., Guttmann, E., Shurka, E., & Levinstein, A. (1985). Supervision in ecological context: The relationship between the quality of supervision and the work and treatment environment. Journal of Social Science Research, 8(4), 37–58.
Fowler, N., Green, J., Rutherford, S., & Turner, T. (2011). Research intelligence and performance management. Research Global (February), 8.
Frolick, M. N., & Ariyachandra, T. R. (2006). Business performance management: One truth. Information System Management (Winter), 41–48.
Green, J., & Langley, D. (2009). Professionalizing research management. London, U.K.: Imperial College London & Elsevier.
Harvey, P., & Harris, K. J. (2010). Frustration-based outcomes of entitlement and the influence of supervisor communication. Human Relations, 63(11), 1639–1660.
Kirby, W. S. (1996). Understanding and managing sponsored research administration as a system. SRA Journal, 27, 25–36.
Research Management Review, Volume 18, Number 2 Fall/Winter 2011
26
Kirby, W. S., & Waugaman, P. G. (2001). Benchmarking in sponsored program administration: Using the web to analyze results from the FY 1998 and 2000 nationwide data collection. The Journal of Research Administration, 33, 37–40.
Kirby, W. S., & Waugaman, P. G. (2005). Practice data from the 2002 SRA-Bearing Point Nationwide Benchmarking Survey. The Journal of Research Administration, 36, 4–15.
Monahan, T. C., & Fortune, J. C. (1995). Using institutional variables to predict successes in the acquisition of sponsored projects. Research Management Review, 8, 23–40.
National Science Foundation. (2011). Academic research and development expenditure. Retrieved June 5, 2011, from http://www.nsf.gov/funding/aboutfunding.jsp
Orszag, P. R., & Holden, J. P. (2010). Memorandum to the heads of executive departments and agencies. Office of Management and Budget, and Office of Science & Technology Policy. White House, Washington, DC, April 21.
Rockwell, S. (2009). FDP Faculty Burden Survey. Research Management Review, 16, 29–42. Saha, D. C. (2004). Strategy for advancement with humility, but assertiveness: Efficiency improvement
at workplace. Prudential Realty, Bayside, NY, September 24. Smith, M., & Chen, A. (2011). Research administration metrics: Making your numbers tell the
right story. NCURA Magazine, 10, 12–15. Smith, G., & Citerne, D. (2010). Using metrics to manage performance and improve customer
service. Presentation at the NCURA National Meeting, Washington, D.C., November 22. Stapleton, F. B., Hendricks, J., Hagan, P., & DelBeccaro, M. (2009). Modifying the Toyota
Production System for continuous performance improvement in an academic children’s hospital. Pediatric Clinics of North America, 56(4), 799–813.
Toyota Motor Corporation. (2009). Toyota Production System. Retrieved February 2, 2009, from http://www.toyota.co.jp/en/vision/production_system.
United States Army. (2009). Lean Six Sigma. Retrieved February 17, 2009, from http://www.army.mil/ArmyBTKC/focus/cpi/tools3.htm.
Whorley, M. R., & Addis, M. E. (2007). Effect of scholarly productivity expectations on graduate training in clinical psychology. Clinical Psychology: Science and Practice, 14(2), 172–174.