Page 1
© Experian Public
Experian Automotive Quarterly Briefing Third quarter 2017 automotive market share trends and registrations
Marty Miller | Senior Product Manager, Vehicles in Operation (VIO)
Page 2
2 © Experian Public
Today’s presentation
Questions? Contact us at [email protected]
What’s on the RoadVIO by model year, segment, age and market share
U.S. light duty vehicles through September 30, 2017
Hurricane Harvey update
Marty MillerSenior Product Manager, VIO
Page 3
3 © Experian Public
U.S. and Canada total Vehicles in Operation = 316.3M
Light DutyPassenger Cars, Light Trucks, Vans
Cars and GVW Class 1 – 3
Medium & Heavy DutyLarge Vans, Delivery Trucks, Buses, RVs,
Cement Trucks, Semi-TractorsGVW Class 4 - 8
Power SportsMotorcycles, All-Terrain,
Utility Task, Snowmobiles
Page 4
4 © Experian Public
What’s on the road today?Light Duty Vehicles
Vehicles in Operation
Page 5
5 © Experian Public
Source: Experian Automotive as of
September 30, 2017 (U.S. light duty vehicles
only)
U.S. Vehicles In Operation – a 12 month viewQ3 2016
265.3millionVehicles on
the road
Q3 2017271
millionVehicles on
the road
17.1*
NEWVEHICLES
DEALER
42.6*
USEDVEHICLES
199.9*
NOCHANGES
11.4*EXIT
Out of Operation
*In millions; U.S. totals include Puerto Rico
Page 6
6 © Experian Public
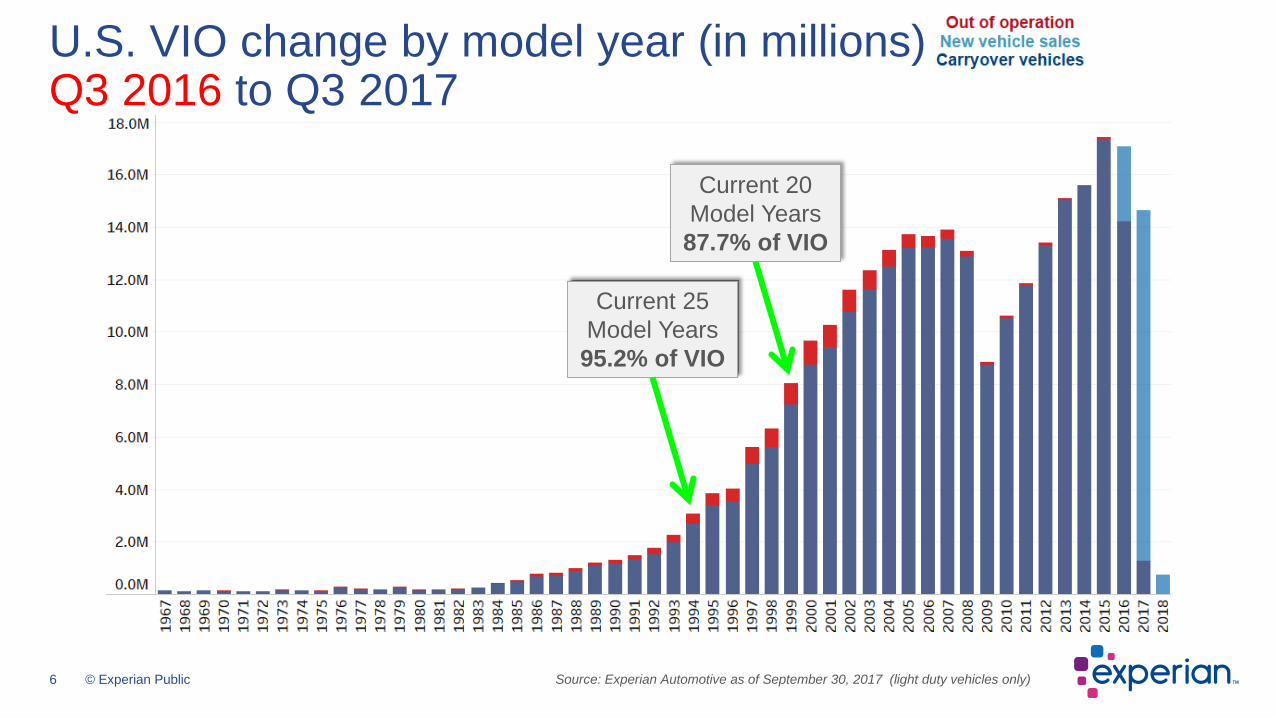
U.S. VIO change by model year (in millions)Q3 2016 to Q3 2017
Current 20Model Years
87.7% of VIO
Current 25Model Years
95.2% of VIO
Source: Experian Automotive as of September 30, 2017 (light duty vehicles only)
Page 7
7 © Experian Public
U.S. VIO Top 20 segments on the road market share
Source: Experian Automotive as of September 30, 2017 (light duty vehicles only)
Page 8
8 © Experian Public
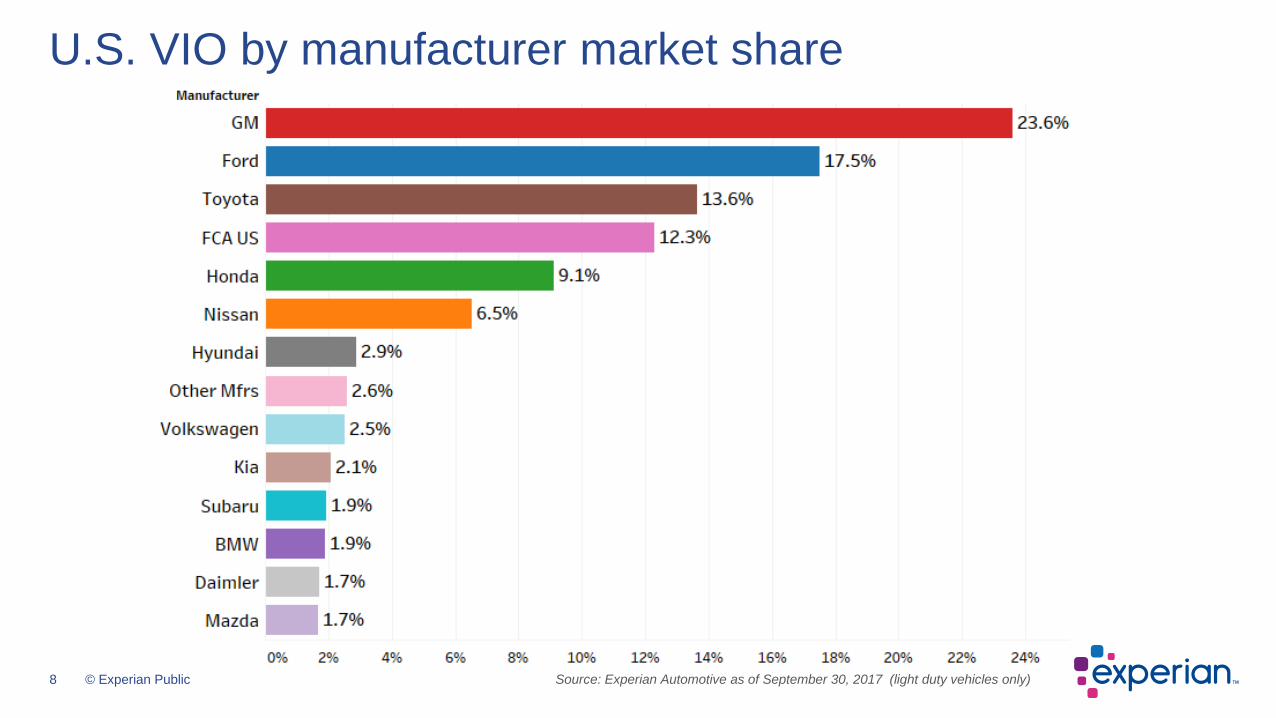
U.S. VIO by manufacturer market share
Source: Experian Automotive as of September 30, 2017 (light duty vehicles only)
Page 9
9 © Experian Public
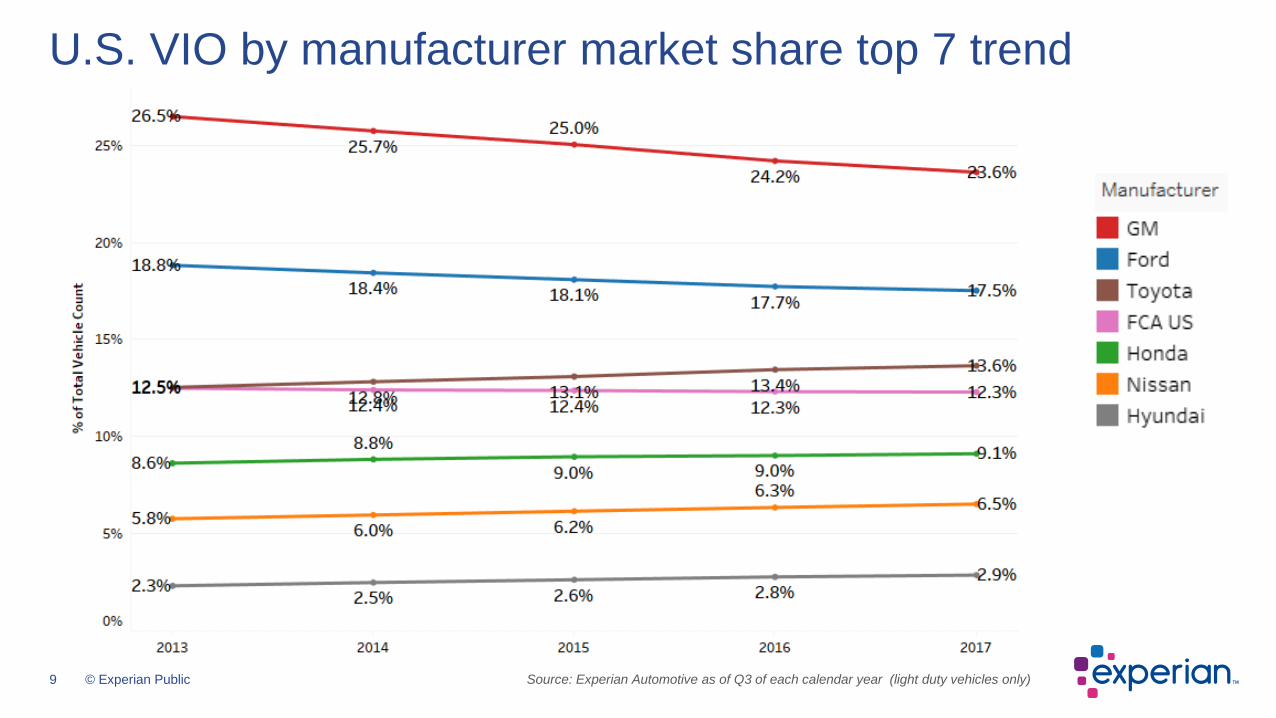
U.S. VIO by manufacturer market share top 7 trend
Source: Experian Automotive as of Q3 of each calendar year (light duty vehicles only)
Page 10
10 © Experian Public
U.S. VIO – country of assembly / brand type
Source: Experian Automotive as of September 30, 2017 (light duty vehicles only)
Page 11
11 © Experian Public
U.S. VIO – drive wheel and cylinders market shares
Source: Experian Automotive as of September 30, 2017 (light duty vehicles only)
Page 12
12 © Experian Public
• 6 to 12 model year old vehicles• Aged out of general OEM manufacturer warranties for any repairs• Likely require more part replacement & services (e.g. shocks, timing belt service, engine repairs) that
may be performed by aftermarket service shops using parts from aftermarket part manufacturers• Sizing the Sweet Spot helps identify overall market potential and changes can have implications to those
that service it
The Aftermarket “Sweet Spot”
• 13 model years old & older• Less costs may be spent to service them due to their age and vehicle value
“Post Sweet Spot” vehicles
• 5 model years old & newer; many covered by the vehicle’s manufacturer warranty• Identifies models coming into the Sweet Spot
“Pre Sweet Spot” vehicles
The aftermarket “Sweet Spot” overview“Post” and “Pre” Sweet Spot defined
Page 13
13 © Experian Public
U.S. trend of total VIO compared to sweet spot volumesVIO by model year (in millions)
31% vehicles within “Sweet Spot”
(MY2006 – 2012)Pre-Sweet
Spot
Post-SweetSpot
Source: Experian Automotive as of September 30, 2017 (light duty vehicles only)
Page 14
14 © Experian Public
U.S. Sweet Spot vehicles – domestic vs import brands
Source: Experian Automotive as of September 30, 2017 (light duty vehicles only)
Page 15
15 © Experian Public
U.S. Sweet Spot vehicles – percentage within CBSA
Source: Experian Automotive as of September 30, 2017 (light duty vehicles only)
Page 16
16 © Experian Public
Hurricane Harvey – August 25-29, 2017
Hurricane Harvey partial update
Page 17
17 © Experian Public
5 years ago - NYC/New Jersey shore areasHurricane Sandy impact area – October 29, 2012
Time Period New Used % of Avg % of Avg
Prior Registration Sales Jan - Sept 2012 average per month 77,032 107,548
Hurricane Sandy Oct 29 October 2012 52,555 75,585 68.2% 70.3%
Post Hurricane Sales November 2012 106,404 110,175 138.1% 102.4%
Post Hurricane Sales December 2012 83,940 88,734 109.0% 82.5%
Next Calendar Year Jan-Dec 2013 average per month 83,178 106,704 +8.0% -0.8%
© 2017 Experian
Page 18
18 © Experian Public
Hurricane Harvey New/Used Registrations within impact area
Time Period New Used % of Avg % of Avg
Prior Registration Sales Jan - July 2017 average per month 35,417 83,929
Hurricane Harvey August 25-29 Estimate Aug 2017 Estimate based on Sandy pct 24,154 59,002 68.2% 70.3%
Actual Sales August August 2017 New/Used sales 26,726 55,010 75.5% 65.5%
Actual Sales September September 2017 New/Used sales 52,732 87,032 148.9% 103.7%
Actual Sales October October 2017 New/Used sales 59,948 109,106 169.3% 130.0%
© 2017 Experian
Page 19
19 © Experian Public
Hurricane Harvey New/Used Registrations for impact area
Typical sales July; Lower sales August September and October sales increase
Source: Experian Automotive New/Used sales combined; light, medium and heavy duty vehicles only)
Page 20
20 © Experian Public
• Total light duty VIO continues to grow to 271 million in the U.S.
• VIO market share for GM and Ford continues to decline as older vehicles move out of operation
• Sweet Spot continues to decline, yet slowing– Central to eastern U.S. prime areas for Sweet Spot
vehicles in operation– Replacement part opportunities abound for those that
can utilize data analysis properly• Hurricane Harvey
– Harvey recovery for vehicle purchases takes months; Further analysis is expected in the next overview
– Consumers can utilize Experian’s AutoCheck vehicle history reports to help identify flooded vehicles for used vehicle purchases
Summary
Page 21
21 © Experian Public
Today’s presentation
Follow us on Twitter#EXPAuto@Experian_Auto
Connect with us on LinkedInExperian Automotive
Questions? Contact us at [email protected]
Page 22
22 © Experian Public
Thank youExperian Automotive is prepared to meet your needs with an integrated solution statically designed to drive your business forward
Page 23
©2017 Experian Information Solutions, Inc. All rights reserved. Experian and the Experian marks used herein are trademarks or registered trademarks of Experian Information Solutions, Inc. Other product and company names mentioned herein are the trademarks of their respective owners. No part of this copyrighted work may be reproduced, modified, or distributed in any form or manner without the prior written permission of Experian. Experian Public