Experience-driven dose-volume histogram maps of NTCP risk as an aidfor radiation treatment plan selection and optimization
Connor Kupchaka�
Department of Physics and Engineering, London Regional Cancer Program, London N6A 4G5, Canada andDepartment of Medical Biophysics, University of Western Ontario, London, Canada
Jerry Battista and Jake Van DykDepartment of Physics and Engineering, London Regional Cancer Program, London N6A 4G5, Canada andDepartments of Oncology and Medical Biophysics, University of Western Ontario, London, Canada
�Received 16 July 2007; revised 22 September 2007; accepted for publication 26 October 2007;published 26 December 2007�
Key words: dose-volume histogram �DVH�, normal tissue complication probability �NTCP�, dose-volume constraints, risk analysis, treatment optimization, radiation treatment planning
I. INTRODUCTION
Modern radiotherapy techniques hold the promise of reduc-ing toxicity and may permit dose escalation to improve tu-mor control. Prediction of radiation-induced complications inradiotherapy treatments using dosimetric, anatomic, andclinical variables has therefore become the major focus ofrecent studies.1–7 These studies are often based on dose-volume histograms �DVHs�, which have been used to aidtreatment plan selection since their inception. Many publica-tions have investigated the relationship between dose-volume histogram curves and the clinical occurrence of com-plications. This includes correlations between dose-volumepatterns and the incidence of various grades ofcomplication8–11 and significant volume differences in ex-posed tissues of patients.12 The conclusions drawn fromthese studies emphasized that some high dose-volume com-binations may be more risky to the patient and should betaken under consideration when judging three dimensionaldose distributions.
A more recent study13 has aimed at linking model-basedbiological response information to DVH trajectories. The
purpose was to obtain dose-volume constraint points more
333 Med. Phys. 35 „1…, January 2008 0094-2405/2008/35„
suited to heterogeneous organ irradiations by mapping theo-retical normal tissue complication probability �NTCP� valuesonto dose-volume space.14 By implementation of a randomwalk algorithm, large sets of possible integral DVH curveswere obtained and their corresponding NTCP values werecalculated using two different radiobiological models. Bio-logically based constraint points were extracted from a curveof the average DVHs relating to a specified NTCP range. Thestudy concluded that using the constraint points derived inthis manner is more applicable to modern radiation therapytreatments than the use of fixed Emami15 points which arebased on homogeneous partial organ irradiations and histori-cal clinical data.
Currently, individual NTCP values utilized in the abovework are not used for ranking competing treatment plans.This is because the accuracy and reliability of the absolutevalues16,17 produced by the models have yet to be provenclinically. The general sigmoidal response of tissue with in-creasing dose that all NTCP models abide by, however, hassome merit.1,11,18,19 Therefore, a practical extension of thepreviously mentioned methodologies is the allocation of a
NTCP range to different regions of dose-volume space and
334 Kupchak, Battista, and Van Dyk: Experience-driven DVH maps of NTCP risk 334
with statistical confidence limits. By specifying a toleranceNTCP value �e.g., 5%�, the regions of dose-volume spacecould be consistent with a risk of violating the tolerancevalue, shown as iso-percentile contours. Opportunity thenexists to evaluate the DVH curves of two competing treat-ment plans with respect to associated risk of violating theNTCP tolerance value. This is advantageous over simplycomparing individual NTCP values of each plan, since therisk maps present insight into the critical sections of theDVH curve. Information visually displayed by such mapscould directly influence plan judgment and show dose-volume regions that are highly predictive of biological re-sponse. The predictive ability of these dose-volume regionsis increased by generating risk tolerance maps unique to aspecific treatment technique of a specific tumor site.
In this paper, a method for generating experience-drivenDVH curves and NTCP risk maps to aid the selection ofDVHs with acceptable NTCP values is presented. The mapscreated in this work are specific to prostate radiotherapy, andNTCP values are assessed for the rectum. This approach wastaken because regions of risk in dose-volume space will varywith radiotherapy technique and regions of high risk willdepend upon the technique-specific DVH curve shape. Themaps are constructed with the aid of a Monte Carlo algo-rithm that generates realistic integral DVHs for the chosentreatment technique. DVHs are simulated via random walksthrough dose-volume space guided by a base set of clinicalDVHs. For this work, theoretical NTCP mapping was doneusing the rectal DVHs of 48 prostate plans treated with sim-plified intensity modulated arc therapy �SIMAT�.20,21 Thegenerated maps allow NTCP ranges to be assigned to differ-ent zones of dose-volume space with a measure of statisticalconfidence and could provide a “fuzzy” statistical alternativeto enforcing strict �binary� dose-volume constraint pointsduring treatment plan optimization as is the current practice.
II. METHOD
The single-technique approach was chosen for a numberof reasons: first, the NTCP values are calculated using radio-biological models relying on a set of tissue-specific param-eters. Second, one specific isolated region or point of a dose-volume curve will not correspond to a single NTCP value�i.e., not 1:1 mapping�. Therefore, NTCP statistical mappingwas performed using the entire DVH curve shape that isgoverned by the nature of the chosen treatment technique. Itis the shape of the DVH curve combined with the prescrip-tion dose of the treatment that dictates wherein dose-volumespace acceptable levels of NTCP values occur. Then, the re-gions with unacceptable levels could serve as biological-based constraints to abide by when selecting acceptable treat-ment plans. Note that identified high-risk regions may havedifferent spatial locations then those of physical dose-volumeconstraints often used to evaluate treatment plans usingDVHs.
The most accurate mapping method entails a very largenumber of patient-planned DVH curves of the chosen tech-
nique and treatment site. A large set of patient DVHs could
Medical Physics, Vol. 35, No. 1, January 2008
theoretically cover all DVH trajectories possible, and everyNTCP value could be represented in the calculated map. In-dividual patient-to-patient variability in anatomy wouldserve as the main driving force for all DVH curve directionsthat can occur. In most practical instances, however, thenumber of patient DVH curves available is limited and isonly a sample of all possible DVHs. To improve on thisstatistical limitation, a novel random walk algorithm wasimplemented to simulate DVH curves that might arise inpatient plans for the technique chosen. The simulated curvesevolve from the clinical experience database of 48 DVHsthat serves as a guide to the possible simulated trajectories.
Conceptually, in the random walk algorithm, a “walker”travels through dose-volume space in discrete steps con-strained by the trajectory densities of the surrounding regionswhich are derived from the finite, base set of clinical DVHsfrom past treatment plan experience. DVH number densitiesare determined by the ratio of base set DVH trajectories thatcross a given region to the total number of base set clinicalDVHs currently used in guiding the simulated DVHs. Con-straining the walker in this manner permits the typical DVHshape of the chosen treatment technique to be preserved. Aspatial randomness component was also introduced at eachof the discrete steps of the walker in order to perturb thetrajectories and generate DVHs similar to but not identical tothe base set. In summary, a data set from clinical treatmentplans establishes the most likely trajectories and this guidesthe random walk to generate a larger set of representativeDVH curves. The larger, simulated set is used to produce theNTCP risk maps.
The procedure for creating NTCP maps in DVH space issummarized as follows:
�1� Simulate multiple DVH trajectories using the MonteCarlo method.
�2� Calculate the NTCP values of all simulated DVHs.�3� Quantize dose-volume space into a set of grid points so
that a spectrum of NTCP values can be associated witheach point in DVH space. This spectrum will apply to aquadrant of points passing above right of the point ofinterest.
�4� For each simulated trajectory, mark the points located tothe bottom left of the trajectory in dose-volume space,and associate the NTCP values in the spectra of allmarked points.
�5� For all dose-volume points, calculate the percentile ofDVH trajectories with NTCP values greater than a speci-fied tolerance value �e.g., NTCP=5%�. The percentilevalue becomes the pixel value in DVH coordinate space.
�6� Display iso-percentile contours or color maps pertainingto the DVH curve trajectories passing above a dose-volume point that exceed the tolerance NTCP value.
II.A. Random walk algorithm
To perform the random walks, a discrete 2D dose-volumespace was created. For this work the grid size was chosen to
be equal in dose and volume directions at 100�100. The
335 Kupchak, Battista, and Van Dyk: Experience-driven DVH maps of NTCP risk 335
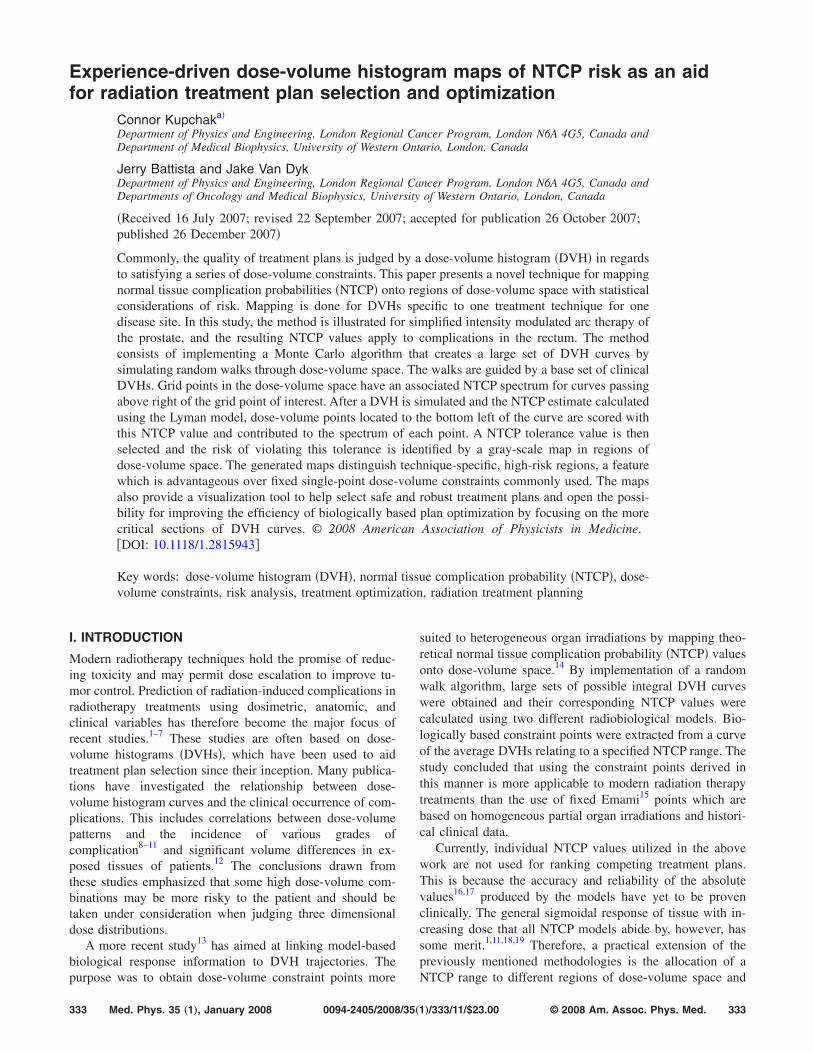
space is enclosed by relative organ volumes from 0 to 100%along the vertical axis and absolute dose values between 0cGy and just greater than the maximum dose value of thebase DVH set along the horizontal axis. The directionsstepped to by the walker are based on the number density ofbase set DVH trajectories crossing a dose-volume pixel.Therefore, to calculate the traversed number density or “traf-fic” pattern, a 2D binary matrix identifying all pixels inter-sected by a DVH trajectory was formed for each base setDVH �Fig. 1�. Summation of the binary maps for each DVHallowed the total number of curves passing through eachpixel to be counted, and normalizing the counts by the totalnumber in the base set gave the path intensity of DVH tra-jectories intersecting each pixel. Figure 2 shows all 48 baseDVHs placed onto the dose-volume grid �Fig. 2�a�� and theresultant conversion into a normalized curve density map�Fig. 2�b��.
The methodology of how a trajectory evolves was par-tially adapted from a previous study.22 A walker traversesDVH space in steps dictated by predetermined intercepts,with the number of steps needed to simulate a full trajectorydependent on the grid resolution and step size chosen. Eachstep in the trajectory of the walker is determined from theprobability distribution profile along an intercept defined at a45° angle to the dose and volume axis. Intercepts are chosenin this manner to ensure that every base DVH crosses eachintercept only once, and the curve density across the inter-cept line remains normalized to the total number of baseDVH trajectories used. Here, 4 pixels was chosen as thestepping distance between adjacent intercepts. The step sizesand grid resolution influence the extent of deviation of thesimulated trajectories from the base line set.
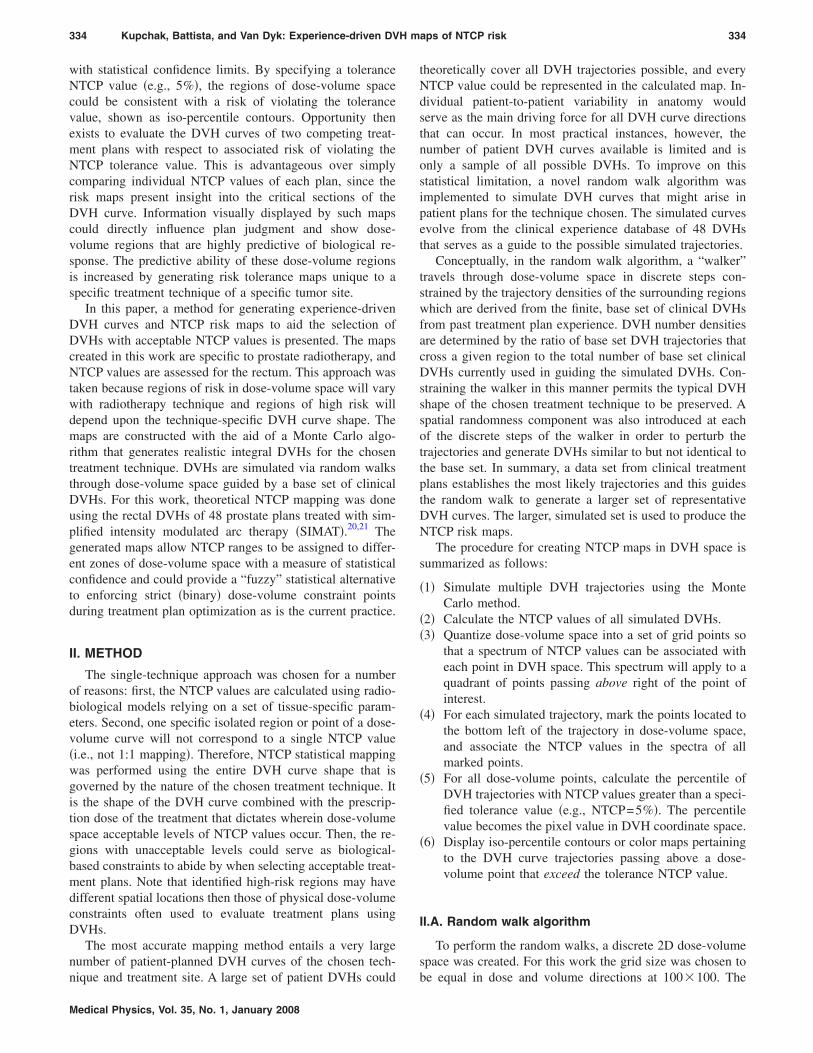
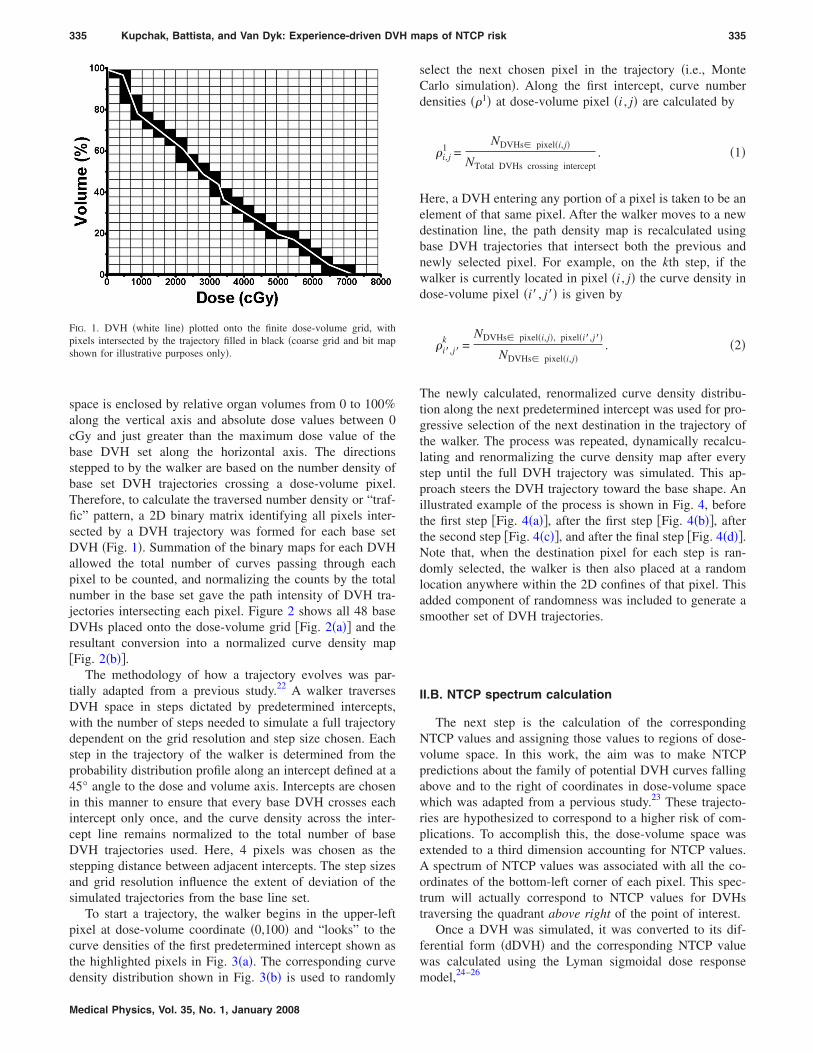
To start a trajectory, the walker begins in the upper-leftpixel at dose-volume coordinate �0,100� and “looks” to thecurve densities of the first predetermined intercept shown asthe highlighted pixels in Fig. 3�a�. The corresponding curve
FIG. 1. DVH �white line� plotted onto the finite dose-volume grid, withpixels intersected by the trajectory filled in black �coarse grid and bit mapshown for illustrative purposes only�.
density distribution shown in Fig. 3�b� is used to randomly
Medical Physics, Vol. 35, No. 1, January 2008
select the next chosen pixel in the trajectory �i.e., MonteCarlo simulation�. Along the first intercept, curve numberdensities ��1� at dose-volume pixel �i , j� are calculated by
�i,j1 =
NDVHs� pixel�i,j�
NTotal DVHs crossing intercept. �1�
Here, a DVH entering any portion of a pixel is taken to be anelement of that same pixel. After the walker moves to a newdestination line, the path density map is recalculated usingbase DVH trajectories that intersect both the previous andnewly selected pixel. For example, on the kth step, if thewalker is currently located in pixel �i , j� the curve density indose-volume pixel �i� , j�� is given by
�i�,j�k =
NDVHs� pixel�i,j�, pixel�i�,j��
NDVHs� pixel�i,j�. �2�
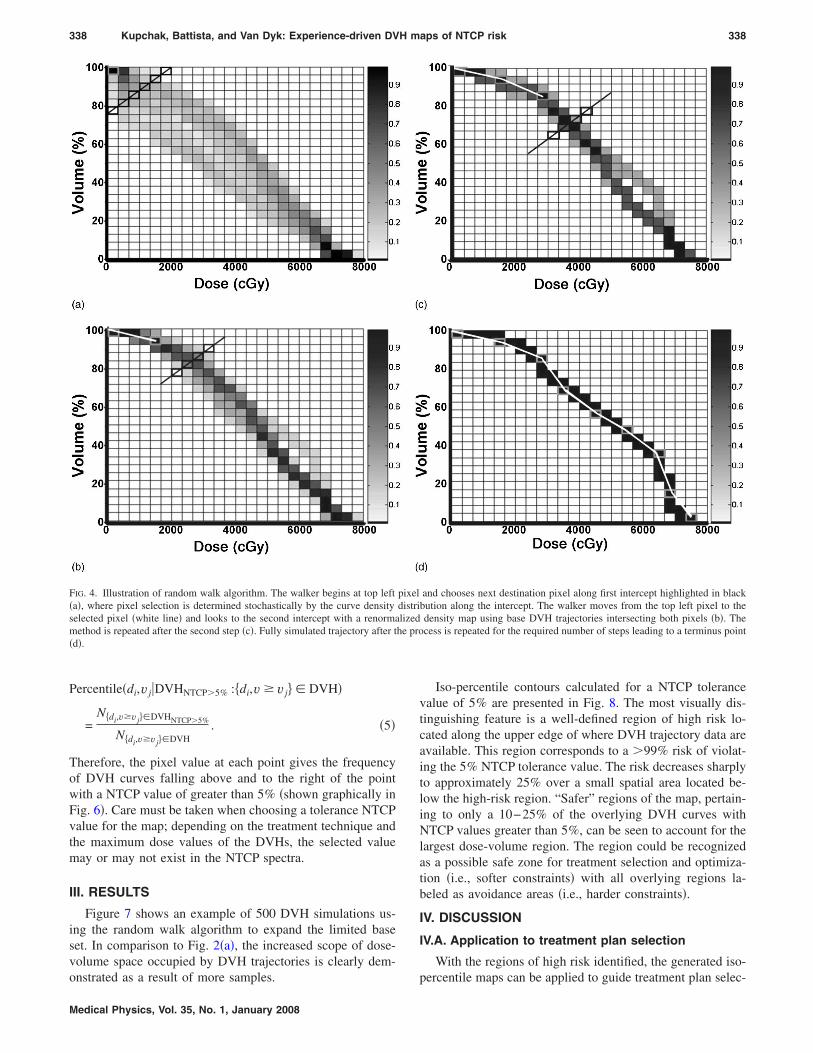
The newly calculated, renormalized curve density distribu-tion along the next predetermined intercept was used for pro-gressive selection of the next destination in the trajectory ofthe walker. The process was repeated, dynamically recalcu-lating and renormalizing the curve density map after everystep until the full DVH trajectory was simulated. This ap-proach steers the DVH trajectory toward the base shape. Anillustrated example of the process is shown in Fig. 4, beforethe first step �Fig. 4�a��, after the first step �Fig. 4�b��, afterthe second step �Fig. 4�c��, and after the final step �Fig. 4�d��.Note that, when the destination pixel for each step is ran-domly selected, the walker is then also placed at a randomlocation anywhere within the 2D confines of that pixel. Thisadded component of randomness was included to generate asmoother set of DVH trajectories.
II.B. NTCP spectrum calculation
The next step is the calculation of the correspondingNTCP values and assigning those values to regions of dose-volume space. In this work, the aim was to make NTCPpredictions about the family of potential DVH curves fallingabove and to the right of coordinates in dose-volume spacewhich was adapted from a pervious study.23 These trajecto-ries are hypothesized to correspond to a higher risk of com-plications. To accomplish this, the dose-volume space wasextended to a third dimension accounting for NTCP values.A spectrum of NTCP values was associated with all the co-ordinates of the bottom-left corner of each pixel. This spec-trum will actually correspond to NTCP values for DVHstraversing the quadrant above right of the point of interest.
Once a DVH was simulated, it was converted to its dif-ferential form �dDVH� and the corresponding NTCP valuewas calculated using the Lyman sigmoidal dose response
24–26
model,
336 Kupchak, Battista, and Van Dyk: Experience-driven DVH maps of NTCP risk 336
NTCP = ��EUD � GMD − D50
mD50
�= ����
ividi
1/n�n− D50
mD50
� , �3�
where � is the probit function,
��x� =1
2�
−�
x
exp�− t2
2�dt . �4�
The equivalent uniform dose �EUD� parameter or general-ized mean dose �GMD� is derived from tissue response to
27
radiation. It is the dose that when delivered homogeneously
Medical Physics, Vol. 35, No. 1, January 2008
to an organ produces the same biological effect as a hetero-geneous dose distribution. Here, the variables vi and di rep-resent relative volume and absolute dose values, respectively,and the summation i is over all dose bins of the differentialDVH. The normal tissue-specific parameters D50, m, and nrelate the response of the tissue with dose. The parametervalues used for the rectum were D50 of 80 Gy, n of 0.12, andm of 0.15, and these were adapted from Burman et al.24 A 2Dbit map was generated to identify points falling below and tothe left of the simulated DVH trajectory, similar in fashion towhat was done for the base DVHs. DVH trajectories weresimulated multiple �5�103� times and the NTCP valueswere tabulated as the spectra for all identified points in the
FIG. 2. �a� Clinical prostate SIMATexperience treatment DVHs plottedonto the dose-volume grid �48 cases�.�b� The traffic density map was calcu-lated by counting the number ofcurves crossing each pixel and nor-malizing to the total. Darker regionsrepresent a greater number of DVHtrajectories crossing the pixels �i.e.,higher traffic or well-trodden path�.
binary map. The final result was NTCP spectra representative
337 Kupchak, Battista, and Van Dyk: Experience-driven DVH maps of NTCP risk 337
of DVHs passing above and to the right of the associatedpoints. The methodology of how a NTCP spectrum was gen-erated for an arbitrary dose-volume point �di ,vi� is shown inFig. 5.
II.C. Iso-percentile maps
NTCP spectra at each point were used to calculate aniso-percentile map to characterize statistical NTCP predic-tions based on a DVH trajectory. A user-defined toleranceNTCPt value is first chosen for the maps. Since it is commonpractice in radiation therapy to aim for a NTCP value of lessthan 5%, 5% was the exemplary value used in this study.Due to the nature of the SIMAT plans used as the base DVHset, the NTCP values were typically 1%. Therefore, in order
to illustrate the methodology, absolute dose prescription val-
Medical Physics, Vol. 35, No. 1, January 2008
ues of the DVHs were all boosted by approximately 13% toyield NTCP values of 5% �note: patients were not treated tothis dose level�.
The spectrum associated with each dose-volume pointwas normalized to unity and converted to a cumulative dis-tribution function then interpolated to find the percentile cor-responding to NTCP=0.05. The interpolated value sub-tracted from unity then determined the percentile of DVHcurves with NTCP values �5%. Performing this calculationfor every dose-volume point effectively collapsed the dose-volume map �d, v, NTCP� into a two-dimensional visual dis-play �d, v, percentile�. Mathematically, the percentile of tra-jectories falling above a given dose volume point �di ,v j�with an associated NTCP �5% is determined by the follow-
FIG. 3. �a� Using the normalized curvedensity map, the first step in the ran-dom walk algorithm is to one of thesix destination pixels along the inter-cept line highlighted in black. �b� Thecorresponding normalized curve den-sities for the six pixels along the firstline intercept shown in �a�.
ing:
338 Kupchak, Battista, and Van Dyk: Experience-driven DVH maps of NTCP risk 338
Percentile�di,v j�DVHNTCP�5%�:�di,v � v j � DVH�
=N�di,v�vj �DVHNTCP�5%
N�di,v�vj �DVH. �5�
Therefore, the pixel value at each point gives the frequencyof DVH curves falling above and to the right of the pointwith a NTCP value of greater than 5% �shown graphically inFig. 6�. Care must be taken when choosing a tolerance NTCPvalue for the map; depending on the treatment technique andthe maximum dose values of the DVHs, the selected valuemay or may not exist in the NTCP spectra.
III. RESULTS
Figure 7 shows an example of 500 DVH simulations us-ing the random walk algorithm to expand the limited baseset. In comparison to Fig. 2�a�, the increased scope of dose-volume space occupied by DVH trajectories is clearly dem-
FIG. 4. Illustration of random walk algorithm. The walker begins at top left�a�, where pixel selection is determined stochastically by the curve densityselected pixel �white line� and looks to the second intercept with a renormamethod is repeated after the second step �c�. Fully simulated trajectory after t�d�.
onstrated as a result of more samples.
Medical Physics, Vol. 35, No. 1, January 2008
Iso-percentile contours calculated for a NTCP tolerancevalue of 5% are presented in Fig. 8. The most visually dis-tinguishing feature is a well-defined region of high risk lo-cated along the upper edge of where DVH trajectory data areavailable. This region corresponds to a �99% risk of violat-ing the 5% NTCP tolerance value. The risk decreases sharplyto approximately 25% over a small spatial area located be-low the high-risk region. “Safer” regions of the map, pertain-ing to only a 10−25% of the overlying DVH curves withNTCP values greater than 5%, can be seen to account for thelargest dose-volume region. The region could be recognizedas a possible safe zone for treatment selection and optimiza-tion �i.e., softer constraints� with all overlying regions la-beled as avoidance areas �i.e., harder constraints�.
IV. DISCUSSION
IV.A. Application to treatment plan selection
With the regions of high risk identified, the generated iso-
and chooses next destination pixel along first intercept highlighted in blackbution along the intercept. The walker moves from the top left pixel to thedensity map using base DVH trajectories intersecting both pixels �b�. Thecess is repeated for the required number of steps leading to a terminus point
pixeldistrilized
he pro
percentile maps can be applied to guide treatment plan selec-
339 Kupchak, Battista, and Van Dyk: Experience-driven DVH maps of NTCP risk 339
tion. This newly created planning tool could present advan-tages over current DVH judgment routines having rigidphysical dose-volume point constraints. Physical constraintpoints established by Emami et al.15 or protocols outlined bythe Radiation Therapy Oncology Group �RTOG� are fixed,infinitesimal points in dose-volume space offering limitedoverall decision guidance for DVH curve shapes. The mapspresented here aid decisions through the extension frompoints to zones highlighting risk in dose-volume space.Therefore, in applying the maps to plan selection, a clearchoice would be the DVH curve not traversing any of thehigh-risk regions consistent with any high likelihood of vio-lating the 5% NTCP tolerance value.
An interesting comparison is the information presented byiso-percentile maps versus the constraint points used in theRTOG protocol P-0126 for dose escalated prostatetreatments.28,29 However, these constraint points were deter-mined for biological effects consistent with prescriptions of79.2 Gy delivered over 44 fractions and 70.2 Gy deliveredover 39 fractions. To make the points relevant to the frac-tionation scheme and prescription utilized in SIMAT, theRTOG points were adjusted to an equivalent biologically ef-fective dose �assuming � /=3 Gy for the rectum� based ona 20-fraction treatment used at this center. Recognizing that a13% increase in dose scaling was applied to the base set of
SIMAT plans, observe that regions corresponding to a high
Medical Physics, Vol. 35, No. 1, January 2008
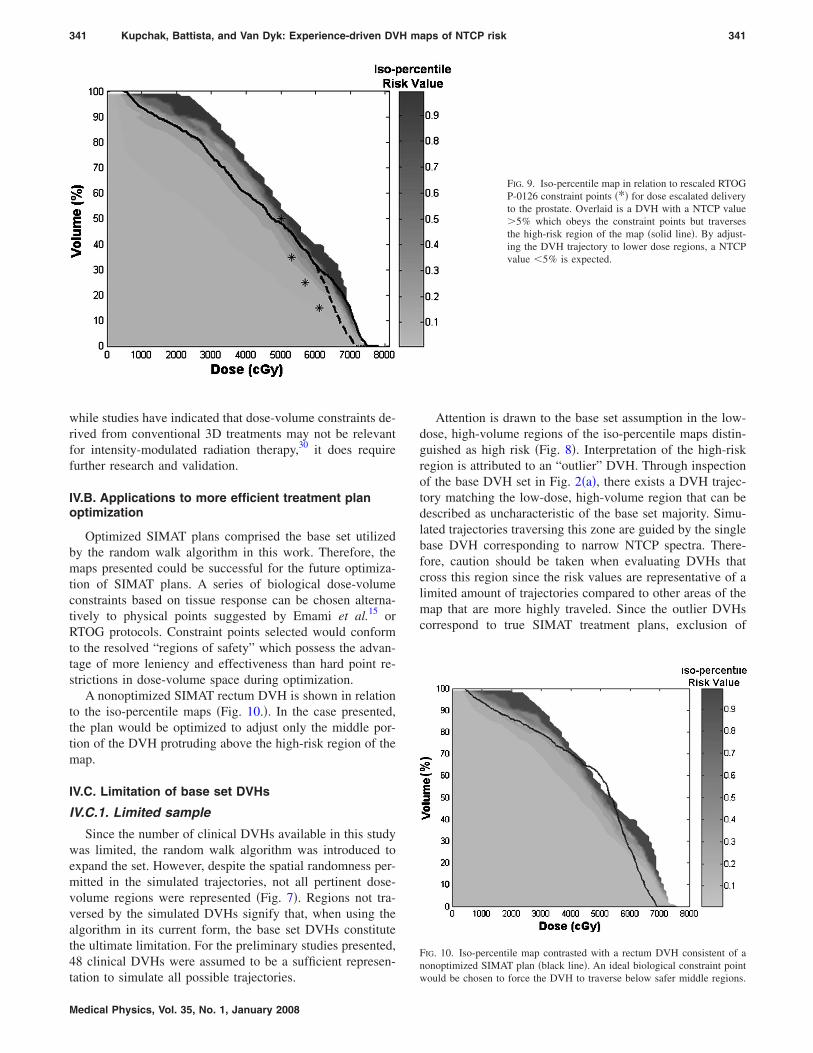
risk of violating the NTCPt=5% tolerance value exist in themap mostly in the regions of higher dose-volume combina-tions than the modified constraint points �Fig. 9�. Thus, withthe exception of the constraint point at v=50% located nearthe region of high risk, the modified RTOG constraint pointslie away from the identified high-risk regions characteristicof SIMAT. However, achieving a desired individual NTCPvalue of less than 5% is consistent when the modified RTOGconstraint points are enforced.
An example of the benefit provided only by the risk in-formation available in the maps is highlighted in Fig. 9,where a DVH violates three of the four modified RTOGpoints while concurrently crossing the high-risk region of theiso-percentile map. Upon further investigation, the individualNTCP value of the DVH is 5.8%. By adjustment of the DVHtrajectory to regions of reduced risk but still in violation ofthe same three modified RTOG constraints, the consequentNTCP value decreases to 3.5%.
These findings suggest evidence that, depending on thetreatment goals, the effectiveness of constraint points used inthe planning process may depend on the technique underconsideration. In the example shown, the physical constraintpoints may be too conservative. For that reason a universalset of constraint points valid for all prostate treatments �as isthe current practice� may not be feasible. Specialization to
FIG. 5. �a� Simulated DVH with corresponding NTCPvalue calculated, 3% for example. �b� Dose-volumepoints below and to the left of the DVH are identified,shown by the bit map region colored in gray, includingthe point �di ,v j�. �c� Calculated NTCP value �3%� iscounted in the spectrum associated with the dose-volume point �di ,v j� for this DVH trajectory. �d� Aftermultiple DVH trajectory simulations, the point �di ,v j�will develop a full spectrum of NTCP values �e�. �f�The spectrum represents the NTCP values of any DVHtrajectory that traverses the gray quadrant to the top-right of point �di ,v j�.
the treatment technique may be necessary. Furthermore,
340 Kupchak, Battista, and Van Dyk: Experience-driven DVH maps of NTCP risk 340
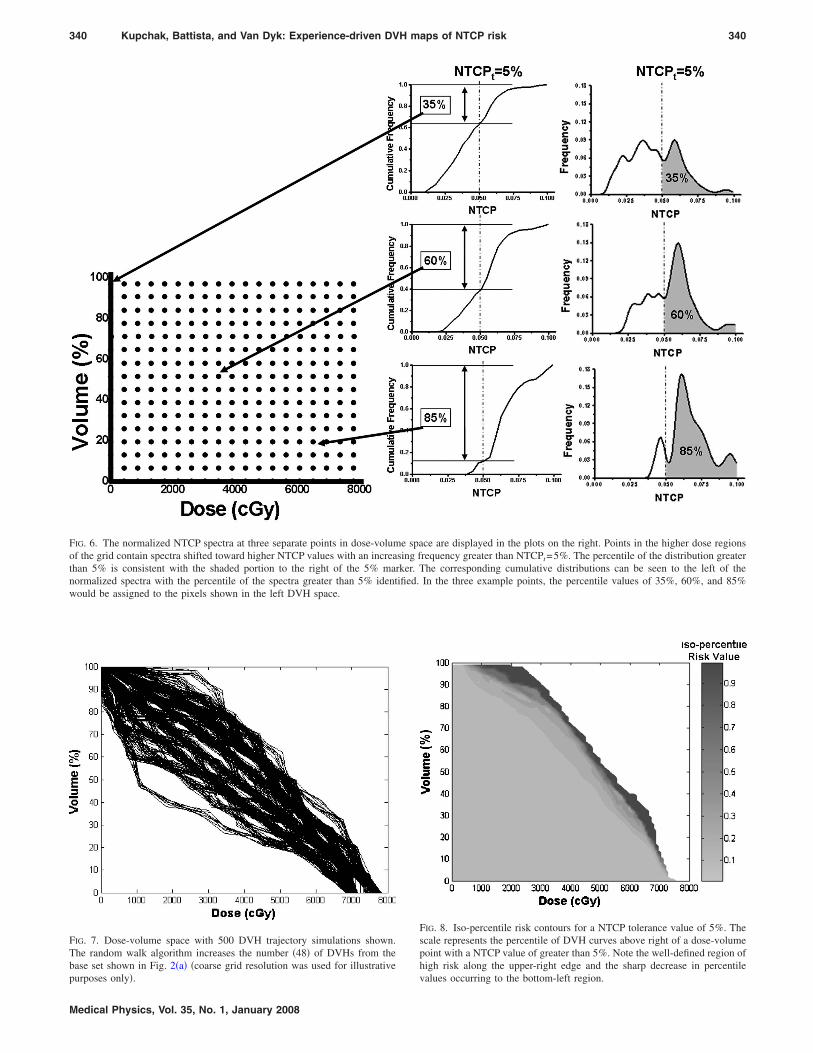
FIG. 6. The normalized NTCP spectra at three separate points in dose-volume space are displayed in the plots on the right. Points in the higher dose regionsof the grid contain spectra shifted toward higher NTCP values with an increasing frequency greater than NTCPt=5%. The percentile of the distribution greaterthan 5% is consistent with the shaded portion to the right of the 5% marker. The corresponding cumulative distributions can be seen to the left of thenormalized spectra with the percentile of the spectra greater than 5% identified. In the three example points, the percentile values of 35%, 60%, and 85%
would be assigned to the pixels shown in the left DVH space.
FIG. 7. Dose-volume space with 500 DVH trajectory simulations shown.The random walk algorithm increases the number �48� of DVHs from thebase set shown in Fig. 2�a� �coarse grid resolution was used for illustrative
purposes only�.
Medical Physics, Vol. 35, No. 1, January 2008
FIG. 8. Iso-percentile risk contours for a NTCP tolerance value of 5%. Thescale represents the percentile of DVH curves above right of a dose-volumepoint with a NTCP value of greater than 5%. Note the well-defined region ofhigh risk along the upper-right edge and the sharp decrease in percentile
values occurring to the bottom-left region.
341 Kupchak, Battista, and Van Dyk: Experience-driven DVH maps of NTCP risk 341
while studies have indicated that dose-volume constraints de-rived from conventional 3D treatments may not be relevantfor intensity-modulated radiation therapy,30 it does requirefurther research and validation.
IV.B. Applications to more efficient treatment planoptimization
Optimized SIMAT plans comprised the base set utilizedby the random walk algorithm in this work. Therefore, themaps presented could be successful for the future optimiza-tion of SIMAT plans. A series of biological dose-volumeconstraints based on tissue response can be chosen alterna-tively to physical points suggested by Emami et al.15 orRTOG protocols. Constraint points selected would conformto the resolved “regions of safety” which possess the advan-tage of more leniency and effectiveness than hard point re-strictions in dose-volume space during optimization.
A nonoptimized SIMAT rectum DVH is shown in relationto the iso-percentile maps �Fig. 10.�. In the case presented,the plan would be optimized to adjust only the middle por-tion of the DVH protruding above the high-risk region of themap.
IV.C. Limitation of base set DVHs
IV.C.1. Limited sample
Since the number of clinical DVHs available in this studywas limited, the random walk algorithm was introduced toexpand the set. However, despite the spatial randomness per-mitted in the simulated trajectories, not all pertinent dose-volume regions were represented �Fig. 7�. Regions not tra-versed by the simulated DVHs signify that, when using thealgorithm in its current form, the base set DVHs constitutethe ultimate limitation. For the preliminary studies presented,48 clinical DVHs were assumed to be a sufficient represen-
tation to simulate all possible trajectories.
Medical Physics, Vol. 35, No. 1, January 2008
Attention is drawn to the base set assumption in the low-dose, high-volume regions of the iso-percentile maps distin-guished as high risk �Fig. 8�. Interpretation of the high-riskregion is attributed to an “outlier” DVH. Through inspectionof the base DVH set in Fig. 2�a�, there exists a DVH trajec-tory matching the low-dose, high-volume region that can bedescribed as uncharacteristic of the base set majority. Simu-lated trajectories traversing this zone are guided by the singlebase DVH corresponding to narrow NTCP spectra. There-fore, caution should be taken when evaluating DVHs thatcross this region since the risk values are representative of alimited amount of trajectories compared to other areas of themap that are more highly traveled. Since the outlier DVHscorrespond to true SIMAT treatment plans, exclusion of
FIG. 9. Iso-percentile map in relation to rescaled RTOGP-0126 constraint points �*� for dose escalated deliveryto the prostate. Overlaid is a DVH with a NTCP value�5% which obeys the constraint points but traversesthe high-risk region of the map �solid line�. By adjust-ing the DVH trajectory to lower dose regions, a NTCPvalue 5% is expected.
FIG. 10. Iso-percentile map contrasted with a rectum DVH consistent of anonoptimized SIMAT plan �black line�. An ideal biological constraint point
would be chosen to force the DVH to traverse below safer middle regions.
342 Kupchak, Battista, and Van Dyk: Experience-driven DVH maps of NTCP risk 342
those plans from the base DVH set is unjustified. The moreoften navigated high-dose sections of the map that identifyrisk would therefore serve as a more reliable indicator.11–13
Outlier DVH trajectories and their relation to NTCP distri-butions can be a source of misrepresentation of the “average”generated map, which presents an issue for further investiga-tion.
IV.C.2. Dose escalation
To obtain NTCP distributions of interest, with approxi-mately 10% of all simulated DVHs corresponding to NTCPvalues greater than 5%, the base DVHs used to generate themap were scaled by 13%. In doing so, the maximum doserange of the SIMAT rectum DVHs was no longer represen-tative of what was employed clinically. The maximum dosevalues experienced during the simulated trajectories influ-ence the NTCP spectra constructed at all points in dose-volume space, and therefore render the generated maps spe-cialized to the case at hand. Clinically, for the predictionsabout a DVH to be applicable, the maximum dose of theDVH evaluated should correspond to the range used for gen-eration of the iso-percentile maps. In other words, the DVHsjudged for treatment selection must belong to the same classof DVHs that was used in generating the map. Similar ob-servations and cautions have been reported in the literaturepreviously.13
V. CONCLUSIONS
The work presented here is a novel method for the map-ping of model-based NTCP values onto dose-volume spaceto identify regions of high risk which violate a NTCP toler-ance value. In conjunction, the maps create a visual tool toguide the selection of acceptable treatment plans. The iso-percentile maps are experience-driven by previous clinicalDVHs and pertain to complications in one organ for a chosentreatment technique and tumor site. Complication probabili-ties are mapped by this approach to preserve the generalizedshape of DVH trajectories representative of the treatmenttechnique. This visual tool has shown potential advantagesover discrete, physical dose-volume constraint points by rec-ognizing continuous zones of “risk” and “safety” representa-tive of model-based complication response values.
Predictions generated by the maps are greatly dependenton the base set of DVHs used to guide the underlying ran-dom walk algorithm and therefore constitute the major limi-tation. One must be cautious when analyzing the maps tospecify between high-risk regions characterized by an outlierand regions resolved by a large family of DVH possibilities.A larger representation of base DVHs is therefore needed forthis methodology to fully resolve all possible areas of risk indose-volume space.
ACKNOWLEDGMENTS
This work is supported by a grant from the Canadian In-stitute of Health Research and the Canadian Institute of
Health Research-Strategic Training Program. The authors
Medical Physics, Vol. 35, No. 1, January 2008
would like to thank Dr. Glenn Bauman and Dr. Eugene Wongfor the insightful discussions related to this work.
a�Electronic mail: [email protected]. D. Yorke, A. Jackson, K. E. Rosenzweig, L. Braban, S. A. Leibel, andC. C. Ling, “Correlation of dosimetric factors and radiation pneumonitisfor non-small-cell lung cancer patients in a recently completed dose es-calation study,” Int. J. Radiat. Oncol. Biol. Phys. 63, 672–682 �2005�.
2M. W. Skwarchuk, A. Jackson, M. J. Zelefsky, E. S. Venkatraman, D. M.Cowen, S. Levegrun, C. M. Burman, Z. Fuks, S. A. Leibel, and C. C.Ling, “Late rectal toxicity after conformal radiotherapy of prostate cancer�I�: Multivariate analysis and dose-response,” Int. J. Radiat. Oncol. Biol.Phys. 47, 103–113 �2000�.
3N. El Naqa, I. G. Suneja, P. E. Lindsay, A. J. Hope, J. R. Alaly, M. Vicic,J. D. Bradley, A. Apte, and J. O. Deasy, “Dose response explorer: Anintegrated open-source tool for exploring and modelling radiotherapydose-volume outcome relationships,” Phys. Med. Biol. 51, 5719–5735�2006�.
4N. El Naqa, I. J. Bradley, A. I. Blanco, P. E. Lindsay, M. Vicic, A. Hope,and J. O. Deasy, “Multivariable modeling of radiotherapy outcomes, in-cluding dose-volume and clinical factors,” Int. J. Radiat. Oncol. Biol.Phys. 64, 1275–1286 �2006�.
5O. Gayou, D. S. Parda, and M. Miften, “EUCLID: An outcome analysistool for high-dimensional clinical studies,” Phys. Med. Biol. 52, 1705–1719 �2007�.
6B. Sanchez-Nieto and A. E. Nahum, “BIOPLAN: Software for the bio-logical evaluation of radiotherapy treatment plans,” Med. Dosim. 25,71–76 �2000�.
7B. Warkentin, P. Stavrev, N. Stavreva, C. Field, and B. G. Fallone, “ATCP-NTCP estimation module using DVHs and known radiobiologicalmodels and parameter sets,” J. Appl. Clin. Med. Phys. 5, 50–63 �2004�.
8L. J. Boersma, B. M. van den, A. M. Bruce, T. Shouman, L. Gras, A. TeVelde, and J. V. Lebesque, “Estimation of the incidence of late bladderand rectum complications after high-dose �70-78 GY� conformal radio-therapy for prostate cancer, using dose-volume histograms,” Int. J. Radiat.Oncol. Biol. Phys. 41, 83–92 �1998�.
9J. D. Fenwick, V. S. Khoo, A. E. Nahum, B. Sanchez-Nieto, and D. P.Dearnaley, “Correlations between dose-surface histograms and the inci-dence of long-term rectal bleeding following conformal or conventionalradiotherapy treatment of prostate cancer,” Int. J. Radiat. Oncol. Biol.Phys. 49, 473–480 �2001�.
10C. Fiorino, C. Cozzarini, V. Vavassori, G. Sanguineti, C. Bianchi, G. M.Cattaneo, F. Foppiano, A. Magli, and A. Piazzolla, “Relationships be-tween DVHs and late rectal bleeding after radiotherapy for prostate can-cer: Analysis of a large group of patients pooled from three institutions,”Radiother. Oncol. 64, 1–12 �2002�.
11A. C. Hartford, A. Niemierko, J. A. Adams, M. M. Urie, and W. U.Shipley, “Conformal irradiation of the prostate: Estimating long-term rec-tal bleeding risk using dose-volume histograms,” Int. J. Radiat. Oncol.Biol. Phys. 36, 721–730 �1996�.
12A. Jackson, M. W. Skwarchuk, M. J. Zelefsky, D. M. Cowen, E. S.Venkatraman, S. Levegrun, C. M. Burman, G. J. Kutcher, Z. Fuks, S. A.Liebel, and C. C. Ling, “Late rectal bleeding after conformal radiotherapyof prostate cancer. II. Volume effects and dose-volume histograms,” Int. J.Radiat. Oncol. Biol. Phys. 49, 685–698 �2001�.
13C. Schinkel, P. Stavrev, N. Stavreva, and B. G. Fallone, “A theoreticalapproach to the problem of dose-volume constraint estimation and theirimpact on the dose-volume histogram selection,” Med. Phys. 33, 3444–3459 �2006�.
14P. Stavrev, N. Stavreva, D. Hristov, and B. G. Fallone, “Reverse mappingof normal tissue complication probabilities onto dose volume histogramspace: Problem formulation, illustration, and implications,” presented atthe Proceedings of World Congress on Medical Physics and BiomedicalEngineering, Sydney, Australia, 24–29 August �2003�.
15B. Emami, J. Lyman, A. Brown, L. Coia, M. Goitein, J. E. Munzenrider,B. Shank, L. J. Solin, and M. Wesson, “Tolerance of normal tissue totherapeutic irradiation,” Int. J. Radiat. Oncol. Biol. Phys. 21, 109–122�1991�.
16V. Moiseenko, J. Battista, and J. Van Dyk, “Normal tissue complicationprobabilities: dependence on choice of biological model and dose-volumehistogram reduction scheme,” Int. J. Radiat. Oncol. Biol. Phys. 46, 983–
343 Kupchak, Battista, and Van Dyk: Experience-driven DVH maps of NTCP risk 343
17T. E. Schultheiss, “The controversies and pitfalls in modeling normaltissue radiation injury/damage,” Semin. Radiat. Oncol. 11, 210–214�2001�.
18L. A. Dawson, D. Normolle, J. M. Balter, C. J. McGinn, T. S. Lawrence,and R. K. Ten Haken, “Analysis of radiation-induced liver disease usingthe Lyman NTCP model,” Int. J. Radiat. Oncol. Biol. Phys. 53, 810–821�2002�.
19Y. Lu, P. Y. Song, S. D. Li, D. R. Spelbring, S. Vijayakumar, D. J. Haraf,and G. T. Chen, “A method of analyzing rectal surface area irradiated andrectal complications in prostate conformal radiotherapy,” Int. J. Radiat.Oncol. Biol. Phys. 33, 1121–1125 �1995�.
20G. Bauman, E. Gete, J. Z. Chen, and E. Wong, “Simplified intensity-modulated arc therapy for dose escalated prostate cancer radiotherapy,”Med. Dosim. 29, 18–25 �2004�.
21E. Wong, J. Z. Chen, and J. Greenland, “Intensity-modulated arc therapysimplified,” Int. J. Radiat. Oncol. Biol. Phys. 53, 222–235 �2002�.
22K. Markov, C. Schinkel, N. Stavreva, P. Stavrev, M. Weldon, and B. G.Fallone, “Reverse mapping of normal tissue complication probabilitiesonto dose volume histogram space: The problem of randomness of thedose volume histogram sampling,” Med. Phys. 33, 3435–3443 �2006�.
23A. Jackson, E. D. Yorke, and K. E. Rosenzweig, “The atlas of complica-tion incidence: A proposal for a new standard for reporting the results ofradiotherapy protocols,” Semin. Radiat. Oncol. 16, 260–268 �2006�.
24C. Burman, G. J. Kutcher, B. Emami, and M. Goitein, “Fitting of normal
Medical Physics, Vol. 35, No. 1, January 2008
tissue tolerance data to an analytic function,” Int. J. Radiat. Oncol. Biol.Phys. 21, 123–135 �1991�.
25G. J. Kutcher, C. Burman, L. Brewster, M. Goitein, and R. Mohan, “His-togram reduction method for calculating complication probabilities forthree-dimensional treatment planning evaluations,” Int. J. Radiat. Oncol.Biol. Phys. 21, 137–146 �1991�.
26J. T. Lyman and A. B. Wolbarst, “Optimization of radiation therapy. IV. Adose-volume histogram reduction algorithm,” Int. J. Radiat. Oncol. Biol.Phys. 17, 433–436 �1989�.
28J. Michalski et al., “RTOG P-0126: A phase III randomized study ofhigh-dose 3D-CRT/IMRT versus standard dose 3d-CRT/IMRT in patientstreated for localized prostate cancer,” Radiation Therapy OncologyGroup.
29W. Y. Song, E. Wong, G. S. Bauman, J. J. Battista, and J. Van Dyk,“Dosimetric evaluation of daily rigid and nonrigid geometric correctionstrategies during on-line image-guided radiation therapy �IGRT� of pros-tate cancer,” Med. Phys. 34, 352–365 �2007�.
30V. Moiseenko, J. O. Deasy, and J. Van Dyk, “Radiobiological Modelingfor Treatment Planning,” in The Modern Technology of Radiation Oncol-ogy: A Compendium for Medical Physicists and Radiation Oncologists,edited by J. Van Dyk �Medical Physics Publishing, Madison, 2005�, Vol.2, pp. 185–220.