50
EXPERIENCE THE WORLD’S LEADING RISK AND DECISION ANALYSIS SOFTWARE AND SOLUTIONS
| Date post: | 03-Jan-2017 |
| Category: |
Documents |
| Upload: | truongphuc |
| View: | 216 times |
| Download: | 0 times |
pa
lis
ad
e.c
om
E x p E r i E n c E t h E
W o r l d ’s l E ad i n g
r i s k a n d d E c i s i o n
a n a lys i s s o f t Wa r E
a n d so l u t i o n sPalisade Corporation [email protected]
tel: +1 607 277 8000 800 432 RISK fax: + 1 607 277 8001
Palisade Europe [email protected]
tel: +44 1895 425050 fax: +44 1895 425051 UK: 0800 783 5398 France: 0800 90 80 32 Germany: 0800 181 7449 Spain: 900 93 8916
Palisade Asia-Pacific [email protected]
tel: +61 2 9929 9799 1 800 177 101 fax: +61 2 9954 3882
Palisade Latinoamérica www.palisade-lta.com
[email protected] tel: +1 607 277 8000 fax: + 1 607 277 8001
Palisade Brazil www.palisade-br.com
[email protected] tel: +1 607 277 8000 fax: + 1 607 277 8001
palisade.com
ex
pe
rie
nc
e t
he
Wo
rl
d’s
le
ad
ing
ris
k a
nd
de
cis
ion
an
aly
sis
so
ft
Wa
re

Table of ConTenTs
our Mission 2 – 3
100% excel 4
applications of @RIsK & the DecisionTools suite 5
Palisade software 7 – 37
The DecisionTools Suite 7 – 33
@RISK 13 – 20
PrecisionTree 21 – 23
TopRank 24 – 25
NeuralTools 26 – 27
StatTools 28 – 29
Evolver 30 – 31
RISKOptimizer 32 – 33
@RISK for Project 34 – 35
@RIsK for six sigma 36 – 37
Palisade services 38 – 45
Palisade Training 38 – 39
Conferences and events 40 – 41
business Consulting 42 – 43
Custom Development 44 – 45
Palisade academic software 46 – 47
Maintenance Plans 48
licensing options 48

ouR MIssIonouR MIssIon
Palisade CorporationPalisade Corporation is committed to developing the world’s most robust, innovative, and comprehensive software and solutions for risk analysis and decision making.
2
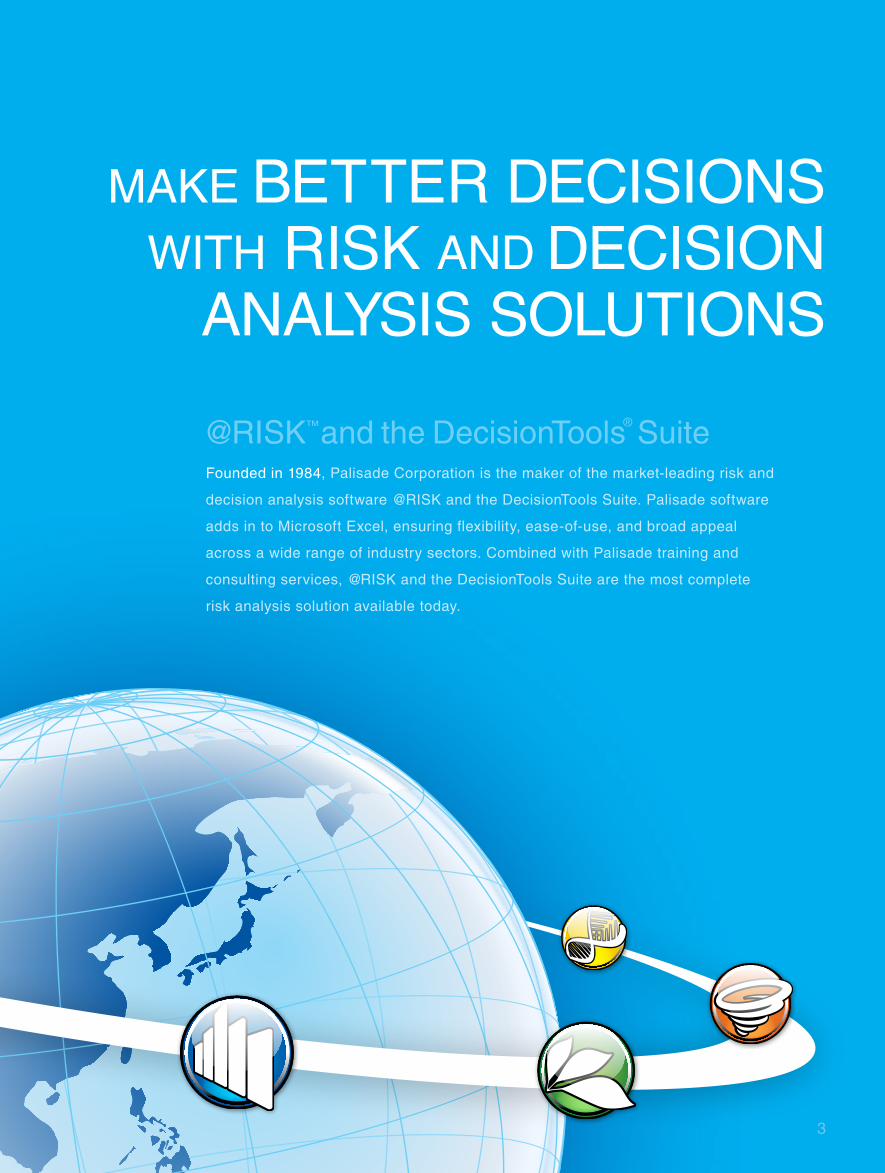
MaKe beTTeR DeCIsIons wITh RIsK anD DeCIsIon
analysIs soluTIons
@RIsK™ and the DecisionTools® suitefounded in 1984, Palisade Corporation is the maker of the market-leading risk and
decision analysis software @RIsK and the DecisionTools suite. Palisade software
adds in to Microsoft excel, ensuring flexibility, ease-of-use, and broad appeal
across a wide range of industry sectors. Combined with Palisade training and
consulting services, @RIsK and the DecisionTools suite are the most complete
risk analysis solution available today.
3

100% exCel InTegRaTIon@RIsK and the DecisionTools suite integrate completely with your spreadsheet. browse, define, analyze—while never leaving excel.
4
Palisade software adds new functions to excel that behave exactly as
native excel functions behave. windows are all linked directly to
cells in your spreadsheet, so changes in one place are carried
out in the other. graphs point to their cells via callout
windows and pop-up as you browse through your
spreadsheet. Drag-and-drop simplicity, context
sensitive right-click menus and user-friendly
toolbars make learning and navigating
Palisade software an intuitive and
straightforward process.
@RIsK and DecisionTools suite
calculations are performed 100%
within excel, supported by Palisade
sampling and statistics proven in
over twenty years of use. Palisade
does not attempt to rewrite excel in
an external recalculator to gain
speed. a single recalculation from
an unsupported or poorly reproduced
macro or function can dramatically change
your results. where will it occur, and when?
In addition, Palisade harnesses the power
of multiple CPus and multi-core processors to
give you the fastest calculations. Correct results—
and fast—using @RIsK and the DecisionTools suite!

5
Retirement planning Currency valuation Real options analysis Discounted Cash flow analysis Value-at-risk Portfolio optimization
loss reserves estimation Premium pricing
six sigma and quality analysis new product analysis Production siting Plant shutdown Product life cycle analysis
six sigma and quality analysis exploration and production oil reserves estimation Capital project estimation Pricing Regulation compliance
new product analysis R&D estimation Disease infection estimation
endangered species preservation Pollution cleanup and projections
Resource allocation war games welfare and budgetary projections
Cost estimating highway planning and optimization supply chain distribution
InDusTRysaMPle aPPlICaTIon
fInanCe anD seCuRITIes
InsuRanCe / ReInsuRanCe
ManufaCTuRIng
oIl / gas / eneRgy
PhaRMaCeuTICals / MeDICal / healThCaRe
enVIRonMenT
goVeRnMenT anD Defense
aeRosPaCe anD TRansPoRTaTIon
aPPlICaTIons of @RIsK & The
DeCIsIonTools suITePalisade software is used to analyze risk and uncertainty in a wide variety of industries.

gravest a
ost american busin
@RIsK anD DeCIsIonTools suITe sofTwaRe Is useD by oVeR 93% of foRTune 100 CoMPanIes
DecisionTools is a superior brand of products directed
at what I consider the gravest and most consequential
activities of most american businesses, risk assessment
and decision making.
Mark Ploskunak, Project Manager, IbM
@RIsK is very powerful and I would recommend it
to anyone who needs the ability to run simulations
on differing risk profiles.
Patrick Casey, account Manager, aT&T wholesale
6

@RIsK anD DeCIsIonTools suITe sofTwaRe Is useD by oVeR 93% of foRTune 100 CoMPanIes
complete risk and decision analysis toolkit
leaRn MoRe: PalIsaDe.CoM/DeCIsIonTools_suITe
youR fIRsT sTeP To beTTeR DeCIsIons...The DecisionTools suite is an integrated set of programs designed specifically to work together
in excel for optimum risk and decision analysis in a single package. There are two editions of the
DecisionTools suite – Professional and Industrial – each designed to meet different analytical needs.
DecisionTools suite Professional includes Professional editions of all component
products and provides a balance of robust analysis and point-and-click ease of use.
DecisionTools suite Industrial includes Industrial editions of all components and adds
RIsKoptimizer and @RIsKaccelerator. It is designed for larger models and more advanced analyses.
7

The DeCIsIonTools suITe bRIngs TogeTheR
seven powerful analytical programs that work together in excel
8

@RISK risk analysis using Monte Carlo simulation
@RIsK shows you many possible outcomes in your
Microsoft excel spreadsheet – and tells you how
likely they are to occur. This means you can judge
which risks to take and which ones to avoid.
PrecisionTree®
decision analysis using decision trees and influence diagrams
Decision trees let you visually map out complex,
multi-layered decisions in a sequential, organized
manner. This helps you identify all possible
alternatives and choose the best option.
9
Evolver™
genetic algorithm-based optimization
evolver is well-suited to finding the best overall
global solution to nonlinear, complex problems
where other solvers fail. evolver’s genetic
algorithms constantly try new, different solutions
to arrive at the best answer possible.
RISKOptimizer® optimization under uncertainty using genetic algorithms and Monte Carlo simulation
Take any optimization problem and replace uncertain
values with @RIsK functions that represent ranges
of possible values. RIsKoptimizer will try different
combinations of adjustable cells to achieve the goal
you define, while running Monte Carlo simulations on
each trial solution to account for inherent uncertainty.
The result is the most robust, accurate solution
possible. RIsKoptimizer is available in the Industrial
edition of the DecisionTools suite.
StatTools® time-series forecasting and advanced statistical analysis
statTools replaces excel’s built-in statistics
functions with its own, more robust and accurate
functions. statTools covers the most common
statistical analyses, and even allows you to build
your own custom statistical procedures.
NeuralTools® prediction using intelligent neural networks
neuralTools imitates brain functions to “learn”
patterns in your known data, and uses those
patterns to make predictions from new, incomplete
data. neuralTools also automatically updates
predictions live when input data changes, saving
time and enabling more robust analyses.
TopRank®
automated what-if sensitivity analysis
Define any output or “bottom line” cell or cells, and
TopRank automatically finds and varies all input
cells which affect the output. The end result is
identification and ranking of all input factors which
affect your bottom line.
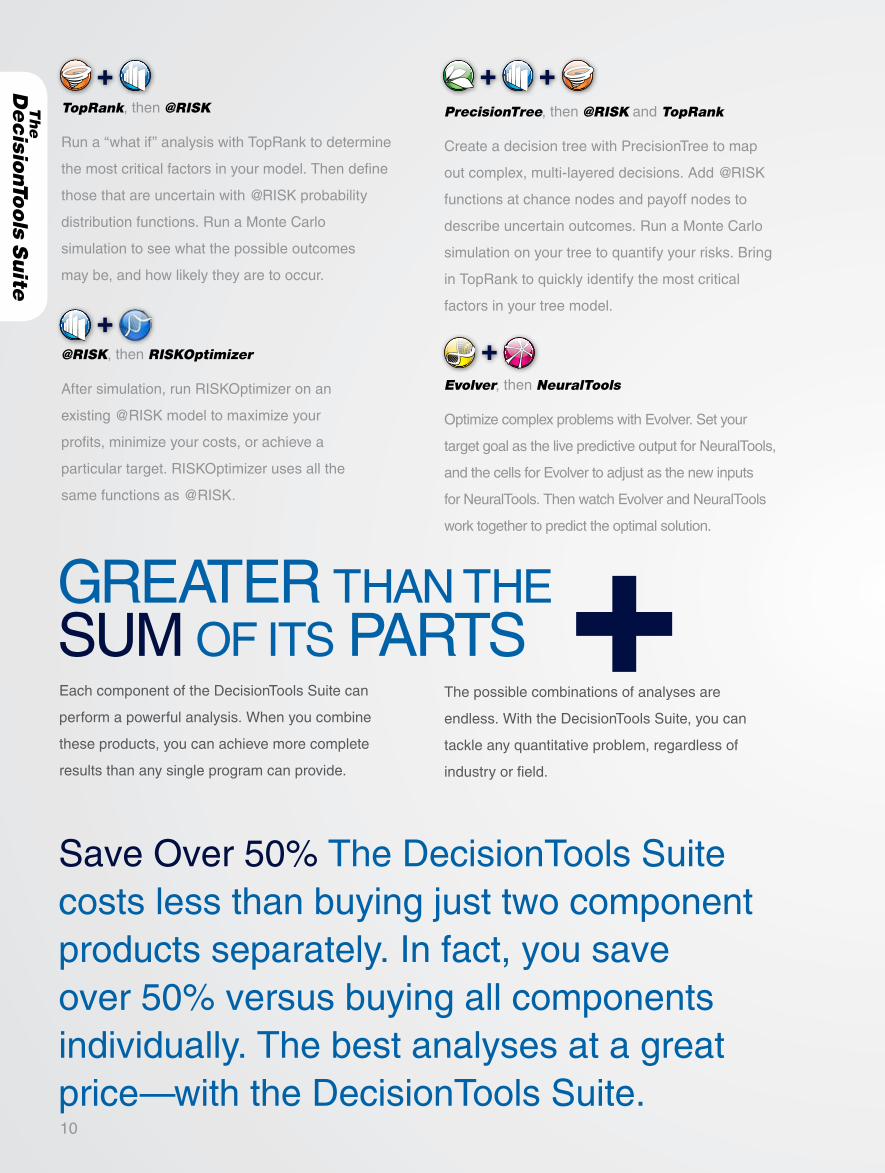
gReaTeR Than The suM of ITs PaRTs
TopRank, then @RISK
Run a “what if” analysis with TopRank to determine
the most critical factors in your model. Then define
those that are uncertain with @RIsK probability
distribution functions. Run a Monte Carlo
simulation to see what the possible outcomes
may be, and how likely they are to occur.
@RISK, then RISKOptimizer
after simulation, run RIsKoptimizer on an
existing @RIsK model to maximize your
profits, minimize your costs, or achieve a
particular target. RIsKoptimizer uses all the
same functions as @RIsK.
PrecisionTree, then @RISK and TopRank
Create a decision tree with PrecisionTree to map
out complex, multi-layered decisions. add @RIsK
functions at chance nodes and payoff nodes to
describe uncertain outcomes. Run a Monte Carlo
simulation on your tree to quantify your risks. bring
in TopRank to quickly identify the most critical
factors in your tree model.
Evolver, then NeuralTools
optimize complex problems with evolver. set your
target goal as the live predictive output for neuralTools,
and the cells for evolver to adjust as the new inputs
for neuralTools. Then watch evolver and neuralTools
work together to predict the optimal solution.
The possible combinations of analyses are
endless. with the DecisionTools suite, you can
tackle any quantitative problem, regardless of
industry or field.
each component of the DecisionTools suite can
perform a powerful analysis. when you combine
these products, you can achieve more complete
results than any single program can provide.
save over 50% The DecisionTools suite costs less than buying just two component products separately. In fact, you save over 50% versus buying all components individually. The best analyses at a great price—with the DecisionTools suite.10

11
The DecisionTools Suite 日本語版
@RIsK、PrecisionTree、TopRank、neuralTools、statTools、evolver、および RISKOptimizer を含む DecisionTools Suite のすべてのコンポーネントは日本語に完全翻訳されています。メニュー、ダイアログ、出力レポート、ヘルプ ファイル、およびチュートリアルもすべて日本語でご利用になれます。英語版とまったく同じ高機能をすべてそのまま日本語でも利用できます。
The DecisionTools Suite en español
Todos los componentes del DecisionTools suite han sido traducidos al español en su totalidad,
incluyendo @RIsK, PrecisionTree, TopRank, neuralTools, statTools, evolver y RIsKoptimizer. Todos los
menús, cuadros de diálogo, informes de resultados, archivos de ayuda y tutoriales, han sido traducidos
cuidadosamente. así podrá disfrutar de toda la eficacia de este grupo de programas en su propio idioma.
The DecisionTools Suite em Português
Todos os componentes do DecisionTools suite – @RIsK, PrecisionTree, TopRank, neuralTools, statTools,
evolver e RIsKoptimizer – foram integralmente traduzidos em português. Todos os menus, caixas de
diálogo, relatórios de outputs, arquivos de ajuda e tutoriais foram cuidadosamente traduzidos. agora você
pode aproveitar todos os recursos avançados desta suíte de programas no seu idioma.
CoMPRehensIVe language suPPoRTall products in the DecisionTools suite have been fully translated into spanish, german, french, Portuguese
and Japanese. all dialogs, menus, documentation, examples and tutorials have been carefully translated,
making the DecisionTools suite more accessible to decision makers around the world.
The DecisionTools Suite auf Deutsch
alle Komponenten der DecisionTools suite, einschließlich @RIsK, PrecisionTree, TopRank, neuralTools,
statTools, evolver und RIsKoptimizer, sind jetzt vollständig ins Deutsche übersetzt worden. alle Menüs,
Dialogfelder, ausgabeberichte, hilfedateien und lernprogramme wurden ebenfalls sorgfältig übersetzt. Mit
anderen worten, sie erhalten die vollständige suite in Ihrer eigenen Muttersprache.
The DecisionTools Suite en français Tous les composants de DecisionTools suite – @RIsK, PrecisionTree, TopRank, neuralTools, statTools,
evolver et RIsKoptimizer – ont été traduits intégralement en français. Tous les menus, boîtes de dialogue,
rapports de sortie, fichiers d’aide et didacticiels ont été soigneusement traduits. Vous bénéficiez ainsi de
toute la puissance de la série dans votre propre langue.

DecisionTools streamlines Distribution Management from hours to Minutes
application: Distribution, and Inventory Management
Industry: Transportation
logion is a netherlands-based consultancy that specializes in transportation, distribution, and inventory management. Its consultants and implementation managers use decision support models to improve the effectiveness and efficiency of their clients' logistics operations. by slashing analysis time and enhancing model accuracy, Palisade's state-of-the-art DecisionTools suite has become critical to the firm's strategy and competitive position.
"when I first read about Palisade's @RIsK software," says logion's Rolf van lingen, "I simply had to have it. This software is really amazing. for some years I've been looking for a flexible product like this. no more stressful late nights working with static excel spreadsheets in order to meet my clients' deadlines. Palisade's software really makes it easier for me to do my work in less time and with much more fun, too!"
logion uses the suite to optimize these typical client functions: transportation planning, new product introduction, set inventory levels, anticipation of supply chain lead times, back orders, and customer service activities
logion has developed what it calls activity based Costing (abC) models to improve their clients' transportation and warehousing operations, both in terms of efficiency and smooth workflow. These models can contain up to 75 input variables each. among the important bottom-line output variables are operating expenses, total labor expenses, costs per product, and costs per client. Traditional single point estimates and deterministic modeling techniques are not appropriate.
Van lingen uses TopRank to determine which input parameters affect efficiency the most and ranks them in order of importance. Then, because static modeling environments are not well suited for dynamic logistic processes, van lingen uses distribution fitting in @RIsK to determine the probability distributions that most accurately describe the comings and goings of freight, trucks, etc. "The first time I did this, I was shocked. This now takes only 3-5 mouse clicks, when it used to take hours!"
The next step is to simulate the process in @RIsK, and van lingen finds these models a big improvement over his earlier static models, especially those used for inventory planning and control. here, the greater the degree of uncertainty in lead time and demand rate, the more stock will be needed to meet a required customer service level. Variations cannot totally be removed, and this creates a need for an acceptable simulation environment to model trade-offs between service levels and inventory holding costs.
according to van lingen, Palisade's software has become invaluable for logion's business. by allowing models to dynamically represent uncertainty, DecisionTools has enabled logion to provide a much more realistic picture of possible outcomes. and, by systematically crunching the numbers for thousands of scenarios, Palisade software saves the company valuable time and human resources.
Case study LogionDecisionTools suite is Integral to firm's strategy and Competitive Position
applications of the DecisionToolsRetirement planning ∙ Currency valuation ∙ Real options analysis
Discounted Cash Flow analysis ∙ Value-at-risk ∙ Portfolio optimization
Loss reserves estimation ∙ Pricing decisions ∙ Six Sigma and quality
analysis ∙ Production siting ∙ Plant shutdown ∙ Product life cycle analysis
Exploration and production ∙ Oil reserves estimation ∙ Regulation
compliance ∙ R&D estimation ∙ Disease infection estimation ∙ Pollution
cleanup and projections ∙ Resource allocation ∙ Cost estimating
Highway planning and optimization ∙ Supply chain distribution
‘‘This software is really amazing. Palisade's software really makes it easier for me to do my work in less time and with much more fun, too!
Rolf van lingen, logion’’
12

risk analysis using Monte Carlo simulation
leaRn MoRe: PalIsaDe.CoM/RIsK
Manage The fuTuRe @RIsK performs risk analysis using Monte Carlo simulation to show you many possible
outcomes in your Microsoft excel spreadsheet or Microsoft Project schedule—and tells
you how likely they are to occur. This means you can judge which risks to take and which
ones to avoid. with @RIsK, you can answer questions like, “what is the probability of
profit exceeding $10 million?” or “what are the chances of meeting this project deadline?”
13
Part of the DecisionTools Suite
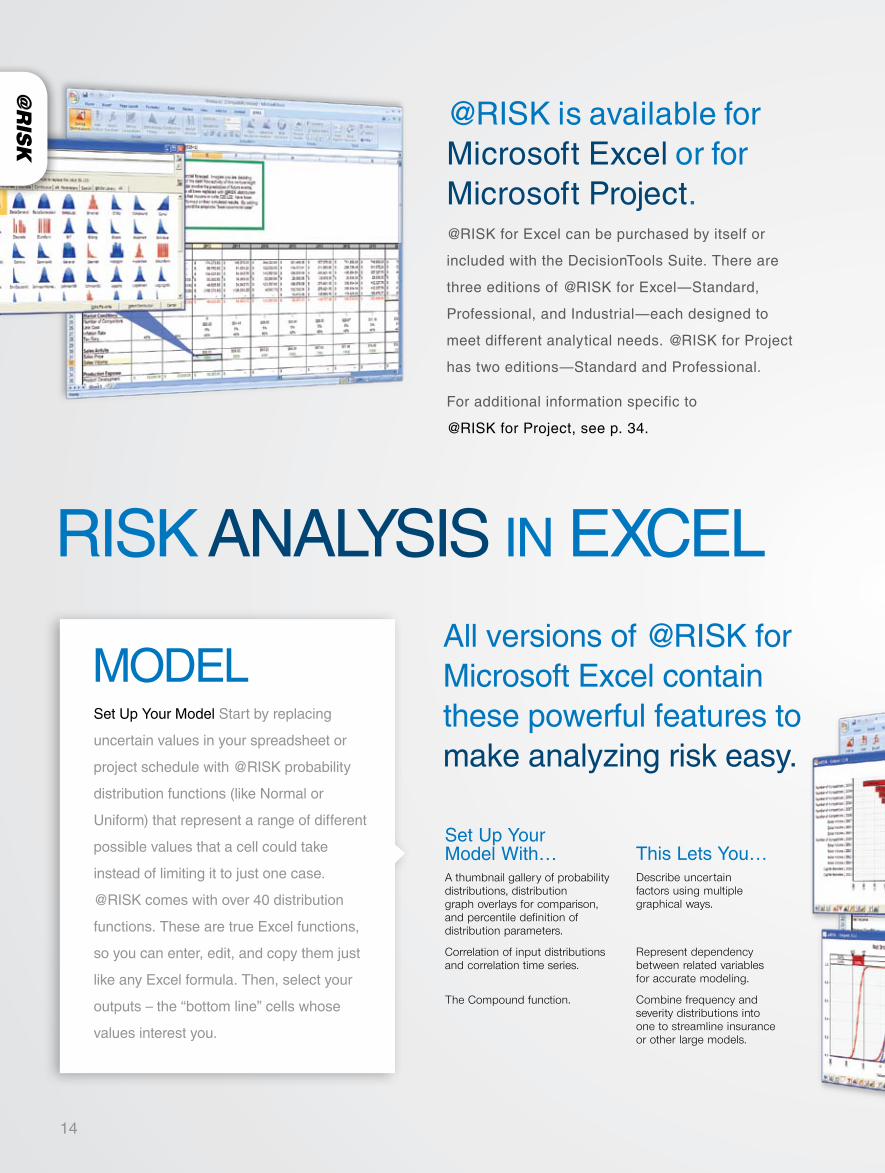
set up your Model with…A thumbnail gallery of probability distributions, distribution graph overlays for comparison, and percentile definition of distribution parameters.
Correlation of input distributions and correlation time series.
The Compound function.
This lets you…Describe uncertain factors using multiple graphical ways.
Represent dependency between related variables for accurate modeling.
Combine frequency and severity distributions into one to streamline insurance or other large models.
Set Up Your Model Start by replacing
uncertain values in your spreadsheet or
project schedule with @RISK probability
distribution functions (like Normal or
Uniform) that represent a range of different
possible values that a cell could take
instead of limiting it to just one case.
@RISK comes with over 40 distribution
functions. These are true Excel functions,
so you can enter, edit, and copy them just
like any Excel formula. Then, select your
outputs – the “bottom line” cells whose
values interest you.
@RISK is available for Microsoft Excel or for Microsoft Project.
@RISK for Excel can be purchased by itself or
included with the DecisionTools Suite. There are
three editions of @RISK for Excel—Standard,
Professional, and Industrial—each designed to
meet different analytical needs. @RISK for Project
has two editions—Standard and Professional.
For additional information specific to
@RISK for Project, see p. 34.
MoDel
RIsK analysIs In exCel all versions of @RIsK for Microsoft excel contain these powerful features to make analyzing risk easy.
14
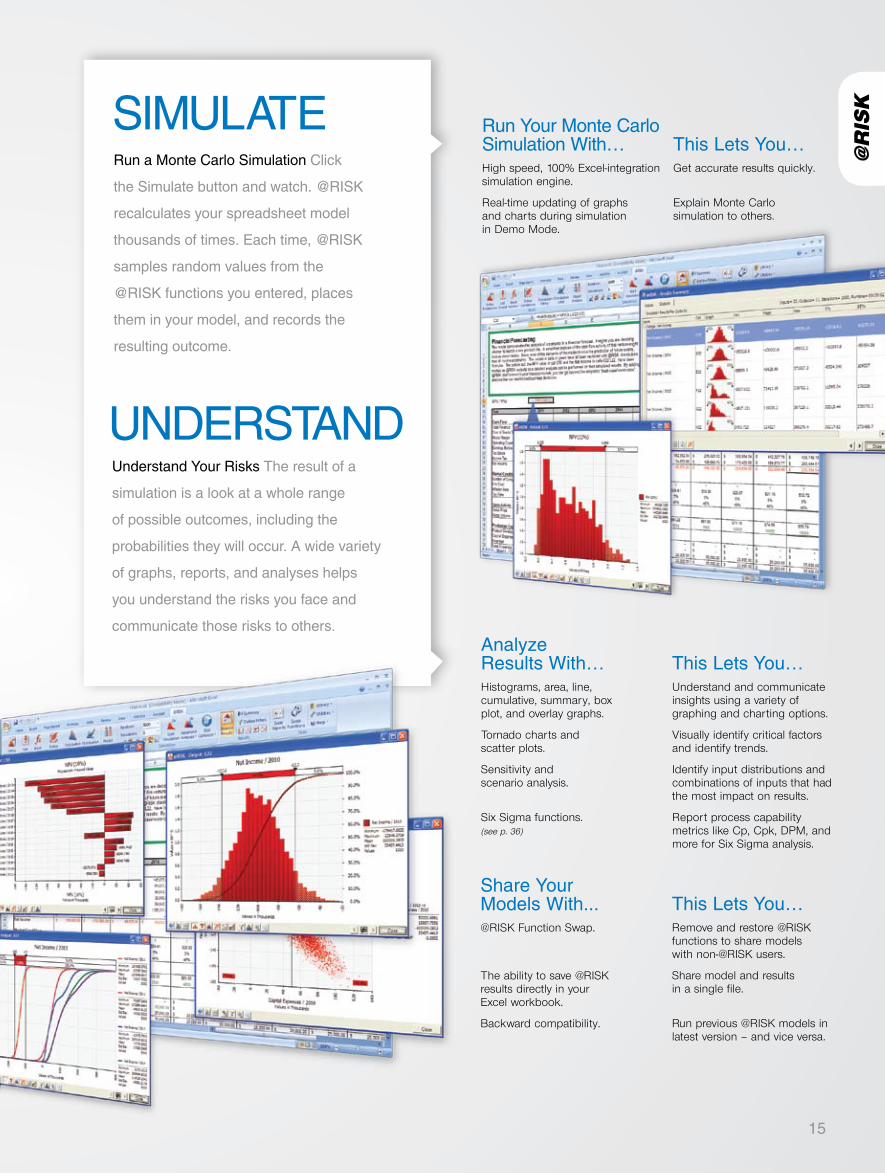
analyze Results with…Histograms, area, line, cumulative, summary, box plot, and overlay graphs.
Tornado charts and scatter plots.
Sensitivity and scenario analysis.
Six Sigma functions. (see p. 36)
This lets you…Understand and communicate insights using a variety of graphing and charting options.
Visually identify critical factors and identify trends.
Identify input distributions and combinations of inputs that had the most impact on results.
Report process capability metrics like Cp, Cpk, DPM, and more for Six Sigma analysis.
share your Models with...@RISK Function Swap.
The ability to save @RISK results directly in your Excel workbook.
Backward compatibility.
This lets you…Remove and restore @RISK functions to share models with non-@RISK users.
Share model and results in a single file.
Run previous @RISK models in latest version – and vice versa.
Run your Monte Carlo simulation with…High speed, 100% Excel-integration simulation engine.
Real-time updating of graphs and charts during simulation in Demo Mode.
This lets you…Get accurate results quickly.
Explain Monte Carlo simulation to others.
sIMulaTeRun a Monte Carlo Simulation Click
the Simulate button and watch. @RISK
recalculates your spreadsheet model
thousands of times. Each time, @RISK
samples random values from the
@RISK functions you entered, places
them in your model, and records the
resulting outcome.
unDeRsTanDUnderstand Your Risks The result of a
simulation is a look at a whole range
of possible outcomes, including the
probabilities they will occur. A wide variety
of graphs, reports, and analyses helps
you understand the risks you face and
communicate those risks to others.
15
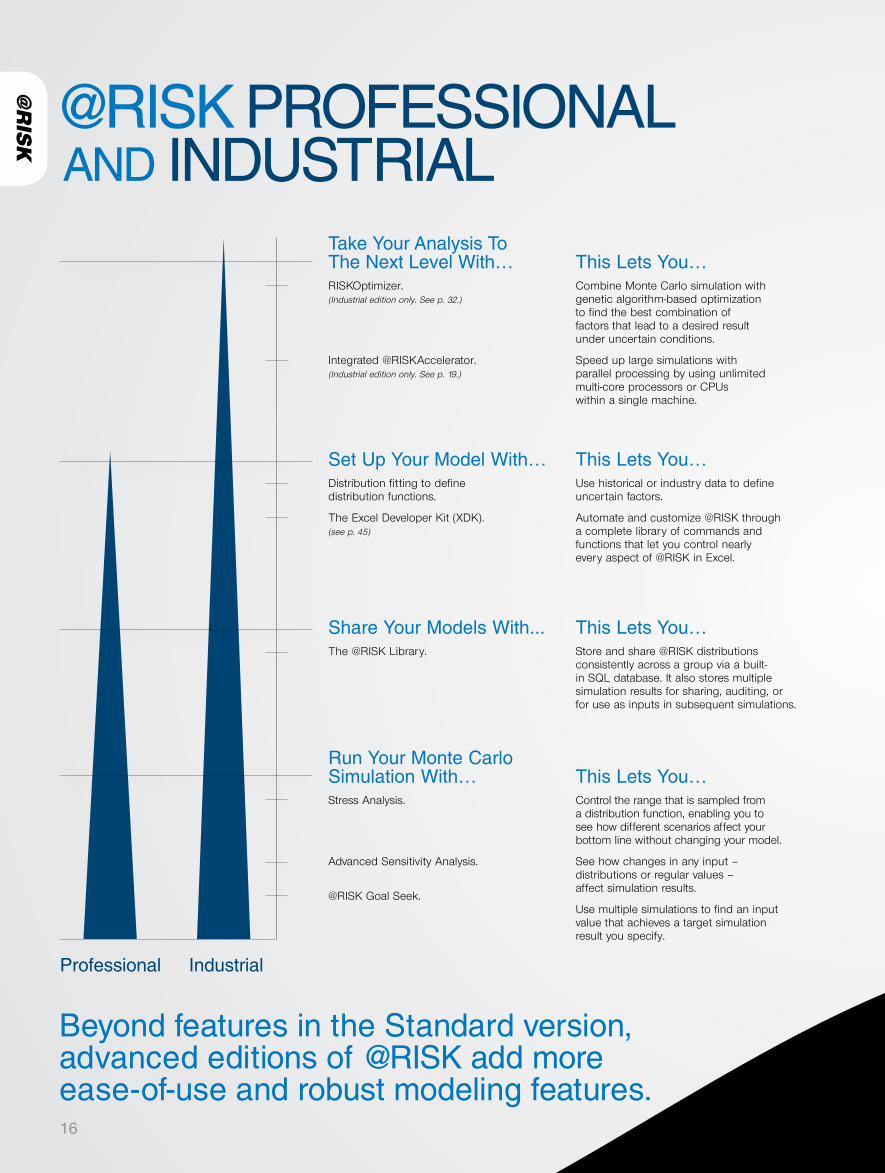
@RIsK PRofessIonal anD InDusTRIal
beyond features in the standard version, advanced editions of @RIsK add more ease-of-use and robust modeling features.
Take your analysis To The next level with…RISKOptimizer. (Industrial edition only. See p. 32.)
Integrated @RISKAccelerator. (Industrial edition only. See p. 19.)
This lets you…Combine Monte Carlo simulation with genetic algorithm-based optimization to find the best combination of factors that lead to a desired result under uncertain conditions.
Speed up large simulations with parallel processing by using unlimited multi-core processors or CPUs within a single machine.
Professional Industrial
set up your Model with…Distribution fitting to define distribution functions.
The Excel Developer Kit (XDK). (see p. 45)
This lets you…Use historical or industry data to define uncertain factors.
Automate and customize @RISK through a complete library of commands and functions that let you control nearly every aspect of @RISK in Excel.
share your Models with...The @RISK Library.
This lets you…Store and share @RISK distributions consistently across a group via a built-in SQL database. It also stores multiple simulation results for sharing, auditing, or for use as inputs in subsequent simulations.
Run your Monte Carlo simulation with…Stress Analysis.
Advanced Sensitivity Analysis.
@RISK Goal Seek.
This lets you…Control the range that is sampled from a distribution function, enabling you to see how different scenarios affect your bottom line without changing your model.
See how changes in any input – distributions or regular values – affect simulation results.
Use multiple simulations to find an input value that achieves a target simulation result you specify.
16

leaRn MoRe: PalIsaDe.CoM/RIsK/RIsKaCCeleRaToR.asP
@RIsKaCCeleRaToR neTwoRK eDITIon
accelerate your @RIsK simulations
@RIsKaccelerator is designed to handle large, time-consuming @RIsK
simulations quickly and efficiently by maximizing the use of available CPus
over a network. by using @RIsKaccelerator in conjunction with @RIsK for
excel, large models can be run in a timely fashion, generating the critical
information needed for real-time decision making!
how @RIsKaccelerator works
@RIsKaccelerator uses the technique of "parallel processing" for speeding
up simulations. @RIsKaccelerator "splits up" a single @RIsK simulation
and sends it out to available computers and CPus. each computer runs its
portion of the simulation concurrently with the others, sending results back
as they are completed. when the entire simulation is completed, all results
are merged back together and the results are displayed just as they are in a
standard single-processor version of @RIsK. all this happens transparent to
the user, with all routing and scheduling handled by @RIsKaccelerator.
with @RIsKaccelerator, the speed of some simulations increase almost
linearly with the number of equivalent CPus used. for example, if 8 CPus are
used for a single simulation, the simulation may run nearly 8 times faster than
it currently does in an existing copy of @RIsK for excel on a single CPu PC.
17

18
Case study ProCter & gambLe@RIsK and PrecisionTree in Manufacturing
Procter & gamble uses DecisionTools for Investment analysis application: Production siting, new Product analysis,
exchange Rate analysis, Real options
Industry: Manufacturing
“we’ve trained well over a thousand people throughout the company on @RIsK,” says Procter & gamble’s bob hunt, who went on to implement another DecisionTool, PrecisionTree. hunt was associate Director for Investment analysis in P&g’s Corporate finance organization and served as a resource to the business units.
long history of @RIsKP&g has been using @RIsK since 1993 when hunt first introduced it for modeling production siting decisions. The company was evaluating some cross-border siting options, and the decisions required them to take into account not only uncertainties involving the capital and cost aspects of plant location but fluctuations in exchange rates as well. The company has since come to rely on @RIsK for its “entire range of investment decisions” including new products, extensions of product lines, geographical expansions into new countries, manufacturing savings projects, and production siting.
PrecisionTree for Real optionsMore recently hunt and his colleagues have been working with PrecisionTree. “Its attraction is its capacity to value complex decisions, which often involve multiple, sequential decision steps.” They find it particularly valuable in evaluating real options. “we considered using financial option calculators to analyze the real options that are embedded in our complex decisions, but we found that they simply can’t solve for the real option value in projects with multiple, sequential investment decisions. Decision trees are really the only tool that can correctly value multiple sequential decisions where uncertainty is private risk.” Procter & gamble is now in the process of rolling out PrecisionTree to all of its major business units around the world.
better Decisions from better Processeshunt also notes that a lot of the value derived from using PrecisionTree is realized during the process that the staff goes through in determining the probabilities, and laying out the decision sequence and the criteria for making those decisions. The combination of the different approach required to frame decisions, and the ease and effectiveness of the PrecisionTree software, says hunt, “is really powerful for our company.”
select Companies using The DecisionTools
AT&T ∙ Bank of America ∙ Boeing ∙ BP Amoco ∙ Bristol-Myers Squibb
Centers for Disease Control & Prevention ∙ Citigroup ∙ Dow Chemical
Eastman Kodak ∙ ExxonMobil ∙ Fidelity Investments ∙ Ford Motor Company
General Electric ∙ Hewlett Packard ∙ Hitachi ∙ IBM ∙ Merck ∙ Microsoft
Mitsubishi Heavy Industries ∙ Pemex ∙ Petrobras ∙ Procter & Gamble
Schlumberger ∙ Shell ∙ Westinghouse
‘‘DecisionTools has been very useful in helping us break complex projects down into individual decision options, helping us understand the uncertainties, and ultimately helping us make superior decisions.
– bob hunt, Procter & gamble ’’

19
Merck uses @RIsK for Value-at-Risk application: Value-at-Risk of exchange Rates
Industry: Pharmaceuticals
for a company the size of Merck, the multinational pharmaceutical giant based in whitehouse station, new Jersey, awareness of value-at-risk (VaR) is crucial to the performance of its risk management programs. and of course, foreign exchange rates are one of the most volatile forces at work in any assessment of value-at-risk.
art Misyan, Director of foreign exchange at Merck, is responsible for the company’s ongoing surveillance of its currency risks. he has been using @RIsK for years. “we love it because it incorporates distributions fitting and gives us the flexibility to evaluate alternative distributions on screen.” he also finds it useful for presentations to Merck’s senior managers, who are quite conversant with probability and risk analysis.
VaR analyses have never been simple, and art points out that in the last few years they have needed to be increasingly sophisticated. “we are managing currency risk in both the balance sheet and in future revenues.” Merck’s currency exposures span at least 30 countries, and while simulating hedged currency risks on the balance sheet is relatively straightforward, he says, simulating hedged cash flow currency risk is not.
“simple VaR analysis is not good enough,” he says, and this is because of the fas 133 accounting standard for derivative investments. new approaches to assessing hedging strategies have also created the need for more sophisticated analyses. earlier methods of evaluating hedging strategies predicted economic value at inception and completion. now, current practice is to project both economic and accounting hedge performance through time, looking prospectively and retrospectively. This adds significantly to the number of variables, a task to which @RIsK is well-suited. art says that a typical simulation now includes analysis of option time decay and the volatility of the option’s price components.
as ways of thinking about VaR at Merck evolve from complex to downright complicated, @RIsK remains Merck’s analytic tool of choice.
Case study merCk@RIsK in Value-at-Risk exchange Rate
applications of @RIsK
Cost estimating ∙ Troop deployment and resource allocation
endangered species preservation ∙ Pollution projections ∙ Retirement
planning ∙ Currency valuation ∙ Real options analysis ∙ Discounted
Cash flow analysis ∙ welfare and budgetary projections ∙ loss
reserves estimation ∙ six sigma and quality analysis ∙ Production
siting ∙ Plant shutdown ∙ Product life cycle analysis ∙ Disease infection
estimation ∙ oil reserves estimation ∙ Capital project estimation
Pricing ∙ Regulation compliance ∙ R&D estimation ∙ Value-at-risk
Portfolio optimization ∙ Investment prediction ∙ highway planning and
optimization ∙ supply chain distribution
‘‘We love [@RISK] because it incorpo-rates distribution fitting and gives us the flexibility to evaluate alternative distributions on screen.
art Misyan, Merck’’

financial Models using simulation and optimization by wayne wInsTon
This book is the most in-depth book ever written
about using @RIsK, evolver, PrecisionTree,
and TopRank to solve today’s complex financial
problems. Topics include portfolio optimization,
acquisitions modeling, value-at-risk, and much
more. over 60 examples are included.
financial Models using simulation and optimization II by wayne wInsTon
building on the success of financial Models, wayne
winston uses @RIsK and evolver to model stock
prices, hedge interest rate risk, price options, minimize
portfolio risk, value a firm, and much more. over 65
chapters are included. new examples and techniques
in financial analysis make this book a must-have.
20
Introduction to financial Modeling with @RIsK
In this multimedia CD-RoM, author wayne winston outlines
how to use @RIsK to solve a range of financial problems.
as he speaks, he performs the keystrokes and constructs
the models step-by-step. Topics covered include optimal
ordering, sales forecasting, cash flows, and more.
Decisions Involving uncertainty by JaMes MuRTha
a great extension of Jim Murtha’s successful seminar
series, this book first debuted in 1994 and has been
a staple risk analysis text for oil and gas companies
worldwide ever since. Petroleum engineers and
others benefit from examples in topics ranging from
volumetric reserves to production forecasts.
booKs anD CDs

visual decision analysis for spreadsheets
leaRn MoRe: PalIsaDe.CoM/PReCIsIonTRee
beTTeR VIsIon foR beTTeR DeCIsIonsPrecisionTree performs decision analysis in Microsoft excel using decision trees and influence diagrams.
Decision trees let you visually map out complex, multi-layered decisions in a sequential, organized
manner. This helps you identify all possible alternatives and choose the best option. PrecisionTree can
be purchased by itself or included with the DecisionTools suite. There are two editions of PrecisionTree—
Professional and Industrial—each designed to meet different analytical needs.
21
Part of the DecisionTools Suite

how PReCIsIonTRee woRKs
build a Decision Tree Decision trees provide a formal structure in which decisions and
chance events are linked in sequence from left to right. Decisions,
chance events, and end results are represented by nodes and
connected by branches. The result is a tree structure with the
“root” on the left and various payoffs on the right. Probabilities of
events occurring and payoffs for events and decisions are added
to each node in the tree. with PrecisionTree, you’ll see the payoff
and probability of each possible path through a tree.
analyze your Results once your decision tree is complete, PrecisionTree’s decision
analysis identifies the best decision and compares it with
alternative decisions. a variety of graphs and reports illustrate
critical factors, probabilities of given outcomes, and more.
The combination of the approach
required to frame decisions, and
the ease and effectiveness of the
PrecisionTree software is really
powerful for our company.
bob hunt, associate Director for Investment analysis, Procter & gamble Corporate finance
22
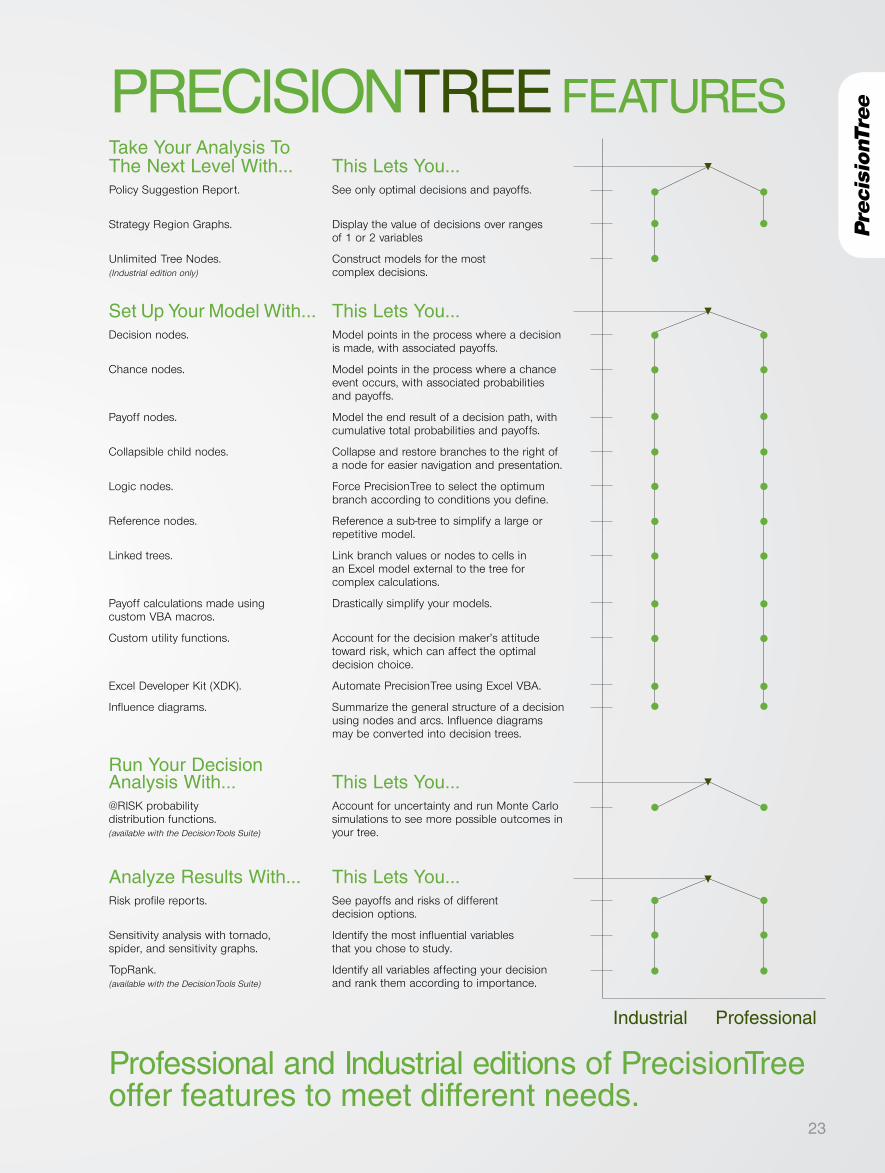
PReCIsIonTRee feaTuRes
Professional and Industrial editions of PrecisionTree offer features to meet different needs.
Industrial Professional
This lets you...Model points in the process where a decision is made, with associated payoffs.
Model points in the process where a chance event occurs, with associated probabilities and payoffs.
Model the end result of a decision path, with cumulative total probabilities and payoffs.
Collapse and restore branches to the right of a node for easier navigation and presentation.
Force PrecisionTree to select the optimum branch according to conditions you define.
Reference a sub-tree to simplify a large or repetitive model.
Link branch values or nodes to cells in an Excel model external to the tree for complex calculations.
Drastically simplify your models.
Account for the decision maker’s attitude toward risk, which can affect the optimal decision choice.
Automate PrecisionTree using Excel VBA.
Summarize the general structure of a decision using nodes and arcs. Influence diagrams may be converted into decision trees.
This lets you...Account for uncertainty and run Monte Carlo simulations to see more possible outcomes in your tree.
This lets you...See payoffs and risks of different decision options.
Identify the most influential variables that you chose to study.
Identify all variables affecting your decision and rank them according to importance.
This lets you...See only optimal decisions and payoffs.
Display the value of decisions over ranges of 1 or 2 variables
Construct models for the most complex decisions.
set up your Model with...Decision nodes.
Chance nodes.
Payoff nodes.
Collapsible child nodes.
Logic nodes.
Reference nodes.
Linked trees.
Payoff calculations made using custom VBA macros.
Custom utility functions.
Excel Developer Kit (XDK).
Influence diagrams.
Run your Decision analysis with...@RISK probability distribution functions. (available with the DecisionTools Suite)
analyze Results with...Risk profile reports.
Sensitivity analysis with tornado, spider, and sensitivity graphs.
TopRank. (available with the DecisionTools Suite)
Take your analysis To The next level with...Policy Suggestion Report.
Strategy Region Graphs.
Unlimited Tree Nodes. (Industrial edition only)
23

automated what-if analysis for spreadsheets
leaRn MoRe: PalIsaDe.CoM/ToPRanK
fInD CRITICal faCToRs – fasT TopRank performs automated “what if” sensitivity analysis on Microsoft excel spreadsheets. Define
any output or “bottom line” cell or cells, and TopRank will automatically find and vary all input cells
which affect your output. The end result is a ranking in order of importance of all input factors which
affect your bottom line. Results are presented in at-a-glance tornado diagrams and other reports.
TopRank is used for identifying critical factors in new product launches, capital projects, insurance
projections, oil and gas production, environmental analyses, drug research, and much more. TopRank
is available in two editions – Professional and Industrial – in the DecisionTools suite.
24
Part of the DecisionTools Suite

25
This lets you...Save time in performing analysis.
Customize your analysis to particular inputs.
Easily locate cells that will be varied.
Save time defining categories.
Control how cells are varied to reflect your situation.
Define a wide range of default settings for all models.
set up your Model by...Automatically identifying inputs to vary.
Identifying specific cells or ranges to vary.
Browsing inputs with the Tab key.
Changing related inputs at the same time.
Specifying values to vary.
Adjusting Application Settings.
This lets you...Quickly see critical factors.
Identify scenarios of multiple inputs affecting results.
See unlimited combinations of input scenarios.
Model variation in cell values much more accurately.
Run your sensitivity analysis by...Automatically varying input cells.
Performing 2- or 3-Way What-If Analysis.
Performing unlimited Multi-Way Analysis. (Industrial edition only)
Including @RISK functions.
This lets you...Easily understand and identify critical factors and communicate to others.
Remove and restore TopRank functions for sharing models with others.
See inputs ranked by their effects on results.
analyze Results with...Tornado, spider, and sensitivity graphs.
Function Swap.
Summary Reports.
ToPRanK feaTuRes
I use TopRank to determine
the critical factors affecting
transportation efficiency.
Rolf van lingen, logion bV

sophisticated neural networks for Excel
leaRn MoRe: PalIsaDe.CoM/neuRalTools
InTellIgenT PReDICTIons fRoM a “ThInKIng” sPReaDsheeT neuralTools brings a sophisticated new capability for forecasting and prediction in Microsoft excel: neural networks.
you'll make new predictions based on the patterns in your known data with uncanny accuracy. neuralTools imitates
brain functions in order to “learn” the structure of your data. once neuralTools understands your data, it can take new
inputs and make intelligent predictions. your spreadsheet can “think” for you like never before.
neuralTools is used for loan underwriting, credit scoring, medical diagnosis, call center planning, fraud detection,
investment prediction, target identification, and much more. neuralTools is available in two editions – Professional
and Industrial – to meet different analytical needs.
26
Part of the DecisionTools Suite

This lets you...See input variables ranked by their effect on the prediction.
Quantify accuracy of the prediction, view training statistics, and more.
Combine analyses for greater insight.
analyze Results with...Variable Impact Analysis.
Graphs and reports.
StatTools statistical analyses using the same Data Set Manager. (available with the DecisionTools Suite)
This lets you...Save time and hassle while getting predictions fast.
Automatically update predictions when input data changes.
Run your neural networks analysis with…One-step training, testing, and prediction.
Live Prediction. (Industrial edition only)
This lets you...Save time structuring your data for analysis.
Analyze problems accurately.
Analyze large problems with highest accuracy.
Analyze a wide range of problems.
Save time and improve clarity.
Analyze more complex problems.
Concentrate on your analysis instead of worrying about giving variables the same names in different data sets.
Control how your data is analyzed.
Define a wide range of default settings for all models.
set up your Model with...An intelligent Data Set Manager.
Up to 1,000 cases per dataset.
Unlimited cases per dataset. (Industrial edition only)
Categorical or numeric data.
Categorical data without dummy variables.
Data spanning multiple worksheets.
Variable matching.
Tagging of variables for training, testing, or predicting.
Application Settings.
neuRalTools feaTuRes
27
The software is very intuitive.
In just an hour, I was able
to complete a predictive
analysis using my data.
Jim webre, Drexel university

advanced statistical analysis for Excel
leaRn MoRe: PalIsaDe.CoM/sTaTTools
foReCasTIng anD DaTa analysIs MaDe easystatTools performs time-series forecasting and statistical analysis in Microsoft excel. It actually replaces
excel’s built-in statistics functions with its own, more robust and accurate functions. statTools covers the
most common statistical analyses, and even allows you to build your own custom statistical procedures.
statTools is used for sales forecasting, securities analysis, real options analysis, lending decisions, six
sigma and quality control, life cycle analysis, and much more. statTools is available in two editions –
Professional and Industrial – to meet different analytical needs.
28
Part of the DecisionTools Suite

sTaTTools feaTuRes
29
This lets you...See statistical reports and charts that always reflect latest data.
Fully customize all StatTools reports and identify trends.
Combine analyses for greater insight.
Forecast with greater accuracy.
Share StatTools reports with any Excel user, even if they don’t have StatTools
analyze Results with...Live updating when input data changes.
Excel-based reporting and charting.
NeuralTools neural networks analyses using the same Data Set Manager. (available with the DecisionTools Suite)
@RISK functions built around time-series forecast results. (available with the DecisionTools Suite)
Saved analyses in Excel workbooks.
This lets you...Replace questionable Excel functions and perform wide range of analyses.
Analyze a wide range of problems.
Make successful inferences when there is little available data.
Run your analysis with…New statistics in Excel.
Over 30 statistical procedures and 9 data utilities.
Nonparametric tests.
This lets you...Analyze large problems with highest accuracy.
Save time structuring and defining your data for analysis.
Analyze more complex problems.
Import data from vir tually any source into Excel.
Define a wide range of default settings for all models.
Automate and define custom procedures in StatTools.
set up your Model with...Up to 10,000 data points per variable, with unlimited data points available in the Industrial edition.
An intelligent Data Set Manager.
Data spanning multiple worksheets.
Excel data access.
Application Settings.
Excel Developer Kit (XDK) VBA programming interface.
learning statistics with statTools by s. ChRIsTIan albRIghT
Included with your statTools
purchase, this book is written
to help you get the most out
of statTools in a practical,
straightforward manner.
Much more than a software
manual, this book shows
you how to apply statistics
to real-world problems
you face. each chapter discusses a set of statistical
procedures, grouped as they are in the statTools menu
structure. example models are also included.

genetic algorithm-based optimization
leaRn MoRe: PalIsaDe.CoM/eVolVeR
InnoVaTIon soluTIons foR CoMPlex PRobleMsevolver performs genetic algorithm-based optimization in Microsoft excel. It is especially well-suited to finding
the best overall global solution to nonlinear, complex problems where other solvers fail. evolver’s genetic
algorithms constantly try new, different solutions to arrive at the best answer possible. This helps evolver find
the best “global” solution to a problem, rather than a substandard “local” solution.
evolver is used to solve problems in finance, distribution, scheduling, resource allocation, budgeting, and
much more. There are two editions of evolver – Professional and Industrial – to meet different needs.
30
Part of the DecisionTools Suite
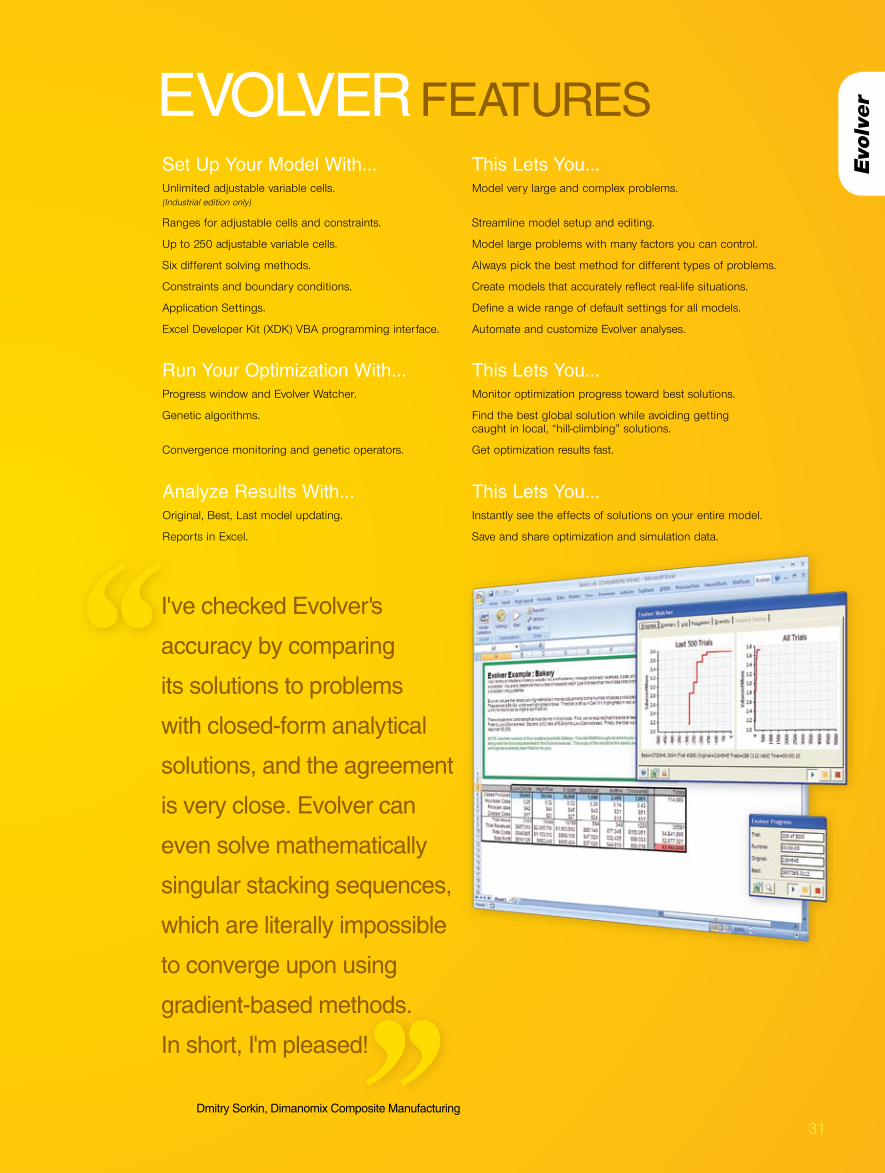
eVolVeR feaTuRes
This lets you...Instantly see the effects of solutions on your entire model.
Save and share optimization and simulation data.
analyze Results with...Original, Best, Last model updating.
Reports in Excel.
This lets you...Monitor optimization progress toward best solutions.
Find the best global solution while avoiding getting caught in local, “hill-climbing” solutions.
Get optimization results fast.
Run your optimization with...Progress window and Evolver Watcher.
Genetic algorithms.
Convergence monitoring and genetic operators.
This lets you...Model very large and complex problems.
Streamline model setup and editing.
Model large problems with many factors you can control.
Always pick the best method for different types of problems.
Create models that accurately reflect real-life situations.
Define a wide range of default settings for all models.
Automate and customize Evolver analyses.
set up your Model with...Unlimited adjustable variable cells. (Industrial edition only)
Ranges for adjustable cells and constraints.
Up to 250 adjustable variable cells.
Six different solving methods.
Constraints and boundary conditions.
Application Settings.
Excel Developer Kit (XDK) VBA programming interface.
I've checked evolver's
accuracy by comparing
its solutions to problems
with closed-form analytical
solutions, and the agreement
is very close. evolver can
even solve mathematically
singular stacking sequences,
which are literally impossible
to converge upon using
gradient-based methods.
In short, I'm pleased!
Dmitry sorkin, Dimanomix Composite Manufacturing
31

optimization under uncertainty
leaRn MoRe: PalIsaDe.CoM/RIsKoPTIMIzeR
oPTIMIzaTIon MeeTs sIMulaTIonRIsKoptimizer combines optimization with Monte Carlo simulation to solve optimization problems under
uncertainty. Take any optimization problem and replace uncertain values with @RIsK functions that represent
ranges of possible values. RIsKoptimizer will try different combinations of adjustable cells to achieve the goal
you define, while running Monte Carlo simulations on each trial solution to account for inherent uncertainty. The
result is the most robust, accurate solution possible.
RIsKoptimizer is used to solve problems in yield management, job shop scheduling, portfolio balancing, product
mix, and much more. RIsKoptimizer is available in @RIsK Industrial and DecisionTools suite Industrial.
32
Part of the DecisionTools Suite

33
RIsKoPTIMIzeR feaTuRes
Decision Making under uncertainty with RIsKoptimizer by wayne wInsTon
This book uses excel
and RIsKoptimizer to
solve many previously
unsolvable real-world
business problems.
wayne winston
teaches by example
using clear concise language. Packed with
over 30 examples, topics include: product
mix decisions, yield management, scheduling
production, retirement planning, and much more.
Decision Making under uncertainty with RIsKoptimizeruse this multimedia CD-RoM to see how to solve a wide
range of problems using RIsKoptimizer. Taking examples
from the book of the same title, the instructor demonstrates
step-by-step how to solve problems ranging from
manpower scheduling to value-at-risk of a portfolio.
This lets you...Instantly see the effects of solutions on your entire model.
Save and share optimization and simulation data.
This lets you...Monitor optimization progress toward best solutions.
Find the best global solution while avoiding getting caught in local, “hill-climbing” solutions.
Simulate many different outcomes for every trial solution.
Get optimization results fast.
This lets you...Streamline model setup and editing.
Represent vir tually any uncertain factor for accurate modeling.
Model very large and complex problems with many factors you can control.
Always pick the best method for different types of problems.
Create models that accurately reflect real-life situations.
Define a wide range of default settings for all models.
Automate and customize RISKOptimizer analyses.
analyze Results with...Original, Best, Last model updating.
Reports in Excel.
Run your optimization with...Progress window and RISKOptimizer Watcher.
Genetic algorithms.
Monte Carlo simulation.
Convergence monitoring and genetic operators.
set up your Model with...Ranges for adjustable cells and constraints.
38 built-in probability distribution functions.
Unlimited adjustable variable cells.
Six different solving methods.
Constraints and boundary conditions.
Application Settings.
Excel Developer Kit (XDK) VBA programming interface.
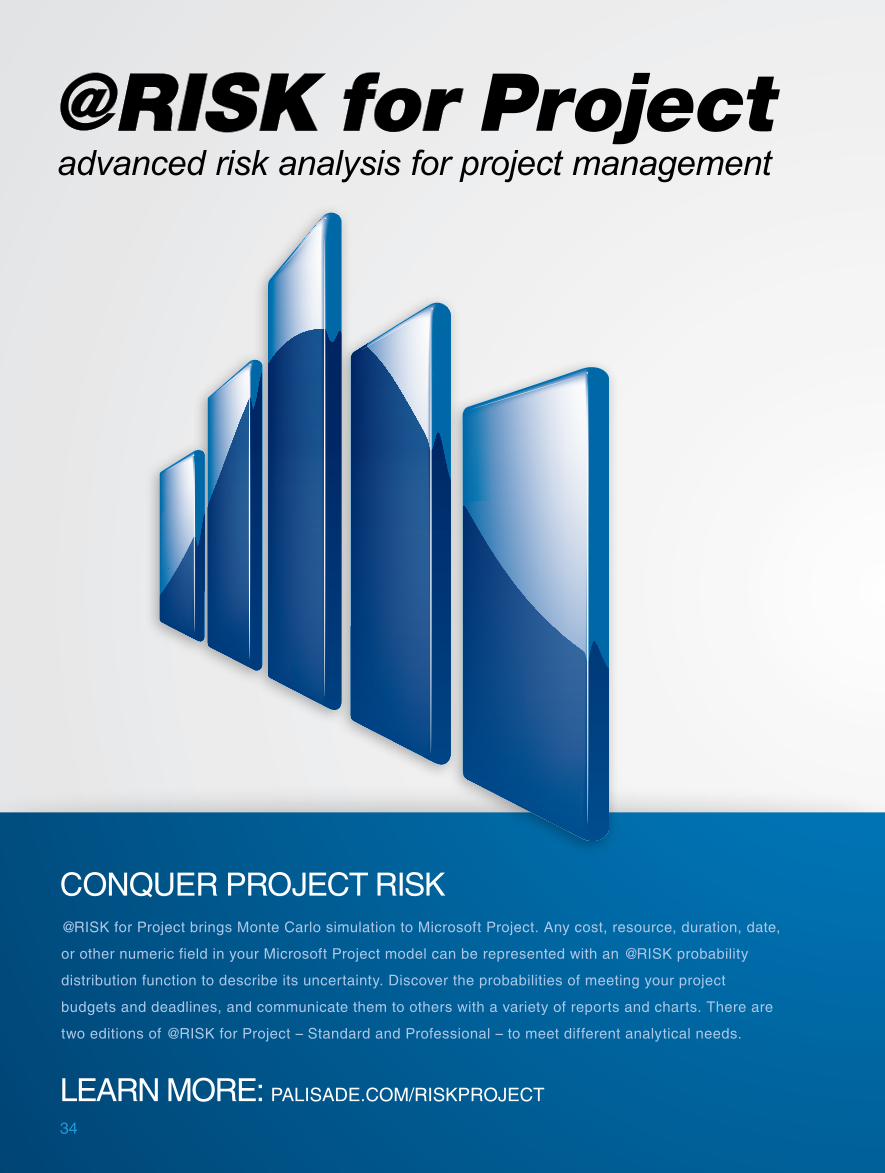
advanced risk analysis for project management
@RIsK for Project brings Monte Carlo simulation to Microsoft Project. any cost, resource, duration, date,
or other numeric field in your Microsoft Project model can be represented with an @RIsK probability
distribution function to describe its uncertainty. Discover the probabilities of meeting your project
budgets and deadlines, and communicate them to others with a variety of reports and charts. There are
two editions of @RIsK for Project – standard and Professional – to meet different analytical needs.
leaRn MoRe: PalIsaDe.CoM/RIsKPRoJeCT
34
ConQueR PRoJeCT RIsK

advanced risk analysis for project management
Professional and standard editions of @RIsK for Project offer features to meet different needs.
set up your Model with…100% Microsoft Project integration.
A thumbnail gallery of probability distributions and distribution graph overlays for comparison.
Risk categories.
Correlation of input distributions.
Distribution fitting.
Parameter entry tables.
Developer Kit.
Take your analysis To The next level with...Probabilistic branching. (Professional edition only)
IF/THEN conditional modeling. (Professional edition only)
Probabilistic calendars. (Professional edition only)
Global variables. (Professional edition only)
analyze Results with…Histograms, area, line, cumulative, summary, and overlay graphs.
Tornado charts.
Sensitivity and scenario analysis.
Risk results in Gantt chart.
Critical indices.
This lets you…Perform risk analysis where you work – in Project – without having to export to other applications.
Describe uncertain factors using multiple graphical ways.
Assign risks across sets of tasks or resources.
Represent dependency between related variables for accurate modeling.
Use historical or industry data to define distribution functions.
Quickly add or change parameters for multiple @RISK functions.
Automate and customize @RISK through a complete library of commands and functions that let you control every aspect of @RISK in Project using VBA.
This lets you…Account for chance events by allowing a project to branch from one task to any number of other tasks during simulation.
Change a project value or branch to another task if a condition is met during simulation.
Model probabilities of work stoppages due to weather, strike, or other events.
Hold values for the project as a whole that can be referenced during simulation.
This lets you…Understand and communicate insights using a variety of graphing and charting options.
Visually identify critical factors and identify trends.
Identify input distributions and combinations of inputs that had the most impact on results.
See the true critical path so you can manage resources effectively.
See the percentage of time a task is on the critical path.
This lets you…Explain Monte Carlo simulation to others.
Previous @RISK models work in latest version.
Run your Monte Carlo simulation with…Real-time updating of graphs and charts during simulation.
Backward compatibility.
Professional standard
@RIsK foR PRoJeCT feaTuRes
35

PARTNERCONSULTING
@RISK for Six Sigma
36
a key application of @RIsK is six sigma and quality analysis. Industries
ranging from engine manufacturing to precious metals to airlines and
consumer goods are using @RIsK every day to improve their processes,
enhance the quality of their products and services, and save money.
whether it’s in DMaIC, Design for six sigma (Dfss), lean projects,
Design of experiments (Doe), or other areas, uncertainty and variability
lie at the core of any six sigma analysis. @RIsK uses Monte Carlo
simulation to identify, measure, and root out the causes of variability in
your production and service processes and designs.
@RISK allows you to define Upper and Lower Specification Limits and Target values for each output, and comes complete
with a wide range of Six Sigma statistics and capability metrics on those outputs, like Cpk, Dppm (or Dpm), Sigma level,
and much more. These metrics can be placed directly in your spreadsheet model, or appear in the @RISK Results
Summary window. Output graphs show markers for LSL, USL, and Target values. The Industrial edition of @RISK
adds RISKOptimizer to your Six Sigma analyses for optimization of project selection, resource allocation, and more.
leaRn MoRe: PalIsaDe.CoM/RIsK/sIxsIgMa/
PRoCess CaPabIlITy MeTRICs In @RIsK
@RIsK geneRaTes The followIng CaPabIlITy MeTRICsRiskPNCLower Percent Nonconforming below Lower Spec Limit
RiskPNCUpper Percent Nonconforming above Upper Spec Limit
RiskPPMLower Defective Parts per Million below Lower Spec Limit
RiskPPMUpper Defective Parts per Million above Upper Spec Limit
RiskSigmaLevel Process Sigma Level
RiskUpperXBound Upper X-value for a specified number of standard deviations from the mean
RiskYV Yield Value
RiskZlower Z-Score for Lower Spec Limit
RiskZMin Process capability when special factors are removed and the process is properly centered
RiskZupper Z-Score for Upper Spec Limit
RiskCp Calculates Process Potential
RiskCpm Can be used when a target value other than the center of the specification spread has been designated as desirable
RiskCpk Calculates Process Capability
RiskCpkLower Calculates Process Capability - Upper Spec Limit
RiskCpkUpper Calculates Process Capability - Lower Spec Limit
RiskDPM Defective Parts per Million
RiskK Measure of Process Center
RiskLowerXBound Lower X-value for a specified number of standard deviations from the mean
RiskPNC Total Percent Nonconforming

at Cummins Inc. @RIsK is standard for six sigma
application: Design for six sigma
organization: Cummins Inc.
In an era when takeovers and mergers are common, Cummins, Inc., the world’s leading designer and manufacturer of engines and related systems, has remained a strong, independent, global power leader committed to the development of not only its products but its people. according to Cummins’ ernest lifferth, Director of Design for six sigma, the company’s six sigma program has a lot to do with this success, and @RIsK has a lot to do with the success of their Design for six sigma (Dfss) program. The Design for six sigma initiative is used in new product introduction. according to ernest, Design for six sigma has realized hundreds of millions of dollars in cost savings for Cummins.
“essentially what we are trying to do with the six sigma program is to cultivate an atmosphere of discipline in decision making that relies on data,” ernest says. “It’s data driven.” and of course, that’s where @RIsK has proven itself. one green belt candidate not only learned how to use the program in his decision analysis but eventually developed a methodology for managers of new product teams that incorporated @RIsK to reduce error in forecasting. “we aren’t necessarily interested in turning our engineers into statisticians, but we are interested in enabling engineers to use statistics—and @RIsK is a great tool for this.”
Cummins has standardized its six sigma decision analysis training to use @RIsK throughout the corporation, and more than 400 people in Cummins’s worldwide operations have been trained on @RIsK. because of the launch system of training—thirty or more students work through projects as green belts—that 400 figure will increase with every new launch. The longevity of both the six sigma program and the tools it introduces are built into the program. Referring back to the Cummins mission, ernest says, “This is a structured, team-based method to achieve customer objectives of cost, quality, and delivery.”
Case study Cummins inC.@RIsK in Design for six sigma
six sigma applications of @RIsK
DMAIC ∙ Design For Six Sigma ∙ Design of Experiments ∙ Lean Six Sigma
Project selection ∙ Process optimization ∙ Value stream mapping
Identify CTQs
‘‘We’ve trained over 400 people on @RISK in our Six Sigma training program.
ernest lifferth, Cummins, Inc.’’
37

38
making risk and decision analysis accessible
when performing risk and decision analysis, how you apply your software tools is
just as important as which tools you choose. Palisade Training services show you
how to apply @RIsK and the DecisionTools suite to real-life problems, maximizing
your software investment.
leaRn MoRe: PalIsaDe.CoM/TRaInIng
Palisade Training

EPalisade Training
Risk analysis within fluor has moved up to a different
level because of Palisade training on the software.
waymon lofton, fluor Corporation
D
8
on-site Training with Palisade on-site Training, you get a customized course designed around your
organization’s needs. you benefit not only from your instructor’s expertise, but the
experience of the team of consultants working to design your class. Training is
delivered at your company site, saving you travel time and cost.
Regional Training Palisade Regional Training events are professional, public two- and three-day
courses. The training is hands-on, and includes a course notebook and example
files. Palisade Training courses have been accredited by a number of industry
groups, enabling professionals in those industries to earn continuing education
credits. lunch and breaks are also provided, giving you a great opportunity to
network with other professionals.
live web Training live web Training courses are hands-on and include electronic course notes
and example files. live web Training is delivered by an expert instructor via an
interactive web session and telephone conference. with online training you can
avoid travel time and costs while still interacting with the instructor and group.
learn Direct from the source all Palisade trainers and consultants have firsthand knowledge of and access to the
latest software versions and developments. This enables them to provide unique
insights to the latest techniques to address your real-world problems. Possessing
a range of background experience – from utilities to finance, oil and gas to
environmental engineering – Palisade’s consultants are well-positioned to teach you
and your staff what you need to know to make the best possible decisions.
39

40
Conferences and Events
Palisade holds a variety of conferences, symposia, and web events around the world. In
addition, you can find us at trade shows and industry events worldwide.
Palisade Conferences & forums Palisade Risk & Decision analysis Conferences are two-day, multi-track events
featuring user case studies, hands-on software training, and presentations of the latest
DecisionTools software. hundreds of decision makers in all industries attend these
Conferences each year in europe, north america, latin america, and australia.
Palisade also offers one-day, focused forums featuring case studies and training content
tailored for specific industries or for academia. These events are perfect for professionals
seeking a short overview of analytical trends in their field.
leaRn MoRe anD see The sCheDule: PalIsaDe.CoM/useRConf

see The sCheDule: PalIsaDe.CoM/seMInaRs/webCasTs.asP
see The sCheDule: PalIsaDe.CoM/abouT/TRaDe_shows.asP
41
free live webcasts webcasts are free, 30- to 60-minute sessions delivered over the web and teleconference that present
the use of DecisionTools software on a variety of topics. sessions are presented by users in the field
as well as Palisade experts. archived webcasts may also be viewed anytime free of charge.
DTrade shows Palisade maintains an active trade show presence, hosting booths and giving presentations at industry
events around the globe. we participate at conferences in oil and gas, six sigma, operations research,
cost estimation, project management, and more.

Palisade offers business consulting and model-building services in quantitative and risk
analysis independently of the software side of our business. Clients range across all
industries and functions, and include large and small corporations, private equity firms,
and financial institutions.
leaRn MoRe: PalIsaDe.CoM/ConsulTIng
custom risk modeling and analysisBusiness Consulting
42
better Decisions from Quantitative analytics our core expertise is the use of quantitative methods to support decision making. we offer
a unique combination of powerful analytics, practical business experience, and customized
solutions. we work in a highly focused way to achieve a clear basis for decision-making
and to uncover opportunities to enhance shareholder value.
Consulting applications our core expertise is the use of quantitative analytic methods to support decision making.
we offer a unique combination of powerful analytics, practical business experience,
and customized solutions. we work in a highly focused way to achieve a clear basis for
decision-making and to uncover opportunities to enhance shareholder value.
Typical projects Palisade business Consulting can help with include:
• Spreadsheet modeling
• Risk analysis
• Business planning and business case analysis
• Market entry analysis
• Valuation
• Resource allocation under uncertainty
• Deal and incentive structures, and negotiation support
Consulting Case studies Private equity a private equity firm was contemplating the purchase of a major
insurance entity. Palisade business Consulting constructed a financial model to identify
the drivers of risk and their impact on the business. The outputs included the funding
requirements and cash generation profiles under different scenarios.
fund Management a major fund manager was presented with a multi-million
euro investment opportunity in the telecommunications industry. Palisade approached the
problem by analyzing the competition as well as the outcomes of different strategies.
Consumer Products a large food manufacturer was considering constructing a
large plant. Palisade business Consulting developed a financial model to analyze the core
business case, as well as a detailed assessment of all key risks in the project (such as
labor, schedule, and foreign exchange) and their financial implications.
43

Palisade offers custom software development services as well as software
developer kits to create your own applications integrating @RIsK, RIsKoptimizer,
and other Palisade technology. we can also help automate Palisade software
using Vba in Microsoft excel or Project.
44
leaRn MoRe: PalIsaDe.CoM/DeVeloPMenT/
personalized risk solutions for your companyCustom Development

45
software Development add @RIsK and DecisionTools to Custom applications Palisade Custom Development can incorporate Monte Carlo simulation, probability distributions,
distribution fitting, graphs, reports, and many other features of @RIsK into any windows-
based application. In addition, we can integrate genetic algorithm-based optimization from
RIsKoptimizer or evolver. This allows you to apply powerful, proven analytics to applications
outside excel. applications can be run in a desktop, network, or web environment.
Contact us for any analytical need Palisade Custom Development has written risk and decision analytics for clients separately from
our existing software technologies. we can customize any analytical solution to meet your needs.
Custom Development in excel you may wish to customize your @RIsK or DecisionTools suite spreadsheet models, restricting
access to model components for some users or automating reports and other aspects of
your analysis. using the DecisionTools built-in excel Developer Kit (xDK) and excel’s Vba
programming language, Palisade can help you build powerful, easy-to-use risk models for one
user or for an entire work group.
Development Case studies Project Risk: an engineering firm needed an excel risk solution for a large infrastructure
project. Palisade wrote an add-in that imports schedule and cost data, creates a risk register, and
uses Monte Carlo simulation to predict the probability of different schedule and cost outcomes.
web-based agricultural Risk: a research institution needed a web-based model
for assessing the risk of cattle becoming infected with a disease. using the @RIsK Developer
Kit, Palisade created an application that allows farmers around the world to analyze the risks
facing their herds and identify the optimal mitigation strategy.
Developer Kits @RISK Developer Kit
BestFit Developer Kit
Evolver Developer Kit
RISKOptimizer Developer Kit
software developer kits for @RIsK, bestfit (distribution fitting), RIsKoptimizer and
evolver are also available separately if you wish to write your own custom applications.
each comes with .Dll and activex interfaces, and supports windows and .neT
programming languages, such as C, C#, C++, Visual basic, or Visual basic .neT.

46
PalIsaDe aCaDeMIC sofTwaRe
oVeR 40,000 sTuDenTs aRe TRaIneD on DeCIsIonTools annually
Palisade DecisionTools suite Industrial software is available at significant discounts for academic users through a variety of programs.
The leverage you get by using these tools
in excel is phenomenal. My [Mba and
executive education] students can very
quickly learn and apply the techniques they
see in class to difficult decision-
making problems faced by their firms.
Dr. Phil Rogers, university of houston’s C. T. bauer College of business

47
Textbooks bundled with Palisade software DecisionTools software is included with an increasing number of top Mba
textbooks published today. used at top business schools worldwide, over
40,000 students per year are learning to make better decisions using
DecisionTools software.
see a lIsT of TexTbooKs InCluDIng DeCIsIonTools sofTwaRe: PalIsaDe.CoM/aCaDeMIC/TexTbooKs.asP
Course licenses available at over 95% off retail price, the DecisionTools suite Course license
is for professors and instructors who want to use DecisionTools as part of their
curriculum. Course licenses are an economical and trouble-free solution that
enables schools to install DecisionTools in a computer lab, on individual machines,
or on a secure server for students to download to their computers. The software
is fully functional with no model size limitations and is available for twelve month
licenses, renewable annually to ensure the latest version.
student Versions also available at over 95% off retail price, the DecisionTools suite student
Version is for individual full-time and part-time students. student Versions are fully
functional with no model size or functional limits. They expire twelve months after
installation and may be installed on one machine.
full academic Versions available at a significant discount off the retail price, the DecisionTools suite full
academic Version is perfect for professors, instructors, researchers, administrators,
and support staff of accredited academic institutions who use the software for non-
teaching purposes. It has no model size, functional, or time limitations.
leaRn MoRe: PalIsaDe.CoM/aCaDeMIC
oVeR 40,000 sTuDenTs aRe TRaIneD on DeCIsIonTools annually

MaInTenanCe PlansMaintenance is included for 12 months with your initial software purchase,
and is renewable every year. benefits of maintenance include:
free software upgrades and updates. Major version upgrades are released when significant new features
and/or interface changes are made to the software. software updates are often
released to keep current with changes in windows, excel or Project, and may also
include bug fixes or minor product enhancements.
free, unlimited technical support if you need help operating the software or resolving errors.
leaRn MoRe: PalIsaDe.CoM/lICensIng_oPTIons
lICensIng oPTIonsPalisade offers a range of software licensing options designed to help businesses and
organizations meet their risk and decision analysis needs in the most efficient manner
possible. Most Palisade software uses industry-standard flexnet licensing technology
for maximum ease of deployment and flexibility.
stand alone licenses are intended for use by one person on one computer.
Concurrent network licenses serve multiple users from a network server.
enterprise activation server licenses allow you to grant and manage stand-alone licenses yourself.
Palisade corporate licenses are purchasing options that enable you to get the most
software for your money, deployed in the most efficient manner possible. Corporate
licenses are available for a particular site or for larger groups beyond a physical location.
They ensure version consistency, eliminate IT compliance hassles, and save money.
leaRn MoRe: PalIsaDe.CoM/suPPoRT/MaInTenanCe.asP
48

pa
lis
ad
e.c
om
E x p E r i E n c E t h E
W o r l d ’s l E ad i n g
r i s k a n d d E c i s i o n
a n a lys i s s o f t Wa r E
a n d so l u t i o n sPalisade Corporation [email protected]
tel: +1 607 277 8000 800 432 RISK fax: + 1 607 277 8001
Palisade Europe [email protected]
tel: +44 1895 425050 fax: +44 1895 425051 UK: 0800 783 5398 France: 0800 90 80 32 Germany: 0800 181 7449 Spain: 900 93 8916
Palisade Asia-Pacific [email protected]
tel: +61 2 9929 9799 1 800 177 101 fax: +61 2 9954 3882
Palisade Latinoamérica www.palisade-lta.com
[email protected] tel: +1 607 277 8000 fax: + 1 607 277 8001
Palisade Brazil www.palisade-br.com
[email protected] tel: +1 607 277 8000 fax: + 1 607 277 8001
palisade.com
ex
pe
rie
nc
e t
he
Wo
rl
d’s
le
ad
ing
ris
k a
nd
de
cis
ion
an
aly
sis
so
ft
Wa
re


