13B SOLUTION CONCENTRATION Essential Chemistry 13 Investigations How can you use light to determine the concentration of a solution? Device with SPARKvue software Colorimeter 40.0 mL, copper(II) sulfate, 0.10M Test tubes, 20 mm x 150 mm (6) Graduated Cylinder, 100mL (2) Marker Cuvettes (7) Test tube rack Stirring rod Have you ever added more and more of an item and seen the color of the solution deepen? Analytical chemists, particularly in the agricultural and medical fields, routinely use a quantitative approach called spectroscopy to determine the concentration of solute in a solution as it relates to the color of the solution. While we can roughly tell how many items are dissolved based on color, spectroscopy allows us to assign numbers to the dissolved items. Beer’s Law states that the absorbance of a solution (A) is directly proportional to its concentration (M). You will first determine the relationship between absorbance and molarity for a known concentration of CuSO . You will then use this relationship to construct a calibration curve. The standard curve will be used to determine the concentration of a solution of unknown molarity of copper(II) sulfate. Follow these important safety precautions in addition to your regular classroom procedures. Wear safety goggles at all times. Part 1 − Known concentrations 1. Open SPARKvue. 2. Connect the Colorimeter. 4 Investigation 13B: Solution Concentration 139
How can you use light to determine the concentration of a solution?
Device with SPARKvue softwareColorimeter40.0 mL, copper(II) sulfate, 0.10MTest tubes, 20 mm x 150 mm (6)Graduated Cylinder, 100mL (2)
MarkerCuvettes (7)Test tube rackStirring rod
Have you ever added more and more of an item and seen the color of the solution deepen? Analyticalchemists, particularly in the agricultural and medical fields, routinely use a quantitative approach calledspectroscopy to determine the concentration of solute in a solution as it relates to the color of the solution.While we can roughly tell how many items are dissolved based on color, spectroscopy allows us to assignnumbers to the dissolved items. Beer’s Law states that the absorbance of a solution (A) is directlyproportional to its concentration (M). You will first determine the relationship between absorbance andmolarity for a known concentration of CuSO . You will then use this relationship to construct acalibration curve. The standard curve will be used to determine the concentration of a solution ofunknown molarity of copper(II) sulfate.
Follow these important safety precautions in addition to your regular classroom procedures.
Wear safety goggles at all times.
Part 1 − Known concentrations
1. Open SPARKvue.
2. Connect the Colorimeter.
4
Investigation 13B: Solution Concentration 139
Solution Concentration
3. Add 3 mL of distilled water to a clean cuvette. This is your reference measurement.
4. Calibrate the colorimeter with the cuvette containing distilled water (the water sample is called a "blank"). Note: It is important to wipe off the sides of the cuvette before placing it into the colorimeter!
5. Open the 13B Solution Concentration lab file in SPARKvue under Experiments > Essential Chemistry.
6. Obtain about 40 mL of a 0.20 M CuSO4(aq).
7. Prepare Solution A by filling a test tube with 10 mL of the 0.10 M CuSO4(aq). Label the test tube "A."
8. Prepare Solution B by adding 8.0 mL of the 0.10 M CuSO4(aq) to an empty 10mL graduated cylinder. Fill to the 10mL mark with water. Stir and transfer to a test tube. Label this test tube "B." Rinse and dry the graduated cylinder so you can prepare the next solution.
9. Prepare Solution C by adding 6.0 mL of the 0.10 M CuSO4(aq) to an empty 10mL graduated cylinder. Fill to the 10mL mark with water. Stir and transfer to a test tube. Label this test tube "C." Rinse and dry the graduated cylinder so you can prepare the next solution.
10. Prepare Solution D by adding 4.0 mL of the 0.10 M CuSO4(aq) to an empty 10mL graduated cylinder. Fill to the 10mL mark with water. Stir and transfer to a test tube. Label this test tube "D." Rinse and dry the graduated cylinder so you can prepare the next solution.
11. Prepare Solution E by adding 2.0 mL of the 0.10 M CuSO4(aq) to an empty 10mL graduated cylinder. Fill to the 10mL mark with water. Stir and transfer to a test tube. Label this test tube "E."
12. Determine the molarity for all solutions. Solution A has a molarity of 0.20 M. For solution B (first dilution), the original molarity is M1 = 0.20 M, and the volume is V1 = 8.0 mL. We are solving for the new molarity (M2). The final volume is V2 = 10.0 mL. Record the molarities of all solutions in Table 1.
13. Place about 3 mL of each solution into a clean cuvette. Make sure the cuvette is at least ¾ full.
14. Start collecting data.
15. Insert the cuvette that contains Solution A and select the check mark to record the values for absorbance at all available wavelengths. Repeat this for each cuvette and transfer the data to Table 1.
140 Chapter 13: Investigations Solutions
Solution Concentration
16. Discard the solutions in the test tubes and the cuvettes.
17. Rinse the graduated cylinder, test tubes, cuvettes, and pipettes with clean water.
18. Stop data collection.
Table 1 − Known concentration and absorbance
Test tubelabel
Molarity (mol/L)
RedAbs
650 nm
OrangeAbs
600 nm
YellowAbs
570 nm
GreenAbs
550 nm
BlueAbs
500 nm
VioletAbs
450 nmABCDE
19. Referring to your data table, which color of light absorbs the most light at all the concentrations?
20. Go to Page 2 of the SPARKlab. You should see a graph of Red Absorbance (yaxis) vs Concentration.If necessary, change the yaxis to the color of light that absorbs the most light at all the concentrations.Sketch the graph below.
Graph 1 − Absorbance vs. Concentration
21. Apply a Linear fit to determine the slope and intercept of the graph. What is the line expression for thegraph?
22. Based on the "r" value, was the linear relationship a good fit for the data?
Investigation 13B: Solution Concentration 141
0.20
Solution Concentration
Part 2 − Unknown concentration
1. Your teacher will provide you with a copper(II) sulfate solution that has an unknown concentration. Ifthere is more than one unknown, record the solution label Table 2.
2. Obtain 10 mL of the unknown solution of CuSO provided by your instructor. Put it in a clean cuvette,and make certain that the liquid is at the same level as the other cuvettes.
3. Go to the next page of the SPARKlab. You should see a digits display of Absorbance for all the colorsof light.
4. Start data collection.
5. Find the color that matched the graph you made with known concentrations in the first part of theinvestigation. Record the Absorbance in Table 2.
Table 2 − Unknown concentration and absorbance
Test tube label Absorbance Molarity (mol/L)
6. Using the line expression from the first part of the investigation, calculate the molarity of the unknownsolution. Your Absorbance is the y value. You will need to solve for x. Show you work!
Part 2 − Unknown concentration
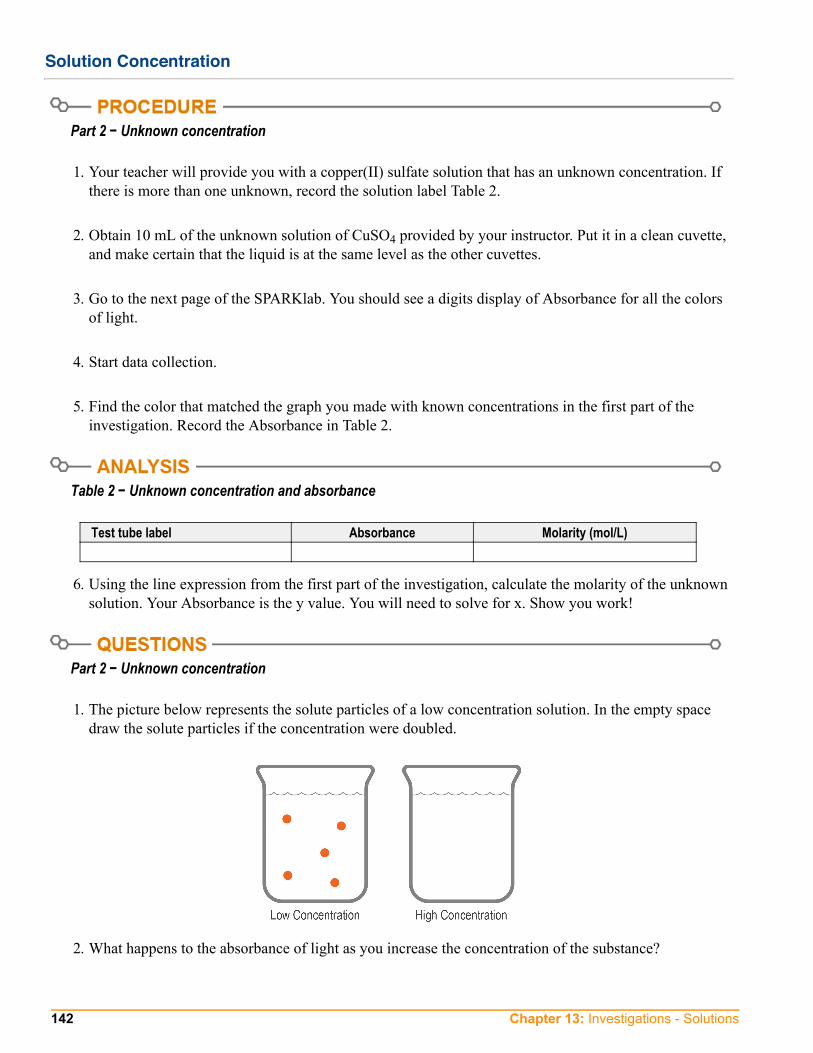
1. The picture below represents the solute particles of a low concentration solution. In the empty spacedraw the solute particles if the concentration were doubled.
2. What happens to the absorbance of light as you increase the concentration of the substance?
4
142 Chapter 13: Investigations Solutions
Solution Concentration
3. Do you think this is a reliable method for determining the concentration of a known solution?
4. How do your results for the unknown compare to those of your classmates?
5. Your teacher will tell you the real concentration of the unknown solution. Determine the percent errorfor your experiment.
6. What would likely be the largest source of error? Explain.
Investigation 13B: Solution Concentration 143
EC-6352-LAB-13B-BL 1
SOLUTION CONCENTRATION
Analysis – Known Concentrations Table 1 – Known concentration and absorbance
Test tube label
Molarity (mol/L)
Red Abs 650 nm
Orange Abs 610 nm
Yellow Abs 570 nm
Green Abs 550 nm
Blue Abs 500 nm
Violet Abs 450 nm
A
B
C
D
E
19. Referring to your data table, which color of light absorbs the most light at all the concentrations?
Graph 1 – Absorbance vs. Concentration
21. Apply a Linear fit to determine the slope and intercept of the graph. What is the line expression for the graph?
SOLUTION CONCENTRATION
2 EC-6352-LAB-13B-BL
22. Based on the “r” value, was the linear relationship a good fit for the data?
6. Using the line expression from the first part of the investigation, calculate the molarity of the unknown solution. Your Absorbance is the y value. You will need to solve for x. Show you work!
Questions – Unknown concentration
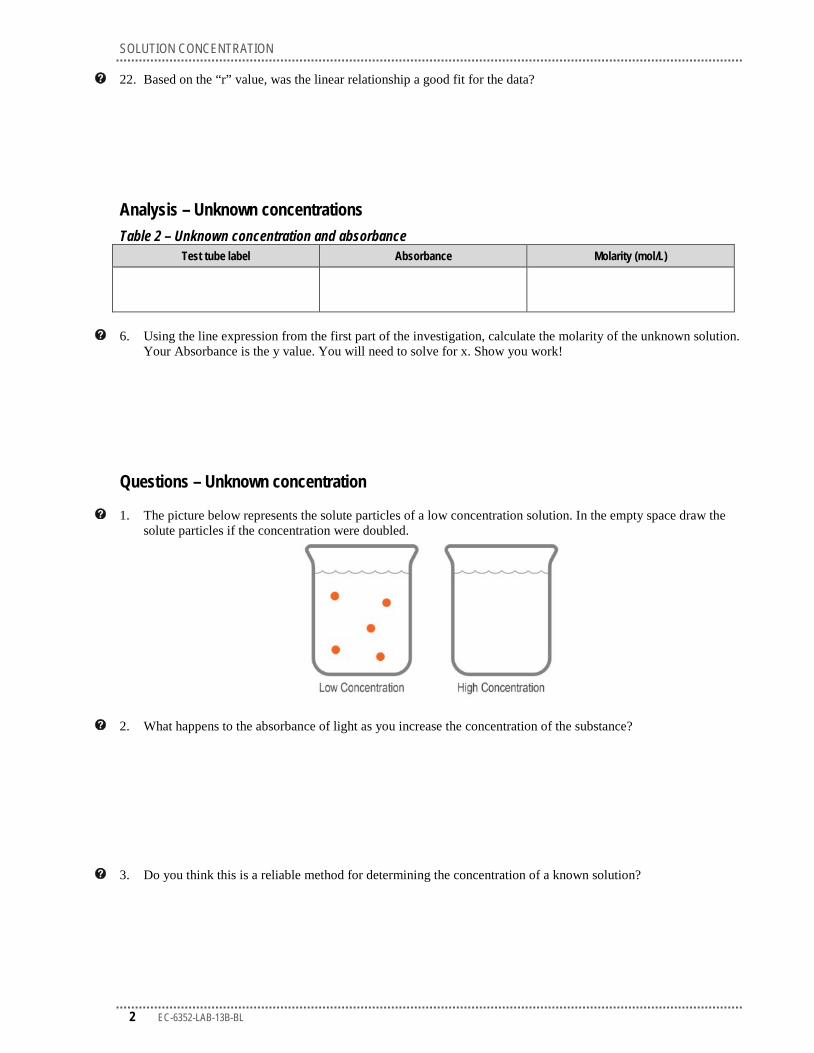
1. The picture below represents the solute particles of a low concentration solution. In the empty space draw the solute particles if the concentration were doubled.
2. What happens to the absorbance of light as you increase the concentration of the substance?
3. Do you think this is a reliable method for determining the concentration of a known solution?
SOLUTION CONCENTRATION
EC-6352-LAB-13B-BL 3
4. How do your results for the unknown compare to those of your classmates?
5. Your teacher will tell you the real concentration of the unknown solution. Determine the percent error for your experiment.
6. What would likely be the largest source of error? Explain.