EXPERIMENT 2 Bragg Diffraction and Measurements of Crystal Unit Cells NOTICE: The X-ray apparatus must first be explained and powered by the demonstrator before you use it. Introduction The study of X-rays and their interactions has played a very significant role in the development of atomic physics over the last 100 years. Nowadays, X-rays have many routine practical applications in medicine and industry. Because they can penetrate several centimeters of solid matter, they can be used to visualize the interiors of materials that are opaque to ordinary light, such as broken bones or defects in structural steel. The object to be visualized is placed between an X-ray source and a large sheet of photographic film; the darkening of the film is proportional to the radiation exposure. A crack or air bubble allows greater transmission and shows as a dark area. Bones appear lighter than the surrounding soft tissue because they contain greater proportions of elements with higher atomic number (and hence greater absorption); in the soft tissue the light elements carbon, hydrogen, and oxygen predominate. Recently, several vastly improved X-ray techniques have been developed. One widely used system is computerized axial tomography; the corresponding instrument is called a CAT scanner. The X-ray source produces a thin, fan-shaped beam that is detected on the opposite side of the subject by an array of several hundred detectors in a line. Each detector measure absorption along a thin line through the subject. The entire apparatus is rotated around the subject in the plane of the beam during a few seconds. The changing photon-counting rates of the detectors are recorded digitally; a computer processes this information and reconstructs a picture of absorption over an entire section of the subject. Differences as small as 1% can be detected with CAT scans, and tumours and other anomalies that are much too small to be seen with older X-ray techniques can be detected. Naturally, to correctly interpret the results obtained from such measurements, a complete under- standing of the behaviour of X-rays is required. In this and a subsequent practical you will carry out a range of experiments aimed at helping you understand: • The production and properties of X-rays 2-1
Transcript
EXPERIMENT 2
Bragg Diffraction and Measurements of Crystal Unit Cells
NOTICE: The X-ray apparatus must first be explained andpowered by the demonstrator before you use it.
IntroductionThe study of X-rays and their interactions has played a very significant role in the development ofatomic physics over the last 100 years. Nowadays, X-rays have many routine practical applicationsin medicine and industry. Because they can penetrate several centimeters of solid matter, they canbe used to visualize the interiors of materials that are opaque to ordinary light, such as brokenbones or defects in structural steel. The object to be visualized is placed between an X-ray sourceand a large sheet of photographic film; the darkening of the film is proportional to the radiationexposure. A crack or air bubble allows greater transmission and shows as a dark area. Bones appearlighter than the surrounding soft tissue because they contain greater proportions of elements withhigher atomic number (and hence greater absorption); in the soft tissue the light elements carbon,hydrogen, and oxygen predominate.
Recently, several vastly improved X-ray techniques have been developed. One widely usedsystem is computerized axial tomography; the corresponding instrument is called a CAT scanner.The X-ray source produces a thin, fan-shaped beam that is detected on the opposite side of thesubject by an array of several hundred detectors in a line. Each detector measure absorption alonga thin line through the subject. The entire apparatus is rotated around the subject in the plane ofthe beam during a few seconds. The changing photon-counting rates of the detectors are recordeddigitally; a computer processes this information and reconstructs a picture of absorption over anentire section of the subject. Differences as small as 1% can be detected with CAT scans, andtumours and other anomalies that are much too small to be seen with older X-ray techniques canbe detected.
Naturally, to correctly interpret the results obtained from such measurements, a complete under-standing of the behaviour of X-rays is required. In this and a subsequent practical you will carryout a range of experiments aimed at helping you understand:
• The production and properties of X-rays
2-1
Experiment 2. Bragg Diffraction and Measurements of Crystal Unit Cells
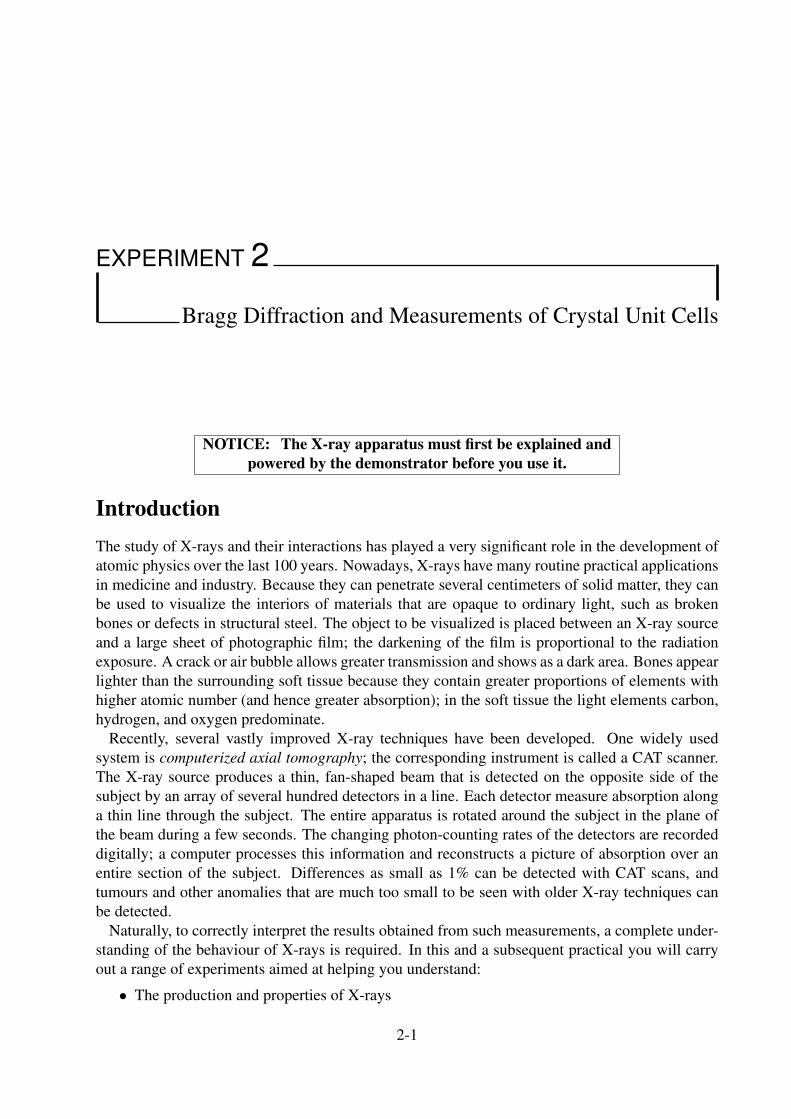
Figure 2.1: The distribution by wavelength of the X-rays produced when 35-keV electrons strike amolybdenum target. Note the sharp peaks standing out above a continuous background.
• The factors governing the appearance of X-ray spectra
• X-ray (Bragg) diffraction and crystal structures
• The processes of X-ray scattering and absorption
These experiments are highly relevant to course material covered in EP2.3 and EP2.4.
Continuous and Characteristic X-ray Spectra
X-rays are produced when energetic electrons strike a solid target and are brought to rest in it.Fig. 2.1 shows the wavelength spectrum of the X-rays that are produced when a beam of 35 keVelectrons strikes a molybdenum anode. It consists of a broad spectrum of radiation (continuousspectrum) on which are superimposed peaks of sharply defined wavelengths (characteristic X-rayspectrum).
The continuous spectrum arises from the deceleration of the electrons in the target. An electronmay well lose an amount of energy in its encounter with the target nucleus which will appear asthe energy of an X-ray that is radiated away. This process is called bremsstrahlung (or ‘brakingradiation’) and has been discussed in first year lectures.
A prominent feature of the continuous spectrum of Fig. 2.1 is the sharply defined cutoff wave-length λmin, below which the continuous spectrum does not exist. This minimum wavelengthcorresponds to an encounter in which one of the incident electrons, still with its initial kinetic en-ergy eV, loses all this energy in a single encounter, radiating it away as a single X-ray photon. The
2-2
Experiment 2. Bragg Diffraction and Measurements of Crystal Unit Cells
wavelength associated with this photon, the minimum possible X-ray wavelength, is found from
eV = hν =hc
λmin
, (2.1)
which yields
λmin =hc
eV(cutoff wavelength) (2.2)
The cutoff wavelength is totally independent of the target material. If you were to switch froma molybdenum to a copper target, for example, all features of the X-ray spectrum of Fig. 2.1would change except the cutoff wavelength. It follows from Eq. 2.2 that Planck’s constant can bedetermined if the cutoff wavelength is known. This provides a very accurate method of measuringthis fundamental physical constant and details of the measurements required are given below.
The peaks labeled Kα and Kβ in Fig. 2.1 and any other peaks that may occur at longer wave-lengths are characteristic of the target material and form what we call the characteristic X-rayspectrum. The X-ray photons that produce these peaks are created as follows:
1. An energetic incoming electron strikes an atom in the target and knocks out one of the deeplying electrons. If the electron is in the shell with n = 1 (called, for historical reasons, the Kshell), there remains a vacancy or a hole in this shell.
2. One of the outer electrons moves in to fill this hole and in the process emits an X-ray photonof characteristic wavelength.
If the electron falls from the shell with n = 2 (called the L−shell) into the K-shell we have the Kα
line of Fig. 2.1; if it falls from the shell with n = 3 (called the M−shell) we have the Kβ line; andso on. Of course, such a transition will leave a hole in either the L or the M shell, but this willbe filled in by an electron from still farther out in the atom, causing the emission of yet anothercharacteristic X-ray photon.
Fig. 2.2 shows an X-ray energy level diagram for molybdenum, the element to which Fig. 2.1refers. The base line (E = 0) represents, the neutral atom in its ground state. The level markedK (at E = -20 keV) represents the energy of the molybdenum atom with a hole in its K-shell.Similarly, the level marked L (at E = - 2.7 keV) represents the energy of the atom with a hole in itsL-shell, and so on. The transitions marked Kα and Kβ in Fig. 2.2 show the origins of the two sharpX-ray lines in Fig. 2.1. The Kα line, for example, originates when an electron from the L-shell ofmolybdenum fills a hole in the K-shell.
X-Ray Diffraction by CrystalsIn 1912 Max von Laue (1879-1960) suggested an experiment that verified the wave nature ofX-rays. Von Laue pointed out that if X-rays have wavelengths λ that are about the same as thespacing d between planes of atoms in crystals, then X-ray waves impinging on crystals wouldexhibit interference effects. Recall that a transmission grating, because it consists of a regulararray of slits, causes light waves to exhibit strong constructive interference at a few particularangles and almost complete cancellation at all other angles. To observe these interference effects,the slit spacing must be almost as small as the wavelength. Similarly, a crystalline solid consists
2-3
Experiment 2. Bragg Diffraction and Measurements of Crystal Unit Cells
Figure 2.2: An atomic energy level diagram for molybdenum, showing the transitions that give riseto the characteristic X-rays of that element. (All levels except the K-level consist of a number ofclosely lying components, not shown here.)
of a regular array of atoms. When a beam of X-rays impinges on a crystal, strong constructiveinterference effects can be observed readily if the wavelength λ is somewhat smaller than theinterplanar spacing d in the crystal.
Fig. 2.3 shows a two-dimensional representation of a three-dimensional crystal; the rows of dotsportray planes of atoms. X-rays of a single wavelength are in phase before being scattered from theatoms in plane A and the atoms in plane B . For constructive interference of the X-rays scatteredfrom each plane of atoms, the angle of incidence turns out to be equal to the angle of reflection.To reach the detector, the waves scattered from the atoms in plane B travel a greater distance thanthose scattered from the atoms in plane A by the amount 2(d sin θ). If the angle θn is given by therelation
2d sin θn = nλ (n = 1, 2, . . .)
then the waves scattered from the atoms in plane A will arrive at the detector in phase with thewaves scattered from the atoms in plane B. Thus the waves will constructively interfere and pro-duce an interference maximum. Similarly, constructive interference will occur for waves scatteredfrom the atoms of each of the many planes that are parallel to planes A and B. This relation wasfirst developed by W.L. Bragg (1890-1971) and is called Bragg′s law. You will use this techniquewith crystals of NaCl and LiF to record the continuous and characteristic spectrum emitted fromthe copper target in the X-ray tube.
2-4
Experiment 2. Bragg Diffraction and Measurements of Crystal Unit Cells
Plane A
Plane B
Ref lected WavesIncident Waves
m
d
d Sin d Sin
m
Figure 2.3: To reach the detector, X-ray waves reflected from plane B must travel a distance2(d sin θ) farther than those reflected from plane A. The waves constructively interfere at the de-tector when 2d sin θ = nλ.
The X-ray ApparatusThe X-ray apparatus is shown in Fig. 2.4. The high voltage can be set to 30,000 volts or 20,000volts and the X-rays are produced when the accelerated electrons bombard a copper target, knock-ing out inner shell (K) electrons. L & M shell electrons drop into the K-shell vacancies producingx-rays at characteristic energies : Kα and Kβ radiation. The X-ray emission from the tube is colli-mated at the lead glass dome to be a circular beam of 5mm diameter (Fig. 2.4), this primary beamdiverges from the Basic Port to a useful beam diameter at the Crystal Port of 15mm diameter, atExperimental station (ES) 30mm diameter. A Geiger Muller tube, operated at a plateau voltage of425 volts is used to detect the X-rays. An interlock safety system is used to ensure that the X-raytube cannot be powered unless the scatter shield is in place. An additional glass cover is used toensure that the residual X-ray level from the apparatus is below the background radiation level inthe laboratory.
Experimental Procedures
X-ray Diffraction : Wavelength Measurement with the Bragg MethodSir Lawrence Bragg presumed that the atoms of a crystal such as Sodium Chloride were arrangedin a cubic and regular three-dimensional pattern.
The mass of a molecule of NaCl is M/N Kg, where M is the molecular weight (58.46× 10⁻³ kgper mole) and N is Avogadro’s number (6.02× 10²³ molecules per mole).
The number of molecules per unit volume is ρ/MN
molecules per cubic metre, where ρ is thedensity (2.16× 10³ kg m−3).
Since NaCl is diatomic the number of atoms per unit volume is 2ρN/M atoms per cubic metre.The distance therefore between adjacent atoms, d in the lattice is derived from the equation
d3 =1
2ρN/Mor d =3
√m/2ρN
2-5
Experiment 2. Bragg Diffraction and Measurements of Crystal Unit Cells
Thumb Wheel
Cubic Crystal
Clamping post
Clamping jaw
Chamfered Post
Slave Plate
Knurled clutch plate
Geiger Tube
ES spring Clip
Carriage Arm
Manual Control
Crystal Post
Basic Port
Figure 2.4: X-Ray Apparatus
2-6
Experiment 2. Bragg Diffraction and Measurements of Crystal Unit Cells
Figure 2.5: Count rate as a function of angle (2θ) in a NaCl crystal for accelerating voltages of20kV and 30kV
Work out ‘d’ for NaCl from this information.
* NB. Please ensure all items are returned to the box after use.Set-up :
1. Mount the NaCl crystal, TEL 582.004, in the crystal post, ensuring that the major face having“flat matt” appearance is in the reflecting position.
2. Locate Primary Beam Collimator 582.001 in the Basic Port with the 1mm slot vertical.
3. Mount Slide Collimator (3mm) 562.016 at Experimental Station(ES) 13 and Collimator(1mm) 562.015 at ES 18.
4. Zero-set and lock the Slave Plate and the Carriage Arm cursor as precisely as possible.
5. Sight through the collimating slits and observe that the primary beam direction lies in thesurface of the crystal.
6. Mount the G.M tube and it’s holder at ES 26.
7. Select the 30keV and set the tube current at 50 µA. Monitor this current carefully throughoutthe experiment. It should not vary by more than 10%. Any anomalies in the tube currentbehaviour should be reported immediately. Using a Ratemeter track the Carriage Arm roundfrom its minimum setting (about 11◦, 2θ) to maximum setting (about 124◦, 2θ).
Plot on graph paper the count rate at 1◦ (2θ) intervals, using an integration time of 10-30s tominimise statistical errors.
Where the count rate appears to peak, plot intervals of only 10’arc using the thumb-wheelat each peak, measure and record the maximum count rate and the angle 2θ as precisely aspossible.
8. Select 20kV and repeat step 7 above.
2-7
Experiment 2. Bragg Diffraction and Measurements of Crystal Unit Cells
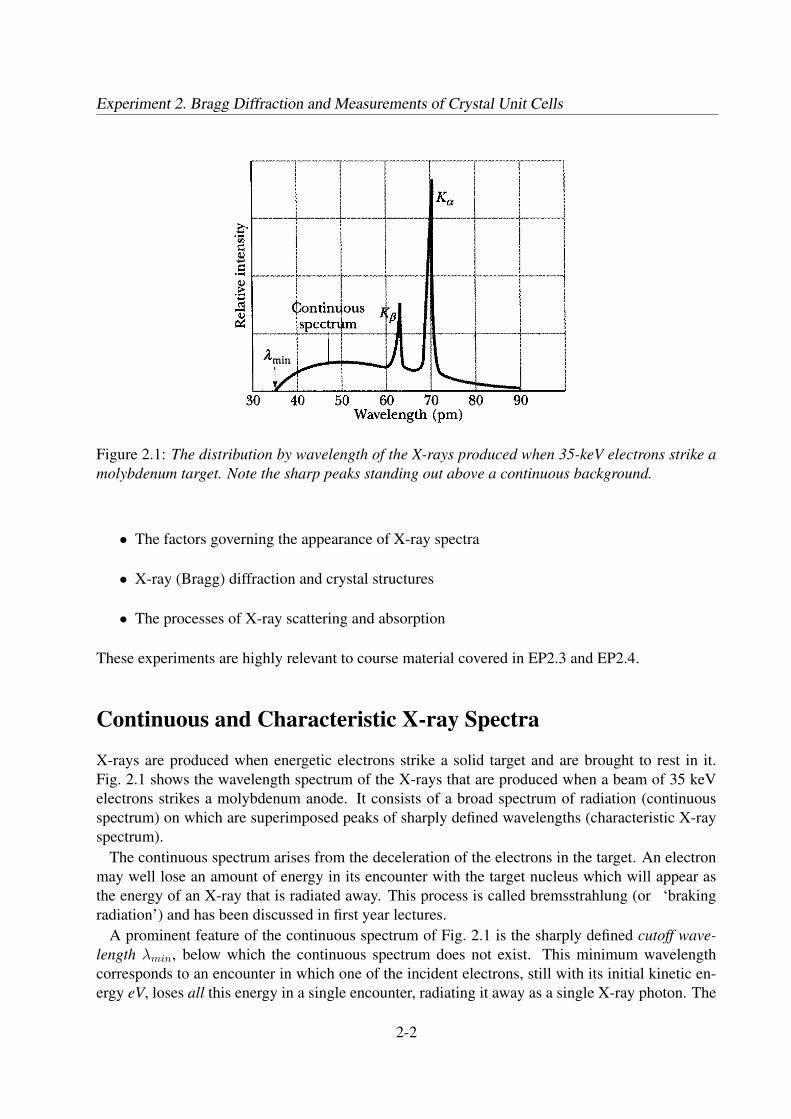
Table 2.1: Results obtained for NaCl crystal
Feature 2 θ θ sin θ 2 d n λ n345678
Observe that the continuous spectra of “white” radiation exhibit peak intensities (Fig. 2.5.5feature 2) and intercepts on the 2θ axis (feature 1) which vary with the voltage setting of theX-ray tube.
The six peaks, features 3 to 8, superimposed on the continuous spectrum do not vary in angle2θ with voltage setting, but only in amplitude.
9. Tabulate the results from the six superimposed peaks of the graph and calculate λ and n asshown in Table 2.1.
Observe that the sharp peaks 3 and 4 are a pair of “emission lines” which re-appear in secondand third orders of diffraction.
The more energetic radiation, termed Kβ , is successively less intense than the longer wave-length, Kα, line.
10. Repeat the procedure with the LiF crystal in place of the NaCl.
Measurement of Atomic Sizes1. Set up for Bragg reflection as in parts 1 - 6 of the previous section.
2. Minimise the CuKβ radiation by inserting the Ni filter TEL 564.004 at ES 17.
3. Increase the tube current to 70 µA. Monitor the current carefully throughout the experiment.It should not exceed 80 µA at any time.
4. Using a Ratemeter, search and record the 2θ angle for the first diffraction peak for CuKα
radiation, λ = 0.154nm.Tabulate and calculate d, assuming n = 1 in the Bragg equation nλ = 2d sin θ (see Table 2.2).
5. Repeat the experiment using the KCl crystal (Green).
6. Repeat the experiment using the RbCl crystal (Red).
Observe that the crystal spacing, d, increases with the Atomic Number of the Alkaline metals;Na in the third period has eleven electrons at K, L and M levels; K in the fourth period has nineteen
2-8
Experiment 2. Bragg Diffraction and Measurements of Crystal Unit Cells
Table 2.2: Tabulation of interatomic spacings for different crystals
Crystal 2θ θ sin θ λ/2 d nmNaCl (yellow) 0.077KCl (green) 0.077RbCl (red) 0.077
electrons but in the K, L, M and N states, whereas Rb has thirty seven electrons in the five energystates, K, L, M, N and O. Chlorine is common to the three compounds and thus the evidencesuggests that the size of individual atoms increases with atomic number.
Crystallography is not a ‘direct’ science; crystal structures are postulated after interpretation ofall the evidence available including the morphological, the optical and the chemical properties ofthe specimen; the alkaline halides are both morphologically and chemically similar and the studentcould expect that these salts will exhibit similar crystal structures. The size of atoms is of greatimportance in metallurgy when studying crystal cohesion and in the development of alloys havingspecific mechanical properties.
Unit Cell Calculations
Table 2.2 was drawn up from angular measurements of the first Bragg peaks and defines the largestspacing within the three crystals which give rise to constructive interference.
Clearly, sets of planes can be chosen which have greater spacing, but if there are no Braggreflections, the interference must be destructive and not constructive.
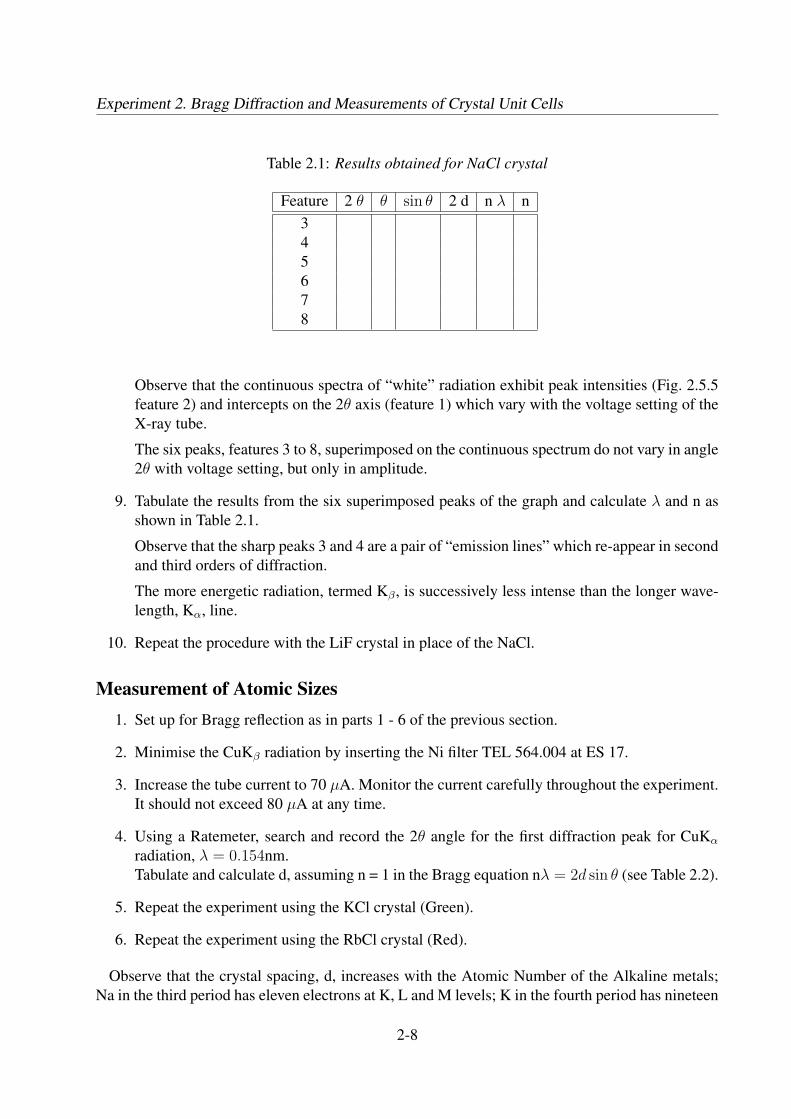
A plan view of a model of NaCl exhibits a pattern of repetitive symmetry (Fig. 2.6) and one ofthe first objectives in crystallography is to establish the linear repetition frequency of a symmetricalpattern in each of three dimensions.
In the a-direction illustrated, the symmetrical structure bordered by layers a1 and a3 is repeatedby a3 and a5 and a7 etc.; an identical geometric form can be repeated by choosing a2/a4, a4/a6 etc.
Accepting that NaCl has a cubic structure, a symmetrical pattern should be evident in both theb- and c- axes and hence a “building block” can be defined as indicated by the bold line, the natureof the atoms at the vertices being consistently either Cl or Na.
Earlier the distance between adjacent unlike atoms, Na and Cl, d was calculated to be 0.282 nm;the distance between two like atoms, Cl and Cl is twice the spacing and hence the length of the
Table 2.3: Tabulation of Unit Cell Calculations.
Crystal Unit Cell Side ‘a’ nmNaClKClRbCl
2-9
Experiment 2. Bragg Diffraction and Measurements of Crystal Unit Cells
side of the “building block” is 0.564 nm.This repetitive geometric figure, when established in 3-dimensions, is defined as the UNIT
CELL. Where a choice exists with geometric forms of identical area then the form most clearlyapproaching rectangular is usually adopted.
From Fig. 2.6 the length of the edge of the Unit Cell of NaCl in the arbitrary a- direction is 2d.Similarly ‘a’ can be established for the Unit Cells of KCl and RbCl (Table 2.3).
Reflections are not observed for spacings equivalent to the side of the Unit Cell by virtue ofdestructive interference.
When waves from layer a3 are one wavelength behind those from layer a1, then waves from layera2 must be half a wavelength lagging on those from layer a1 and exactly opposite in phase; sincethe layers throughout the crystal contain the same combination of atoms of Na and Cl, the electrondensities are the same and so the diffractive power of the layers is identical; the waves from layera2 therefore exactly cancel out those from a1.
Determination of Minimum Wavelength and hence Planck’s ConstantIn striking the Copper anode the majority of electrons experience nothing spectacular; they un-dergo sequential glancing collisions with particles of matter, lose their energy a little at a time andmerely increase the average kinetic energy of the particles in the target; the target gets hot. Theminority of electrons will undergo a variety of glancing collisions of varying severity; the elec-trons are decelerated imparting some of their energy to the target particle and some in the form of
2-10
Experiment 2. Bragg Diffraction and Measurements of Crystal Unit Cells
electromagnetic radiation equivalent in energy to the energy loss experienced at each collision.Since these collisions usually occur at a slight depth within the target the longer, less energetic,
wavelengths are absorbed within the target material.This “bremsstrahlung” or “braking radiation” is thus a continuous spread of wavelengths, the
minimum wavelength (or maximum energy) being determined by the accelerating voltage of thetube.
λmin = f(
1
V
)or V λmin = k
where V is the X-ray tube voltage selected.
1. Counts should be recorded over at least 10 second durations, the longer the counting periodthe greater the accuracy of the results.
2. Mount the auxiliary slide carriage in horizontal mode using the 1mm slot Primary BeamCollimator (vertical) as follows:The hole in the end face of the Auxiliary Carriage is placed over the basic port in the glassdome and then held in that position by one or other of the Primary collimators. In this modethe axis of the centre of each experimental slide is horizontal and is transcribed by the X-raybeam. Note that the carriage arm is now restricted to a maximum 2θ angle of 100◦.
3. Position the Slide Collimator, (1mm slot) 562.015 at ES 4 and Slide Collimator (3mm)562.016 at ES 13.
4. With the LiF crystal mounted as before, set up as for parts 4-6 in Section X-ray Diffraction;select 30kV.
5. Measure, tabulate and plot the count rate at every 30′ arc, commencing at 110 30′, until the“whale back” appears to fall off.
6. Repeat for 20 keV. Observe that the minimum setting of the Carriage Arm requires an ex-tended extrapolation of the 30 keV curve to obtain and intercept on the x-axis. Observe thatthe curves flatten out before intercepting the axis (Fig. 2.7), due to the contribution of thegeneral background radiation.
7. Extrapolate the theoretical intercepts and tabulate the results as in Table 2.4.
If the theory of the “inverse photoelectric effect” is valid then Einstein’s assumption of 1905,that both emission and absorption are “quantised”, must be tested in relation to Planck’sformula for photo-electron emission
E = hν joules
where E is the energy associated with each quanta, ν is the frequency of radiation and h isPlanck’s constant.
Since ν = cλ for electromagnetic radiation where c is the velocity of light, and E = eV is themaximum energy that can be acquired by any electron within the X-ray tube system, then :
eV = hc/λ or h = V λ(
e
c
)
2-11
Experiment 2. Bragg Diffraction and Measurements of Crystal Unit Cells
Figure 2.7: Count rate as a function of angle (2θ) for NaCl and LiF showing the flattening of thecurves before they intercept the axis, due to the contribution from background
Table 2.4: Tabulate values to determine an average value for V x λ
Crystal V 2θ θ sin θ 2d (nm) λ (nm) Vλ
LiF 30 kV 0.403LiF 20 kV 0.403
Calculate the mean value of V λ from Table 2.4 and evaluate h. Compare this with theinternationally accepted value for h.
The difference between the accepted standard value and the evaluated result for h of about5% is well within experimental limits and illustrates why the ‘inverse photoelectric effect’is considered to be a very accurate method of determining the fundamental constant in theQuantum Theory.
SummaryIt is assumed that previous studies of optical spectra have established that “characteristic lines” inthe visible region of the electromagnetic spectrum are emitted from atomic energy-levels of highprincipal quantum number, the N, O, P and Q levels; the relatively much shorter wavelengths of thecharacteristic Kβ and Kα lines indicate that these shorter emissions are due to electron transitionsat energy levels of low principal quantum number. Any electron from the X-ray tube filamenthaving sufficient energy to eject a K electron in a collision process will ionise the Copper atom;the ionised atom will revert to it’s stable state through electron transitions, each transition beingaccompanied by the emission of a photon of equivalent energy.
By definition, the Kβ emission results from the N and M levels to the K level and Kα fromtransitions from the L to the K level; the N and M levels have a greater energy difference withrespect to the K level than does the L level and hence the wavelength of the Kβ photon is shorterand more energetic than that of Kα. But the closer proximity of the L and K levels results in more
2-12
Experiment 2. Bragg Diffraction and Measurements of Crystal Unit Cells
frequent transitions than for the N or M levels and hence there is a greater “population” of Kα
exhibited by the relative intensities of the peaks 3 and 4 of Fig. 2.5.The Bragg measurements established that a crystal can be used to demonstrate the co-operative
interference of X-rays; the wavelength limit of the continuous “white” spectrum is dependentuniquely on the energy imposed upon the electrons by the potential difference between the elec-tron emitting filament and the anode, regardless of its material; the “characteristic” line spectrum,superimposed upon the white spectrum is due to the elemental composition of the anode and theenergy-levels associated with its individual electron system. The lines are unique to emission froma Copper target and are thus termed CuKβ and CuKα emission lines.
Spectral analysis by the Bragg technique can accurately evaluate a) an unidentified voltage, us-ing both a known crystal and anode material, b) an unknown crystal structure using an identifiedvoltage and anode material and c) the chemical composition of a material serving as an anode toemit characteristic radiation, using an established crystal and an accurately defined voltage.
Questions
1. How does the spectrum of NaCl change with accelerating voltage? Why?
2. Is the LiF spectrum different to the NaCl spectrum for the same accelerating voltage? Why?
References
1. ‘Modern Physics’, Richtmyer, Kennard & Cooper
2. ‘X-rays in Atomic and Nuclear Physics’, N.A. Dyson


![BIOMATERIAL [XRD and FTIR analysis] · A single crystal specimen in a Bragg-Brentano diffractometer would produce only one family of peaks in the diffraction pattern. 2θθθ At 20.6](https://static.documents.pub/doc/80x56/5d4a492188c99317218b4d87/biomaterial-xrd-and-ftir-analysis-a-single-crystal-specimen-in-a-bragg-brentano.jpg)


