EXPERIMENTAL ANALISYS AND MODELING OF Z-PINNED JOINTS UNDER PULL-OUT LOADING Javier TORAL VAZQUEZ 1 , Bruno CASTANIE 1 , Jean Jacques BARRAU 2 , Sébastien DIDIERJEAN 3 1 Université de Toulouse, Laboratoire Structures ISAE, BP 4032, 31055 Toulouse Cedex 4 France 2 Université de Toulouse, LGMT, Bat 3PN, 118 Rte de Narbonne, 31062 Toulouse, France 3 EADS IW, 18 rue Marius Terce, 31300 Toulouse, France e-mail: [email protected]ABSTRACT The goal of this work is the study and modelling of z-pinned joints behaviour under pull-out loading. Elementary pin pull-out tests are performed and an analytical model is proposed to calculate pull-out strength of the pin. Pinned L and T joints are tested under pull-out loadings. Pinned L joints show 260% higher strength than non pinned L joints. A numerical model is set up to predict unpinned and pinned joints failure. Unpinned joint strength is assessed with a maximum stress criterion. In the case of pinned joints, the pins are modelled by non- linear springs which are identified by some pull-out test performed on single pins bonded to a pure resin specimen. 1. INTRODUCTION New assembly and reinforcing techniques have been developed recently to improve delamination strength, impact damage tolerance and joint strength of composite materials laminate by introducing fibres in the through thickness direction. The most common techniques include stitching, tufting and z-pinning. Stitching and tufting consist in introducing a continuous thread trough the laminate while z-pinned laminates are reinforced with discreet rods pinned perpendicular to the stacking plane. Rods are made using high stiffness, high strength materials such as titanium or carbon fibre. The most common z-pinning reinforcement technique is the Aztex technology called UAZ® that uses an ultrasound horn to push pins into the laminate previously placed upon a removable foam [1]. Another technology has been developed by EADS Innovation Works that consist I pushing rods using a holed vibrating needle [2]. The needle penetrates into the dry preform with the rod inside, once the desired depth reached, the needle comes out leaving the rod inside. The rod insertion system is hold by a 7-axis machine so the pinning process can be automated. EADS-IW technique allow the reinforcement of complex geometric surfaces with different pin densities and orientations as well as the use of thicker (1,2 mm) and longer (40 mm) rods. The main objective of this technology is to manufacture low-cost composite joints.
Transcript
EXPERIMENTAL ANALISYS AND MODELING OF Z-PINNED JOINTS UNDER PULL-OUT LOADING
Javier TORAL VAZQUEZ1, Bruno CASTANIE1, Jean Jacques BARRAU2, Sébastien
DIDIERJEAN3
1Université de Toulouse, Laboratoire Structures ISAE, BP 4032, 31055 Toulouse Cedex 4 France 2 Université de Toulouse, LGMT, Bat 3PN, 118 Rte de Narbonne, 31062 Toulouse, France
3 EADS IW, 18 rue Marius Terce, 31300 Toulouse, France e-mail: [email protected]
ABSTRACT
The goal of this work is the study and modelling of z-pinned joints behaviour under pull-out loading. Elementary pin pull-out tests are performed and an analytical model is proposed to calculate pull-out strength of the pin. Pinned L and T joints are tested under pull-out loadings. Pinned L joints show 260% higher strength than non pinned L joints. A numerical model is set up to predict unpinned and pinned joints failure. Unpinned joint strength is assessed with a maximum stress criterion. In the case of pinned joints, the pins are modelled by non-linear springs which are identified by some pull-out test performed on single pins bonded to a pure resin specimen. 1. INTRODUCTION New assembly and reinforcing techniques have been developed recently to improve delamination strength, impact damage tolerance and joint strength of composite materials laminate by introducing fibres in the through thickness direction. The most common techniques include stitching, tufting and z-pinning. Stitching and tufting consist in introducing a continuous thread trough the laminate while z-pinned laminates are reinforced with discreet rods pinned perpendicular to the stacking plane. Rods are made using high stiffness, high strength materials such as titanium or carbon fibre. The most common z-pinning reinforcement technique is the Aztex technology called UAZ® that uses an ultrasound horn to push pins into the laminate previously placed upon a removable foam [1]. Another technology has been developed by EADS Innovation Works that consist I pushing rods using a holed vibrating needle [2]. The needle penetrates into the dry preform with the rod inside, once the desired depth reached, the needle comes out leaving the rod inside. The rod insertion system is hold by a 7-axis machine so the pinning process can be automated. EADS-IW technique allow the reinforcement of complex geometric surfaces with different pin densities and orientations as well as the use of thicker (1,2 mm) and longer (40 mm) rods. The main objective of this technology is to manufacture low-cost composite joints.
a) b) c)
Holed needle
pin
Figure 1: UAZ® reinforcing technique (left) and EADS-IW pinning method (right) Investigations carried out on z-pinned laminates have focused their attention on the mechanical properties of z-pinned laminates and their delamination behaviour. Z-pinning process decrease slightly in-plane mechanical properties of laminates [3] but increase strongly delamination strength [1][4]. A few works have studied z-pinned joints: Chang et al[5] tested single lap joints showing improvement in terms of static and fatigue strength. Cartié et al[6] compare double L joints reinforced by tufting an z-pinning pointing out failure behaviour differences. In a review paper, Mouritiz[7] lists the main steps to reach in order to get z-pinning ready for industrial application and it includes sub-structures characterization. The present paper deals with pinned L and T joint behaviour under pull-out loading. Pinned joint strength is analysed over resin bonded pin pull-out tests. An analytical model is presented to predict pin pull-out strength and is used to model composite pinned joints. 2. SINGLE PIN PULL-OUT TESTS Carbon pins reinforcing laminates through the thickness are generally surrounded by a rich resin region (Figure 2). Based on this observation, the pull-out strength of pins in laminates is investigated through the study of pin pull-out strength in pure resin specimen.
Figure 2: rich resin pocket around a carbon pin [8]
2.1 Specimens manufacturing and pull-out tests Single resin bonded pin specimens consist in a resin pocket with a carbon pin partially bonded inside as seen in Figure 3. Pins are 40 mm long and 0.75 mm in diameter. Studied bonded length goes from 2 to 11 mm. Specimens are manufactured in a specific mould where the carbon pin is held while the resin is poured inside. Once the resin has filled the mould, the specimen is cured following the appropriate curing cycle. The epoxy resin used is the same as the one used for curing the pinned T and L joints preforms.
The pin is pulled-out from the resin pocket using a standard tensile machine with an adapted grips. The resin pocket is held on the upper surface 5 mm from the pin (see Figure 4). The pin top displacement and load are recorded during the test. 2.2 Experimental results A typical load-displacement curve is plotted on Figure 5. Pin pull-out behaviour is similar to the one observed by Dai et al[9] from pin pull-out in laminates where three stages are shown: elastic stretching of the pin, debonding of the pin from resin and lastly pull-out of the debonded pin that involves sliding.
0
50
100
150
200
250
300
350
0,0 1,0 2,0 3,0 4,0 5,0Displacement (mm)
Load
(N
)
Test 3 h=5,72
Test 4 h=5,22
Test 6 h=5,92
Figure 5: Pin pull-out test load vs displacement
Maximum pin load is plotted versus bonded length on Figure 6. The continuous line on Figure 6 corresponds to the analytical model presented in §2.3.
050
100150200250300350400450500
0 1 2 3 4 5 6 7 8 9 10 11 12bonded length (mm)
Deb
onde
d lo
ad (
N)
pin pull-out test results
analytical model
Figure 6: pin pull-out strength Vs bonded length
Measured debonded load shows a high dispersion due to brittle pin-resin interface failure. Despite the high level of scatter, two tendencies can be pointed out from test
results: between 2 and 5 mm of bonded length, debonded load rises from 150 N to 300-400 N. For length values over 5 mm, strength increase slightly with bonded length. 2.3 Analytical pin pull-out model Zhang et al [10] present an analytical model to model shear stresses at the interface between fibre and matrix in fibre pull-out test. The model presents a solution of equilibrium equation satisfying boundary conditions and continuity between fibre and matrix. In the case of a fully bonded fibre, shear stresses distribution at the fibre-resin interface over the fibre length is given by :
( ) ( ) ( )( )zCzCa
Fz bb
i ⋅⋅+⋅⋅⋅
⋅−= λλπ
λτ sinhcosh2 21 (1)
Where λ, Cb1, and Cb
2 are functions of fibre radius a, matrix radius b, bonded length L, and fibre and matrix elastic characteristics. Introducing geometrical and materials parameters of the performed tests into the equation allows obtaining shear stresses distribution at the interface. The stress distribution shows its maximum value at z=0 which corresponds to the highest point of the fibre bonded in resin. Assuming that pin debonds due to shear stress at this point, a relationship between debonded load and maximum shear stress can be established. Debonded load can then be written as a function of the maximum shear stress and geometrical and materials parameters, in particular, it can be written as a function of the bonded length (L) and the maximum shear stress.
( ) max1
max
2 τλ
π ⋅⋅
⋅⋅−=LC
aF
b (2)
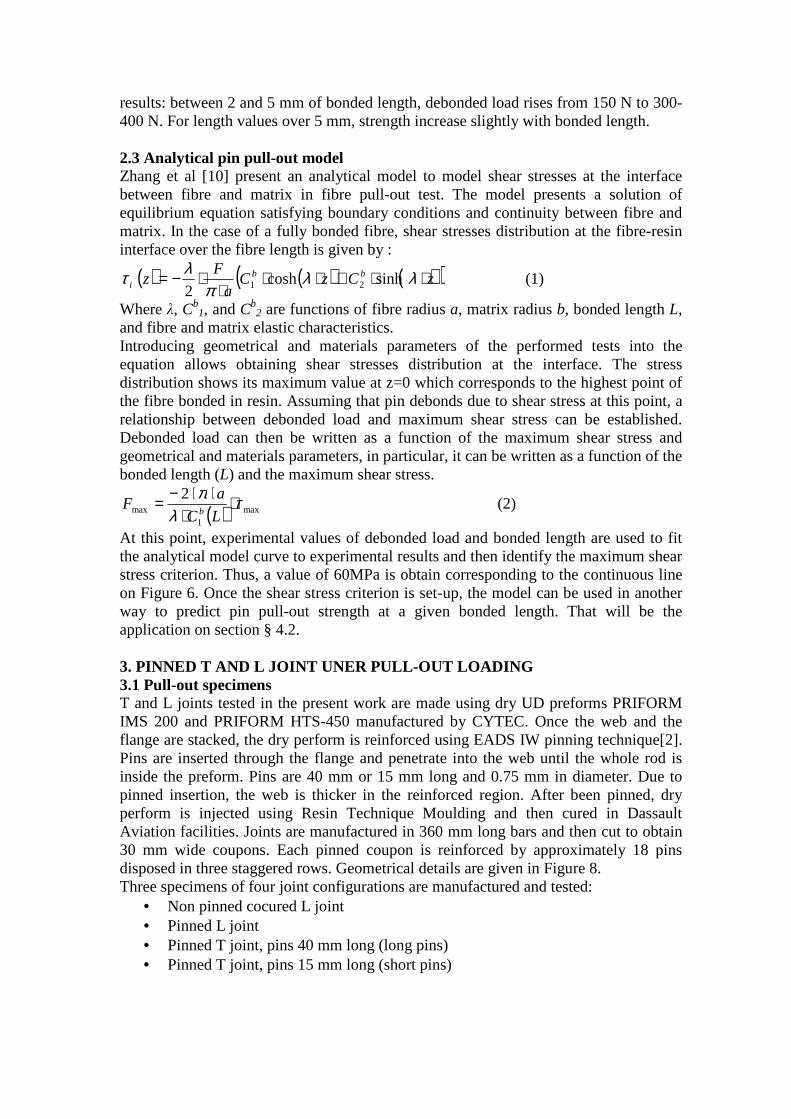
At this point, experimental values of debonded load and bonded length are used to fit the analytical model curve to experimental results and then identify the maximum shear stress criterion. Thus, a value of 60MPa is obtain corresponding to the continuous line on Figure 6. Once the shear stress criterion is set-up, the model can be used in another way to predict pin pull-out strength at a given bonded length. That will be the application on section § 4.2. 3. PINNED T AND L JOINT UNER PULL-OUT LOADING 3.1 Pull-out specimens T and L joints tested in the present work are made using dry UD preforms PRIFORM IMS 200 and PRIFORM HTS-450 manufactured by CYTEC. Once the web and the flange are stacked, the dry perform is reinforced using EADS IW pinning technique[2]. Pins are inserted through the flange and penetrate into the web until the whole rod is inside the preform. Pins are 40 mm or 15 mm long and 0.75 mm in diameter. Due to pinned insertion, the web is thicker in the reinforced region. After been pinned, dry perform is injected using Resin Technique Moulding and then cured in Dassault Aviation facilities. Joints are manufactured in 360 mm long bars and then cut to obtain 30 mm wide coupons. Each pinned coupon is reinforced by approximately 18 pins disposed in three staggered rows. Geometrical details are given in Figure 8. Three specimens of four joint configurations are manufactured and tested:
• Non pinned cocured L joint • Pinned L joint • Pinned T joint, pins 40 mm long (long pins) • Pinned T joint, pins 15 mm long (short pins)
140
5,6
5,6
4,3
40
105
140
5,6
5,6
4,3
40
105
Figure 7: Pinned L joint Figure 8: Pinned L joint and reinforcing pattern
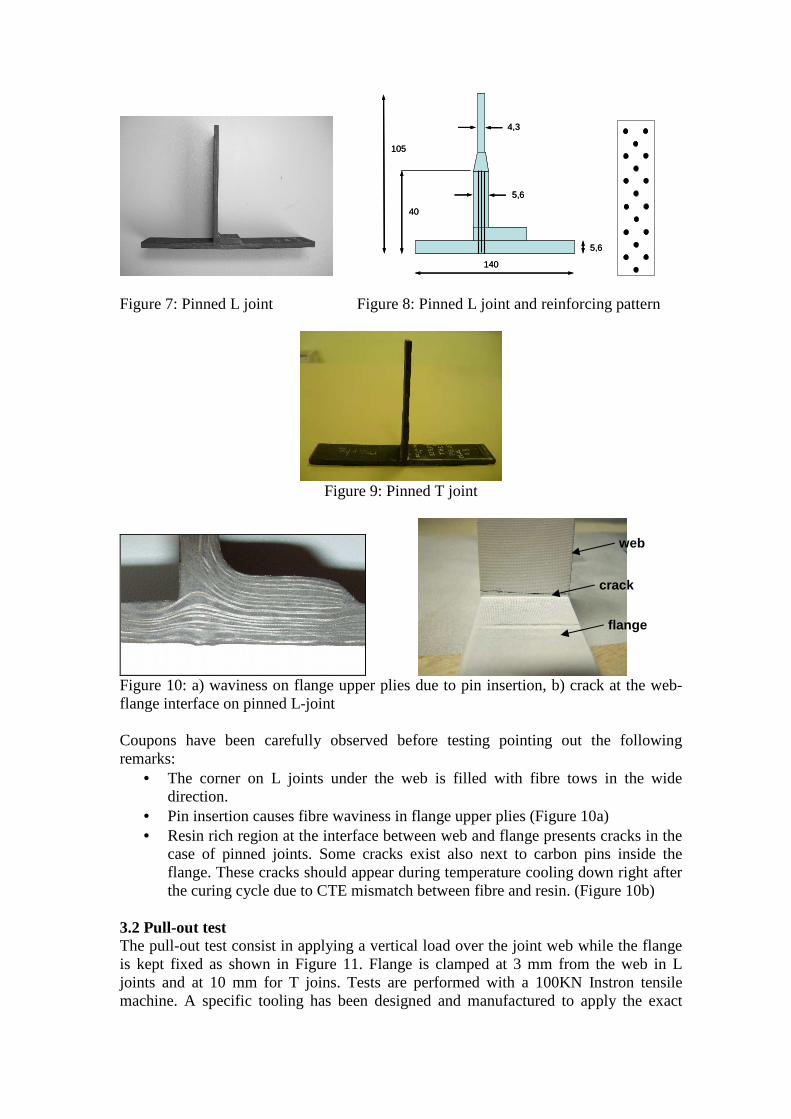
Figure 9: Pinned T joint
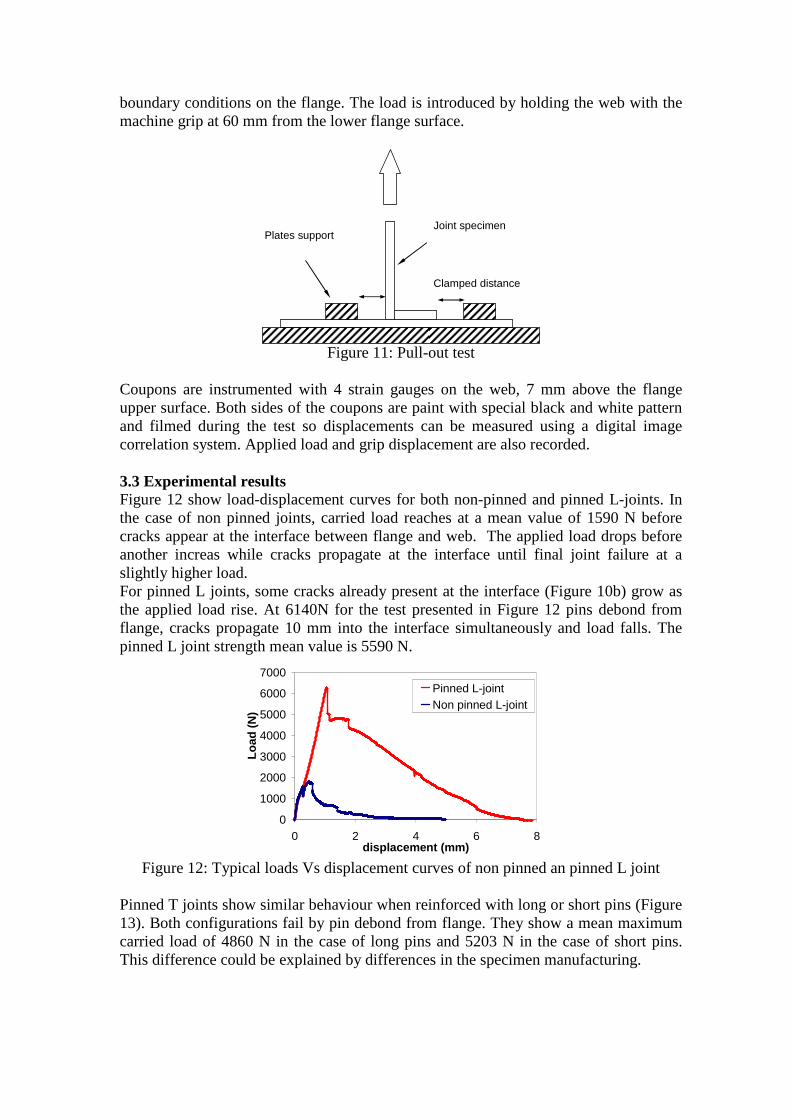
Figure 10: a) waviness on flange upper plies due to pin insertion, b) crack at the web-flange interface on pinned L-joint Coupons have been carefully observed before testing pointing out the following remarks:
• The corner on L joints under the web is filled with fibre tows in the wide direction.
• Pin insertion causes fibre waviness in flange upper plies (Figure 10a) • Resin rich region at the interface between web and flange presents cracks in the
case of pinned joints. Some cracks exist also next to carbon pins inside the flange. These cracks should appear during temperature cooling down right after the curing cycle due to CTE mismatch between fibre and resin. (Figure 10b)
3.2 Pull-out test The pull-out test consist in applying a vertical load over the joint web while the flange is kept fixed as shown in Figure 11. Flange is clamped at 3 mm from the web in L joints and at 10 mm for T joins. Tests are performed with a 100KN Instron tensile machine. A specific tooling has been designed and manufactured to apply the exact
web
flange
crack
boundary conditions on the flange. The load is introduced by holding the web with the machine grip at 60 mm from the lower flange surface.
Joint specimen Plates support
Clamped distance
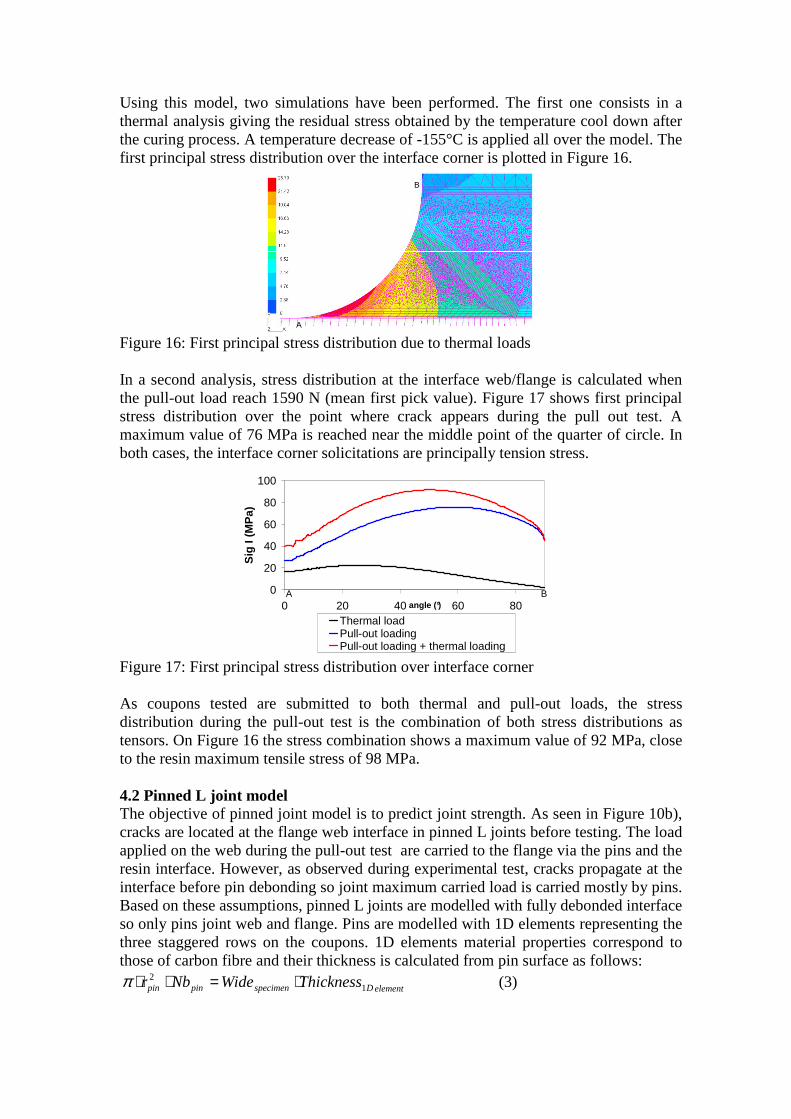
Figure 11: Pull-out test Coupons are instrumented with 4 strain gauges on the web, 7 mm above the flange upper surface. Both sides of the coupons are paint with special black and white pattern and filmed during the test so displacements can be measured using a digital image correlation system. Applied load and grip displacement are also recorded. 3.3 Experimental results Figure 12 show load-displacement curves for both non-pinned and pinned L-joints. In the case of non pinned joints, carried load reaches at a mean value of 1590 N before cracks appear at the interface between flange and web. The applied load drops before another increas while cracks propagate at the interface until final joint failure at a slightly higher load. For pinned L joints, some cracks already present at the interface (Figure 10b) grow as the applied load rise. At 6140N for the test presented in Figure 12 pins debond from flange, cracks propagate 10 mm into the interface simultaneously and load falls. The pinned L joint strength mean value is 5590 N.
0
1000
2000
3000
4000
5000
6000
7000
0 2 4 6 8displacement (mm)
Load
(N
)
Pinned L-jointNon pinned L-joint
Figure 12: Typical loads Vs displacement curves of non pinned an pinned L joint
Pinned T joints show similar behaviour when reinforced with long or short pins (Figure 13). Both configurations fail by pin debond from flange. They show a mean maximum carried load of 4860 N in the case of long pins and 5203 N in the case of short pins. This difference could be explained by differences in the specimen manufacturing.
0
1000
2000
3000
4000
5000
6000
0 1 2 3Displacement (mm)
Load
(N
)
Pinned T joint, short pins (15mm)
Pinned T joint, long pins (40mm)
Figure 13: Pinned T joint typical response 4. L JOINTS FE MODELING Three models have been developed to predict first failure and maximum strength of both unpinned L joint, pinned L joint and pinned T joint. These models are 2D models where plane strain hypothesis are applied. Stacking sequences are applied to the elements modelling the flange and the web. Clamped boundary conditions are imposed all over the thickness of the flange. The vertical load is introduced in the model by applying a vertical displacement over the points at 60 mm high at the web.
Figure 14: Non pinned L-joint FE model with boundary conditions
4.1 Non pinned joint model In the case of non pinned joints, every geometrical detail at the interface between flange and web have been represented based on micrograph observation. As seen in Figure 15, the highest ply of the flange forms a 0.4 mm radius at the point where it joints the web. The fibre tows that fill the corner at the interface are also modelled by applying the appropriate mechanicals properties at the elements in this area.
Figure 15 : Detail at the interface on non-pinned L-joint: coupon test (left) and model (right)
Using this model, two simulations have been performed. The first one consists in a thermal analysis giving the residual stress obtained by the temperature cool down after the curing process. A temperature decrease of -155°C is applied all over the model. The first principal stress distribution over the interface corner is plotted in Figure 16.
A
B
A
B
Figure 16: First principal stress distribution due to thermal loads In a second analysis, stress distribution at the interface web/flange is calculated when the pull-out load reach 1590 N (mean first pick value). Figure 17 shows first principal stress distribution over the point where crack appears during the pull out test. A maximum value of 76 MPa is reached near the middle point of the quarter of circle. In both cases, the interface corner solicitations are principally tension stress.
Figure 17: First principal stress distribution over interface corner As coupons tested are submitted to both thermal and pull-out loads, the stress distribution during the pull-out test is the combination of both stress distributions as tensors. On Figure 16 the stress combination shows a maximum value of 92 MPa, close to the resin maximum tensile stress of 98 MPa. 4.2 Pinned L joint model The objective of pinned joint model is to predict joint strength. As seen in Figure 10b), cracks are located at the flange web interface in pinned L joints before testing. The load applied on the web during the pull-out test are carried to the flange via the pins and the resin interface. However, as observed during experimental test, cracks propagate at the interface before pin debonding so joint maximum carried load is carried mostly by pins. Based on these assumptions, pinned L joints are modelled with fully debonded interface so only pins joint web and flange. Pins are modelled with 1D elements representing the three staggered rows on the coupons. 1D elements material properties correspond to those of carbon fibre and their thickness is calculated from pin surface as follows:
To simulate pin debonding from flange, pins at interface are modelled as non linear springs with a tri-linear law. Maximum force value is identified from single pin pull-out experiments using the analytical model presented in section §2.3. Thus, pin bonded length is supposed to be equal to the flange thickness and pin pull-out strength is deduced. Spring stiffness in the first linear stage is identified from the pin mechanical properties. Friction value is taken directly from single pin pull-out tests and displacement db is fixed arbitrary as twice da.
da dbdc
Fmax
F
d
da dbdc
Fmax
F
d
Figure 18: Spring behaviour law Fig 19: Pinned L-joint model, springs detail Figure 20 shows test and simulation load-displacement curves:
0
1000
2000
3000
4000
5000
6000
7000
0 0,1 0,2 0,3 0,4vertical displacement (mm)
Load
(N
)
experimental
simulation
Figure 20: Pull-out load-displacement curve of pinned L-joint Test displacements are measured from digital image correlation as it has more accurate precision than displacement captors used during the test. Simulation presents good agreement with test results especially in terms of maximum carried load. Model predicted maximum load is 5752 N while mean L joint measured strength is 5598 N, an error of 3%. The analysis of pin debond sequence shows that the first pin (the one closest to the left side of the web) debonds first at an applied load of 4631 N. Final failure occurs when second pins debonds and it cause also third pins debonding at the maximum load of 5752N. The same methodology is applied to develop a pinned T-joint model. Flange and web are only joint by pins modelled as non linear spring. The maximum carried load obtained from simulation is 5540N, 10% higher than mean experimental strength. This work shows that pinned joint strength can be predicted with a good accuracy from elementary pin pull-out test and an analytical model. 5. CONCLUSIONS Pin pull-out strength from laminates have been analysed using elementary bonded resin pull-out tests. Although important scatter is found, pull-out strength seems to be dependent on bonded length only for length smaller than 5 mm. For higher valeus,
strength increase slightly with bonded length. Resin pull-out test and an analytical model allow identifying a maximum stress criterion that can be used later to estimate pin pull-out strength. Unpinned and pinned L-joints have been characterized under pull-out loading where pinned joints show +260% of maximum carried load. A stress criterion has been identified to predict unpinned L joint strength considering thermal and mechanical loads. Single pin pull-out tests and the analytical model are used to characterize springs in pinned joint model so its strength can be calculated. A very good agreement between test and simulation is reached in terms of maximum carried load. This work demonstrates that pinned joints on laminates under pull-out loadings can be studied by the only analysis of pins debonding from resin. ACKNOWLEDGEMENTS The work presented in this paper has been funded by the CEC in the FP6 ALCAS project. The authors would like to acknowledge EADS-Innovation Works and Dassault Aviation for the specimens’ manufacturing. REFERENCES
1- I.K. Patridge and D.D.R. Cartié, “Delamination resistant laminates by Z-Fiber® pinning: Part I manufacture and fracture performance”, Composites Part A: Applied Science and Manufacturing, Vol. 36, Issue 1, January 2005: 55-64.
2- P. Lefèbure, “Assembly of dry Carbon Preforms by a Z-pinning technology”, SAMPE Europe Technical Conference, SETEC January 2006.
3- P. Chang, A.P. Mouritz, B.N. Cox, “Properties and failure mechanisms of z-pinned laminates in monotonic and cyclic tension”, Composites Part A, 2006
4- G. Freitas, C. Magee, J. Boyce, “Service Tough Composites Structures Using the Z-Direction Reinforcement Process”. In FAA, Ninth DoD/NASA/FAA Conference on Fibrous Composites in Structural Design, Volume 3, 1223-1229. 1992
5- Chang P, Mouritz AP, Cox BN, “Properties and failure mechanisms of pinned composites lap joints in monotonic and cyclic tension”, Composites Part A 2006.
6- D.D.R. Cartié, G. Dell’Anno, E. Poulin and I.K. Partridge, “3D reinforcement of stiffener-to-skin T joints by Z-pinning and tufting” Engineering Fracture Mechanics, Vol.73, Issue 16, November 2006, 2532-2540.
7- A.P. Mouritz “Review of z-pinned composite laminates”, Composites Part A, Vol. 38, Issue 12, December 2007, 2383-2397.
8- R. D. Sweeting, R.S. Thomson, “The effect of thermal mismatch on Z-pinned laminated composite structures” Composite Structures, Vol 66, 2004, 189-195.
9- S.C. Dai, W. Yan, H.Y. Liu, Y.W. Mai, “Experimental study of z-pin bridging law by pullout test”. Composites Science and Technology, Vol. 64, 2004, 2451-2457.
10- X. Zhang, H.Y. Liu, Y.W. Mai, X.X. Diao, “On steady-state fibre pull-out I: The stress field”, Composites Science and Technology, Vol. 59, 1999, 2179-2189