FACTA UNIVERSITATIS
Series: Mechanical Engineering Vol. 18, No 1, 2020, pp. 13 - 29
https://doi.org/10.22190/FUME191024009J
© 2020 by University of Niš, Serbia | Creative Commons License: CC BY-NC-ND
Original scientific paper
EXPERIMENTAL ANALYSIS AND OPTIMIZATION
OF THE CONTROLLABLE PARAMETERS IN TURNING
OF EN AW-2011 ALLOY; DRY MACHINING
AND ALTERNATIVE COOLING TECHNIQUES
Sonja Jozić, Ivana Dumanić, Dražen Bajić
Faculty of Electrical Engineering, Mechanical Engineering and Naval Architecture,
University of Split, Split, Croatia
Abstract. The latest trends in machining research show that great efforts are being
made to understand the impact of different cooling and lubrication techniques as well
as cutting parameters on machining performances. This paper presents the
investigation results of different cutting parameters and different cutting environments
such as dry machining, minimum quantity lubrication (MQL) and minimum quantity
lubrication with compressed cold air (MQL+CCA) on average surface roughness,
cutting force and material removal rate. The experiments were designed based on three
input parameters and three different cutting environments when turning of EN AW-
2011 alloy. Taguchi-based grey relational analysis was used to identify the optimal
process parameters by which minimum values of surface roughness, minimum value of
cutting force and maximum value of material removal rate will be achieved. The results
showed that minimum quantity lubrication in the stream of compressed cold air, in
comparison to dry and minimum quantity lubrication machining, gives the best
machining performances. Therefore, the use of MQL + CCA method, which reduces the
amount of lubricant may represent in the described extent of turning operations an
alternative to turning processes most often carried out by wet method that causes
considerable costs for purchasing, maintaining and using cutting fluids.
Key Words: Turning, Dry Machining, Minimum Quantity of Lubrication, Compressed
Cold Air Cooling, Taguchi Design, Grey Relational Analysis
Received October 24, 2019 / Accepted December 19, 2019
Corresponding author: Sonja Jozić
University of Split, Faculty of Electrical Engineering, Mechanical Engineering and Naval Architecture,
R. Boškovica 32, 21 000 Split, Croatia
E-mail: [email protected]
14 S. JOZIĆ, I. DUMANIĆ, D. BAJIĆ
1. INTRODUCTION
Nowadays, modern mechanical industries are constantly trying to design products and
processes that can run faster, last longer and operate more precisely. Contemporary high-
performance machines that undergo higher loads and increase moving speed of the
moving parts are requiring that bearings, seals, shafts, machine guides, gears and other
mechanical elements have to be dimensionally and geometrically accurate or the surface
texture of the manufactured parts must be precise [1]. Therefore, the objective of machining
operations is to produce mechanical elements with specified quality as productive as
possible. To achieve the highest possible efficiencies in machining processes, understanding
the relationships between process responses and the process controlling factors must be
attained. The machining processes generate heat that is distributed into tool, workpiece,
chips and environment. The most efficient way to reduce the temperature during machining
is to apply a cutting fluid. Therefore, the cooling process becomes an integral part of every
machining process. The most popular method of cooling the cutting zone is a conventional
one, by flooding. The main disadvantage of this cooling method is a high flow rate of
refrigerants and the fact that only a small part reaches the contact area between the
cutting edges and the material being machined.
As a result of the economic (high cost of cutting fluids) and ecological (negative
effects on humans and the environment) pressures, the industry seeks for newer methods
to minimize the consumption of harmful lubricants, [2]. In recent years, several technologies
have been developed in order to increase the overall effectiveness of the process like flood
cooling, cryogenic cooling, solid coolants/lubricants, high pressure coolants (HPC),
minimum quantity lubrication (MQL)/near dry machining (NDM), internal tool cooling and
cooling with compressed air/gases [3]. The concept of dry machining, which has been
suggested by many contemporary researchers, has many advantages such as: the absence of
adverse effects on humans and the environment, the reduction of variable machining costs
due to the lack of cutting fluid, easier recycling of a chip that is not contaminated with the
cutting fluids and the possibility of applying high cutting speeds and reducing the cutting
forces and thus the longer tool life [4]. The loss of its positive effects, namely lubrication,
cooling and chip flushing, is imposed by the elimination of the coolant. Also, during the
dry machining, the mechanical and thermal loads of the cutting tool are increased [5].
Minimum quantity lubrication is a cooling technique during which a very small
amount of lubricant agent is applied during the machining process. MQL results in a
significant reduction in the cutting temperatures along with favorable work-chip and work-
tool interactions. This leads to a reduction in the surface roughness as well as cutting forces.
Dhar et al. [6] investigated the MQL technique when turning AISI-1040 steel and their
results of the study indicated that the MQL machining system is more efficient than a
conventional flood coolant system. Priarone et al. [7] performed milling experiments of
titanium aluminides with different types of cooling conditions; dry, wet and MQL. They
have shown that MQL gave the best results in terms of surface roughness even when
compared to wet machining [7, 8]. Sharma et al. [9] concluded that MQL leads to
decreasing of the cutting temperature which results in improving the tool life as well as the
surface roughness. Maruda et. al [10] and Maruda et al. [11] concluded that the use of the
MQL cooling technique reduces the machined surface roughness parameters and cutting
force values when turning the carbon steel compared with compressed air cooling and dry
Experimental Analysis and Optimization of the Controllable Parameters in Turning of EN AW-2011 alloy... 15
machining. The MQL research in the literature has shown so far that this technique has
proved its efficiency, e. g.: allowing reduction in lubricant use from 50 % to 90 % [12]
and lower energy consumption, better performances and environment protection [13].
The extension of the MQL system is a system where minimal quantity of lubricant is
combined with compressed cold air (MQL + CCA). In such systems, the lubricant is used to
reduce friction while compressed cold air enhances the cooling and flushing action [14].
Pervaiz et al. [14] and Pervaiz et al. [15] explored the machinability of Ti6Al4V using a
vegetable oil-based MQL system mixed with sub-zero temperature air. It was observed that
the vegetable oil-based cooling strategy had promising potential to replace conventional
flood cooling methods. Yuan et al. [16] reported that MQL with compressed cold air
significantly reduced cutting force, tool wear and surface roughness when machining
titanium alloy (Ti6Al4V). Singh and Sharma [17] concluded that using a Ranque-Hilsch
vortex tube in addition to the MQL cooling process during turning of commercially pure
titanium led to an improvement reducing surface roughness values and cutting forces when
compared to MQL process.
Multiple characteristic optimization methods have been the focus of the recent research
directed at improving product quality and reducing the costs of the machining process.
Among various optimization methods are grey relational analysis (GRA), technique for
order preferences by similarity to ideal solution (TOPSIS), genetic algorithms (GA),
desirability analysis (DA), metaheuristic algorithms and other methods that allow multiple
performance characteristics to be optimized simultaneously. Diyaley and Chakraborty [18]
used six most popular metaheuristic algorithms to determine optimal values of the cutting
parameters during roughing and finishing milling operations in order to minimize total
production time and total production cost. Gopal and Prakash [19] used GRA and TOPSIS
to optimize milling parameters in order to minimize cutting force, surface roughness and
temperature during end milling process, and both methods gave the similar optimal cutting
parameters. Fratila and Caizar [20] conducted an experimental investigation on milling of
AlMg3 alloy under conventional flood lubrication, minimal quantity lubrication and dry
milling. By using the Taguchi optimization methodology, they found optimal cutting
parameters for minimal cutting power and surface roughness. Yan and Li [21] used a multi-
objective optimization method based on weighted grey relational analysis and response
surface methodology (RSM) to optimize the cutting parameters in milling process. They
tried to evaluate trade-offs between sustainability, production rate and cutting quality. Lin
[22] used the Taguchi method together with GRA to deal with optimization of the turning
operations, for the machining of S45C steel, with the multiple performance characteristics
(tool life, cutting force, surface roughness). S. Tripathy and D.K. Tripathy [23] performed
multi-response optimization of the cutting parameters using grey relational analysis together
with the TOPSIS method. To obtain favorable process output values such as radial thrust
force, cutting power and coefficient of friction when dry turning of Ti-6Al-4V. Li et al. [24]
combined the Taguchi-based grey relational analysis and the kernel principal component
analysis (KPCA) to optimize machining parameters such as type of inserts, feed rate and
depth of cut.
Mia et al. [25] optimized cutting forces, surface roughness, cutting temperature, and chip
reduction coefficient when turning of Ti-6Al-4V in dry and high-pressure coolant condition
using GRA combined with the Taguchi method. In their next paper [26] they experimentally
investigated surface roughness, cutting force, and feed force when turning the same
16 S. JOZIĆ, I. DUMANIĆ, D. BAJIĆ
workpiece material under cryogenic (liquid nitrogen) condition. They performed multi-
response optimization according to the models of responses by response surface methodology
(RSM) and artificial neural network. Aman et al. [27] utilized the Taguchi method and the
response surface method (RSM) to find out the influence of depth of cut, cutting speed,
cutting environment, cutting tool geometry and feed rate on power consumption.
It can be observed that whereas different studies have found MQL and MQL+CCA as
an improvement and benefits over dry machining, wet machining and flood lubrication,
fuller understanding of MQL and MQL+CCA process is still required. Also, few research
projects have been performed for which the cutting environments (dry, MQL and
MQL+CCA) were variables. It is evident from the review of available literature that no
studies have been found on the use of MQL in turning of the aluminum alloy EN AW-2011.
This alloy is often called a free machining alloy and it is well suited to the use in automatic
lathes. Boswell et al. [28] provided an overview of the effectiveness of MQL during
conventional machining; turning, milling, grinding, drilling for different workpiece materials
such as steel, aluminum alloys (A7175, A6061, A1050) and difficult-to-cut materials (Ti-
48Al-2Cr-2Nb intermetallic alloy, Ti-6Al-4V titanium alloy, nickel-based alloys and iron-
based alloys).
As noted earlier, the objective of this study is to research the effects of cutting
environments (dry machining, MQL, MQL + CCA) on surface roughness, cutting force
component in the Z direction and on the material removal rate in the longitudinal turning at
varying cutting parameters (cutting speed, feed rate, depth of cut). Cutting force components
in X and Y direction were not taken into consideration because of the negligible small values
of Fx and Fy in comparison to Fz. In this study, the use of the Taguchi method to design the
tests and grey relational analysis to find an optimum cutting environment from the machining
response, such as cutting force, surface roughness and material removal rate was reported.
Confirmation test was established after optimizing machining parameters.
2. EXPERIMENTAL WORK
The aim of the experimental study was to evaluate the influence of cutting parameters
and cutting environments on the surface roughness, cutting force and the rate of material
removal. The experiments were carried out on the universal lathe machine with a spindle
motor of 11 kW power and the spindle speeds in the range from 11.2 rpm to 2240 rpm.
Turning inserts, the VCGT 160404-AS produced by ISCAR were mounted on the tool
holder SVJCR 2020K-16.
The workpiece material was EN AW-2011, aluminum alloy. The chemical composition
of the material in mass fraction was Al (91.4%), Cu (4%), Fe (0.7%), Pb (0.6%), Bi (0.6%),
Si (0.4%) and Zn (0.3%). Physical and mechanical properties of the alloy are presented in
Table 1.
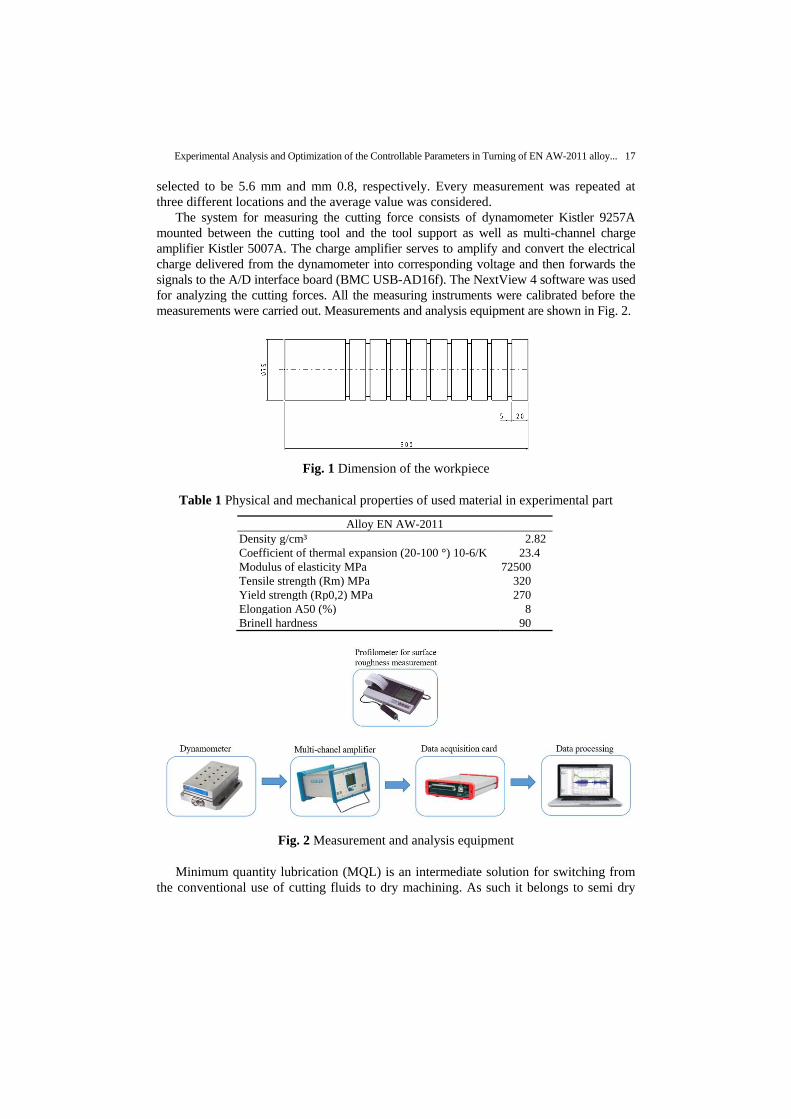
The workpieces were shafts with dimensions of 300 mm length and 75 mm in diameter
with machined slots to perform experiments and measurements much easier, Fig. 1. The
workpiece was clamped into the chuck, while the other side was supported by a tailstock to
prevent vibration during machining.
The surface roughness was measured using the Mitutoyo Surfest SJ 301 profilometer.
Sampling length and the cut-off length for the measurements of surface roughness were
Experimental Analysis and Optimization of the Controllable Parameters in Turning of EN AW-2011 alloy... 17
selected to be 5.6 mm and mm 0.8, respectively. Every measurement was repeated at
three different locations and the average value was considered.
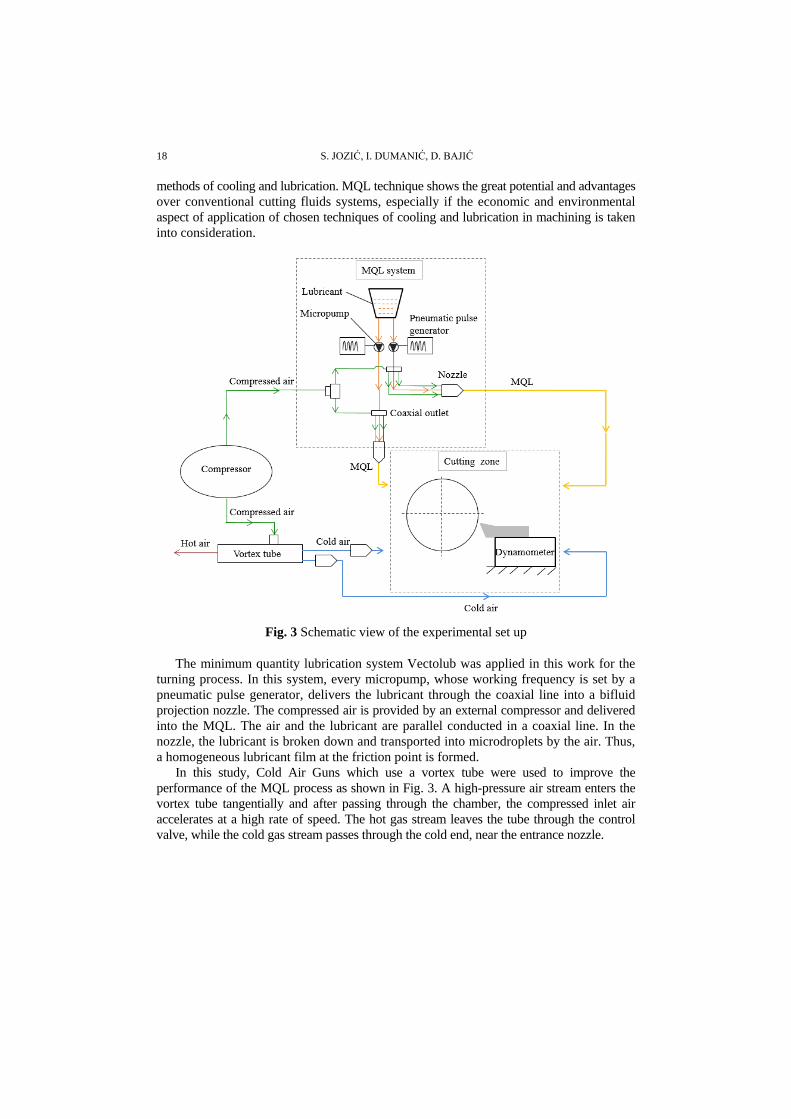
The system for measuring the cutting force consists of dynamometer Kistler 9257A
mounted between the cutting tool and the tool support as well as multi-channel charge
amplifier Kistler 5007A. The charge amplifier serves to amplify and convert the electrical
charge delivered from the dynamometer into corresponding voltage and then forwards the
signals to the A/D interface board (BMC USB-AD16f). The NextView 4 software was used
for analyzing the cutting forces. All the measuring instruments were calibrated before the
measurements were carried out. Measurements and analysis equipment are shown in Fig. 2.
Fig. 1 Dimension of the workpiece
Table 1 Physical and mechanical properties of used material in experimental part
Alloy EN AW-2011
Density g/cm³ 2.82
Coefficient of thermal expansion (20-100 °) 10-6/K 23.4
Modulus of elasticity MPa 72500
Tensile strength (Rm) MPa 320
Yield strength (Rp0,2) MPa 270
Elongation A50 (%) 8
Brinell hardness 90
Fig. 2 Measurement and analysis equipment
Minimum quantity lubrication (MQL) is an intermediate solution for switching from
the conventional use of cutting fluids to dry machining. As such it belongs to semi dry
18 S. JOZIĆ, I. DUMANIĆ, D. BAJIĆ
methods of cooling and lubrication. MQL technique shows the great potential and advantages
over conventional cutting fluids systems, especially if the economic and environmental
aspect of application of chosen techniques of cooling and lubrication in machining is taken
into consideration.
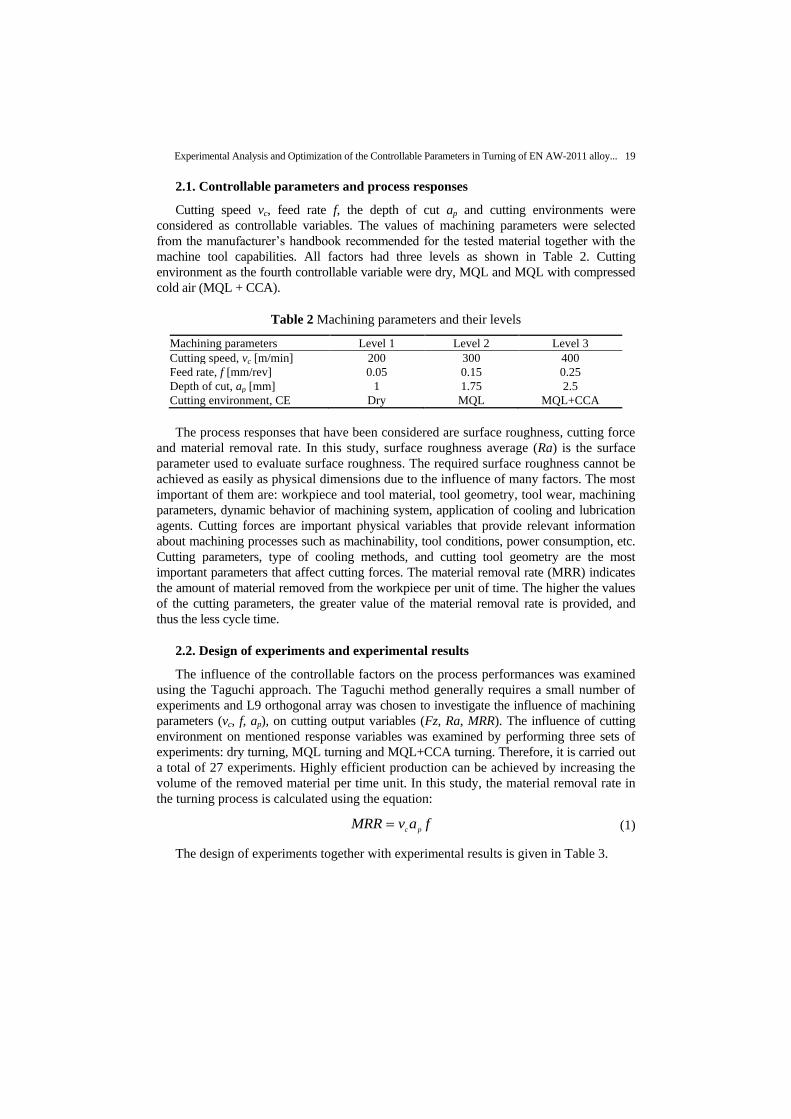
Fig. 3 Schematic view of the experimental set up
The minimum quantity lubrication system Vectolub was applied in this work for the
turning process. In this system, every micropump, whose working frequency is set by a
pneumatic pulse generator, delivers the lubricant through the coaxial line into a bifluid
projection nozzle. The compressed air is provided by an external compressor and delivered
into the MQL. The air and the lubricant are parallel conducted in a coaxial line. In the
nozzle, the lubricant is broken down and transported into microdroplets by the air. Thus,
a homogeneous lubricant film at the friction point is formed.
In this study, Cold Air Guns which use a vortex tube were used to improve the
performance of the MQL process as shown in Fig. 3. A high-pressure air stream enters the
vortex tube tangentially and after passing through the chamber, the compressed inlet air
accelerates at a high rate of speed. The hot gas stream leaves the tube through the control
valve, while the cold gas stream passes through the cold end, near the entrance nozzle.
Experimental Analysis and Optimization of the Controllable Parameters in Turning of EN AW-2011 alloy... 19
2.1. Controllable parameters and process responses
Cutting speed vc, feed rate f, the depth of cut ap and cutting environments were
considered as controllable variables. The values of machining parameters were selected
from the manufacturer’s handbook recommended for the tested material together with the
machine tool capabilities. All factors had three levels as shown in Table 2. Cutting
environment as the fourth controllable variable were dry, MQL and MQL with compressed
cold air (MQL + CCA).
Table 2 Machining parameters and their levels
Machining parameters Level 1 Level 2 Level 3
Cutting speed, vc [m/min] 200 300 400
Feed rate, f [mm/rev] 0.05 0.15 0.25
Depth of cut, ap [mm] 1 1.75 2.5
Cutting environment, CE Dry MQL MQL+CCA
The process responses that have been considered are surface roughness, cutting force
and material removal rate. In this study, surface roughness average (Ra) is the surface
parameter used to evaluate surface roughness. The required surface roughness cannot be
achieved as easily as physical dimensions due to the influence of many factors. The most
important of them are: workpiece and tool material, tool geometry, tool wear, machining
parameters, dynamic behavior of machining system, application of cooling and lubrication
agents. Cutting forces are important physical variables that provide relevant information
about machining processes such as machinability, tool conditions, power consumption, etc.
Cutting parameters, type of cooling methods, and cutting tool geometry are the most
important parameters that affect cutting forces. The material removal rate (MRR) indicates
the amount of material removed from the workpiece per unit of time. The higher the values
of the cutting parameters, the greater value of the material removal rate is provided, and
thus the less cycle time.
2.2. Design of experiments and experimental results
The influence of the controllable factors on the process performances was examined
using the Taguchi approach. The Taguchi method generally requires a small number of
experiments and L9 orthogonal array was chosen to investigate the influence of machining
parameters (vc, f, ap), on cutting output variables (Fz, Ra, MRR). The influence of cutting
environment on mentioned response variables was examined by performing three sets of
experiments: dry turning, MQL turning and MQL+CCA turning. Therefore, it is carried out
a total of 27 experiments. Highly efficient production can be achieved by increasing the
volume of the removed material per time unit. In this study, the material removal rate in
the turning process is calculated using the equation:
c pMRR v a f (1)
The design of experiments together with experimental results is given in Table 3.
20 S. JOZIĆ, I. DUMANIĆ, D. BAJIĆ
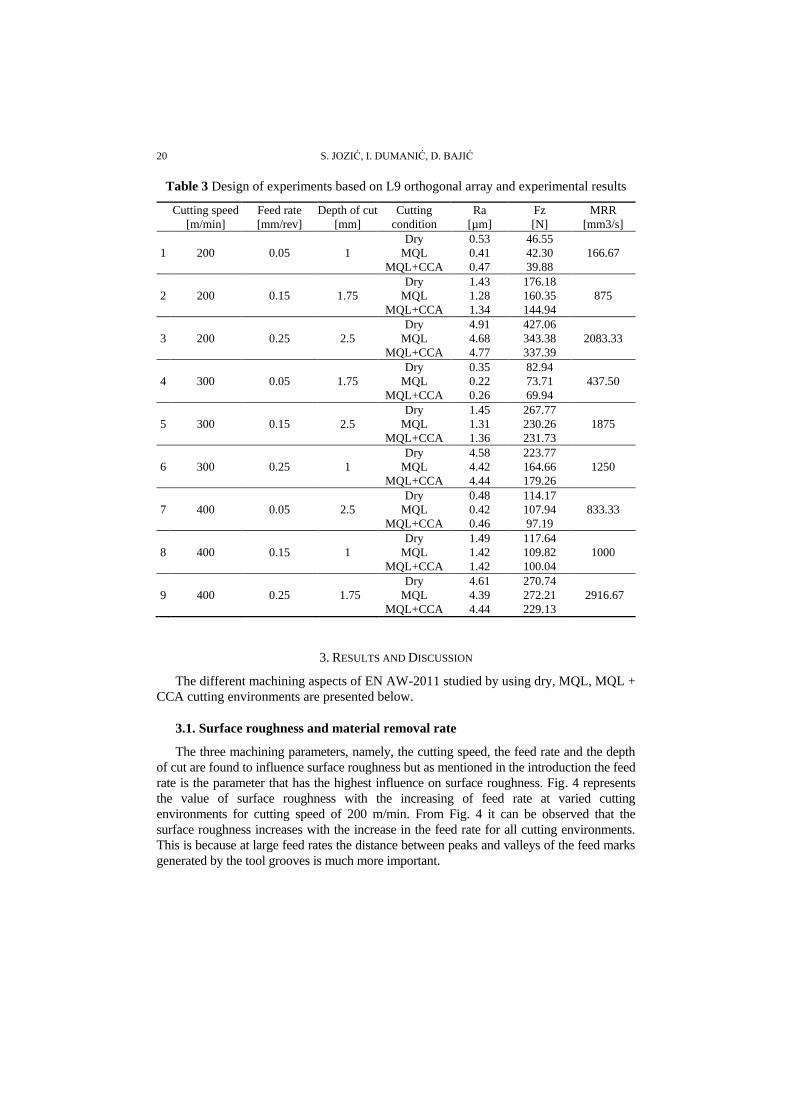
Table 3 Design of experiments based on L9 orthogonal array and experimental results
Cutting speed
[m/min]
Feed rate
[mm/rev]
Depth of cut
[mm]
Cutting
condition
Ra
[µm]
Fz
[N]
MRR
[mm3/s]
1 200 0.05 1
Dry
MQL
MQL+CCA
0.53
0.41
0.47
46.55
42.30
39.88
166.67
2 200 0.15 1.75
Dry
MQL
MQL+CCA
1.43
1.28
1.34
176.18
160.35
144.94
875
3 200 0.25 2.5
Dry
MQL
MQL+CCA
4.91
4.68
4.77
427.06
343.38
337.39
2083.33
4 300 0.05 1.75
Dry
MQL
MQL+CCA
0.35
0.22
0.26
82.94
73.71
69.94
437.50
5 300 0.15 2.5
Dry
MQL
MQL+CCA
1.45
1.31
1.36
267.77
230.26
231.73
1875
6 300 0.25 1
Dry
MQL
MQL+CCA
4.58
4.42
4.44
223.77
164.66
179.26
1250
7 400 0.05 2.5
Dry
MQL
MQL+CCA
0.48
0.42
0.46
114.17
107.94
97.19
833.33
8 400 0.15 1
Dry
MQL
MQL+CCA
1.49
1.42
1.42
117.64
109.82
100.04
1000
9 400 0.25 1.75
Dry
MQL
MQL+CCA
4.61
4.39
4.44
270.74
272.21
229.13
2916.67
3. RESULTS AND DISCUSSION
The different machining aspects of EN AW-2011 studied by using dry, MQL, MQL +
CCA cutting environments are presented below.
3.1. Surface roughness and material removal rate
The three machining parameters, namely, the cutting speed, the feed rate and the depth
of cut are found to influence surface roughness but as mentioned in the introduction the feed
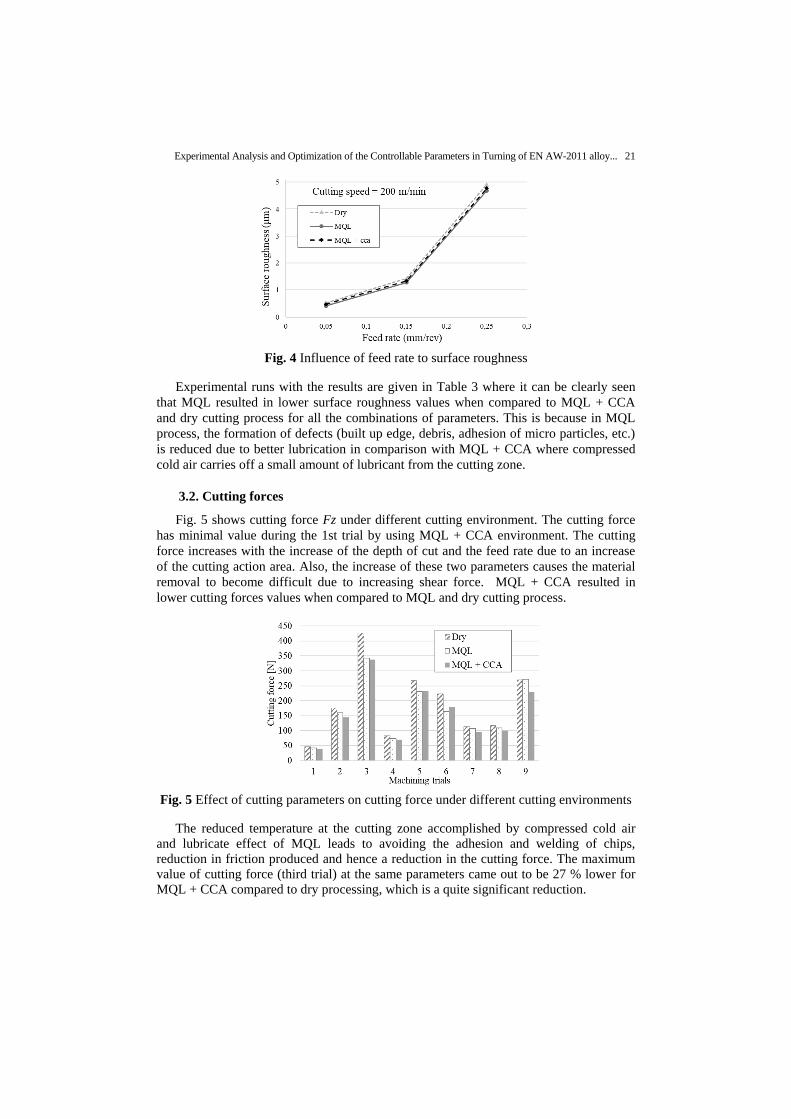
rate is the parameter that has the highest influence on surface roughness. Fig. 4 represents
the value of surface roughness with the increasing of feed rate at varied cutting
environments for cutting speed of 200 m/min. From Fig. 4 it can be observed that the
surface roughness increases with the increase in the feed rate for all cutting environments.
This is because at large feed rates the distance between peaks and valleys of the feed marks
generated by the tool grooves is much more important.
Experimental Analysis and Optimization of the Controllable Parameters in Turning of EN AW-2011 alloy... 21
Fig. 4 Influence of feed rate to surface roughness
Experimental runs with the results are given in Table 3 where it can be clearly seen
that MQL resulted in lower surface roughness values when compared to MQL + CCA
and dry cutting process for all the combinations of parameters. This is because in MQL
process, the formation of defects (built up edge, debris, adhesion of micro particles, etc.)
is reduced due to better lubrication in comparison with MQL + CCA where compressed
cold air carries off a small amount of lubricant from the cutting zone.
3.2. Cutting forces
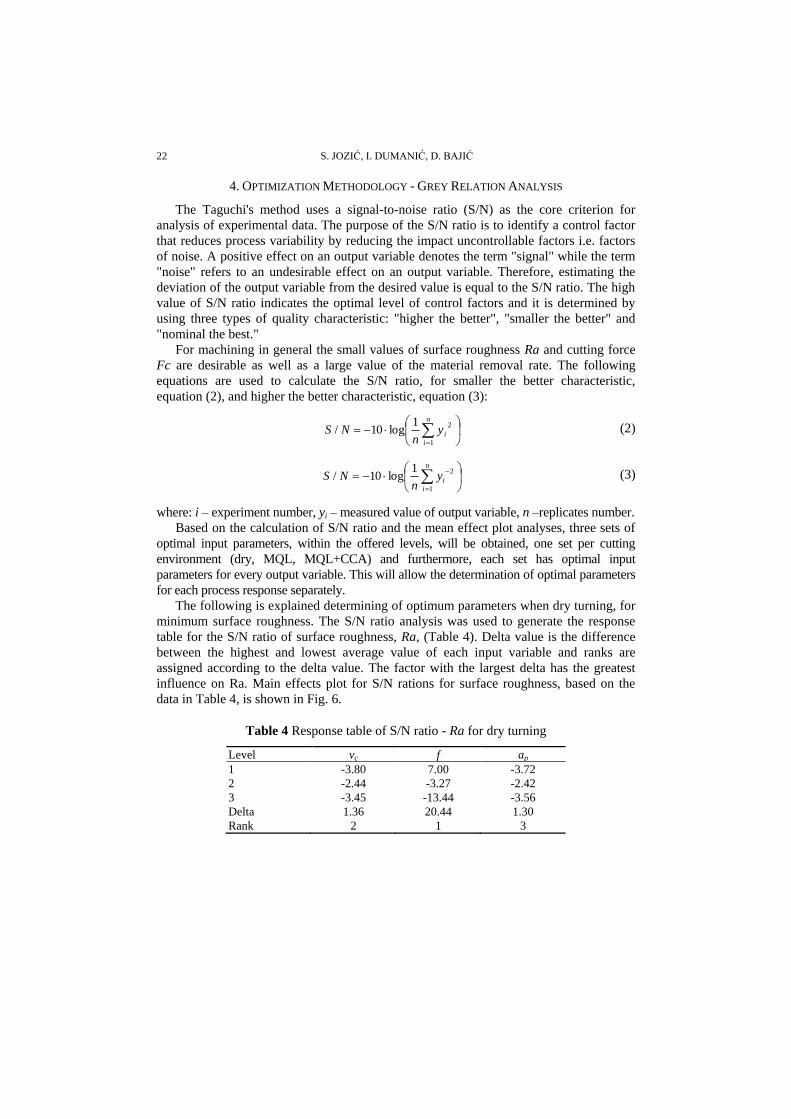
Fig. 5 shows cutting force Fz under different cutting environment. The cutting force
has minimal value during the 1st trial by using MQL + CCA environment. The cutting
force increases with the increase of the depth of cut and the feed rate due to an increase
of the cutting action area. Also, the increase of these two parameters causes the material
removal to become difficult due to increasing shear force. MQL + CCA resulted in
lower cutting forces values when compared to MQL and dry cutting process.
Fig. 5 Effect of cutting parameters on cutting force under different cutting environments
The reduced temperature at the cutting zone accomplished by compressed cold air
and lubricate effect of MQL leads to avoiding the adhesion and welding of chips,
reduction in friction produced and hence a reduction in the cutting force. The maximum
value of cutting force (third trial) at the same parameters came out to be 27 % lower for
MQL + CCA compared to dry processing, which is a quite significant reduction.
22 S. JOZIĆ, I. DUMANIĆ, D. BAJIĆ
4. OPTIMIZATION METHODOLOGY - GREY RELATION ANALYSIS
The Taguchi's method uses a signal-to-noise ratio (S/N) as the core criterion for
analysis of experimental data. The purpose of the S/N ratio is to identify a control factor
that reduces process variability by reducing the impact uncontrollable factors i.e. factors
of noise. A positive effect on an output variable denotes the term "signal" while the term
"noise" refers to an undesirable effect on an output variable. Therefore, estimating the
deviation of the output variable from the desired value is equal to the S/N ratio. The high
value of S/N ratio indicates the optimal level of control factors and it is determined by
using three types of quality characteristic: "higher the better", "smaller the better" and
"nominal the best."
For machining in general the small values of surface roughness Ra and cutting force
Fc are desirable as well as a large value of the material removal rate. The following
equations are used to calculate the S/N ratio, for smaller the better characteristic,
equation (2), and higher the better characteristic, equation (3):
n
i
iyn
NS1
21log10/ (2)
n
i
iyn
NS1
21log10/ (3)
where: i – experiment number, yi – measured value of output variable, n –replicates number.
Based on the calculation of S/N ratio and the mean effect plot analyses, three sets of
optimal input parameters, within the offered levels, will be obtained, one set per cutting
environment (dry, MQL, MQL+CCA) and furthermore, each set has optimal input
parameters for every output variable. This will allow the determination of optimal parameters
for each process response separately.
The following is explained determining of optimum parameters when dry turning, for
minimum surface roughness. The S/N ratio analysis was used to generate the response
table for the S/N ratio of surface roughness, Ra, (Table 4). Delta value is the difference
between the highest and lowest average value of each input variable and ranks are
assigned according to the delta value. The factor with the largest delta has the greatest
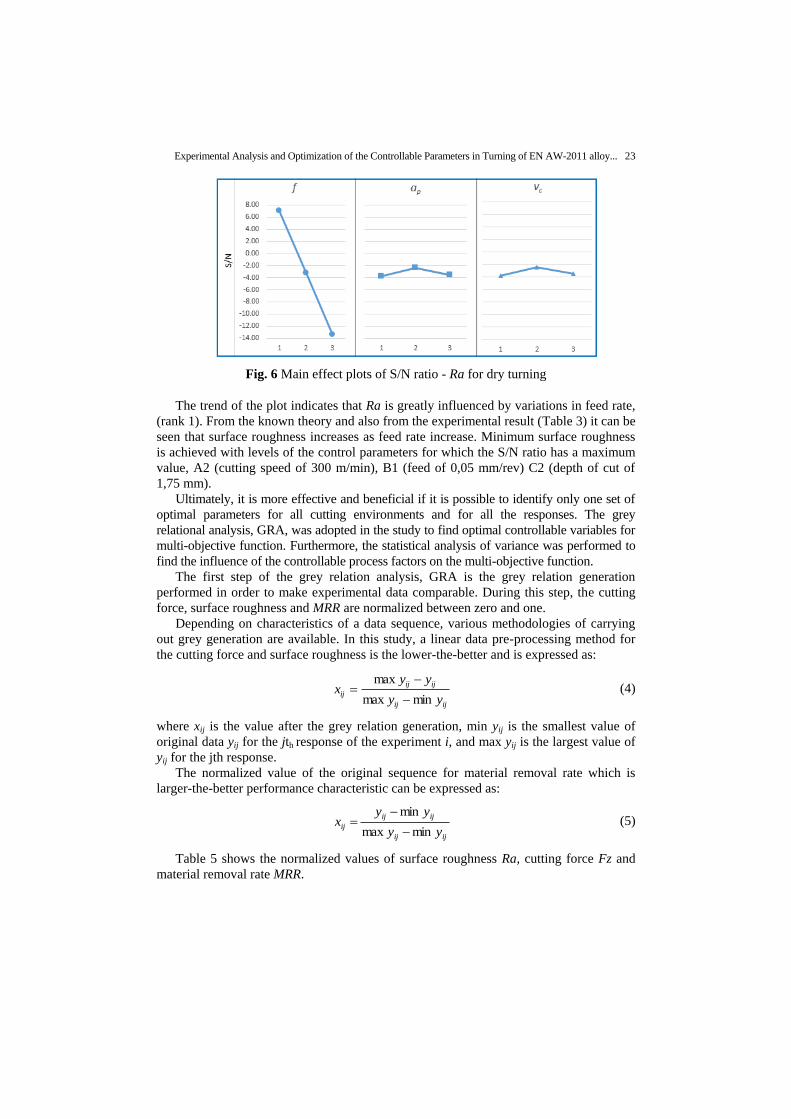
influence on Ra. Main effects plot for S/N rations for surface roughness, based on the
data in Table 4, is shown in Fig. 6.
Table 4 Response table of S/N ratio - Ra for dry turning
Level vc f ap
1 -3.80 7.00 -3.72
2 -2.44 -3.27 -2.42
3 -3.45 -13.44 -3.56
Delta 1.36 20.44 1.30
Rank 2 1 3
Experimental Analysis and Optimization of the Controllable Parameters in Turning of EN AW-2011 alloy... 23
Fig. 6 Main effect plots of S/N ratio - Ra for dry turning
The trend of the plot indicates that Ra is greatly influenced by variations in feed rate,
(rank 1). From the known theory and also from the experimental result (Table 3) it can be
seen that surface roughness increases as feed rate increase. Minimum surface roughness
is achieved with levels of the control parameters for which the S/N ratio has a maximum
value, A2 (cutting speed of 300 m/min), B1 (feed of 0,05 mm/rev) C2 (depth of cut of
1,75 mm).
Ultimately, it is more effective and beneficial if it is possible to identify only one set of
optimal parameters for all cutting environments and for all the responses. The grey
relational analysis, GRA, was adopted in the study to find optimal controllable variables for
multi-objective function. Furthermore, the statistical analysis of variance was performed to
find the influence of the controllable process factors on the multi-objective function.
The first step of the grey relation analysis, GRA is the grey relation generation
performed in order to make experimental data comparable. During this step, the cutting
force, surface roughness and MRR are normalized between zero and one.
Depending on characteristics of a data sequence, various methodologies of carrying
out grey generation are available. In this study, a linear data pre-processing method for
the cutting force and surface roughness is the lower-the-better and is expressed as:
ijij
ijij
ijyy
yyx
minmax
max
(4)
where xij is the value after the grey relation generation, min yij is the smallest value of
original data yij for the jth response of the experiment i, and max yij is the largest value of
yij for the jth response.
The normalized value of the original sequence for material removal rate which is
larger-the-better performance characteristic can be expressed as:
ijij
ijij
ijyy
yyx
minmax
min
(5)
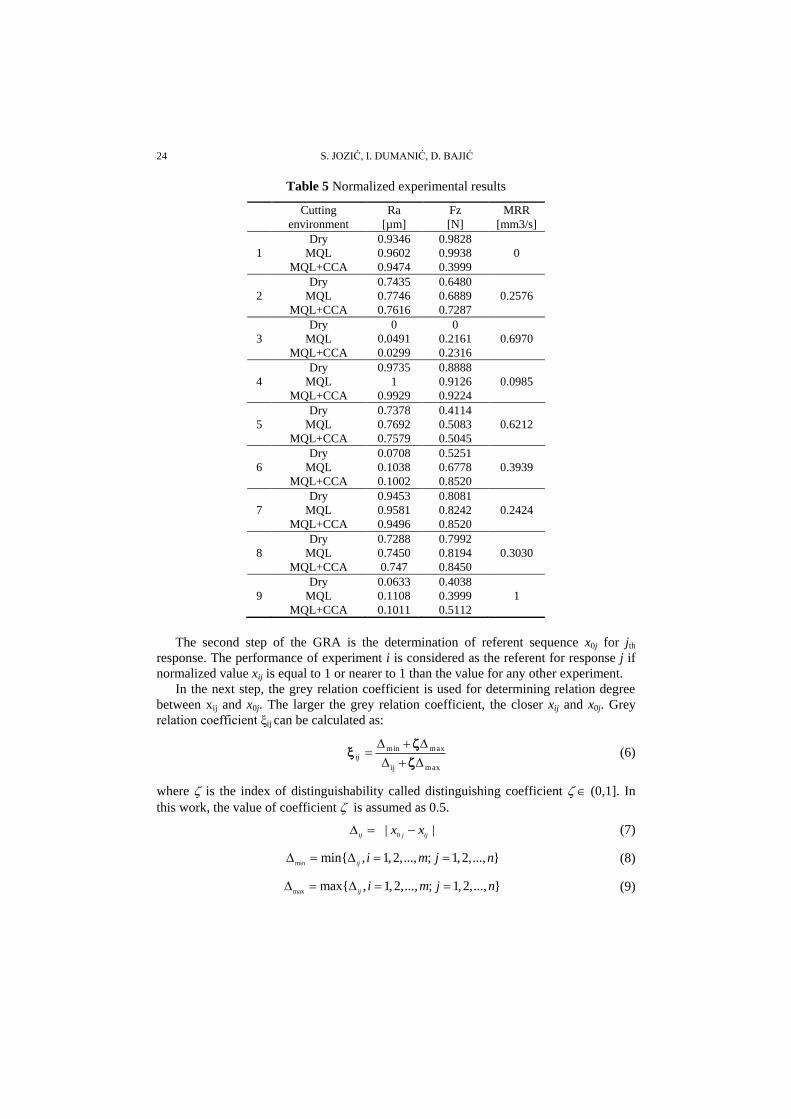
Table 5 shows the normalized values of surface roughness Ra, cutting force Fz and
material removal rate MRR.
24 S. JOZIĆ, I. DUMANIĆ, D. BAJIĆ
Table 5 Normalized experimental results
Cutting
environment
Ra
[µm]
Fz
[N]
MRR
[mm3/s]
1
Dry
MQL
MQL+CCA
0.9346
0.9602
0.9474
0.9828
0.9938
0.3999
0
2
Dry
MQL
MQL+CCA
0.7435
0.7746
0.7616
0.6480
0.6889
0.7287
0.2576
3
Dry
MQL
MQL+CCA
0
0.0491
0.0299
0
0.2161
0.2316
0.6970
4
Dry
MQL
MQL+CCA
0.9735
1
0.9929
0.8888
0.9126
0.9224
0.0985
5
Dry
MQL
MQL+CCA
0.7378
0.7692
0.7579
0.4114
0.5083
0.5045
0.6212
6
Dry
MQL
MQL+CCA
0.0708
0.1038
0.1002
0.5251
0.6778
0.8520
0.3939
7
Dry
MQL
MQL+CCA
0.9453
0.9581
0.9496
0.8081
0.8242
0.8520
0.2424
8
Dry
MQL
MQL+CCA
0.7288
0.7450
0.747
0.7992
0.8194
0.8450
0.3030
9
Dry
MQL
MQL+CCA
0.0633
0.1108
0.1011
0.4038
0.3999
0.5112
1
The second step of the GRA is the determination of referent sequence x0j for jth
response. The performance of experiment i is considered as the referent for response j if
normalized value xij is equal to 1 or nearer to 1 than the value for any other experiment.
In the next step, the grey relation coefficient is used for determining relation degree
between xij and x0j. The larger the grey relation coefficient, the closer xij and x0j. Grey
relation coefficient ξij can be calculated as:
maxij
maxmin
ij (6)
where is the index of distinguishability called distinguishing coefficient (0,1]. In
this work, the value of coefficient is assumed as 0.5.
0
| |ij j ij
x x (7)
minmin{ , 1,2,..., ; 1,2,..., }
iji m j n (8)
maxmax{ , 1,2,..., ; 1,2,..., }
iji m j n (9)
Experimental Analysis and Optimization of the Controllable Parameters in Turning of EN AW-2011 alloy... 25
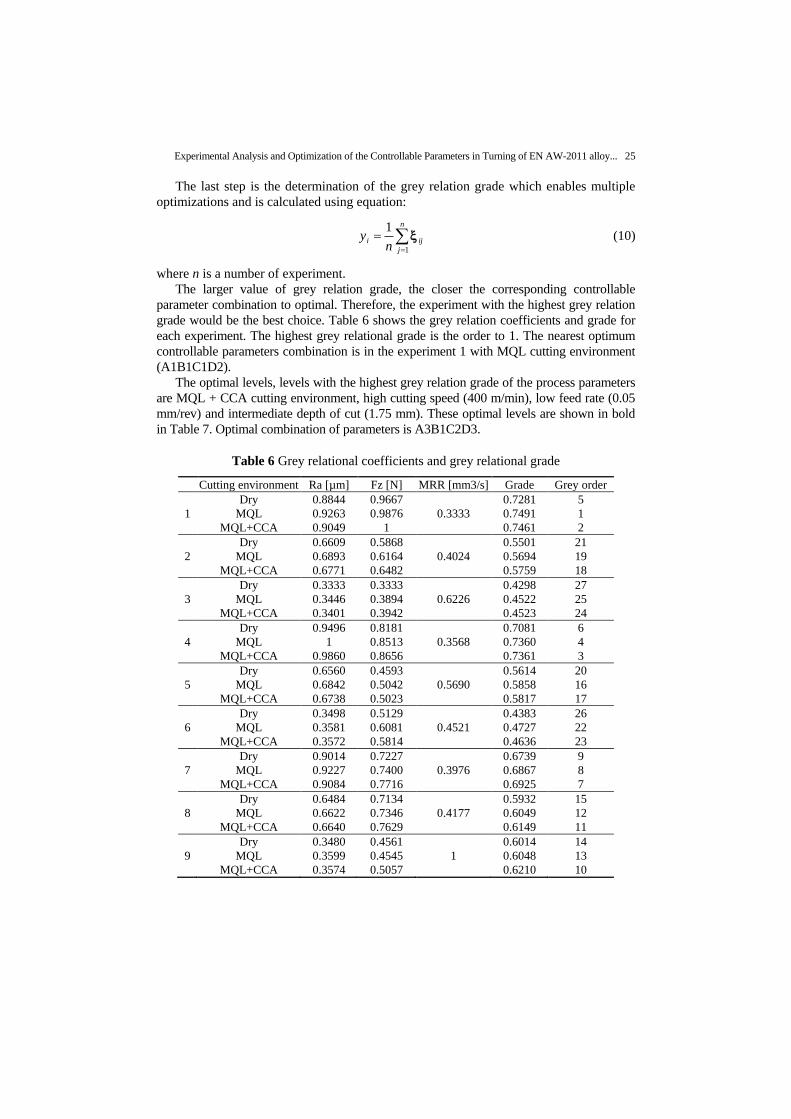
The last step is the determination of the grey relation grade which enables multiple
optimizations and is calculated using equation:
n
jiji
ny
1
1 (10)
where n is a number of experiment.
The larger value of grey relation grade, the closer the corresponding controllable
parameter combination to optimal. Therefore, the experiment with the highest grey relation
grade would be the best choice. Table 6 shows the grey relation coefficients and grade for
each experiment. The highest grey relational grade is the order to 1. The nearest optimum
controllable parameters combination is in the experiment 1 with MQL cutting environment
(A1B1C1D2).
The optimal levels, levels with the highest grey relation grade of the process parameters
are MQL + CCA cutting environment, high cutting speed (400 m/min), low feed rate (0.05
mm/rev) and intermediate depth of cut (1.75 mm). These optimal levels are shown in bold
in Table 7. Optimal combination of parameters is A3B1C2D3.
Table 6 Grey relational coefficients and grey relational grade
Cutting environment Ra [µm] Fz [N] MRR [mm3/s] Grade Grey order
1
Dry
MQL
MQL+CCA
0.8844
0.9263
0.9049
0.9667
0.9876
1
0.3333
0.7281
0.7491
0.7461
5
1
2
2
Dry
MQL
MQL+CCA
0.6609
0.6893
0.6771
0.5868
0.6164
0.6482
0.4024
0.5501
0.5694
0.5759
21
19
18
3
Dry
MQL
MQL+CCA
0.3333
0.3446
0.3401
0.3333
0.3894
0.3942
0.6226
0.4298
0.4522
0.4523
27
25
24
4
Dry
MQL
MQL+CCA
0.9496
1
0.9860
0.8181
0.8513
0.8656
0.3568
0.7081
0.7360
0.7361
6
4
3
5
Dry
MQL
MQL+CCA
0.6560
0.6842
0.6738
0.4593
0.5042
0.5023
0.5690
0.5614
0.5858
0.5817
20
16
17
6
Dry
MQL
MQL+CCA
0.3498
0.3581
0.3572
0.5129
0.6081
0.5814
0.4521
0.4383
0.4727
0.4636
26
22
23
7
Dry
MQL
MQL+CCA
0.9014
0.9227
0.9084
0.7227
0.7400
0.7716
0.3976
0.6739
0.6867
0.6925
9
8
7
8
Dry
MQL
MQL+CCA
0.6484
0.6622
0.6640
0.7134
0.7346
0.7629
0.4177
0.5932
0.6049
0.6149
15
12
11
9
Dry
MQL
MQL+CCA
0.3480
0.3599
0.3574
0.4561
0.4545
0.5057
1
0.6014
0.6048
0.6210
14
13
10
26 S. JOZIĆ, I. DUMANIĆ, D. BAJIĆ
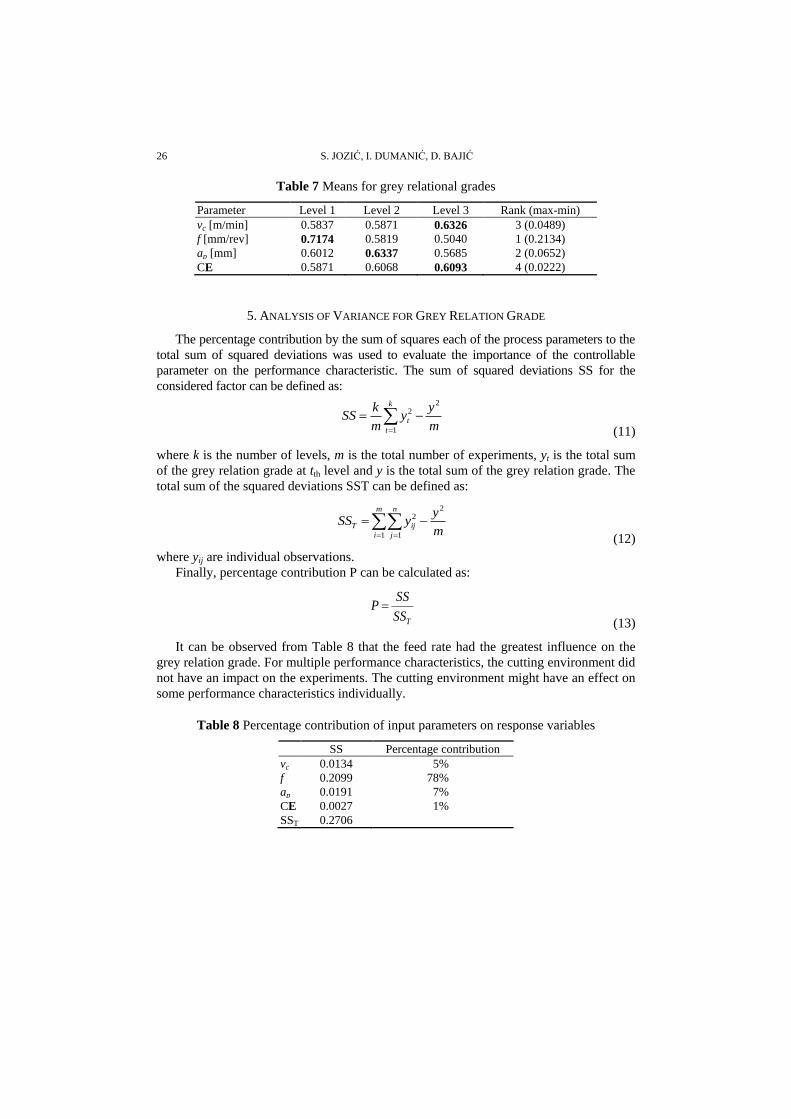
Table 7 Means for grey relational grades
Parameter Level 1 Level 2 Level 3 Rank (max-min)
vc [m/min] 0.5837 0.5871 0.6326 3 (0.0489)
f [mm/rev] 0.7174 0.5819 0.5040 1 (0.2134)
ap [mm] 0.6012 0.6337 0.5685 2 (0.0652)
CE 0.5871 0.6068 0.6093 4 (0.0222)
5. ANALYSIS OF VARIANCE FOR GREY RELATION GRADE
The percentage contribution by the sum of squares each of the process parameters to the
total sum of squared deviations was used to evaluate the importance of the controllable
parameter on the performance characteristic. The sum of squared deviations SS for the
considered factor can be defined as:
k
t
tm
yy
m
kSS
1
22
(11)
where k is the number of levels, m is the total number of experiments, yt is the total sum
of the grey relation grade at tth level and y is the total sum of the grey relation grade. The
total sum of the squared deviations SST can be defined as:
m
yySS
m
i
n
j
ijT
2
1 1
2 (12)
where yij are individual observations.
Finally, percentage contribution P can be calculated as:
TSS
SSP
(13)
It can be observed from Table 8 that the feed rate had the greatest influence on the
grey relation grade. For multiple performance characteristics, the cutting environment did
not have an impact on the experiments. The cutting environment might have an effect on
some performance characteristics individually.
Table 8 Percentage contribution of input parameters on response variables
SS Percentage contribution
vc 0.0134 5%
f 0.2099 78%
ap 0.0191 7%
CE 0.0027 1%
SST 0.2706
Experimental Analysis and Optimization of the Controllable Parameters in Turning of EN AW-2011 alloy... 27
6. CONFIRMATION TEST
Once the optimal level of controllable parameters is selected, the final step is to
predict and verify improvement of the performance characteristic using the optimal level
of the controllable parameters. Based on the previous discussion, the most significant
parameters with optimal level are cutting speed at level 3, feed rate at level 1 and depth
of cut at level 3. The estimated grey relation grade can be calculated as:
1
ˆ ( )p
t i t
i
y y y y
(14)
where yt is the total mean of the grey relation grade, p is the number of the controllable
parameter that significantly affects the multiple performance characteristic and yi is the
mean of the grey relation grade at the optimal level. Table 7 shows the estimated grey
relational grade for optimal controllable parameters calculated using Eq. (12).
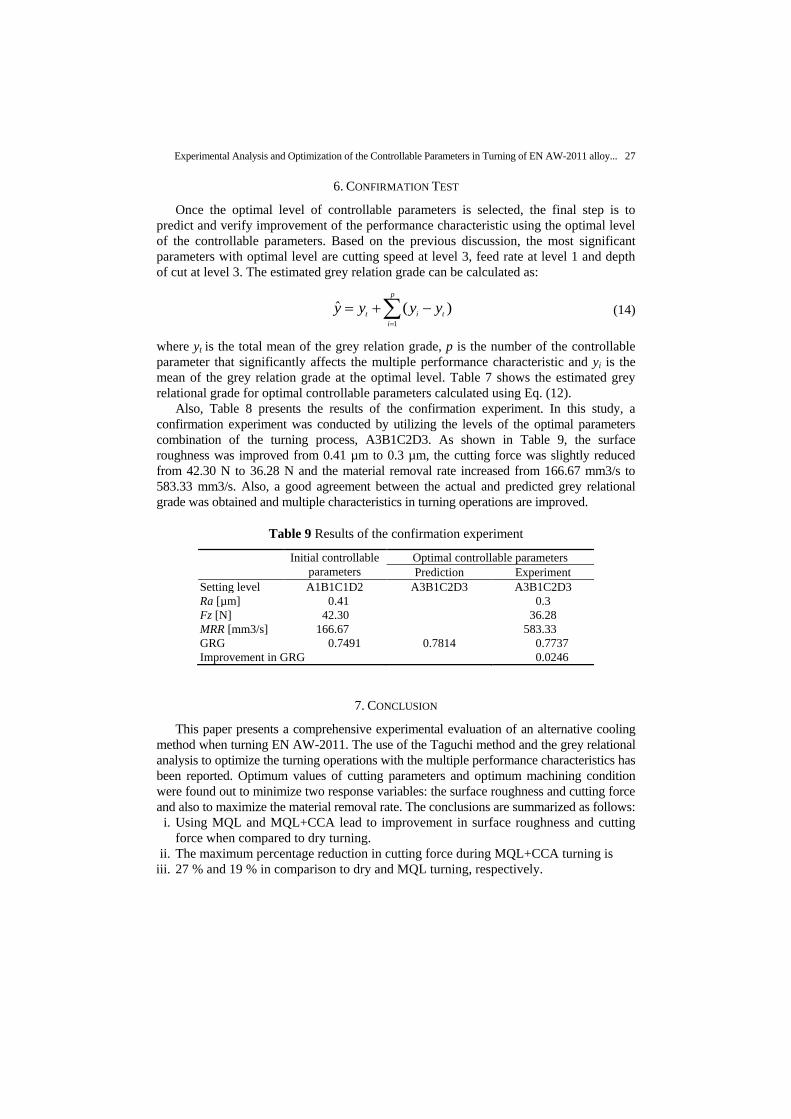
Also, Table 8 presents the results of the confirmation experiment. In this study, a
confirmation experiment was conducted by utilizing the levels of the optimal parameters
combination of the turning process, A3B1C2D3. As shown in Table 9, the surface
roughness was improved from 0.41 µm to 0.3 µm, the cutting force was slightly reduced
from 42.30 N to 36.28 N and the material removal rate increased from 166.67 mm3/s to
583.33 mm3/s. Also, a good agreement between the actual and predicted grey relational
grade was obtained and multiple characteristics in turning operations are improved.
Table 9 Results of the confirmation experiment
Initial controllable
parameters
Optimal controllable parameters
Prediction Experiment
Setting level A1B1C1D2 A3B1C2D3 A3B1C2D3
Ra [µm] 0.41 0.3
Fz [N] 42.30 36.28
MRR [mm3/s] 166.67 583.33
GRG 0.7491 0.7814 0.7737
Improvement in GRG 0.0246
7. CONCLUSION
This paper presents a comprehensive experimental evaluation of an alternative cooling
method when turning EN AW-2011. The use of the Taguchi method and the grey relational
analysis to optimize the turning operations with the multiple performance characteristics has
been reported. Optimum values of cutting parameters and optimum machining condition
were found out to minimize two response variables: the surface roughness and cutting force
and also to maximize the material removal rate. The conclusions are summarized as follows:
i. Using MQL and MQL+CCA lead to improvement in surface roughness and cutting
force when compared to dry turning.
ii. The maximum percentage reduction in cutting force during MQL+CCA turning is
iii. 27 % and 19 % in comparison to dry and MQL turning, respectively.
28 S. JOZIĆ, I. DUMANIĆ, D. BAJIĆ
iv. Using the optimal levels of the controllable parameters (A3B1C2D3) in the machining
process, it is possible to decrease surface roughness and cutting force as well as to
maximize the material removal rate.
v. Feed rate is the dominant factor affecting the main cutting force, surface roughness
and material removal rate.
This research did not receive any specific grant from funding agencies in the public,
commercial, or not-for-profit sectors.
REFERENCES
1. Kant, G., Sangwan, K.S., 2015, Predictive modelling and optimization of machining parameters to minimize
surface roughness using artificial neural network coupled with genetic algorithm, Procedia CIRP 31, pp. 453-
458.
2. Adler, D.P., Hii, W.W-S., Michalek, D.J., Sutherland, J.W., 2006, Examining the role of cutting fluids in
machining and efforts to address associated environmental/health concerns, Machining Science and
Technology, 10(1), pp. 23-58.
3. Hong, S.Y., Broomer, M., 2000, Economical and ecological cryogenic machining of AISI 304 austenitic
stainless steel, Clean Products and Processes, 2, pp. 157–166.
4. Goindi, G., Sarkar, P., 2017, Dry Machining: A Step towards Sustainable Machining - Challenges and Future
Directions, Journal of Cleaner Production 165, DOI: 10.1016/j.jclepro.2017.07.235
5. Lawal, S.A., Choudhury, I.A., Nukman, Y., 2012, A Critical Assessment of Lubrication Techniques in
Machining Processes: A Case for Minimum Quantity Lubrication Using Vegetable Oil-Based Lubricant,
Journal of Cleaner Production, doi: 10.1016/j.jclepro.2012.10.016.
6. Dhar, N.R., Islam, M.W., Islam, S., Mithu, M.A.H., 2006, The influence of minimum quantity of
lubrication (MQL) on cutting temperature, chip and dimensional accuracy in turning AISI-1040 steel,
Journal of Materials Processing Technology 171(1), pp. 93-99.
7. Priarone, P.C., Rizzuti, S., Rotella, G., Settineri, L., 2012, Tool wear and surface quality in milling of a
gamma-TiAl intermetallic, The International Journal of Advanced Manufacturing Technology, 61, pp.
25-33.
8. Jianxin, D., Tongkun, C., Lili, L., 2005, Self-lubricating behaviours of Al2O3/TiB2 ceramic tools in dry
high-speed machining of hardened steel, Journal of the European Ceramic Society 25, pp. 1073–1079.
9. Sharma, V.S., Dogra, M., Suri, N.M., 2009, Cooling techniques for improved productivity in turning,
International Journal of Machine Tools and Manufacture, 49(6), pp. 435-453.
10. Maruda, R.W., Legutko, S., Krolczyk, G.M., 2014, Effect of minimum quantity cooling lubrication
(MQCL) on chip morphology and surface roughness in turning low carbon steels, Applied Mechanics
and Materials, 657, pp.38-42.
11. Maruda, R.W., Legutko, S., Krolczyk, G.M., Raos, P., 2015, Influence of cooling conditions on the
machining process under MQCL and MQL conditions, Tehnički vjesnik, 22(4), pp. 965-970.
12. Dixit, U.S., Sarma, D.K., Davim, J.P., 2012, Environmentally friendly machining. Springer Science &
Business Media, LLC, New York.
13. Nouioua, M., Yallese, M.A., Khettabi, R., Chabbi, A., Mabrouki, T., Girardin, F., 2017, Optimization of
Machining Process During Turning of X210Cr12 Steel Under MQL Cooling as a Key Factor in Clean
Production. International Conference Design and Modeling of Mechanical Systems, DOI: 10.1007/978-
3-319-66697-6_83.
14. Pervaiz, S., Deiab, I., Rashid, A., Nicolescu, M., 2017, Minimal quantity cooling lubrication in turning of
Ti6Al4V: influence on surface roughness, cutting force and tool wear. Proceedings of the Institution of
Mechanical Engineers, Part B: Journal of Engineering Manufacture, 231(9), pp. 1542-1558.
15. Pervaiz, S., Rashid, A., Deiab, I., Nicolescu, C.M., 2016, An experimental investigation on effect of
minimum quantity cooling lubrication (MQCL) in machining titanium alloy (Ti6Al4V), The International
Journal of Advanced Manufacturing Technology, 87(5-8), pp. 1371-1386.
16. Yuan. S.M., Yan, L.T., Liu, W.D., Liu, Q., 2011, Effects of compressed cold air temperature on cryogenic
machining of Ti–6Al–4V alloy, Journal of Materials Processing Technology, 211(3), pp. 356-362.
Experimental Analysis and Optimization of the Controllable Parameters in Turning of EN AW-2011 alloy... 29
17. Singh, G., Sharma, V.S., 2017, Analysing machining parameters for commercially pure titanium (Grade
2), cooled using minimum quantity lubrication assisted by a Ranque-Hilsch vortex tube, International
Journal of Advanced Manufacturing Technology, 88, pp. 2921–2928.
18. Diyaley, S., Chakraborty, S., 2019, Optimization of multi-pass face milling parameters using
metaheuristic algorithms, Facta Universitatis-Series Mechanical Engineering, 17(3), pp. 365 – 383.
19. Gopal, P.M., Prakash, K.S., 2018, Minimization of cutting force, temperature and surface roughness
through GRA, TOPSIS and Taguchi techniques in end milling of Mg hybrid MMC, Measurement, 116,
pp. 178–192.
20. Fratila, D., Caizar, C., 2011, Application of Taguchi method to selection of optimal lubrication and
cutting conditions in face milling of AlMg3, Journal of Cleaner Production, 19(6-7), pp. 640-645.
21. Yan, J., Li, L., 2013, Multi-objective optimization of milling parameters–the trade-offs between energy,
production rate and cutting quality, Journal of Cleaner Production, 52, pp. 462-471.
22. Lin, C.L., 2004, Use of the Taguchi method and grey relational analysis to optimize turning operations
with multiple performance characteristics, Materials and manufacturing processes, 19(2), pp. 209-220.
23. Tripathy, S., Tripathy, D.K., 2017, Multi-response optimization of machining process parameters for
powder mixed electro-discharge machining of H-11 die steel using grey relational analysis and topsis.
Machining science and technology, 21(3), pp. 362-384.
24. Li, N., Chen, Y-J., Kong, D.D., 2019, Multi-response optimization of Ti-6Al-4V turning operations using
Taguchi-based grey relational analysis coupled with kernel principal component analysis, Advanced
Manufacturing, 7, pp. 142-154.
25. Mia, M., Khan, M.A., Dhar, N.R., 2017, Study of surface roughness and cutting forces using ANN, RSM,
and ANOVA in turning of Ti-6Al-4V under cryogenic jets applied at flank and rake faces of coated WC
tool, International Journal of Advanced Manufacturing Technology, 93(1–4), pp. 975–991.
26. Mia, M., Khan, M.A., Rahman, S.S., Dhar, N.R., 2017, Mono-objective and multi-objective optimization
of performance parameters in high pressure coolant assisted turning of Ti-6Al-4V, International Journal
of Advanced Manufacturing Technology, 90(1–4), pp. 109–118.
27. Aman, A., Hari, S., Pradeep, K., Manmohan, S., 2008, Optimizing power consumption for CNC turned
parts using response surface methodology and Taguchi's technique—A comparative analysis, Journal of
Materials Processing Technology, Volume 200(1) – May 8, 2008
28. Boswell, B., Islam, M.N., Davies, I.J., Ginting, Y.R., Ong, A.K., 2017, A review identifying the
effectiveness of minimum quantity lubrication (MQL) during conventional machining, International
Journal of Advanced Manufacturing Technology, 92, pp. 321–340.