Vicente Lopes Junior, [email protected] GMSINT – Grupo de Materiais e Sistemas Inteligentes, Department of Mechanical Engineering, UNESP/FEIS - Faculdade de
Engenharia de Ilha Solteira, Av. Brasil 56, Ilha Solteira, SP, Brazil, ZIP CODE 15385000, Phone Number: +55 18 3743 1000, Fax
Number +55 18 3742-2735, www.dem.feis.unesp.br/gmsint
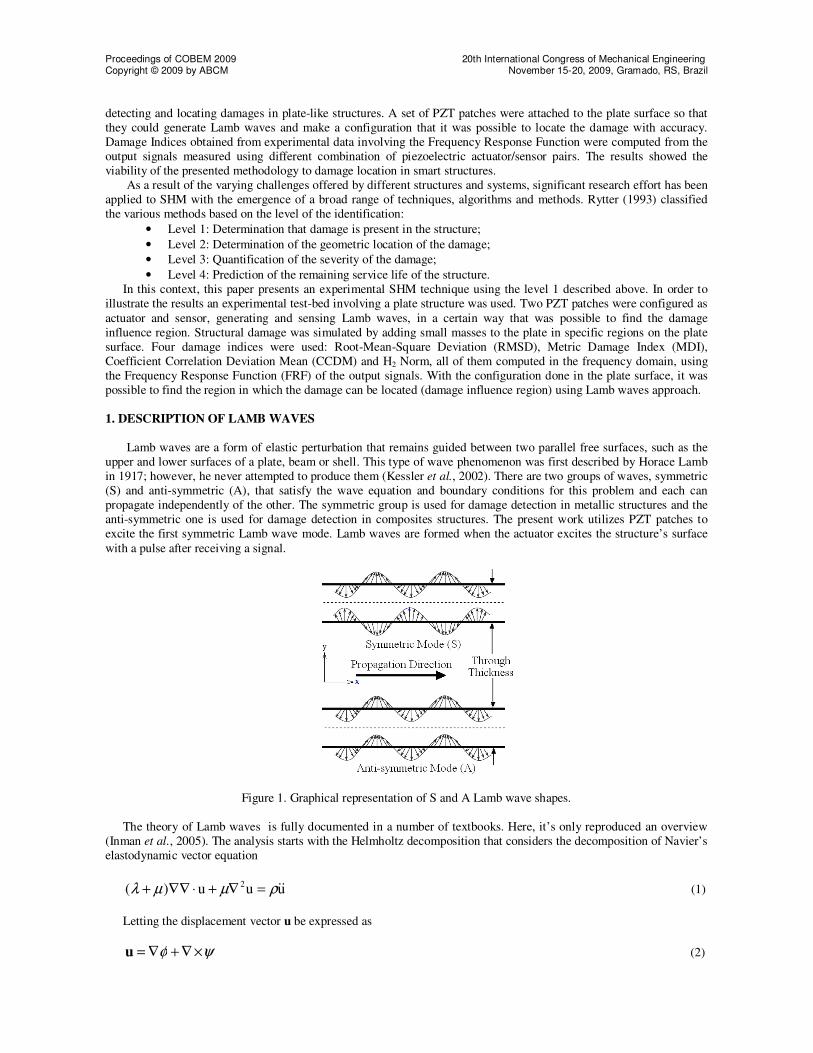
Abstract. This work presents an experimental analysis of the damage influence region in an aluminum plate like structure using Lamb Waves methodology and Piezoelectric Material (PZT) as actuators and sensors. Lamb waves are
a form of elastic perturbation that remains guided between two parallel free surfaces, such as the upper and lower
surfaces of a plate, beam or shell. The use of piezoelectric materials, coupled on a plate surface, in the formation of
Lamb waves for SHM, is an important field of study. When a PZT is coupled on a plate surface and used as actuator, it
tends to contract or expand, depending on the polarity of the electric field applied on it. As the structure deforms, a
movement of bending is induced on the surface and these waves spread along the plate. These waves are "felt" to other
PZTs, now being used as sensors. When a wave propagates on the plate, it comes at a PZT sensor from different ways.
One way is when the wave reaches the sensor directly, i.e. without obstacles in the way in which the wave spread. The
other possible way is when the wave reaches the sensor after reflected in the contours or discontinuities in the surface
(structural damage). With the various features about the received signal, and with the use of certain techniques of
signal processing, these damages can be detect and, thus, it’s possible to realize the correct action trying to avoid a total failure of the structure. In this context, the experimental tests were realized in an aluminum plate structure, in the
free-free-free-free boundary condition with piezoelectric patches (PZT) coupled on its surface. One PZT patch was
designated as actuator, exerting a predefined waveform into the structure. Then, another PZT became sensor and
measured the response signals. The PZT actuator excited the structure at a frequency range of 30 to 35 kHz, in a
sinusoidal waveform. The structural damage was simulated by additional masses coupled on the plate surface. The
damages were placed in specific positions on the plate surface and the position of these damages was varied in order
to obtain the influence region of the damage. It was used four damage indexes to detect structural damages using the
Lamb Waves methodology: Root-Means-Square Deviation (RMSD), Metric Damage Index (MDI), H2 Norm and
Correlation Coefficient Deviation (CCDM). These indexes were computed in frequency domain considering the
Frequency Response Function (FRF) of the output signals. The indexes showed the difference when a damaged
structure was considered. With the results obtained, it’s possible to obtain the region in which the damage can be
detected and making the correct Structural Health Monitoring scheme through Lamb Waves methodologies using piezoelectric materials as actuators and sensors.
Keywords: Structural Health Monitoring, Lamb Waves, Piezoelectric Material, Frequency Domain
1. INTRODUCTION
Nowadays, in the world of engineering, there is an interest in the development of a real-time Structural Health
Monitoring (SHM) method. SHM is a system with the ability to detect and interpret adverse “changes” in a structure.
An SHM system examines the structure for damage and provides information about any damage that is detected. This
type of system allows systems and structures to actively monitor their own structural integrity (Inman et al., 2005). An
SHM system typically consists of an onboard network of sensors for data acquisition and a central processor to evaluate the structural health. The development of “smart structures” has provided the necessary technology to implement in-situ
monitoring systems into complex structures. With the advances in actuator technology, particularly collocated sensor-
actuators, and microcomputer processing, effective and inexpensive Non-Destructive Evaluation of large complex
structures can be developed. The concept of the structural integration of sensing is known as “an intelligent system” or
“a smart structure”. To be effective, a SHM system must provide real-time and continuous structural health assessment.
The sensors must be an integral part of the structure, i.e., in-situ, in order to provide a measurement on a continuous
basis (Castanien and Lian, 1996).
Considered among the most promising methods in structural dynamics for SHM, the method of interrogating a
structure with high frequency waves (Lamb waves) is investigated in this paper. Many researchers have studied the
technology of SHM in which piezoelectric sensors/actuators are integrated into a structure. Using these actuators and
sensors it is possible to realize a structural monitoring system using Lamb waves. In particular, the use of Lamb waves
can offer a way of estimating damage occurrence in a structure in terms of location, severity and type of damage. Several different applications can be cited in this area, for instance, Franco et al. (2009) used piezoelectric material for
The four integration constants, A1, A2, B1, B2, are found from the boundary conditions. Thus, two possible solutions
result:
0sincos4cossin)(
0cossin4sincos)(
2222
2222
=+−=
=+−=
qdpdpqqdpdqD
qdpdpqqdpdqD
A
S
ξξ
ξξ (10)
representing the symmetric and anti-symmetric motion respectively.
Equation 10 can be rewritten in the more compact form as the Rayleigh–Lamb equation:
1
222
2
)(
4
tan
tan±
−
−=
q
pq
pd
qd
ξ
ξ (11)
where +1 corresponds to symmetric (S) motion and -1 to anti-symmetric (A) motion.
Therefore, given a certain isotropic material, Eq. 11 can be solved numerically to find the relation between the
driving frequency ω and the wavenumber ξ from which the corresponding phase velocity ξω /=pc can be found.
3. DAMAGE-SENSITIVE INDEXES
Three indices obtained through the FRF were investigated in this paper.
3.1. Root-Mean-Square Deviation (RMSD)
The RMSD index is presented here in the following form (Lopes Jr et al., 2002):
( ) ( )[ ]( )[ ]∑
=
−=
n
i i
ii
Y
YYRMSD
12
1,
2
2,1, (12)
where 1,iY is the FRF of the baseline condition, or healthy structure, of the PZT sensor and 1,iY is the FRF in the same
PZT in unknown structural conditions at frequency interval i .
3.2. H2 Norm
The H2 norm of a system is used to characterize the system itself, along with its modes and its sensors. Let )(ωG be
a transfer function of a system. The H2 norm of the system is defined as (Gawronski, 1998):
( ) ( )( )( ) ωωωπ
dGGG ∫∞+
∞−= *2
2tr
2
1 (13)
where tr is the trace of ωωω dGG ))()((* .
Generally, the H2 norm is computed using modal coordinates, but in this way it is necessary to obtain a model for
the equation motion. The numerical value for the H2 norm for a SISO (single-input-single-output) system corresponds the area under the absolute value of the FRF of the system (Gawronski, 1998). In this paper, the area under of the FRF
curve was computed using the Trapezoidal method, implemented in the software Matlab® through command “trapz”
(Bueno et al., 2007).
The H2 norm can be used for damage detection using the following procedure: consider the norm computed using
the jth PZT sensor; and denoting it for a healthy structure by ||Gshj||2, and jth PZT sensor norm of a damaged structure by
||Gsdj||2. The jth sensor index of the structural damage is defined as weighted difference between the jth sensor norm of
healthy and unknown structural conditions (damaged structure) (Gawronski and Sawicki, 2000):
Table 1. Physical properties and dimensions of the plate.
Property Value
Young Modulus (GPa) 70
Thickness (m) 0.0015
Length/Width (m) 0.24
Density (Kg/m3) 2710
The PZT 2 was designated as actuator, sending a predefined wave through the structure’s surface and the PZT 3
became sensor and measured the response signal. The experimental setup is shown in Fig. 4a and the scheme
input/output is shown in Fig. 4b.
(a) (b)
Figure 4. (a) Experimental Setup; (b) Excitement and Measurement Procedure.
In order to find the damage influence region through Lamb waves methodology, it was necessary to make a specific
configuration that is able to show the boundary region between the PZT actuator and sensor in which the damage can be
detected. For this, a line was drawn diagonally across the plate, joining the PZT 2 (actuator) and PZT 3 (sensor), referred to "center line". Perpendicular to this line, three other lines were drawn, as can be seen in Fig. 5:
• The first line was drawn closer to PZT 2 (actuator).
• The second line was drawn in the central region of the plate (the other diagonal of the plate, joining the PZT 1 and
PZT 4).
• The third line was drawn closer to PZT 3 (sensor).
Figure 5. Configuration Drown in the Plate Surface.
In each line, marks were made in which the damages were positioned. Whereas there is symmetry of the wave on the "central line", the tests were performed with the damage being placed on only one side of the structure.
In the first and third line, marks were made every 10 mm, from the center line, as seen in Fig. 6a and 6c respectively. In
the second line, in the central area, the marks were made every 20mm, Fig. 6b.
Figure 6. Detail of the lines drown (a) closer to PZT 2, (b) in the central region and (c) closer to PZT 3.
The PZT actuator excited the structure in a frequency range of 30 to 35 kHz, in a sinusoidal waveform, exciting the first symmetric Lamb wave mode. It was used the National Instrument NI USB-6211 for the data acquisition. Firstly,
the tests were realized in the structure without the damage, getting the baseline condition. Then, another test was
performed with the structure without damage, in order to compare with the baseline condition. The failure was
simulated by an additional mass (nut of 1g) coupled on the structure’s surface. Three sets of tests were performed, now
with the addition of the damages according to the scheme previously described, i.e.,
- Condition 1) Proximity of PZT 2: the damage was positioned 10mm from the center line and the
position was varied of 10 in 10mm up to 50mm;
- Condition 2) Central Region: the damage was positioned 20mm from the center line, and the position
was varied of 20 in 20mm up to 120mm;
- Condition 3) Proximity of PZT 3: The damage was positioned 10mm from the center line and the position was varied of 10 in 10mm up to 50mm.
Figure 7 shows some examples of FRFs obtained for different damage condition in the frequency range of 30-35 kHz.
3 3.05 3.1 3.15 3.2 3.25 3.3 3.35 3.4 3.45 3.5
x 104
40
60
80
3 3.05 3.1 3.15 3.2 3.25 3.3 3.35 3.4 3.45 3.5
x 104
40
60
80
3 3.05 3.1 3.15 3.2 3.25 3.3 3.35 3.4 3.45 3.5
x 104
40
60
80
Ma
gn
itu
de (
dB
)
3 3.05 3.1 3.15 3.2 3.25 3.3 3.35 3.4 3.45 3.5
x 104
40
60
80
Frequency (Hz)
(a)
(b)
(c)
(d)
Figure 7. Examples of FRFs obtained in the experimental tests; (a) FRF – baseline, (b) FRF Condition 1 – 10mm,
Figure 8. Damage Indexes computed to the Damage condition 1.
It is possible to observe in Fig. 8 that the indexes for the structure without the damage (referred to H.S.) were close
to zero. When the damage was added to the structure in the 10mm position of the central line, all indexes were capable
of to detect the presence of the damage in the structure. It is interesting to note that, as the damage go far to the center line, the indexes tend to rise in the beginning and after a certain position, the indexes do not detect the presence of
damage anymore. For this damage condition, the damage is not detected when it is positioned at a distance of 50mm
from the center line. Figure (9) shows the maximum position that the damage could be detected.
Figure 9. Maximum position of damage identification for the Condition 1.
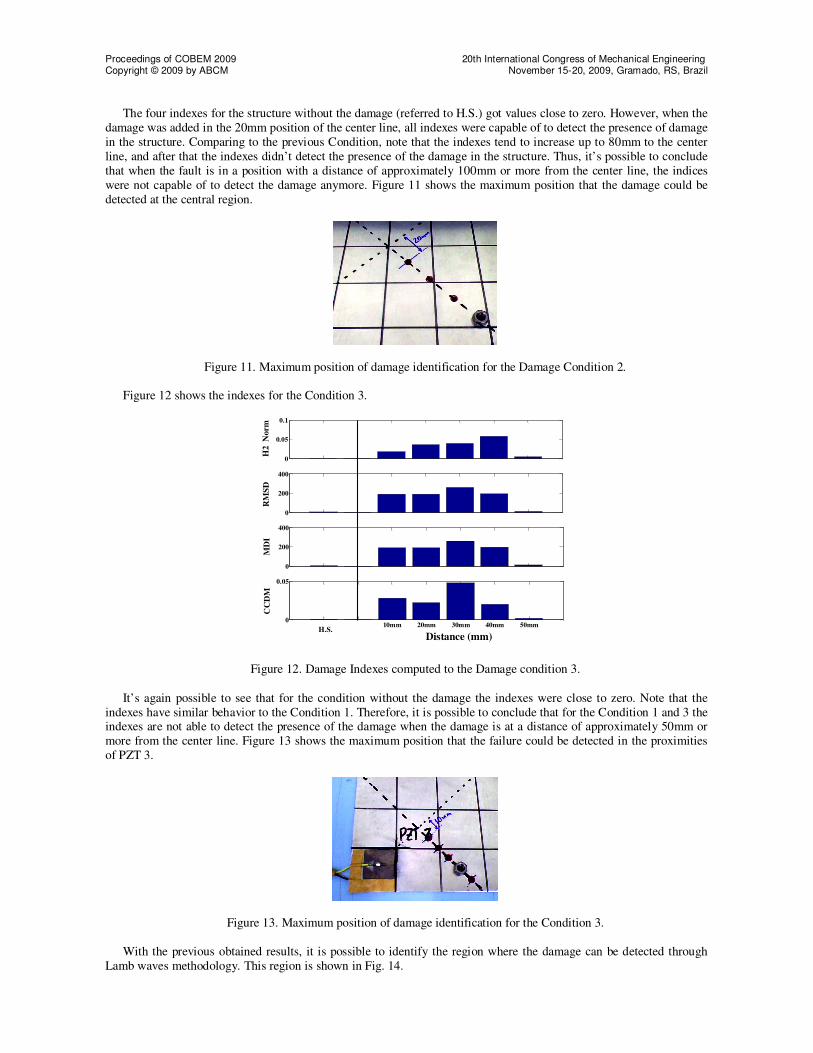
Figure 10 shows the indexes obtained to the Condition 2.
Figure 9. Damage Indexes computed to the Condition 2.
The four indexes for the structure without the damage (referred to H.S.) got values close to zero. However, when the
damage was added in the 20mm position of the center line, all indexes were capable of to detect the presence of damage
in the structure. Comparing to the previous Condition, note that the indexes tend to increase up to 80mm to the center
line, and after that the indexes didn’t detect the presence of the damage in the structure. Thus, it’s possible to conclude
that when the fault is in a position with a distance of approximately 100mm or more from the center line, the indices
were not capable of to detect the damage anymore. Figure 11 shows the maximum position that the damage could be
detected at the central region.
Figure 11. Maximum position of damage identification for the Damage Condition 2.
Figure 12 shows the indexes for the Condition 3.
0
0.05
0.1Damage Indexes Computed - Closer to PZT 3
H2 N
orm
0
200
400
RM
SD
0
200
400
MD
I
S.F. 10mm 20mm 30mm 40mm 50mm0
0.05
CC
DM
Distance (mm)
Figure 12. Damage Indexes computed to the Damage condition 3.
It’s again possible to see that for the condition without the damage the indexes were close to zero. Note that the
indexes have similar behavior to the Condition 1. Therefore, it is possible to conclude that for the Condition 1 and 3 the indexes are not able to detect the presence of the damage when the damage is at a distance of approximately 50mm or
more from the center line. Figure 13 shows the maximum position that the failure could be detected in the proximities
of PZT 3.
Figure 13. Maximum position of damage identification for the Condition 3.
With the previous obtained results, it is possible to identify the region where the damage can be detected through
Lamb waves methodology. This region is shown in Fig. 14.
In this paper, four damage sensitive indexes were used to identify the damage influence region using the Lamb
waves methodology. The indexes showed the difference when a damaged structure was considered. Generally, the
indexes showed a peculiar characteristic: the indexes tend to increase when the failure go far from the center line until a
certain point that the indexes began to decline up to the damage could not be detected anymore. Thus, the configuration
used was capable of to identify the region where the damage can be detected.
6. ACKNOWLEDGEMENTS
The authors are thankful to CAPES, CNPq and to the members of GMSINT – Group of INTelligent Materials and
Systems.
4. REFERENCES
Bueno, D.D., Silva, S., Marqui, C.R. and Lopes Jr., V.,2007, “Compartive Study of Damage-Sensitive Indices Used for
Structural Health Monitoring of Smart Structures”, in 19th
International Congress of Mechanical Engineering -
COBEM, Brasília, DF.
Castanien, K. E. and Lian, C.,1996, “Application of active structural health monitoring technique to aircraft fuselage structures”, SPIE: Smart Structures and Materials 1996, Vol 2721, pp. 38-49.
Franco, V. R., Bueno, Brennan, M.J., Cavalini Jr., Gonsalez, C.G. and Lopes Jr, V., 2009, “Experimental Damage
Location in Smart Structures Using Lamb Waves Approaches”, in 8th
Brazilian Conference on Dynamics, Control
and their Applications – DINCON 2009, Bauru, SP, Brazil.
Gawronski, W. K. and Sawicki, J.T., 2000, “Structural Damage Detection Using Modal Norms”, Journal of Sound and
Vibration, pp 194-198.
Gawronski, W.,1998, “Dynamics and Control of Structures, A Modal Approach”, 1. Ed. New York, Springer Verlag.
Inman, D. J., Farrar, C. R., Lopes Jr., V. and Steffen Jr, V.,2005, “Damage Prognosis for Aerospace, Civil and
Mechanical Systems.” 01. ed. West Sussex: John Wiley & Sons Ltda, v. 01. 449 p.
Kessler, S. S., Spearing, S. M. and Soutis, C., 2002, “Damage detection in composite materials using Lamb wave
methods” Smart Materials And Structures, 11, pp. 269–278. Lopes Jr., V., Park, G., Cudney, H. H. and Inman, D. J., 2000, “Impedance based structural health monitoring with
artificial neural networking”. Journal of Intelligent Material Systems and Structures, v. 11, p. 206-214.
Park, G., Cudney, H. and Inman, D. J.,2000, “Impedance-based Health Monitoring of Civil Structural Components”,
ASCE/Journal of Infrastructure Systems, v. 6, n. 4, p. 153-160.
Rytter, A.,1993, Vibration based inspection of civil engineering structures. Ph.D. Dissertation, Department of Building
Technology and Structural Engineering, Aalborg University, Denmark.
5. RESPONSIBILITY NOTICE
The authors are the only responsible for the printed material included in this paper.