Experimental and analysis study on dispersion of phases in an Ebullated Bed Reactor Mohammad F. Abid 1, * , Zainab Y. Shanain 1 , and Kadhim N. Abed 2 1 Department of Chemical Engineering, University of Technology, P.O. Box 18310, Baghdad, Iraq 2 Directorate of Technical Education, Ministry of Education, Baghdad, Iraq Received: 11 June 2018 / Accepted: 17 December 2018 Abstract. The effectiveness and performance of industrial hydro-processing Ebullated Bed Reactors (EBRs) are highly dependent on the bed hydrodynamics and operating conditions. In present work, hydrodynamics of EBRs was studied in a cold model experimental setup using air–water–solid particles system. Pressure gra- dient method and Residence Time Distribution (RTD) technique were used to estimate the individual holdups, and dispersion coefficients in the lab-scale ebullated bed column. System Hydraulic Efficiency (HEF) was also estimated. The results showed that liquid internal recycle ratio, which characterized the EBRs, has a predom- inant effect on the individual holdups and dispersion coefficients. Empirical correlations were developed for prediction of phase holdups, and dispersion coefficients with good accuracy. Nomenclature A s Cross-sectional area (cm 2 ) C Tracer concentration in liquid phase (mg/L) d h Distributor hole diameter (mm) D axL Liquid axial dispersion coefficient (cm 2 /s) E Exit age distribution function (1/s) E b Bed porosity (–) E G Gas holdup in the dispersed bed (–) E L Liquid holdup in the dispersed bed (–) E S Solid holdup in the dispersed bed (–) g Gravity force (m/s 2 ) H Height of column (cm) H s High of solid in the column (cm) L Tested length of reactor (cm) M s Mass of solid (kg) R Recycle ratio (= recycle liquid flow rate/fresh feeding liquid flow rate) t Time (s) t m Mean residence time (s) u L Superficial liquid velocity at column inlet after mixing (= u Lo (1 + R)) (cm/s) u Lo Superficial liquid velocity of fresh feed (at R = 0) (cm/s) u G Superficial gas velocity (cm/s) V b Volume of the bed (cm 3 ) V p Volume of the particles (cm 3 ) V R Reactor volume (cm 3 ) Greek symbols q g Density of gas (kg/m 3 ) q l Density of liquid (kg/m 3 ) q s Density of solid (kg/m 3 ) l l Liquid viscosity (mPa s) l g Gas viscosity (mPa s) r Gas–liquid surface tension (kg/s 2 ) DP Pressure drop (kPa) r 2 Variance (s 2 ) 1 Introduction The Ebullated Bed Reactor (EBR), shown in Figure 1, plays a significant function in the developing of hydrocon- version processes. The reactor is considered as a continuous flow three-phase (gas–liquid–solid) bubble column. The packing of catalyst is distinguished by little pressure drop decline, blocked-free, and a good mixing between oil and particles which behaving like a complete back-mixed reactor. A major merit of the EBR is the removal and make-up of the catalyst particles from time to time without * Corresponding author: [email protected]This is an Open Access article distributed under the terms of the Creative Commons Attribution License (http://creativecommons.org/licenses/by/4.0), which permits unrestricted use, distribution, and reproduction in any medium, provided the original work is properly cited. Oil & Gas Science and Technology - Rev. IFP Energies nouvelles 74, 20 (2019) Available online at: Ó M.F. Abid et al., published by IFP Energies nouvelles, 2019 ogst.ifpenergiesnouvelles.fr https://doi.org/10.2516/ogst/2018103 REGULAR ARTICLE
Transcript
Experimental and analysis study on dispersion of phasesin an Ebullated Bed ReactorMohammad F. Abid1,*, Zainab Y. Shanain1, and Kadhim N. Abed2
1 Department of Chemical Engineering, University of Technology, P.O. Box 18310, Baghdad, Iraq2 Directorate of Technical Education, Ministry of Education, Baghdad, Iraq
Received: 11 June 2018 / Accepted: 17 December 2018
Abstract. The effectiveness and performance of industrial hydro-processing Ebullated Bed Reactors (EBRs)are highly dependent on the bed hydrodynamics and operating conditions. In present work, hydrodynamicsof EBRs was studied in a cold model experimental setup using air–water–solid particles system. Pressure gra-dient method and Residence Time Distribution (RTD) technique were used to estimate the individual holdups,and dispersion coefficients in the lab-scale ebullated bed column. System Hydraulic Efficiency (HEF) was alsoestimated. The results showed that liquid internal recycle ratio, which characterized the EBRs, has a predom-inant effect on the individual holdups and dispersion coefficients. Empirical correlations were developed forprediction of phase holdups, and dispersion coefficients with good accuracy.
Nomenclature
As Cross-sectional area (cm2)C Tracer concentration in liquid phase (mg/L)dh Distributor hole diameter (mm)DaxL Liquid axial dispersion coefficient (cm2/s)E Exit age distribution function (1/s)Eb Bed porosity (–)EG Gas holdup in the dispersed bed (–)EL Liquid holdup in the dispersed bed (–)ES Solid holdup in the dispersed bed (–)g Gravity force (m/s2)H Height of column (cm)Hs High of solid in the column (cm)L Tested length of reactor (cm)Ms Mass of solid (kg)R Recycle ratio (= recycle liquid flow rate/fresh
feeding liquid flow rate)t Time (s)tm Mean residence time (s)uL Superficial liquid velocity at column inlet after
mixing (= uLo (1 + R)) (cm/s)uLo Superficial liquid velocity of fresh feed (at R = 0)
(cm/s)uG Superficial gas velocity (cm/s)Vb Volume of the bed (cm3)
Vp Volume of the particles (cm3)VR Reactor volume (cm3)
Greek symbols
qg Density of gas (kg/m3)ql Density of liquid (kg/m3)qs Density of solid (kg/m3)ll Liquid viscosity (mPa s)lg Gas viscosity (mPa s)r Gas–liquid surface tension (kg/s2)DP Pressure drop (kPa)r2 Variance (s2)
1 Introduction
The Ebullated Bed Reactor (EBR), shown in Figure 1,plays a significant function in the developing of hydrocon-version processes. The reactor is considered as a continuousflow three-phase (gas–liquid–solid) bubble column. Thepacking of catalyst is distinguished by little pressure dropdecline, blocked-free, and a good mixing between oil andparticles which behaving like a complete back-mixedreactor. A major merit of the EBR is the removal andmake-up of the catalyst particles from time to time without* Corresponding author: [email protected]
This is an Open Access article distributed under the terms of the Creative Commons Attribution License (http://creativecommons.org/licenses/by/4.0),which permits unrestricted use, distribution, and reproduction in any medium, provided the original work is properly cited.
Oil & Gas Science and Technology - Rev. IFP Energies nouvelles 74, 20 (2019) Available online at:� M.F. Abid et al., published by IFP Energies nouvelles, 2019 ogst.ifpenergiesnouvelles.fr
upsetting the continuous operation (Kressmann et al.,2000). The amelioration of this process and the technologyneed a reliable and proven method for a better understand-ing of process hydrodynamics. Residence Time Distribution(RTD) test is an effective gadget tool that can be utilized toexamine the deficiency of chemical reactors. It can also beadvantageous in designing reactor. This procedure is, thus,also significant in educate reaction engineering for non-idealreactors (Froment et al., 2010). This simple route tomeasure the quantity of mixing is suitable to combinekinetics in the estimation of reactor is classically conductedby utilizing RTD studies (Fogler, 1999).
van Gelder and Westerterp (1990) carried out an impulsetracer experiments in a co-current up flow fixed-bed reactorfor CH3OH/H2 system at low superficial velocities(uL = 0.02–0.15 mL/min and uG = 0.49–14.33 mL/min),and at higher pressure (0.2–1.2 MPa). The mixingcharacteristics were described by estimation of the axial dis-persion. They utilized the method of weighted moments toevaluate the parameters. They used various kinds of mathe-matical relations for the Bodenstein number and fluid hold-up. From these mathematical relations, the optimal one waschosen for each variable. They concluded that the weightedmoments method were more reliable than the ordinarymoments. Kressmann et al. (2000) conducted an RTD studyusing a radioactive tracer on a lab-scale unit of EBR. Theseexperiments measured the quantity of the hydrodynamicsand the fluid holdup in the reactor. Authors reported thatthese variables are safely securing an extrapolation of thepilot plant results. Schweitzer and Kressmann (2004) devel-oped an unsteady-state model for non-isothermal oper-ated catalytic reactor involving hydrodynamics andkinetics. For validation of the formulated model, a lab-scalereactor was operated under industrial conditions withradioactive tracer test for RTD measurements. Authorsreported a good agreement between their model and experi-mental results. Sanchez et al. (2005) studied the hydrody-namic characteristics and gas–liquid mass transfer in alaboratory scale inverse turbulent bed reactor. They utilizedthe RTD in order to characterize internal flow in the reactor.Different solid hold-up (0–0.37) and air superficial velocity
(2.7–6.5 mm/s) values were assayed in RTD experiments.Authors formulated a model that represented thehydrodynamic of the inverse turbulent bed considering thereactor as two-mixed tank of different volumes in series.Sanchez et al. revealed that the value of the volumetricgas–liquid mass transfer coefficient (kLa) was independentof the solid hold-up. Pjontek and Macchi (2014) performedexperiments to validate the use of two sizes of glass spheresand cylindrical with diameters of 4 and 1.5 mm when inves-tigating the global hydrodynamic features of a co-currentgas–liquid–solid fluidized bed. Authors reported that highgas holdup conditions were obtained by increasing thesystem pressure to 6.5 MPa and/or adding a surfactant.The experiments were conducted in a 101.6 mm diametercolumn and a maximum expanded bed height of 1.8 m withtap water or a 0.5 wt.% aqueous ethanol solution as the liq-uid phase. Global phase holdups measured from thedynamic pressure profiles characterized the hydrodynamicbehavior of the fluidized bed and the standard deviationsof the mean holdups aided the comparison and also exam-ined the fluctuations of the bed interface. Liquid–solidfluidized bed experiments demonstrated that equivalentSauter mean diameters resulted in comparable bed porosi-ties. Authors found that gas–liquid–solid fluidized beddynamics of equivalent size spherical and cylindrical parti-cles were similar in the dispersed bubble flow regime whereasdifferences were observed in the presence of larger coalescingbubbles. Parisien et al. (2017) conducted experiments toinvestigate the impact of a wide particle density distributionon gas–liquid–solid fluidized beds phase holdups and bedbehavior when operating under high gas holdup conditionsrelevant to the EBR. The experiments were performed atambient temperature and pressure in a clear polyvinylchloride column with a maximum expanded bed height of2.7 m and an inner diameter of 0.152 m. The range of oper-ating conditions was (uLo = 0–47 mm/s, uG = 0–45 mm/s,P = 104 kPa). A 0.5 wt.% aqueous ethanol solution wasused to obtain relatively high gas holdups as observed inmany industrial reactors containing liquid mixtures withsurface-active compounds. Authors reported that at ele-vated liquid flow rates, the bed interface became more stabledue to smaller bubbles being formed because of the greatershear stress at the gas–liquid distributor. Solid holdup wasthe most affected by the particle density distribution, wherebed expansion/contraction was dependent of the liquid flowrate due to varying particle-bubble dynamics. Authorsindicated that such information provided guidance onpotential factors that can lead to the loss of bed-freeboardinterface in the operation of heavy oil hydroprocessors suchas the LC-FinerSM. Shah et al. (2012) studied extensively thegas holdup, axial liquid dispersion, and mass transfer inpacked, trayed, and empty bubble columns. They revealedthat the gas holdup and mass transfer characteristics ofthe packed and trayed bubble columns are superior to thoseof an empty bubble column, while the axial dispersioncoefficients are much lower. Shah et al. correlated the exper-imental data of the different types of bubble columns bydimensionless number, Bodenstein number (for axialdispersion coefficient), and Stanton number (for thevolumetric mass transfer coefficient), as a function of the
Fig. 1. Schematic of the Ebullated Bed Reactor (EBR)(Kressmann et al., 2000).
M.F. Abid et al.: Oil & Gas Science and Technology - Rev. IFP Energies nouvelles 74, 20 (2019)2
Froude and Galileo dimensionless numbers. The presentstudy aimed to investigate hydrodynamic characteristics(e.g., holdups of phases and liquid axial dispersion) of a coldlab-scale EBR using the RTD technique and pressuremeasurements. Another objective was to formulate empiri-cal correlations for the hydrodynamic parameters as afunction of the studied operating variables (e.g., internalrecycle ratio, and superficial velocities of liquid and gas).
2 Theoretical aspects
Pressure drop measurement was used to determine individ-ual holdups (i.e., Eg, El and Es). The pressure drop could becorrelated to the density of the fluid phases,
�P ¼ g �H s qg Eg þ ql El þ qs Es
� �: ð1Þ
The solids hold-up can be estimated using equation (2):
Es ¼M s
As �H sqs: ð2Þ
Equation (3) represents the phases existed in the reac-tor, then;
Eg þ El þ Es ¼ 1: ð3Þ
Equations (1)–(3) were solved for the three phase hold-ups at various heights along the column:
Eg ¼ql � Es ql � �p
H sþ Es qs
ql � qg; ð4Þ
El ¼ 1� Es �ql � Es ql � �p
H sþ Es qs
ql � qg: ð5Þ
The dispersion coefficient was calculated using the RTDtest from experimental data.
Mean residence time (tm) was estimated usingequation (6) (Saroha and Khera, 2006):
tm ¼R1
0 t iCi dtR1
0 Ci dtffiP
ti Ci �tP
Ci �t¼Z 1
0t E tð Þdt; ð6Þ
where E (t) is RTD function evaluated by equation (7)(Fogler, 1999):
E tð Þ ¼ CiR10 Ci dt
ffi CiPCi �t
: ð7Þ
Liquid axial dispersion coefficient (Daxl) was estimatedin terms of liquid Peclet number (PeL) by equation (8)(Chander et al., 2001; Fogler, 1999; Levenspiel, 1999):
ri2
tmð Þ2¼ 2
PeLðPeL � 1þ e� PeLÞ; ð8Þ
where,
PeL ¼uLLDaxL
; ð9Þ
uL ¼ u Lo 1þ Rð Þ; ð10Þ
uLo: liquid superficial velocity of fresh feed (without mix-ing with recycle liquid),uL: liquid superficial velocity at inlet of column (aftermixing with recycle liquid).
ri2 ¼
R10 ti 2Ci dtR1
0 Ci dt� tmð Þ2 ffi
Pti 2Ci �tP
Ci �t� tmð Þ2: ð11Þ
Thackston et al. (1987) reported that a function calledas the Hydraulic Efficiency (HEF) could be used to quantifythe allocation and mixing of fluids inside the reactor,expressed by equation (12):
HEF ¼ cV: cRTD; ð12Þ
cV; and cRTD are system volumetric efficiency and efficiencyof RTD respectively.
cV ¼tms; ð13Þ
cRTD ¼ 1� rh2; ð14Þ
rh2 ¼ r2
tm2 ; ð15Þ
where rh2 and r2 are system dimensionless variance and
tracer flow variance respectively.Percentage stagnant regions in the reactor (Zd, %) could
be calculated using equation (16) (Sarathai et al., 2010):
Zd ð%Þ ¼ 1 � tms
� �� 100; ð16Þ
where s is the Nominal residence time ¼ volume of reactorvolumetric flow rate:
3 Experimental
3.1 Material
Sodium chloride (NaCl) obtained from Merck and was usedfor conductivity measurements. CoMo/Al2O3 catalyst (par-ticle density (qs), 1.7 g/cm3; particle diameter, 2.5 mm(sphericity, 0.803); particle length, 5 mm; bed porosity,0.8; interfacial area, 180 m2/g; volume of pore, 0.5 mL/g)supplied from Al-Daura Oil Refinery in Baghdad city,and was used as a solid bed. Pre-filtered air was used asthe gas phase. Other facilities and equipment used forexperimental setup and process measurements are shownin Table 1.
M.F. Abid et al.: Oil & Gas Science and Technology - Rev. IFP Energies nouvelles 74, 20 (2019) 3
3.2 Experimental setup
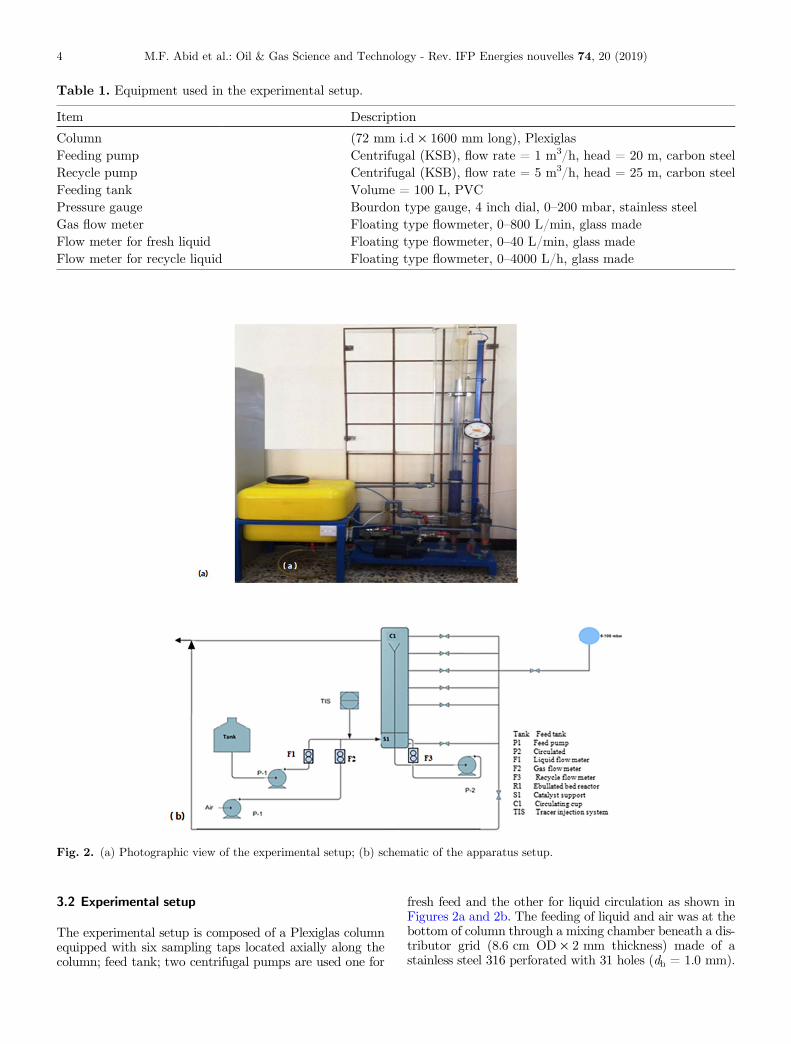
The experimental setup is composed of a Plexiglas columnequipped with six sampling taps located axially along thecolumn; feed tank; two centrifugal pumps are used one for
fresh feed and the other for liquid circulation as shown inFigures 2a and 2b. The feeding of liquid and air was at thebottom of column through a mixing chamber beneath a dis-tributor grid (8.6 cm OD · 2 mm thickness) made of astainless steel 316 perforated with 31 holes (dh = 1.0 mm).
Table 1. Equipment used in the experimental setup.
Item Description
Column (72 mm i.d · 1600 mm long), PlexiglasFeeding pump Centrifugal (KSB), flow rate = 1 m3/h, head = 20 m, carbon steelRecycle pump Centrifugal (KSB), flow rate = 5 m3/h, head = 25 m, carbon steelFeeding tank Volume = 100 L, PVCPressure gauge Bourdon type gauge, 4 inch dial, 0–200 mbar, stainless steelGas flow meter Floating type flowmeter, 0–800 L/min, glass madeFlow meter for fresh liquid Floating type flowmeter, 0–40 L/min, glass madeFlow meter for recycle liquid Floating type flowmeter, 0–4000 L/h, glass made
Fig. 2. (a) Photographic view of the experimental setup; (b) schematic of the apparatus setup.
M.F. Abid et al.: Oil & Gas Science and Technology - Rev. IFP Energies nouvelles 74, 20 (2019)4
Packings of ceramic and plastic raschig were placed into themixing chamber to enhance the distribution of liquid andgas. A compressor was used to supply deoiled air to thecolumn. The feeding gas and liquid are regulated via cali-brated flow meters for the gas (F2) and the liquid (F1)respectively. The bed expansion is controlled by the flowof liquid, which is conducted by pumping recycle liquidreturned in a recycle cup at the upper part of the reactorby an elongated return line of 25 mm in diameter locatedwithin the reactor vessel connected to the suction of therecycling pump (P2). Details of the column internals areshown in Figure 3. At the top of the column, a two-phaseflow of air and liquid were discharged out of the system.Water is used, as the continuous phase. All the samplingtaps were connected to a three-way valve which facilitatesthe use of the taps either for pressure measurement(connected to a pressure manometer, 0–200 mbar) or via a
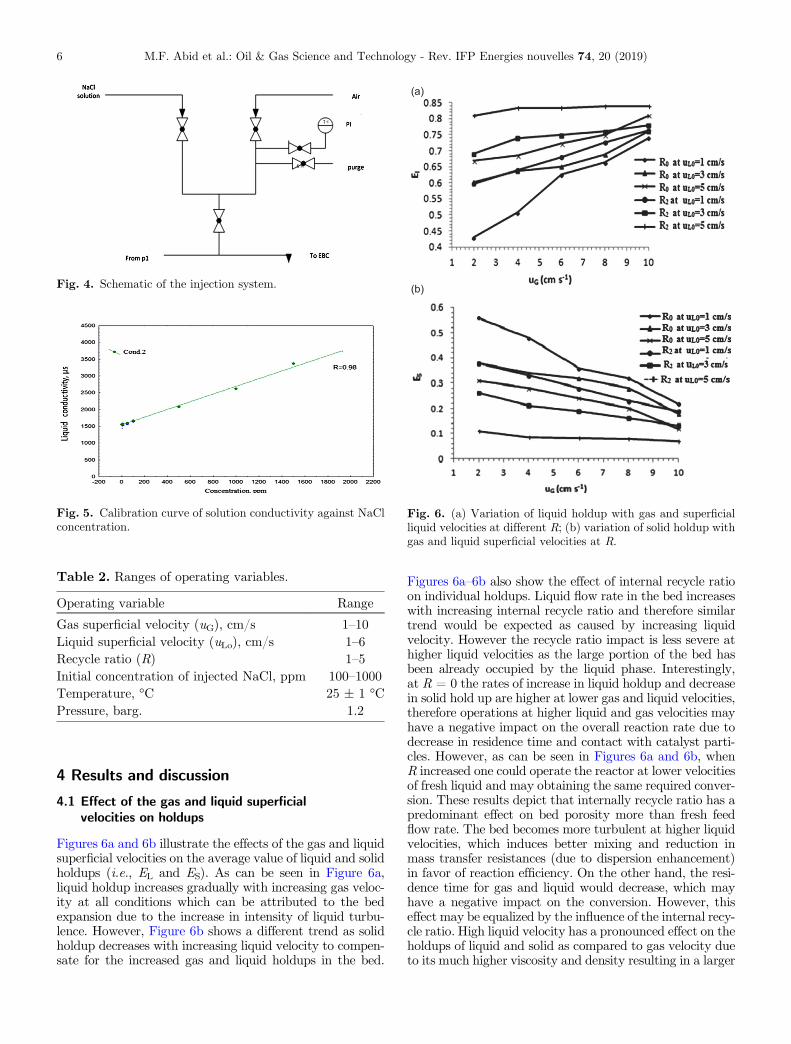
selector valve to a WTW� Laboratory conductivity metertype inoLab� Cond 7310 for liquid conductivity measure-ment. For RTD experiments, an input pulse of tracer wasinserted into the liquid stream at the inlet to the columnusing the injector configuration shown in Figure 4 whichconsists of a needle feeding valve for the pressurized gas,two ball valves, one for the tracer injection, and the otherfor release of the pressurized gas; two non-return valves toprevent the backflow of tracer into the injector, and apressure gauge to indicate the pressure inside the injector.The calibration of the conductivity meter was done by usingstandard NaCl solutions prepared for this process. Figure 5shows the calibration of conductivity against NaClconcentration. Ranges of operating variables (i.e., superfi-cial velocities of gas and liquid, recycle ratio, and initialconcentration of tracer) used in the present work are listedin Table 2.
(a)
(b)
Fig. 3. Details of column internals. (a) Schematic diagram of the cold lab-scale ebullated bed column; (b) details of the recycle cup.
M.F. Abid et al.: Oil & Gas Science and Technology - Rev. IFP Energies nouvelles 74, 20 (2019) 5
4 Results and discussion
4.1 Effect of the gas and liquid superficialvelocities on holdups
Figures 6a and 6b illustrate the effects of the gas and liquidsuperficial velocities on the average value of liquid and solidholdups (i.e., EL and ES). As can be seen in Figure 6a,liquid holdup increases gradually with increasing gas veloc-ity at all conditions which can be attributed to the bedexpansion due to the increase in intensity of liquid turbu-lence. However, Figure 6b shows a different trend as solidholdup decreases with increasing liquid velocity to compen-sate for the increased gas and liquid holdups in the bed.
Figures 6a–6b also show the effect of internal recycle ratioon individual holdups. Liquid flow rate in the bed increaseswith increasing internal recycle ratio and therefore similartrend would be expected as caused by increasing liquidvelocity. However the recycle ratio impact is less severe athigher liquid velocities as the large portion of the bed hasbeen already occupied by the liquid phase. Interestingly,at R = 0 the rates of increase in liquid holdup and decreasein solid hold up are higher at lower gas and liquid velocities,therefore operations at higher liquid and gas velocities mayhave a negative impact on the overall reaction rate due todecrease in residence time and contact with catalyst parti-cles. However, as can be seen in Figures 6a and 6b, whenR increased one could operate the reactor at lower velocitiesof fresh liquid and may obtaining the same required conver-sion. These results depict that internally recycle ratio has apredominant effect on bed porosity more than fresh feedflow rate. The bed becomes more turbulent at higher liquidvelocities, which induces better mixing and reduction inmass transfer resistances (due to dispersion enhancement)in favor of reaction efficiency. On the other hand, the resi-dence time for gas and liquid would decrease, which mayhave a negative impact on the conversion. However, thiseffect may be equalized by the influence of the internal recy-cle ratio. High liquid velocity has a pronounced effect on theholdups of liquid and solid as compared to gas velocity dueto its much higher viscosity and density resulting in a larger
Fig. 4. Schematic of the injection system.
Fig. 5. Calibration curve of solution conductivity against NaClconcentration.
Table 2. Ranges of operating variables.
Operating variable Range
Gas superficial velocity (uG), cm/s 1–10Liquid superficial velocity (uLo), cm/s 1–6Recycle ratio (R) 1–5Initial concentration of injected NaCl, ppm 100–1000Temperature, �C 25 ± 1 �CPressure, barg. 1.2
(a)
(b)
Fig. 6. (a) Variation of liquid holdup with gas and superficialliquid velocities at different R; (b) variation of solid holdup withgas and liquid superficial velocities at R.
M.F. Abid et al.: Oil & Gas Science and Technology - Rev. IFP Energies nouvelles 74, 20 (2019)6
bed expansion, especially at high gas flow rates. However,the effect of gas velocity is higher at low liquid velocitiesas shown in Figures 6a and 6b. Trend of the present resultswas confirmed by the experimental outcomes of Shin et al.(2007) and Pjontek, (2014), although Sivalingam andKannadasan (2009) reported a different trend for the effectof fluid flow rates on liquid holdups in co-current threephase fluidized beds.
4.2 Dispersion parameters
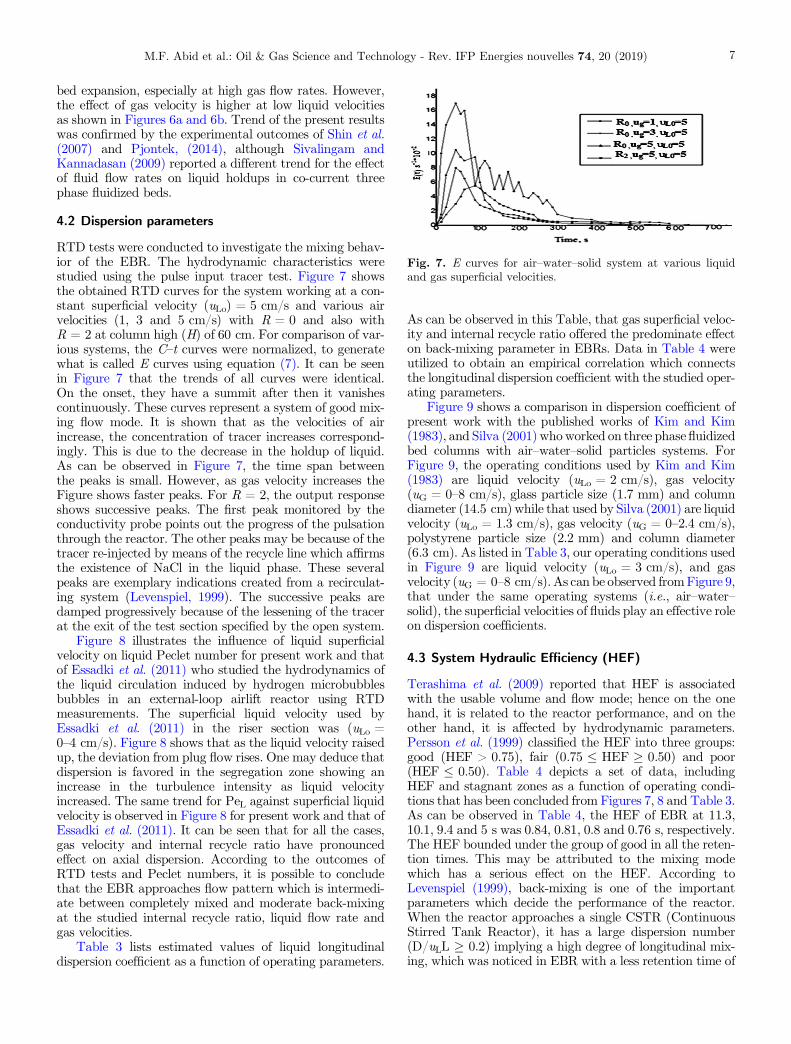
RTD tests were conducted to investigate the mixing behav-ior of the EBR. The hydrodynamic characteristics werestudied using the pulse input tracer test. Figure 7 showsthe obtained RTD curves for the system working at a con-stant superficial velocity (uLo) = 5 cm/s and various airvelocities (1, 3 and 5 cm/s) with R = 0 and also withR = 2 at column high (H) of 60 cm. For comparison of var-ious systems, the C–t curves were normalized, to generatewhat is called E curves using equation (7). It can be seenin Figure 7 that the trends of all curves were identical.On the onset, they have a summit after then it vanishescontinuously. These curves represent a system of good mix-ing flow mode. It is shown that as the velocities of airincrease, the concentration of tracer increases correspond-ingly. This is due to the decrease in the holdup of liquid.As can be observed in Figure 7, the time span betweenthe peaks is small. However, as gas velocity increases theFigure shows faster peaks. For R = 2, the output responseshows successive peaks. The first peak monitored by theconductivity probe points out the progress of the pulsationthrough the reactor. The other peaks may be because of thetracer re-injected by means of the recycle line which affirmsthe existence of NaCl in the liquid phase. These severalpeaks are exemplary indications created from a recirculat-ing system (Levenspiel, 1999). The successive peaks aredamped progressively because of the lessening of the tracerat the exit of the test section specified by the open system.
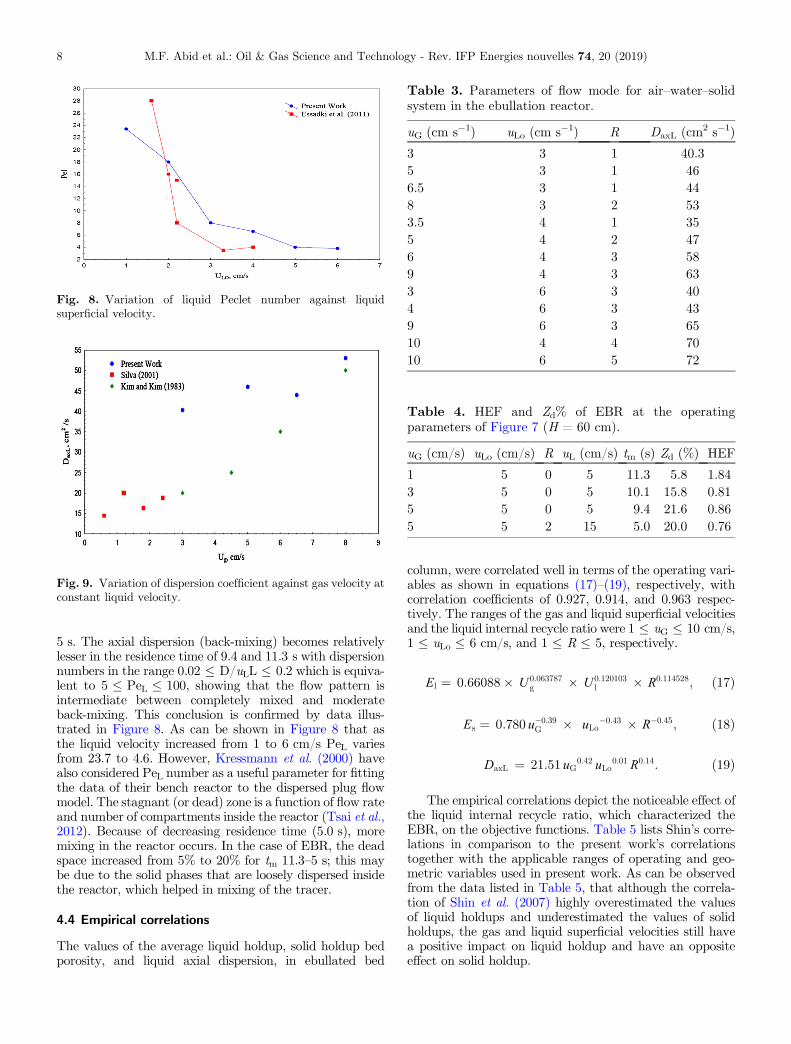
Figure 8 illustrates the influence of liquid superficialvelocity on liquid Peclet number for present work and thatof Essadki et al. (2011) who studied the hydrodynamics ofthe liquid circulation induced by hydrogen microbubblesbubbles in an external-loop airlift reactor using RTDmeasurements. The superficial liquid velocity used byEssadki et al. (2011) in the riser section was (uLo =0–4 cm/s). Figure 8 shows that as the liquid velocity raisedup, the deviation from plug flow rises. One may deduce thatdispersion is favored in the segregation zone showing anincrease in the turbulence intensity as liquid velocityincreased. The same trend for PeL against superficial liquidvelocity is observed in Figure 8 for present work and that ofEssadki et al. (2011). It can be seen that for all the cases,gas velocity and internal recycle ratio have pronouncedeffect on axial dispersion. According to the outcomes ofRTD tests and Peclet numbers, it is possible to concludethat the EBR approaches flow pattern which is intermedi-ate between completely mixed and moderate back-mixingat the studied internal recycle ratio, liquid flow rate andgas velocities.
Table 3 lists estimated values of liquid longitudinaldispersion coefficient as a function of operating parameters.
As can be observed in this Table, that gas superficial veloc-ity and internal recycle ratio offered the predominate effecton back-mixing parameter in EBRs. Data in Table 4 wereutilized to obtain an empirical correlation which connectsthe longitudinal dispersion coefficient with the studied oper-ating parameters.
Figure 9 shows a comparison in dispersion coefficient ofpresent work with the published works of Kim and Kim(1983), and Silva (2001) who worked on three phase fluidizedbed columns with air–water–solid particles systems. ForFigure 9, the operating conditions used by Kim and Kim(1983) are liquid velocity (uLo = 2 cm/s), gas velocity(uG = 0–8 cm/s), glass particle size (1.7 mm) and columndiameter (14.5 cm) while that used by Silva (2001) are liquidvelocity (uLo = 1.3 cm/s), gas velocity (uG = 0–2.4 cm/s),polystyrene particle size (2.2 mm) and column diameter(6.3 cm). As listed in Table 3, our operating conditions usedin Figure 9 are liquid velocity (uLo = 3 cm/s), and gasvelocity (uG = 0–8 cm/s). As can be observed from Figure 9,that under the same operating systems (i.e., air–water–solid), the superficial velocities of fluids play an effective roleon dispersion coefficients.
4.3 System Hydraulic Efficiency (HEF)
Terashima et al. (2009) reported that HEF is associatedwith the usable volume and flow mode; hence on the onehand, it is related to the reactor performance, and on theother hand, it is affected by hydrodynamic parameters.Persson et al. (1999) classified the HEF into three groups:good (HEF > 0.75), fair (0.75 � HEF � 0.50) and poor(HEF � 0.50). Table 4 depicts a set of data, includingHEF and stagnant zones as a function of operating condi-tions that has been concluded from Figures 7, 8 and Table 3.As can be observed in Table 4, the HEF of EBR at 11.3,10.1, 9.4 and 5 s was 0.84, 0.81, 0.8 and 0.76 s, respectively.The HEF bounded under the group of good in all the reten-tion times. This may be attributed to the mixing modewhich has a serious effect on the HEF. According toLevenspiel (1999), back-mixing is one of the importantparameters which decide the performance of the reactor.When the reactor approaches a single CSTR (ContinuousStirred Tank Reactor), it has a large dispersion number(D/uLL � 0.2) implying a high degree of longitudinal mix-ing, which was noticed in EBR with a less retention time of
Fig. 7. E curves for air–water–solid system at various liquidand gas superficial velocities.
M.F. Abid et al.: Oil & Gas Science and Technology - Rev. IFP Energies nouvelles 74, 20 (2019) 7
5 s. The axial dispersion (back-mixing) becomes relativelylesser in the residence time of 9.4 and 11.3 s with dispersionnumbers in the range 0.02 � D/uLL � 0.2 which is equiva-lent to 5 � PeL � 100, showing that the flow pattern isintermediate between completely mixed and moderateback-mixing. This conclusion is confirmed by data illus-trated in Figure 8. As can be shown in Figure 8 that asthe liquid velocity increased from 1 to 6 cm/s PeL variesfrom 23.7 to 4.6. However, Kressmann et al. (2000) havealso considered PeL number as a useful parameter for fittingthe data of their bench reactor to the dispersed plug flowmodel. The stagnant (or dead) zone is a function of flow rateand number of compartments inside the reactor (Tsai et al.,2012). Because of decreasing residence time (5.0 s), moremixing in the reactor occurs. In the case of EBR, the deadspace increased from 5% to 20% for tm 11.3–5 s; this maybe due to the solid phases that are loosely dispersed insidethe reactor, which helped in mixing of the tracer.
4.4 Empirical correlations
The values of the average liquid holdup, solid holdup bedporosity, and liquid axial dispersion, in ebullated bed
column, were correlated well in terms of the operating vari-ables as shown in equations (17)–(19), respectively, withcorrelation coefficients of 0.927, 0.914, and 0.963 respec-tively. The ranges of the gas and liquid superficial velocitiesand the liquid internal recycle ratio were 1 � uG � 10 cm/s,1 � uLo � 6 cm/s, and 1 � R � 5, respectively.
El ¼ 0:66088� U 0:063787g � U 0:120103
l � R0:114528; ð17Þ
Es ¼ 0:780 u�0:39G � uLo
�0:43 � R�0:45; ð18Þ
DaxL ¼ 21:51 uG0:42 uLo
0:01 R0:14: ð19Þ
The empirical correlations depict the noticeable effect ofthe liquid internal recycle ratio, which characterized theEBR, on the objective functions. Table 5 lists Shin’s corre-lations in comparison to the present work’s correlationstogether with the applicable ranges of operating and geo-metric variables used in present work. As can be observedfrom the data listed in Table 5, that although the correla-tion of Shin et al. (2007) highly overestimated the valuesof liquid holdups and underestimated the values of solidholdups, the gas and liquid superficial velocities still havea positive impact on liquid holdup and have an oppositeeffect on solid holdup.
Table 3. Parameters of flow mode for air–water–solidsystem in the ebullation reactor.
M.F. Abid et al.: Oil & Gas Science and Technology - Rev. IFP Energies nouvelles 74, 20 (2019)8
5 Conclusion
In present work, hydrodynamics of EBRs was studied in acold model experimental setup using air–water–solid parti-cles system. Pressure gradient method and RTD techniquewere used to estimate the individual holdups, and disper-sion coefficients in the lab-scale ebullated bed column.The results showed that liquid internal recycle ratio, whichcharacterized the EBRs, has a predominant effect on theindividual holdups and dispersion coefficients. Hydrody-namic study revealed that in the free zone of EBR, the dis-persion was intermediate between plug flow and completemixed, and as the total flow, including internal recycleratio, increased, it became completely mixed flow reactor(with maximum back-mixing). The stagnant zones inEBR did not exceed 20%, even under high flow conditionswhich was very low when compared to industrial scale reac-tor operating at high flow rates. Empirical correlations weredeveloped for prediction of phase holdups, bed porosity,and dispersion coefficients with good accuracy. The obser-vations and conclusions made here may not be quantita-tively generalized for petroleum fractions because feedssuch as heavy oil may give different results due to fluidproperties under industrial operating conditions. Thus itis recommended that future studies should be carried outusing different fluids to simulate the characteristics of heavyoil such as using 20 wt% MgSO4 in water (Safoniuk, 1999).
Acknowledgments. Authors are grateful to the Department ofChemical Engineering, University of Technology, Baghdad forproviding space and facilities. Thanks are also due to the Petro-leum Research & Development Center, Iraqi Ministry of Oil forassistance.
References
Chander A., Kundu A., Bej S.K., Dalai A.K., Vohra D.K. (2001)Hydrodynamic characteristics of co-current up flow and downflow of gas and liquid in affixed bed reactor, Fuel 80, 1043–1053.
Essadki A.H., Gourich B., Vial C.H., Delmas H. (2011)Residence time distribution measurements in an external-loopairlift reactor: Study of the hydrodynamics of the liquidcirculation induced by the hydrogen bubbles, Chem. Eng. Sci.66, 14, 3125–3132.
Fogler H.S. (1999) Elements of chemical reaction engineering,3rd edn., Prentice-Hall, New Jersey.
Froment G.F., Bischoff K.B., Juray D.W. (2010) Chemicalreactor analysis and design, 3rd edn., John Wiley & Sons, NewYork, NY.
Kim S.D., Kim C.H. (1983) Axial dispersion characteristics ofthree phase fluidized beds, J. Chem. Eng. Jpn. 16, 172–178.
Kressmann S., Boyer C., Colyar J.J., Schweitzer J.M., Vigui?J.C. (2000) Improvements of Ebullated-Bed Technology forupgrading heavy oils, Oil Gas Sci. Technol. - Rev. IFPEnergies nouvelles 55, 397–406.
Levenspiel O. (1999) Chemical reaction engineering, 3rd edn.,John Wiley & Sons Inc., New Jersey.
Parisien V., Pjontek D., McKnight C.A., Wiens J., Macchi A.(2017) Impact of catalyst density distribution on the fluiddynamics of an ebullated bed operating at high gas holdupconditions, Chem. Eng. Sci. 170, 491–500.T
able
5.Sh
in’s
corr
elat
ions
and
pres
ent
wor
k’s
corr
elat
ions
wit
hth
eir
geom
etri
can
dop
erat
ing
vari
able
s.
Obj
ecti
vefu
ncti
onC
orre
lati
ons
ofSh
inet
al.(2
007)
Cor
rela
tion
sof
pres
ent
wor
k
Liq
uid
hold
upe L¼
4:01
4U
GðÞ0:1
36U
LðÞ0:1
55l
LðÞ0:0
56q
Sq
L
�� 2
:009
e l¼
0:66
088�
U0:
0637
87g
�U
0:12
0103
l�
R0:
1145
28
Solid
hold
up1�
e S¼
5:56
8U
GðÞ0:1
58U
LðÞ0:1
69l
LðÞ0:0
48q
Sq
L
�� 2
:762
e s¼
0:27
4508�
U�
0:25
5581
g�
U0:
4286
42l
�R�
0:45
3287
Axi
aldi
sper
sion
–D
axL
=21
.51
u G0.
42u L
o0.01
R0.
14
Ope
rati
ngpa
ram
eter
s(a
t25
�C)
UG
(cm
/s)
UG
(cm
/s)
l L (mP
as)
qL (kg/
m3 )
qS (kg/
m3 )
UG
(cm
/s)
UL
(cm
/s)
lL (m
Pa
s)q
L (kg/
m3 )
qS (kg/
m3 )
R
0.05
–0.8
1–5
0.96
–38
1000
–100
387
7–96
61–
101–
60.
9610
0017
001–
5
Typ
eof
colu
mn
Cyl
indr
ical
thre
e-ph
ase
fluid
ized
bed
colu
mn
Ebu
llate
dbe
dth
ree-
phas
eco
lum
nC
olum
ndi
men
sion
s15
.2cm
ID·
250
cmhe
ight
7.2
cmID
·16
0cm
heig
ht
Con
diti
ons
ofpr
esen
tst
udy
(qL
=1
gcm�
3 ;q
S=
1.7
gcm�
3 ;l L
=0.
96m
Pa
s;R
=1)
Cor
rela
tion
sof
Shin
etal
.(2
007)
Cor
rela
tion
sof
pres
ent
wor
k
e le s
e le s
UG
=1
cm/s
,U
L=
1cm
/s3.
040
(out
ofra
nge)
�4.
335
(out
ofra
nge)
0.66
0.27
4U
G=
2cm
/s,U
L=
2cm
/s3.
390
(out
ofra
nge)
�4.
999
(out
ofra
nge)
0.71
80.
204
UG
=3
cm/s
,U
L=
3cm
/s3.
610
(out
ofra
nge)
�5.
425
(out
ofra
nge)
0.75
40.
171
M.F. Abid et al.: Oil & Gas Science and Technology - Rev. IFP Energies nouvelles 74, 20 (2019) 9
Persson J., Somes N.L.G., Wong T.H.F. (1999) Hydraulicsefficiency of wetlands and ponds, Water Sci. Technol. 40,291–300.
Pjontek D. (2014) Fluid dynamic studies in support of anindustrial ebullated bed hydroprocessor, PhD Thesis, TheUniversity of Ottawa, Canada.
Pjontek D., Macchi A. (2014) Hydrodynamic comparison ofspherical and cylindrical particles in a gas–liquid–solidfluidized bed at elevated pressure and high gas holdupconditions, Powder Technol. 253, 657–676.
Safoniuk M. (1999) Dimensional Similitude and the hydrody-namics of three-phase fluidized beds, PhD thesis in Chemicaland Bio-Resource Engineering, The University of BritishColumbia Vancouver, BC, Canada.
Sanchez O., Michaud S., Escudie R., Delgenes J.P., Bernet N.(2005) Liquid mixing and gas–liquid mass transfer in a three-phase inverse turbulent bed reactor, Chem. Eng. J. 114, 1–7.
Sarathai Y., Koottatep T., Morel A. (2010) Hydraulic charac-teristics of an anaerobic baffled reactor as onsite wastewatertreatment system, J. Environ. Sci. China 22, 1319–1326.
Saroha A.K., Khera R. (2006) Hydrodynamic study of fixed bedswith cocurrent upflow and downflow, Chem. Eng. Proc. 45,455–460.
Schweitzer J.M., Kressmann S. (2004) Ebullated bed reactor mod-eling for residue conversion, Chem. Eng. Sci. 59, 5637–5645.
Shah M., Kiss A.A., Zondervan E., van der Schaaf J., de HaanA.B. (2012) Gas holdup, axial dispersion, and mass transferstudies in bubble columns, Ind. Eng. Chem. Res. 51, 14268–14278.
Shin I.S., Son S.M., Kang Y., Kang S.H., Kim S.D. (2007) Phaseholdup characteristics of viscous three-phase inverse fluidizedbeds, J. Ind. Eng. Chem. 13, 971–978.
Silva E.L. (2001) Hydrodynamics characteristics and gas-liquidmass transfer in a three phase fluidized bed reactor, J. Braz.Soc. Mech. Sci. 23, 503–512.
Sivalingam A., Kannadasan T. (2009) Effect of fluid flow rateson hydrodynamic characteristics of co-current three-phasefluidized beds with spherical glass bead particles, Int. J.ChemTech Res. 1, 851–855.
Terashima M., Goel R., Komatsu K., Yasui H., Takahashi H.,Li Y.Y., Noike T. (2009) CFD simulation of mixing inanaerobic digesters, Bioresour. Technol. 100, 2228–2233.
Thackston E.L., Shields F.D., Schroeder P.R. (1987) Residencetime distribution of shallow basins, J. Environ. Eng. 113,1319–1332.
Tsai D.D.W., Ramaraj R., Chen P.H. (2012) A method of short-circuiting comparison, Water Resour. Manag. 26, 2689–2702.
van Gelder K.B., Westerterp K.R. (1990) Residence timedistribution and hold-up in a co-current up-flow packed bedreactor at elevated pressure, Chem. Eng. Technol. 13, 27–40.
M.F. Abid et al.: Oil & Gas Science and Technology - Rev. IFP Energies nouvelles 74, 20 (2019)10