Lehigh UniversityLehigh Preserve
Theses and Dissertations
1987
Experimental and analytical investigation of theindentation of tubular members /Joseph A. PadulaLehigh University
Follow this and additional works at: https://preserve.lehigh.edu/etd
Part of the Civil Engineering Commons
This Thesis is brought to you for free and open access by Lehigh Preserve. It has been accepted for inclusion in Theses and Dissertations by anauthorized administrator of Lehigh Preserve. For more information, please contact [email protected].
Recommended CitationPadula, Joseph A., "Experimental and analytical investigation of the indentation of tubular members /" (1987). Theses andDissertations. 4821.https://preserve.lehigh.edu/etd/4821
\
,. ' '
Experimental and Analytical Investigation of the
-•
Indentation of .. Tubular Members
by
.J osepl1 A. P adulaw·'~~
A TJ1esis
Prese11ted tc) t}1e Grad11ate (~01111r1ittee
of Lehigh lJniversity
i11 Candidacy for tl1e Degree of
Master of Science
• Ill
Civil ·Engir1eering
Lehigh University
1987 •
'I'l . llS thesis is accepted and approved . 1n
rrquircrr1ents for the degree of Master of Science.
(date)
.. 11
I
partial fulfillrnent of the
Alexis Ostapenko })rof essor in Charge
#~ ~ . ' _ .• • . . ~ .'t,. •.. .. ., ••• •.,
-· .- • ' ............ ~.- ~':'::"':..-_t.,,i,,1 .. • . • \,..- t '., tf
- ' -
of
.. .
0 .,
•
•
Acknowledgments
This thesis is the product of research conducted at Fritz Engineering
Laboratory, within the Department of Ci vi.I Engineering at Lehigh University in
Bethlehem, Pennsylvania. Dr. Irwin J. Kugelman is the Chairman of the
Department of Civil Engineering. The research was part of a project, Residual
Strength of Offshore Structures after Damage, which was sponsored -by the
Minerals Management Service of the U.S. Department of the Interior and the
American Iron and Steel Institute under the DOI/ AISI Cooperative Research
Program. The author is grateful for this support and for the advice and
guidance given by the members of the project Task Force; C.E. Smith and
A.C. Kuentz, the respe~tive representatives of the sponsoring institutions, and
R.H. Wildt (Chairman of the Task Force) of Bethlehem Steel Corporation,
' C. Capanoglu of Earl @Jld Wright, C.D. Miller of CBI Industries, Inc.,
J. de - Oliveira of Conoco, Inc., and J.B. Gregory of the Minerals Management
Service of the U.S. Department of the Interior. '
An expression of gratitude is extended to Dr. Alexis Ostapenko for his
untiring ·effort in supervising the research and for his encouragement and
guidance in the author's academic endeavor.
Thanks are due to the technical staff of Fritz Engineering Laboratory, ·'·
especially to Charles F. Rittinger, Robert R. Dales, and Russell C. Langenbach
.for their help in conducting the experimental work and to Richard N. Sopko for
the photographic work. The assistance of Jyh-Min Liaw in conducting the tests
is also appreciated. ~
-·
-Special tlianks. ·are also due to members of the Lehigh --
University
Compu.ting Center staff, in particular, Stephen 0. Lidie and Sandra L. Johnson·
!)
••• 111
,. ..
·, :.·"/ ,---···""\
"
~ ' •
-- .
I,
'.
,, '
...
•
for their assistance with the computational work and patience in tutoring the
author in the use of a new operating system. The efforts of Dean Krause in
)
keeping the hardware on line under the strain of the analysis are appreciated .
.
The author is also grateful to Monica A. Newrtjan who made special efforts to ,f
f ac i l i tat e h is work .
, Lastly, the author wishes to express his sincerest gratitude to E. Hunnisett
and E.L. Edwards for their support and encouragement over the last years.
.ef -~)
• IV
....
. 1..
·1 ,.,.
• •
Abstract
1. Introduction
1.1 Scope 1.2 J>revious Work
Table of Contents
1.3 J->resent Investigation 1.3.1 Experimental Work 1.3.2 Analvtical Work ...
2. Experimental Work
2. I Description of 1"'est Specimens
•
2.1.1 Fabrication and Modification of Test Specimens
(J
1 2
3 3 5 5 6
7
7 7
2.1.2 Dirnensions and Material Properties 8 2.2 Indentation of the 1"'est Specimens 8
2.2.1 General Considerations 9 2.2.2 Arrangement and Procedure for Indentation of Specimens 9 2.2.3 Results of Indentation 12
2.2.3.1 Dent c;eon1etry 12 2.2,.3.2 Energy Dissipation 12
3. Finite Ele1nent Analysis 13
3.1 Introduction 3.2 Modeling
3.2.1-itContact Problem 3.2.2 Discretization of the Tube
3.3 I3oundary Conditions 3.4 Con1putational Parameters·
3.4.1 Formulation of Equations 3.4.2 Solution of Equations 3.4.3 Development of Analytical
3.5 Results of .Analysis 3.6 Discussion 3. 7 Computational Cost
4. Effect of Residual Stresses
Procedure
4.1 Residual Stresses in a Circular. Ring
"
4.2 Effect of Residual Stresses in a Circular Ring 4.3 Limited Range of Effect
4.3.1 Plastification and Residual Stresses Due to Indentation 4.3.2 Assumed and Observed Deformations
5. Summary, Conclusions and Recommendations
5.1 Introduction and Scope 5.2 Experimental Work 5.3 Analytical Work 5.4 Conclusions 5.5 Recommendations for Future Work
V
..
. .
,:~
13 14 15 17 19 20 20 22 22 24 24 25
27
27 29 30 30 32
1) {
34
34 34 35
. 35 37
• . .
..
..
..
I
. .. . .:. ' . '
._ ....
Tables Figures
References
Appe11dix A. Experimental Work by Others A.I Scope A.2 I)escription of Test Specimens A.3 Indentation of Specimens
Appendix B. Nomenclature
Vita
,,
• VI
f
' 38
41 65
67
67 67 68
4 69 I
. l
' 70
..
List . of Figures
Figure 1: Set-up for lndentatio11 of Specimen Pl ·- 42 Figure 2: Indentation of Specirnen P2 42
Figure 3: Schematic Representation of Ideal Dent Geometry 43
Figure 4: Schernatic llcpresentation of Test Set-up for Indentation 44
Figure 5: Expcrirnental l.1oad vs. Dent l)epth c:urve for Specimen 45
Pl . Figure 6: Ex peri mental Load VS. Dent Depth Curve for Specimen 46
•
Figure 7: P2 ¢
Energy Absorption vs. Dent Depth for Specimens Pl and P2 ~
47
Figure 8: Finite Element Model for Tube Indentation 48
Figure 9: Typical Stress-Strain Relationship for Stiffening Truss 49
Element /'·-'
Figure 10: Geometry to Determine ( 49 s
Figure 11: Dirnensions for Discr~tization of Model 2 50
Figure 12: Din1ensions for Discretization of Model 4 51
Figure 13: Din1Pnsions for Discretization of Model 8 52
Figure 14: Discretization of 1"'ube J\1odel 2 ... 53
Figure 15: Discrrtization of 1"'ube - Model 4 54
Figure 16: Discretization of Tu be - !\1odel 8 55
Figure 17: Load vs. Dent Depth, Speicmen Pl - Model 2 56
Figure 18: Load vs. Dent Depth, Speicmen Pl - Model 4 57
Figure 19: Load vs. Dent Depth, Speicmen P2 - :i\1odel 4 58
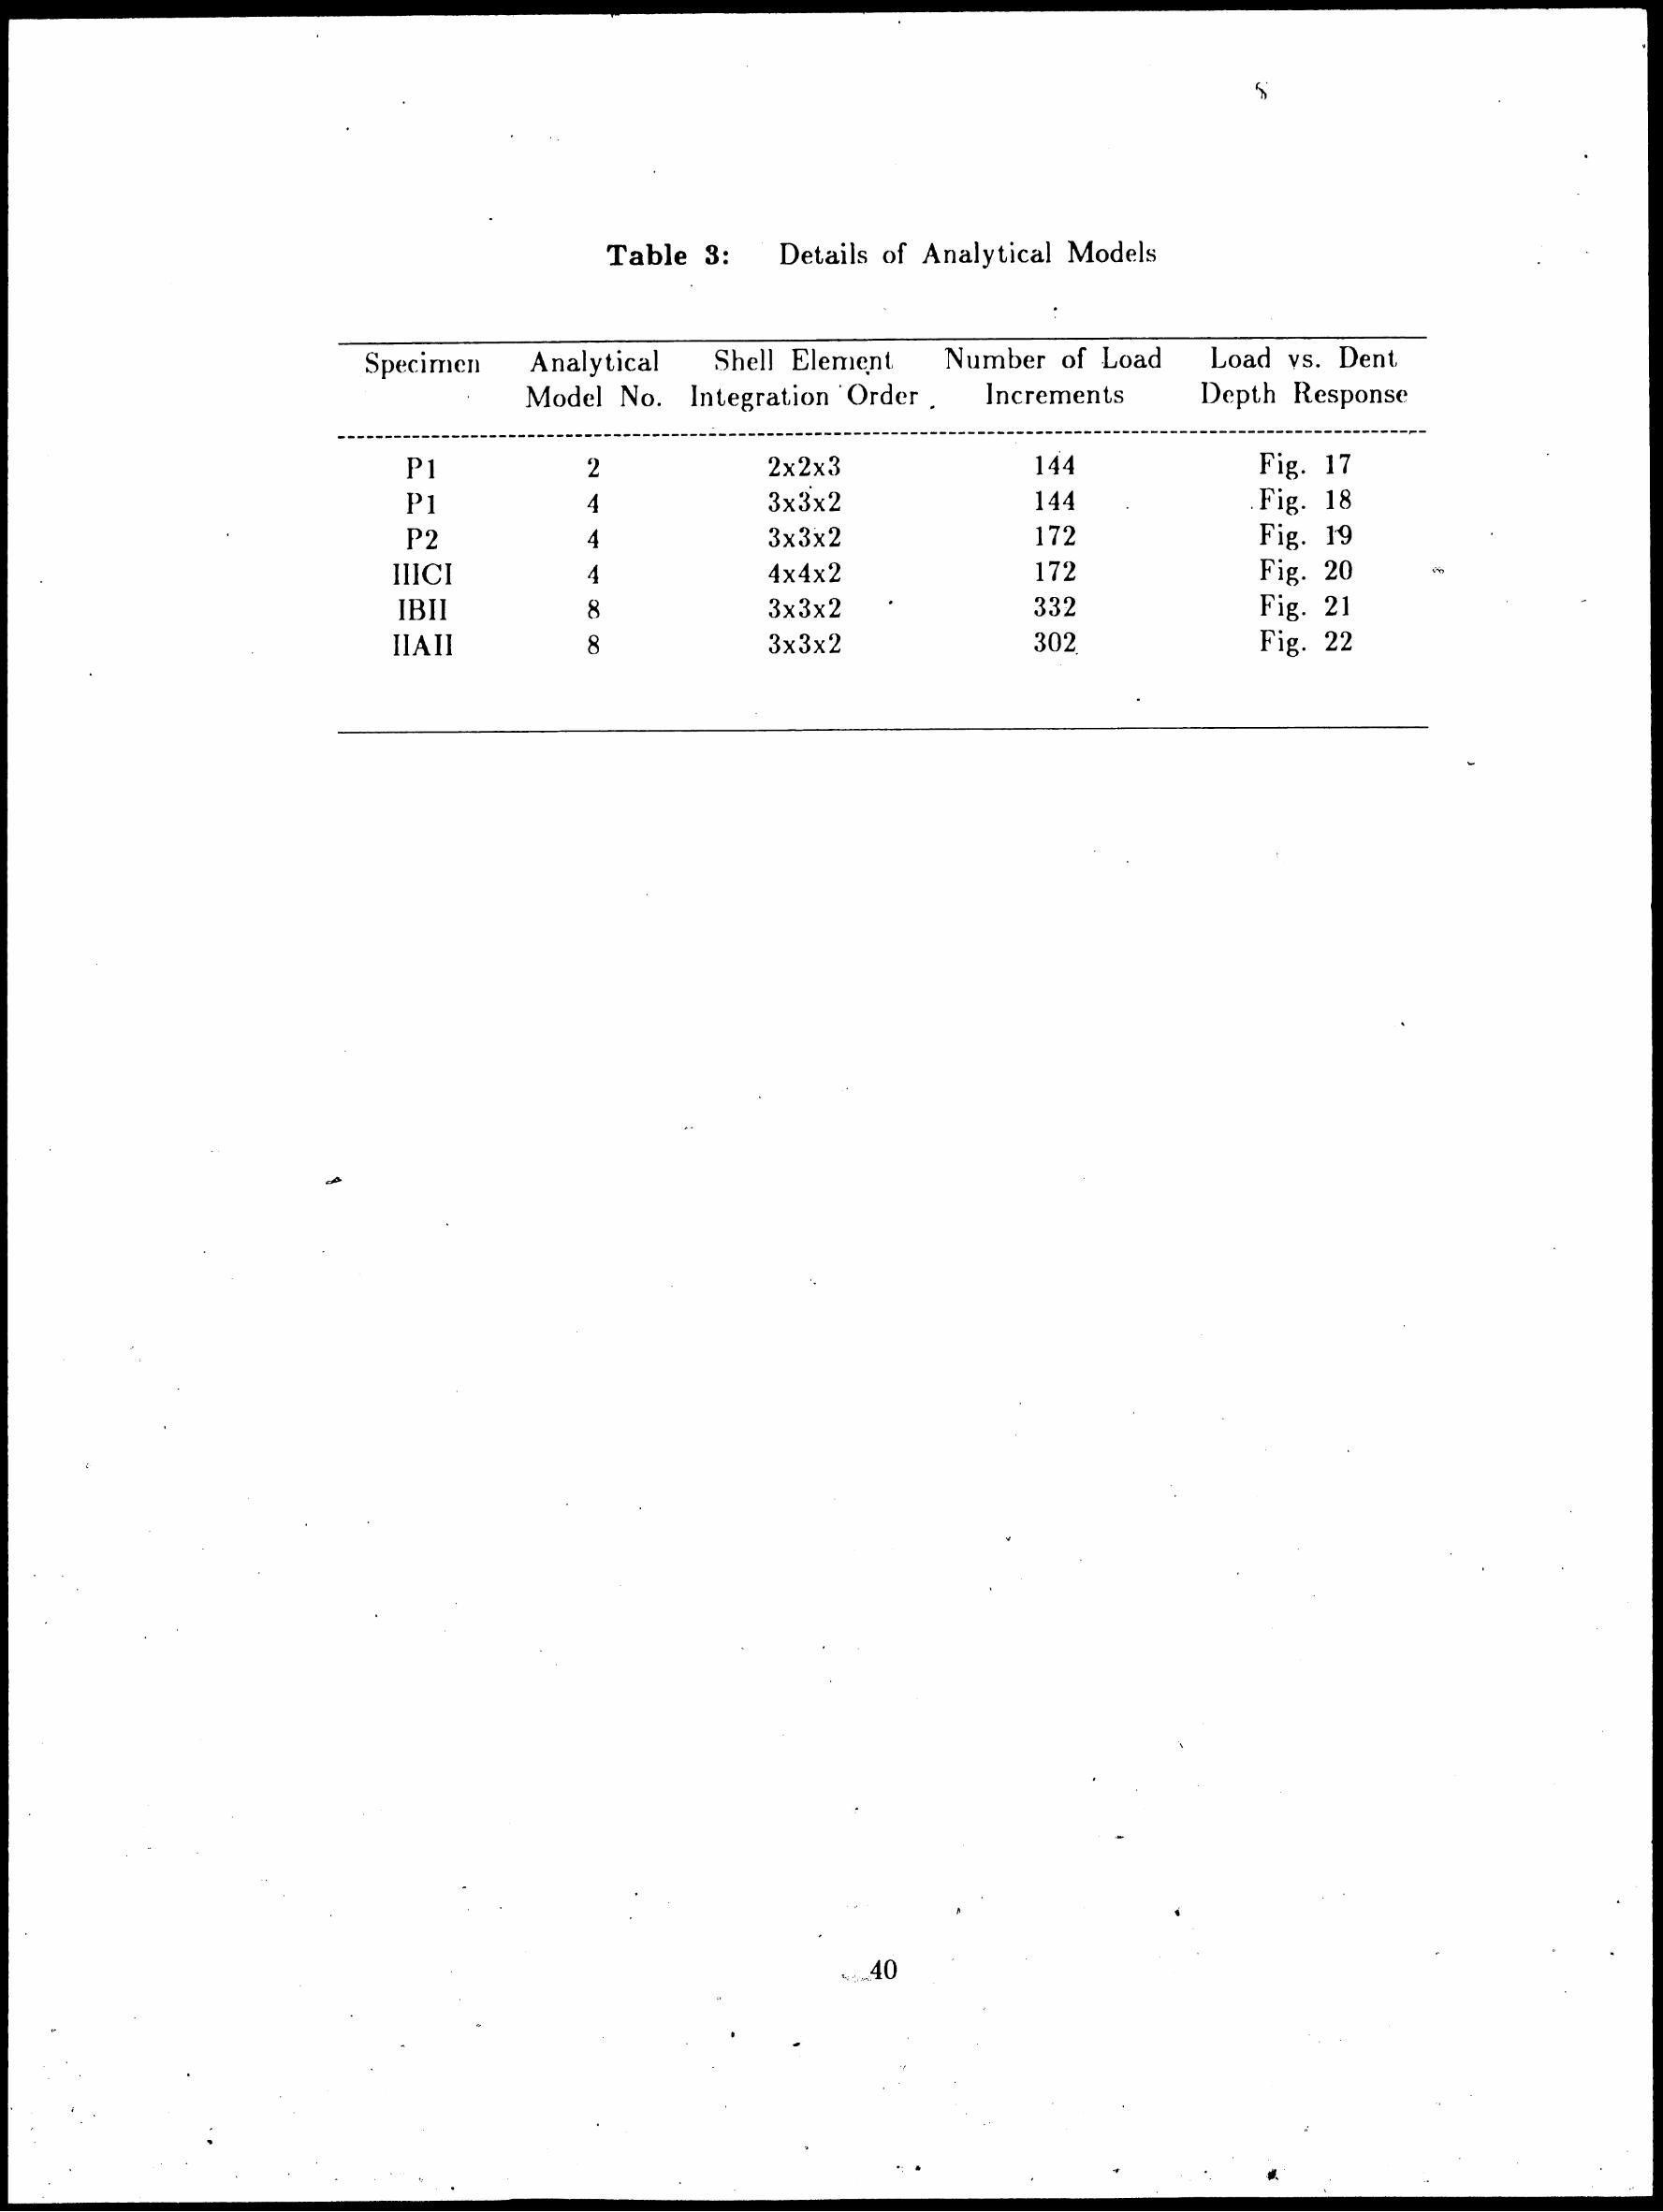
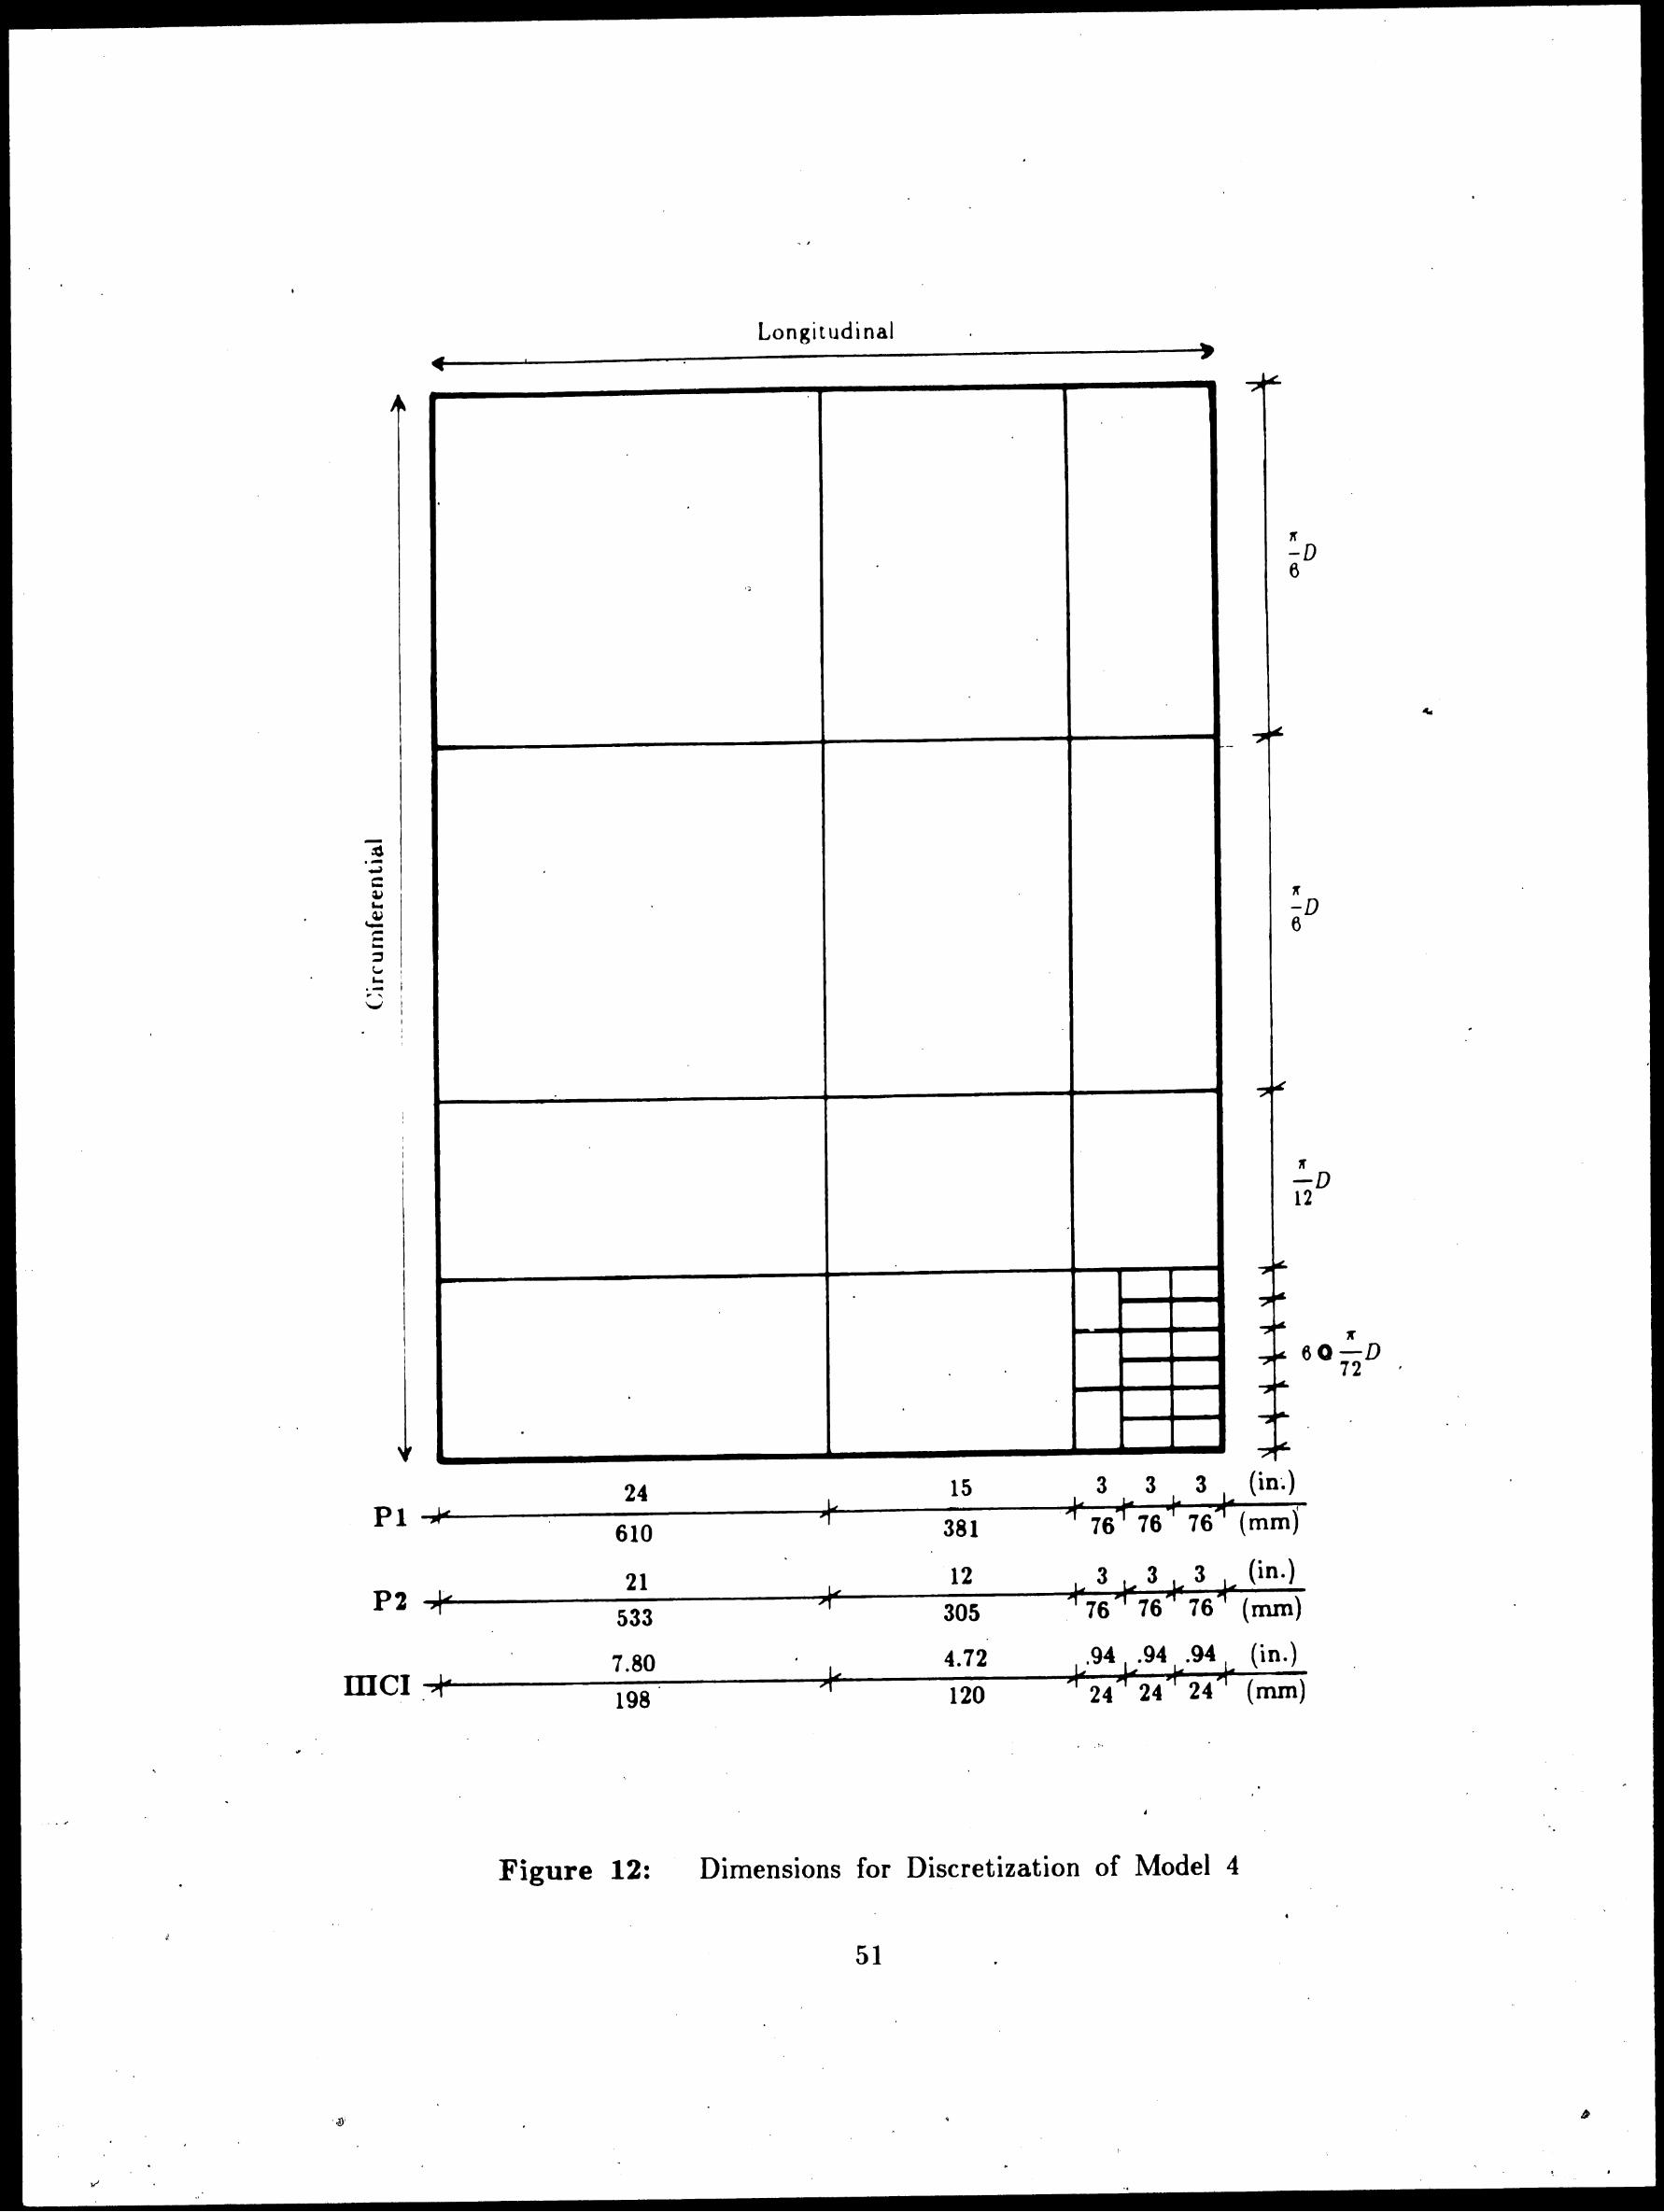
Figure 20: Load· vs. Dent Depth, Speicmen III CI - Model 4 59 '
Figure 21: Load vs. Dent Depth, Speicmen IBII - Model 8 60
Figure 22: Load vs. Dent Depth, Speicrnen IIAII - Model 8 61 Figure 23: Residua] Stresses Through rfhickness Due to Cold-Rolling 62 Figure .24: Stress Distribution after Flattening 62
Figure 25: Ass urned Deformation of a Ring ( From Reference [15]) 63 Figure 26: Deforrnation of ~ Ring fro1n Idealized Dent Geometry 63
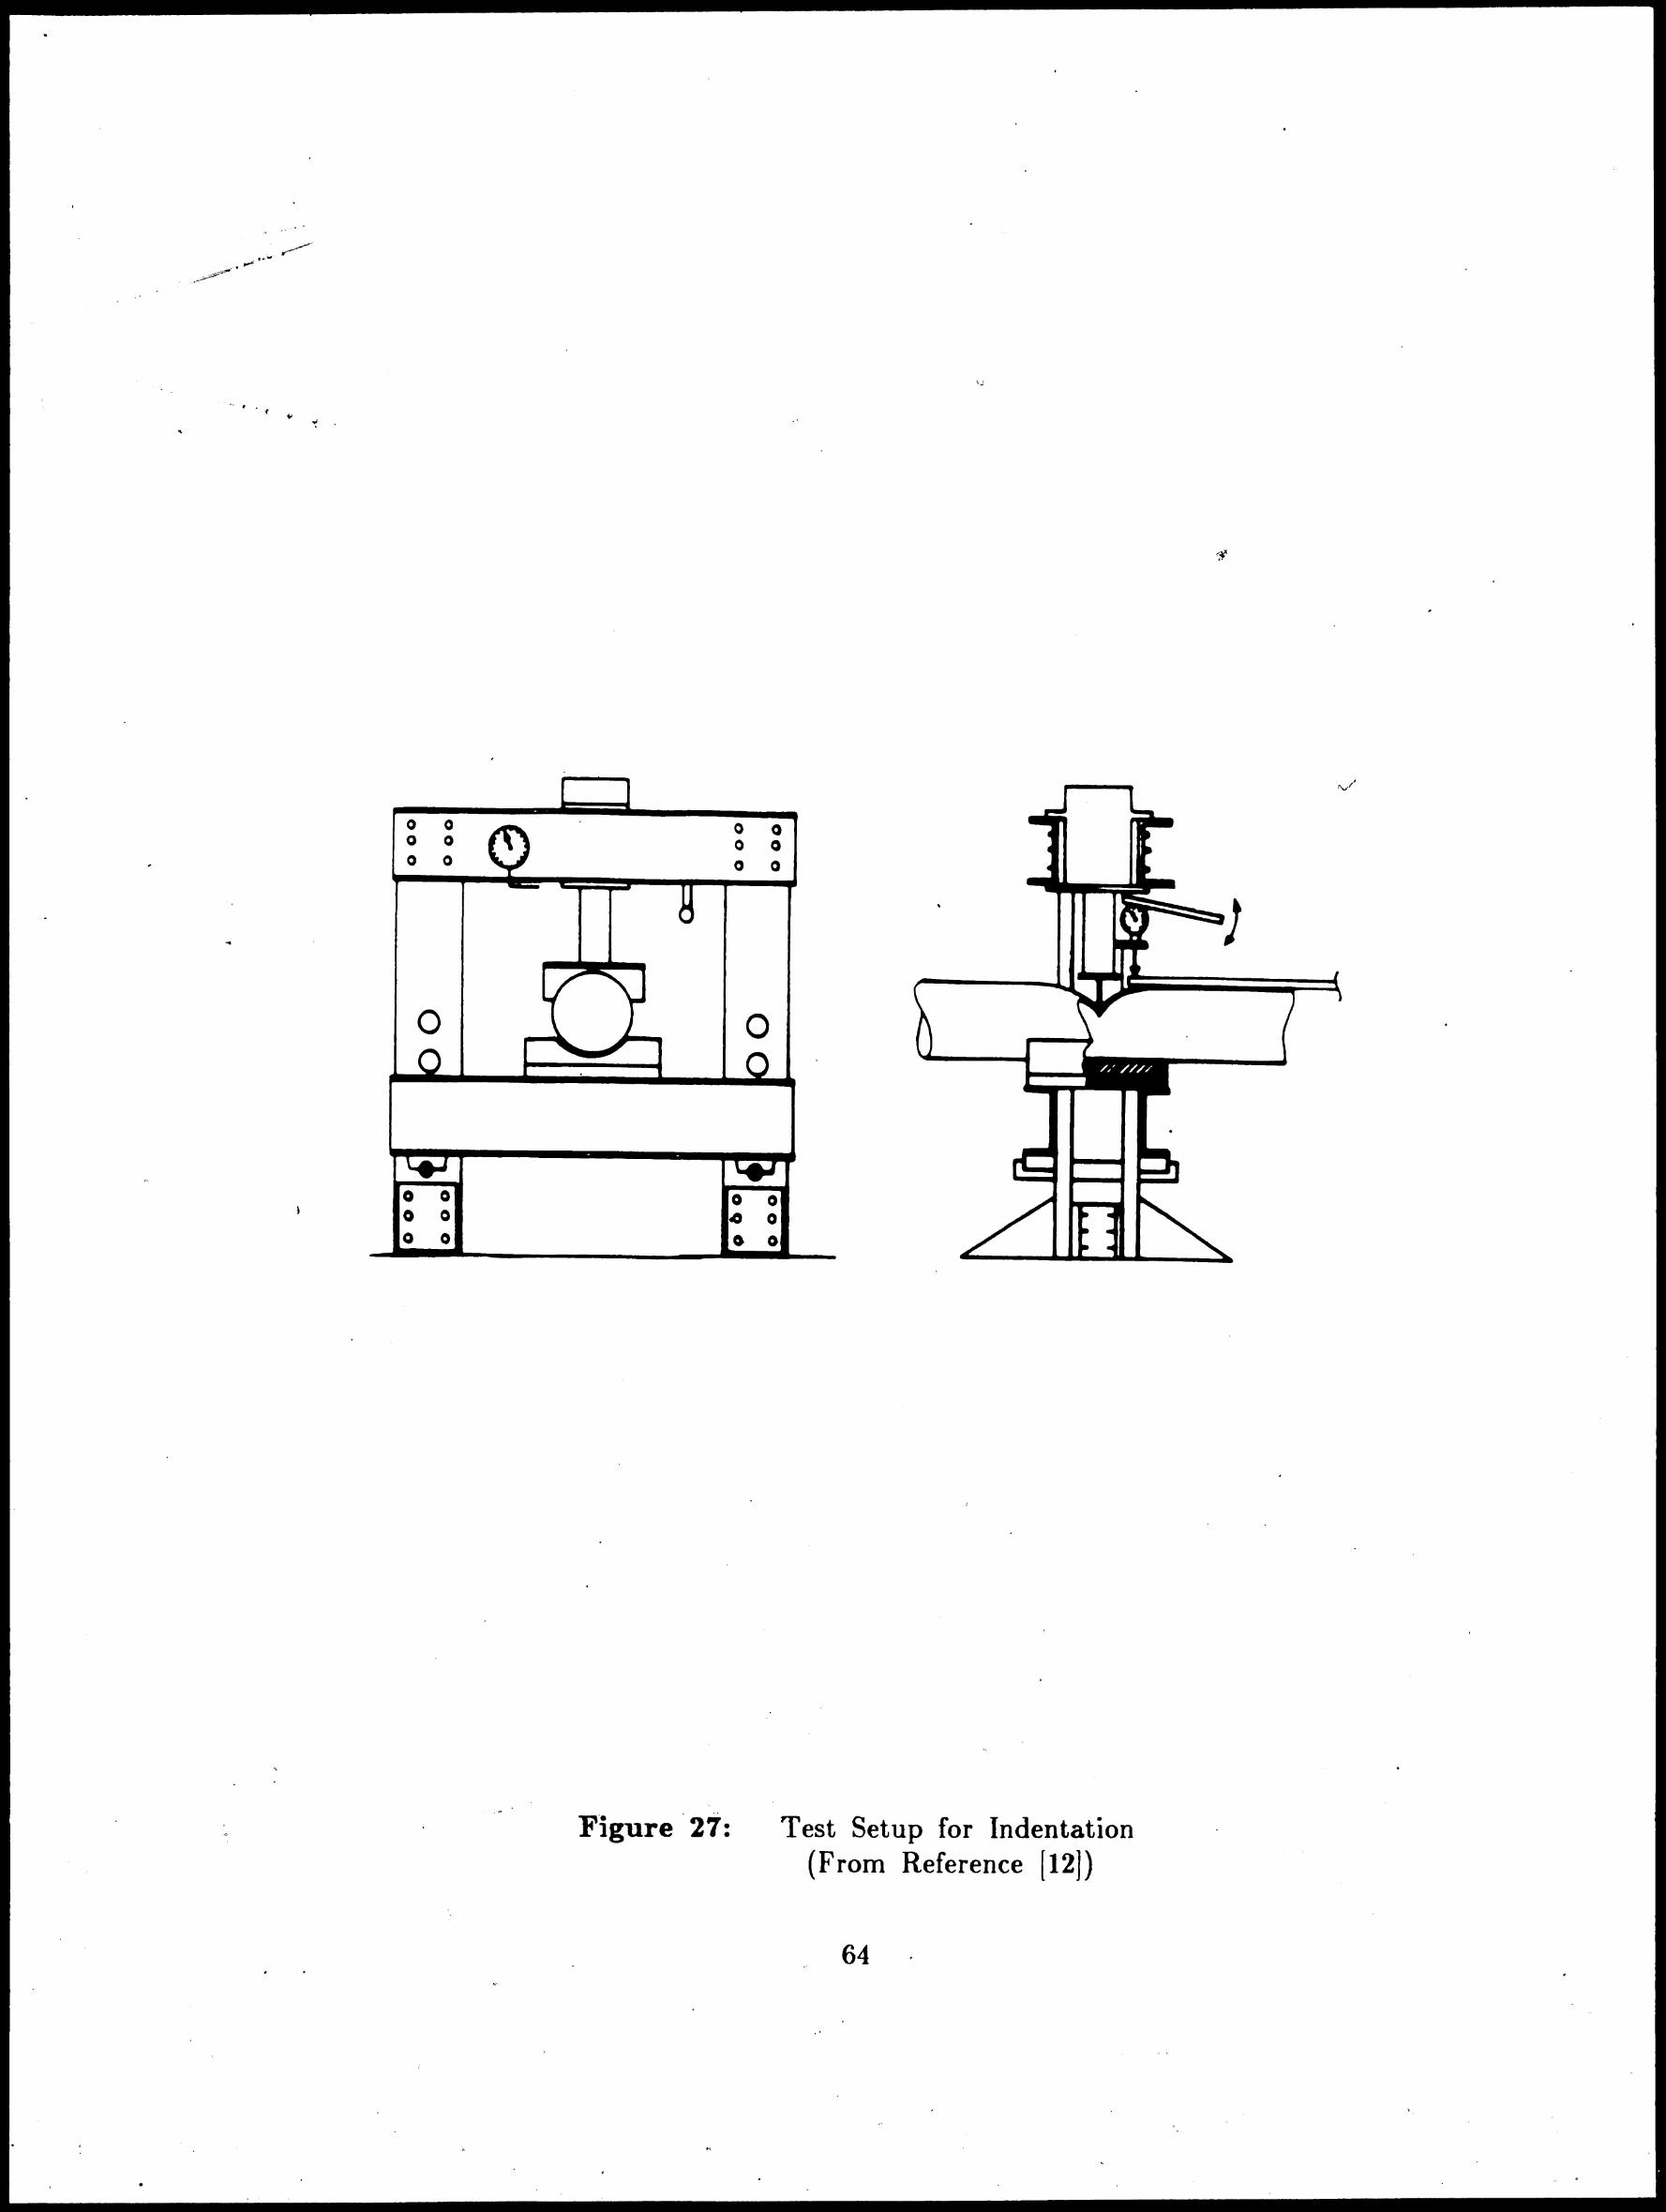
Figure 27: Test Setup for Indentation (From Reference [ 12]) 64
I
» • . • --~ ... p1,,,.i•~··"Vl,-·~ - •.• ·• -~ --·----~_. •. !... __ • __ .. ... j :.
•• Vll
,
. .
Table 1: Table 2: Table 3:
I
l
, ..
·--- ................. -· ..
,.
List of Tables
Specimen Data Computational Cost Details of Analytical Models
. , •••
Vlll
. •
39 39 40
•
' ..
' .
.. (
. "'
..
Abstract
• The · "damage design" approach to offshore structure design requires
consideration of accidental damage and its effect on the structural integrity.
For this reason, an experimental and analytical investigation of the indentation
behavior of tubular members was conducted.
The experimental work consisted of the indentation of two large-diameter
fabricated steel specimens. The test specimens were 1.0 m ( 40 in.) and 1. 5 m
(60 in.) in diameter with corresponding D/t ratios of 151 and 227. Each
specimen was simply supported at its ends and subjected to a concentrated
lateral load'ing with a rigid indenter at midlength. Load-deformation response
\ and the energy absorption as functions of dent depth are presented for each\·
. specimen.
The analytical work included the finite element analysis of the indentation
of the two test specimens and of three additional specimens whose indentation
response was reported in the literature. In contrast to the two fabricated test
specimens, these specimens were manufactured stress relieved tubes. The
correlation of the load vs. dent depth response of these tubes with the
analytical results was much better than that oJ the fabricated specimens. This
observation prompted an investigation into the effect of residual stresses ( due to
cold-rolling duriQg fabrication) on the indentation response. "
It was shown . that these residual stresses can significantly affect the load
deformation relationship by reducing the amount of energy absorbed for a giv~n
. dent neglecting can depth. ·Consequently, resqlt • 1n an
.:J their effect
• \ J
underestimation of the damage resulting frorri a given' "design collision·".
I
I /
\
/ (
. " I I
/ /
...
. .
' .
,
\
Chapter 1 Introduction
....
In the design of offshore platforms, it is necessary to consider the
. b· 1 · {'J f I poss1 1 1ty o structura damage resulting from accidental impacts during
construction or operation, a ship/platform collision, ice hazards, or severe cases
oY ·overloading. Of these, ship /platform collisions occur fairly frequently and are
probably the single most common type of offshore accident resulting in
structural damage. [5] Although it may be impractical to design structures to
resist a collision with a large vessel such as a tanker while sustaining only
. moderate damage, the design process must include consideration of the more
probable collisions with supply vessels or other ship traffic. Limiting the extent
of the accidental damage in such an event so that the integrity of the structure
is not significantly compromised or that it can be maintained until repairs can
be effected should be an objective of any design. This requires that the
designer be able to estimate the extent of damage that may be expected as well .. as the residual strength of the structure after damage.
Requiring that the structural integrity of a platform be maintained in the •
event of an accidental collision necessitates that the structure have sufficient
capacity to sustain elastic .. and plastic deformations thereby providing a
mechanism for absorption of energy. Even though elastic deformations and/ or
vibrations may dissipate most of the energy from minor ship/platfotm collisions
or accidental impacts, plastic deformations will develop at least at the point of
contact. [5] ..
• I·
2:
•
...
I
.. \
, I
•
'
· 1.1 Scope J'
To determine the effect of d·amage, it is first necessary to have some, at
)east approximate, knowledge of the type and extent of damage that can be
reasonably expected as a result of a collision. In framed structures constructed
of steel tubular members, the result of a collision usually takes the form of
localized dents and/or overall deflection of a member(s). The interaction of
these two deformation modes is complex and depends upon the geometry· of the
member, the end restraint inttraction by the frame, and the type of event
producing the damage. From knowledge of the member /structure response the
energy absorption capacity can be determined providing a means to estimate the
extent of damage given a "design collision" with a known mass and velocity.
Therefore, determination of the load deformation response and energy
absorption capacity of a structure is prerequisite to prudent design. Fot- .. these
reasons, the current research has been focused on the determination of the
indentation behavior of tubular steel members.
l. 2 Previous Work
A number of researchers have investigated the indentation of tubular
members as it relates to accidental damage • In offshore
structures. [12'° 11, 10, 14, 15] Lateral loading of tubular members and the
resulting 9eformation mechanisms have been the focus of much of the research
effort. The approaches to the problem range from simplified analytical models
and the use of numerical techniques such as the finite element method to the
. formation of an experimental database. For example, the basis for _Taby's work
on the residual strength ·of d-amaged tubular .. member~ h~s. involved extensive •
experimental work . including the indentation of tubular ·members. [13] On the "' .
3
-
•
,.
,.
,
.. I
"
other hand, Wierzbicki and Suh have presented a purely theoretical analysis of
the denting of tubular members under combined bending and axial loading. [15)
Their work involved the application of a method previously applied to the
axisy mrrietric buck I ing of tu bes. I I 6] Soares and Soreide have presented a
simplified analysis of tubular members whose primary mode of deformation is
overall beam deflection and correlated the results with finite element
analyses. [ I I] An excellent review of the state of the art of the collision-
damage and residua] strength of offshore structures including a comprehensive
bibliography has been provided by Ellinas. [5]
Since they are usually based on simplifying idealizations, the proposed 'fl
analytical solutions must be validated by correlation with experimental results '
before they can be used with confidence. These ifeaJizations may range from
the common assumption of rigid-plastic material behavior to a prescribed
deformation geometry for tubes subjected to lateral loading. Due to the
complex interaction of localized denting and overall bending ~eformations and
the wide range of tube geometries and loadings, such assumptions may affect
the accuracy of the analytical model.
The need for correlation of theoretical results with experimental evidence
also applies to results obtained from numerical techniques such as the finite '.
element method~ Additionally, the task of generating solutions for such a -
complex problem involving material and geometric nonlinearities • requires
considerable expense in terms of time and computer resources.
"1
Probably the most significant shortcoming of the reported experimental
work so f<;tr is the lack of data on tubular members fabricated by cold-rolling I . .,.
and welding, which is the usual meth·od of fab_rication · for· offshore structures,
.. 4
... '
I .. ) . '
'I 'v
) .
.~
. ..
•
. . .
and consideration of members with large D /t ratios. The work described here
addresses these needs, at least in part.
1.3 Present Investigation ..
. The thrust of the current research effort has been to determine the
• response of tubular members under lateral\ loading assuming the primary mode
of deformation to be localized denting of the tube wall. This investigation
consisted of experimental and analytical phases. The results of the analytical .,
work were correlated with the experimental work of the current project as well
as with the experimental results reported by Taby and Rashed in Reference [12].
A brief description of the experimental work performed by Taby and Rashed is
given in Appendix A.
1.8.1 Experimental Work
The experimental phase of the project involved the testing of two large
diameter, fabricated tubular test specimens. Each specimen was subjected to a
lateral load at midlength to produce a localized indentation. The specimens
were simply supported at the ends during indentation and the load was applied
through a rigid indenter. The displacements at several locations were measured
and recorded thus providing the necessary data t;o establish the load vs. dent-
,
depth and the energy dissipation relationships. The experimental work was also· I '1t .
a prelude to further experimentation ( axial load testing) on the residual strength
of damaged tubular members. [9]
. ... .
·., ... ,.
5·
.. J
·~
1.3.2 Analytical Work ~
The analytical work · consisted of the finite element analysis of the ... t. indentation of tubular members and correlation of the results with experimental
data. In ·order to assess the validity of the finite element analysis over a wide
range of tube geometries and material properties, the analysis and correlation
were made for five specimens for which experimental data were av·ailable; two "' ,.
specimens tested as a part of this program and three additional specimens for
which load vs. dent deJ?th curves were presented in Reference [ 12]. Correlation
with experimental data also provided useful information for refinement of the
modeling technique.
The effect of residual stresses due to cold-rolling during the fabrication
process on the load vs. dent depth response was also investigated. This was
prompted by a much improved correlation between the results of the finite
element analysis and the experimental data from the manufactured and stress ,.
relieved test specimens reported in Reference [ 12) as compared to the correlation '
with data from the fabricated specimens of the experimental phase of this work.
The investigation demonstrated that residual stresses can have a significant
effect on the indentation response. Specifically, the residual stresses reduce the
stiffness of the · response and neglecting their effect can result . 1n an
underestimation of the damage resulting from a given "design collision".
(
6
•
...
...
Chapter 2
Experimental Work
The experimental work consisted of the indentation of two large-diameter,
fabricated specimens. · The load vs. dent depth response of each specimen was .
recorded during indentation. Energy absorption as a function of dent depth was
also calculated.
. '
Additional experimental data consisting of the indentation response of three
specimens (Specimens IIICI, IBII, and IIAII) were taken from Reference [12] for
correlation with the analytical work. A brief description of this experimental
work is given in Appendix A.
2.1 Description of Test Specimens
The specimens were obtained by modifying two test specimens of a
previous project (Specimens T3 and T4 in References [8, 6]). For the current
project, these two specimens were designated Pl and P2, respectively.
2.1.1 Fabrication and Modification of Test Specimens
The two test specimens, Pl and P2, were fabricated by cold-rolling steel
plate into right circ1:1Iar cylinders in a pyramid three-roller bending machine and ;:
welding the longitudinal seam by an automatic submerged-arc process. Steel
end rings were welded to each end of the specimens to facilitate uniform
distribution of the axial load during testing. Detailed information on the
fabrication and material properties is given in Reference [8).
Previous axial load testing_,t_e~JJlted in severe local buckles confined to one . /"' " ....
end of each specimen. · The · limited extent· of the deformations made it possible .. to modify these specimens for reuse by removing the buckled portions and
• j 7
,·
,,
l
-,"l'-:,.,•
•
reattaching the end rings.
Ref ere nee [9].
The modification process is further described in
2.1.2 Dimensions and Material Properties
Specimens PI and P2 had outside diameters of 1.02 m ( 40.2 in.) and
1.53 m ( 60 in.), respectiv·ely. Both specimens had a wall thickness of 6. 73 mm
(0.265 in.). After modification, Specimen Pl was 2.44 m (96 in.) in length and '
Specimen P2 2.13 m (84 in.), exclusive of the thickness of the end rings. The I
J
circular steel end rings welded to the ends of the specimens were 22 mm thick
by 12'7 mm wide (7 /8 in. x 5 i_n.). All pertinent geometric and material
properties including diameter-to-thickness (D/t), length-to-radius of gyration
(~/r) and dent depth-to-diameter (d/D) ratios are listed in Table 1.
The specimens were fabricated from ASTM A36 steel plate. In the
previous project the static and dynamic yield stresses of the material were
determined from standard ASTM coupons. [8] The material propertie·s of the
modified specimens were assumed to be the same as those of the original
specim~ns. Thus, the possible effects of cold-rolling and work hardening during
the original tests were neglected.
· 2. 2 Indentation .of the Test Specimens
-
The indentation of the specimens was accomplished by the application of a
lateral load through a rigid indenter. The Joa~ vs. dent depth relationship and ' \
energy absorption as a function of the · dent depth were determined for each
specimen from the data collected during indentation.
..
' .
·8
•
.r •
. .
,- ~- ..
. i,,.,
2.2.1 General Considera'tions
Although damage to a tubular member due to impact may result in
... localized dents, overall deflection or a combination of both, the experimental
phase of this project dealt only with localized denting. Consequently, the
inpentation of the specimens was undertaken. with the goal of producing dents \
•
with little overall distortion of the member.
Consideration was given to various dent geometries, e.g., vee (resulting
from a "knife edge" loading), rounded or flat. The selected shape was a
localized flattening of the cylinder surface as shown in Fig. 3. The flat portion
of the dent measured longitudinally along the specimen was 175 mm (7 in.) in
width. The length of the dent (measured transversely across the specimen) was
largely controlled by the depth and was approximately equal to the chord
distance subtended by a circular arc with a middle ordinate equal to the dent
depth.
The dent was located at mid-length of each specimen. The longitudinal
y
centerline of the dent was offset by 120 ° of arc from the longitudinal weld
seam. (The actual location for Specimen Pl was approximately 38 mm (1.5
in.) closer to the weld seam.)
-
2.2.2 Arrangement and Procedure for I11dentation of Specimens
•
The arrangement for indentation was designed to introduce a dent, as well I /
as, to obtain data on the · energy diss1patton characteristics of the test ':\ .
.!:-
specimens. The same set-up was used for both specimens; it consisted of a
reaction frame, a load transmission assembly and instrumentation.
The· set.:.up was made- -in a universal testing machine which served as the ·
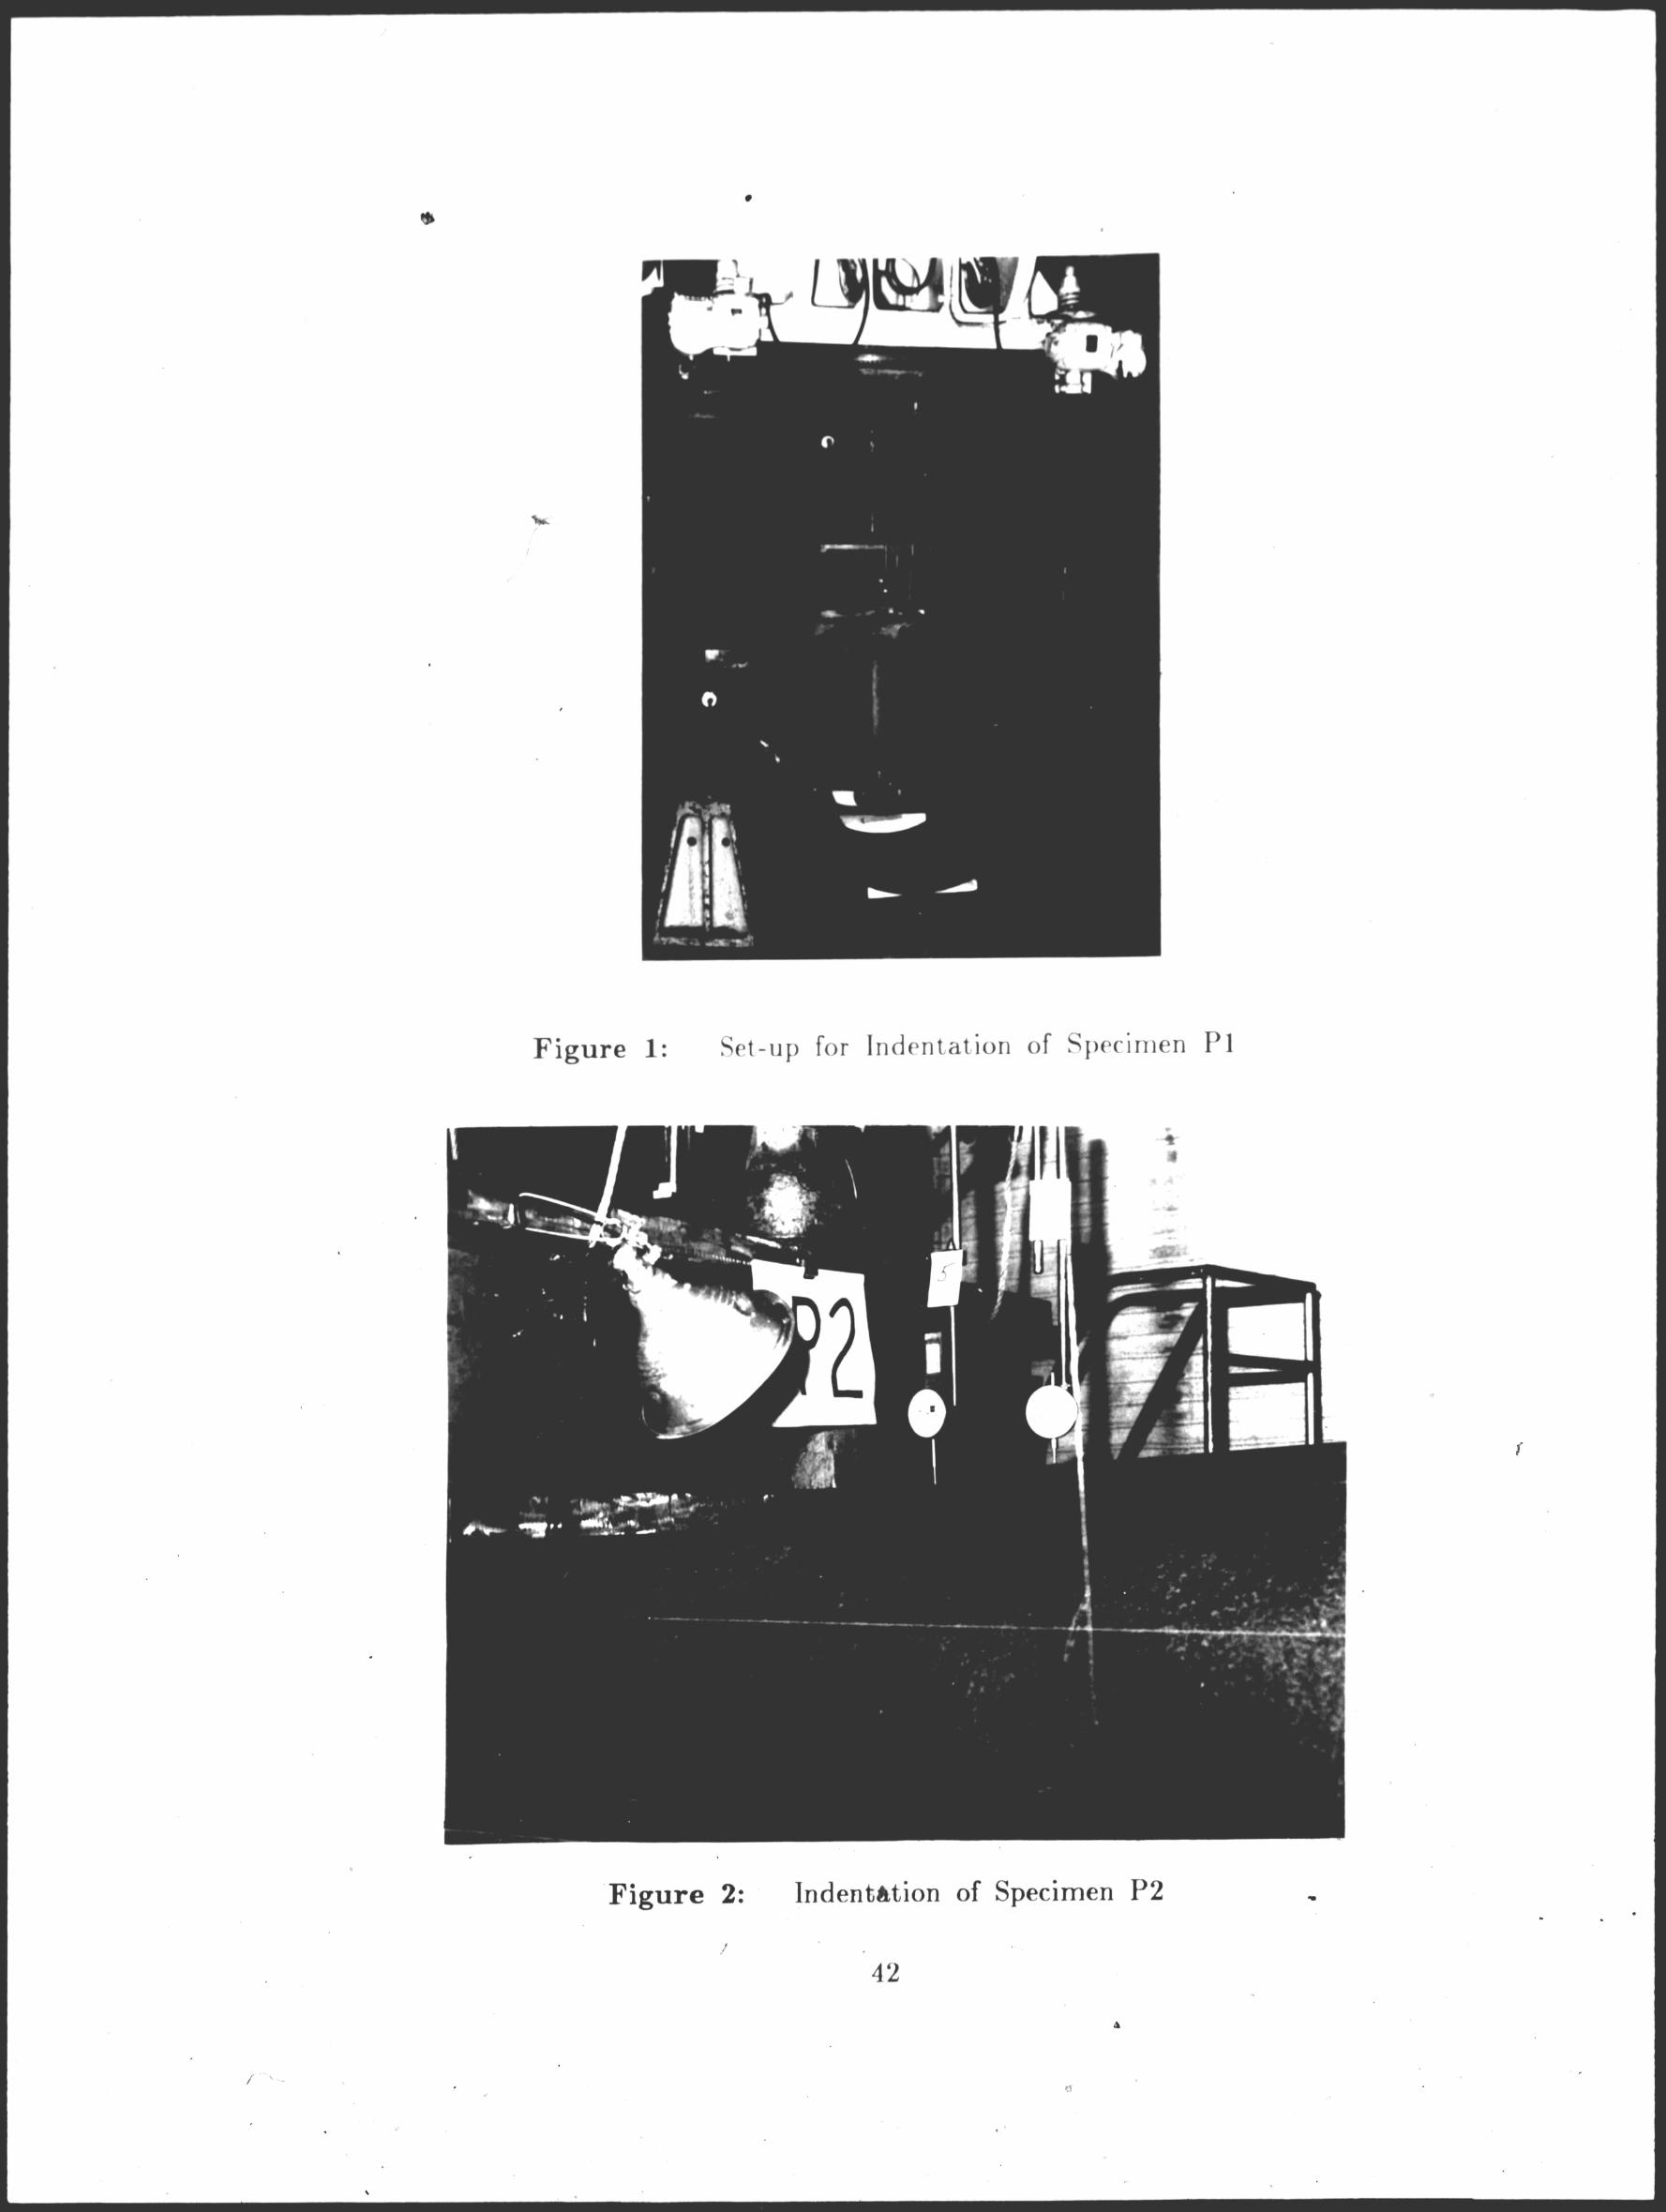
reaction frame. As shown in Fig. 1, the test specimen was placed horizontally
9
·, ...
.,.._.
•
I
on the floor of the testing machine and supported by steel blocks under the end
• rings. The blocks, in effect, provided simple support at the ends of the
specimen and also gave the necessary clearance to place dial gages underneath
the specimen.
The load. transmission assembly between the machine head and the
specimen consisted of a short section of wide flange beam placed transversely
across the specimen, a manually operated hydraulic jack} and a load cell. The
175 mm. (7 in.) wide flange of the beam served as the die for forming the dent.
A view of the indentation of Specimen P2 in progress is shown in Fig. 2. The
test setup is shown schematically in Fig. 4. Internal bracing with struts and
.. transverse bearing members was installed at the edges of the intended
indentation in order to localize the deformation. . ..
The instrumentation for measuring the distortion of the· specimens during
indentation consisted of ten mechanical dial gages located as shown in Fig. 4. ">
Two were placed between the beam and the testing machine head, one on each
side of the jack-load cell assembly. These gages directly measured the extension
of the jack and, thus, the displacement relative to the machine head. F-our dial
gages were placed between the top surface of the specimen and the testing
machine head, and three between the testing machine floor and the bottom of
the specimen. One dial gage was used. to directly measure the displacement of
· the machine head relative to the floor. This was done by connecting a dial
gage mounted on a pedestal on the ·floor with a light-gage wire to a magnetic
clip on the testing machine head.
The indentation procedure. consisted of incremental application of load to ·-·· ·- ·-·-, . ·-·-.-.. . • - ... ---- .• • ,, •., •. ~- ............ _ ... wr'..-LA_,.,,_~,.:.. "":'::'::."- • .. "' : ' .
the specimen · through the jack-loadcell-beam assembly. At each load increment,
10 ,. ..
. . . ' '
-~
. / ____________ . ./ / .
..
I
the load and dial · gage readings were recorded. The approximate depth of dent
was indicated by the readings from the Of dial gages between the machine head
and the beam. Loading continued until the dent exceeded the desired depth· by
an amount estimated to be lost due to elastic recovery during unloading. The
)
set-up and procedure for indentation were similar for both specimens. ( .
Specimen Pl required two cycles of loa·ding and unloading because the
elastic recovery was underestimated in the first cycle. The observed elastic
recovery during the first unloading provided a means of more accurately
"-€stimating the final dent depth. The maximum load needed for Pl Wa.5 168 kN
( 3 7. 8 kips) .
During loading of Specimen P2, at approximately 160 kN (36 kips), one of
the wooden struts used for internal bracing failed\ suddenly, and the load
immediately dropped to 116 kN (26 kips). The specimen was then unloaded,
. and the wooden struts were replaced with steel members. Loading tlen
continued to 276 kN (62 kips).
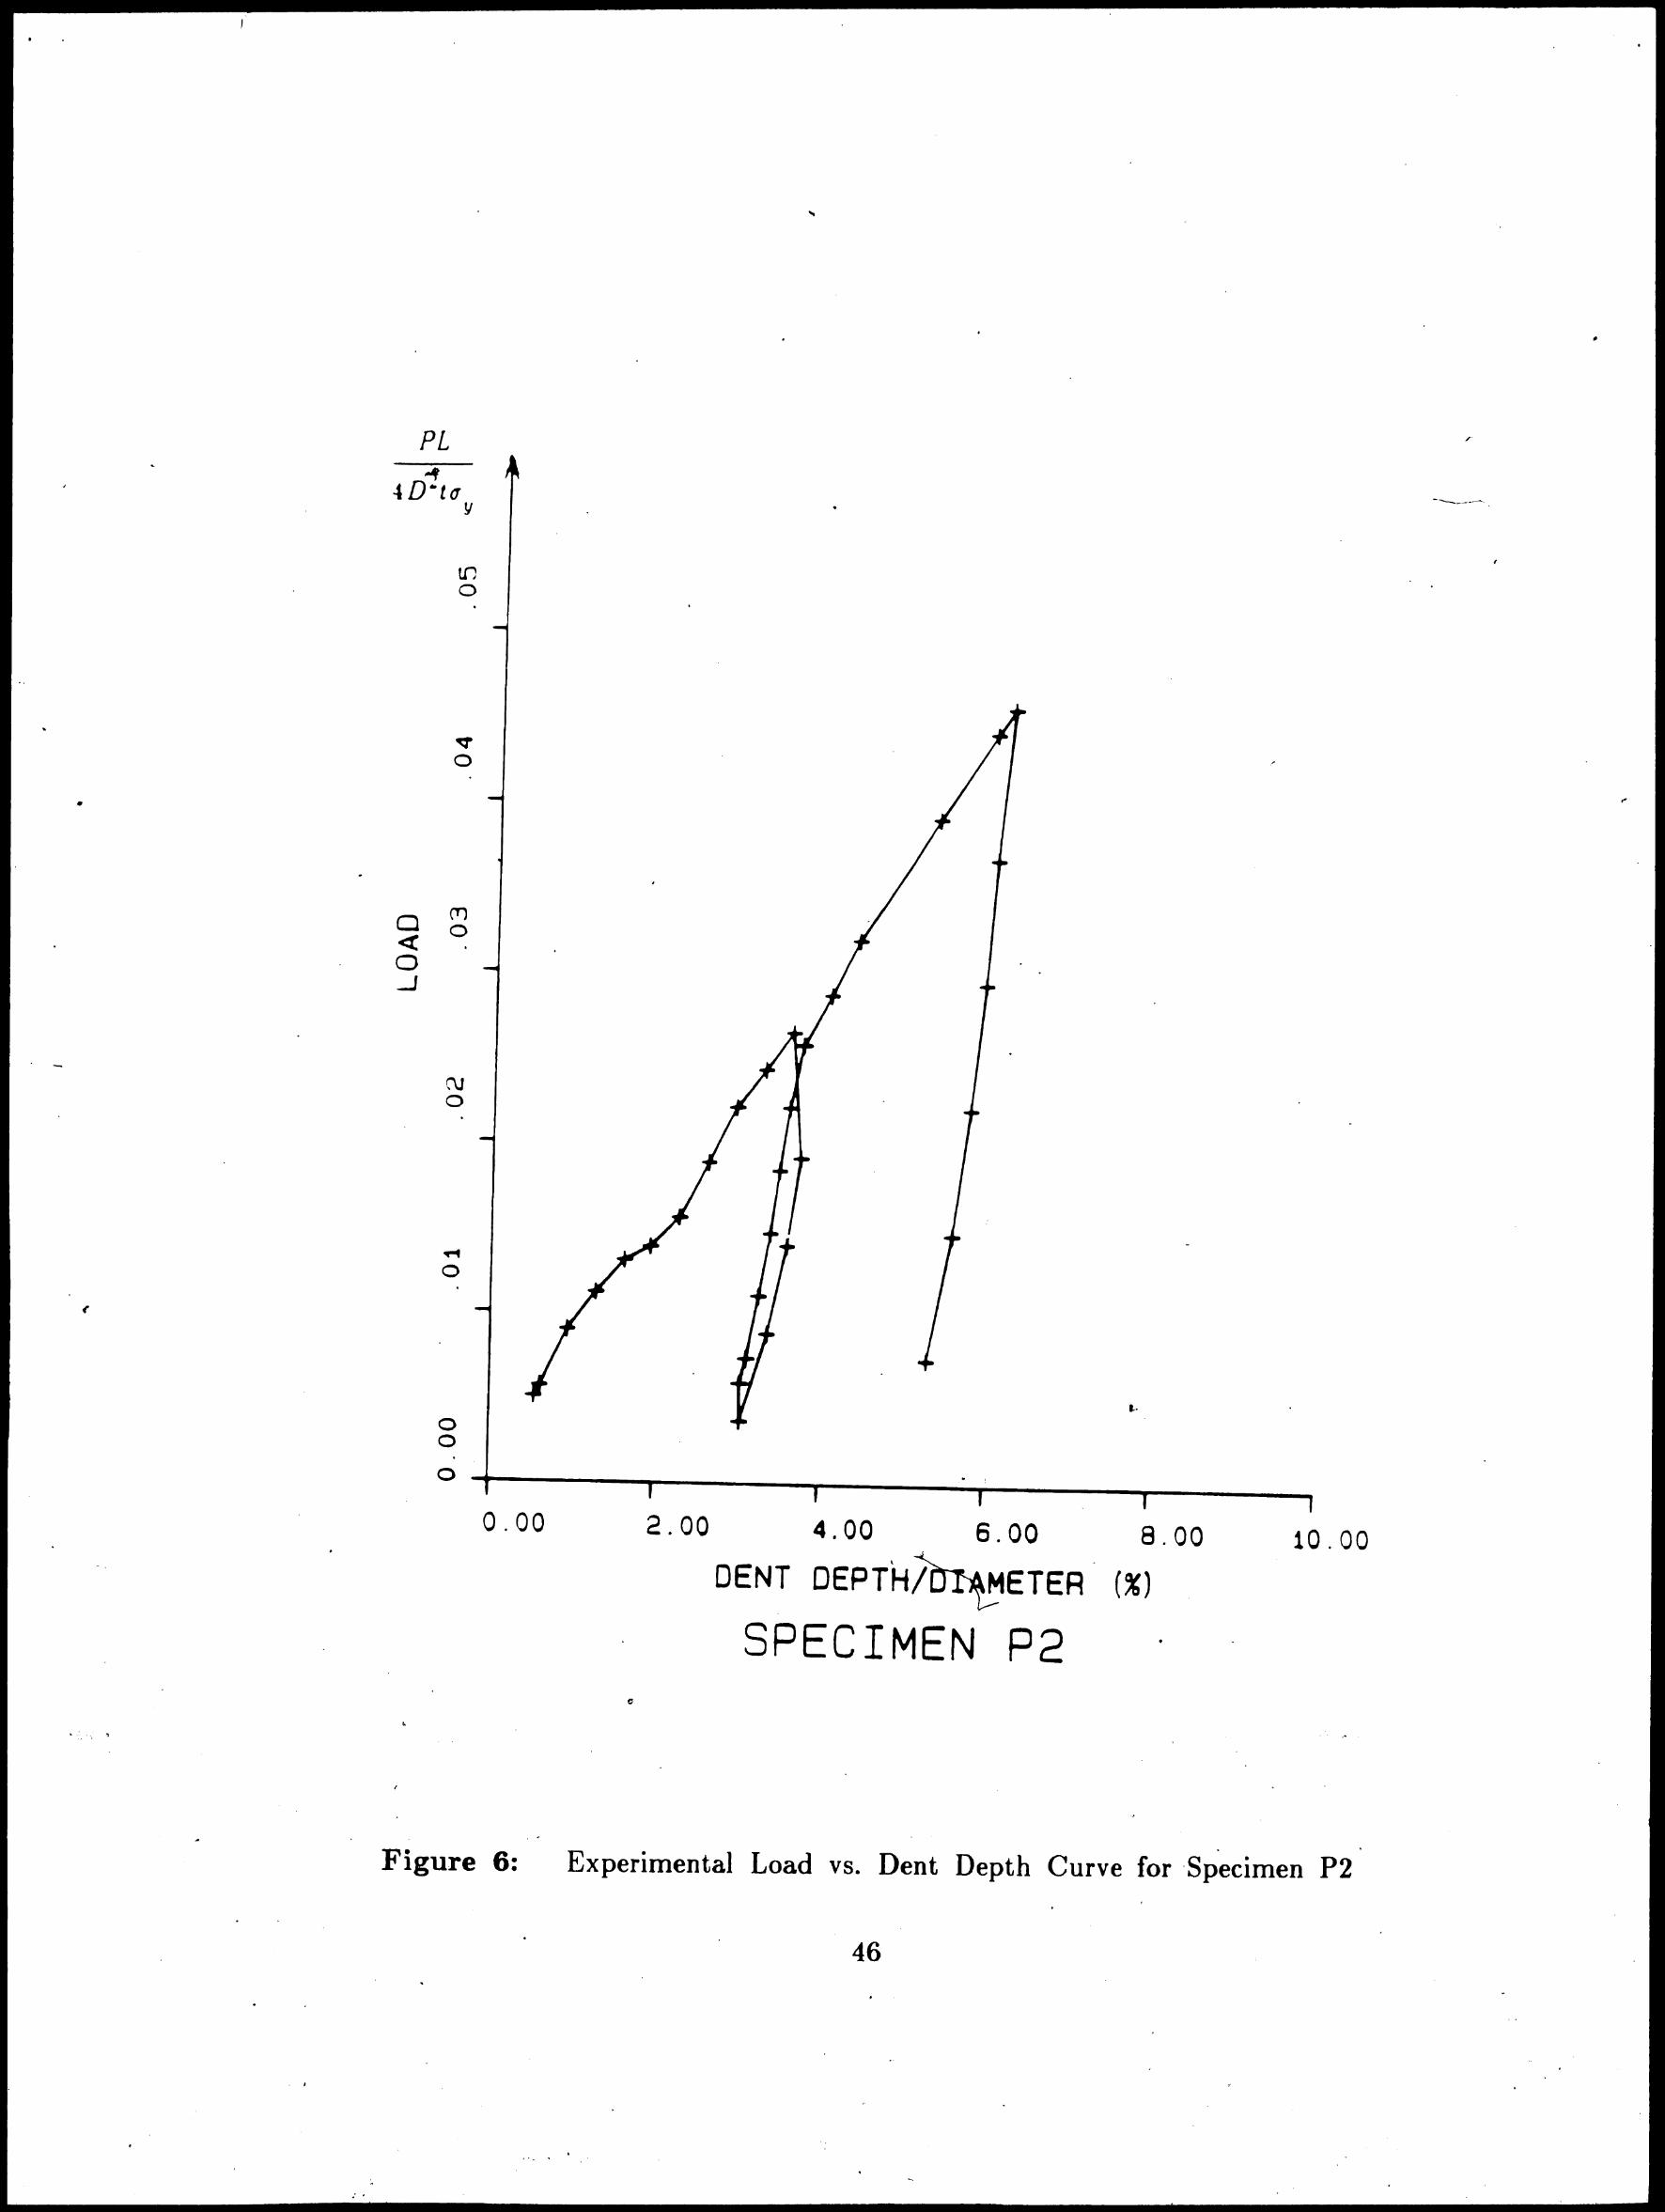
Plots of the load vs. dent depth for each specimen are shown in Figs. 5
4D2tu
and 6. The load was J\03_,dirnensionialized with respect to a factor ( L Y) ,
the magnitude of a concentrated load at midspan which would produce a; plastic
moment according to simple beam theory. The dent depth is given as a '
fracti.on of the tube diameter .. .((L
., I ;_.; .. .
.. .,
.11
' .
·.
i
\
'q .
,.
2.2.3 Results of Indentation •.
The indentation tests produced two specimens with localized dents at
midlength as well as data on the · load vs. dent depth response. The energy
dissipation as a function of dent depth was also 'determined.
2.2.3.1 Dent Geometry
LocalJy, the depth of denft- for Specimen P 1 was 19 mm (0. 75 in.), the
depth being measured with respect to the points just outside the dented area.
Subsequent measurements of the specimen geometry with respect to the ends of
the_ specimen showed that the overall depth of indentation was 28 mm ( 1.1 in.). I
This indicated that the deformation was a combination of a local dent and an
overall deflection of the specimen wall. For Specimen P2; the depth of dent
was 70 mm (2.8 in.) locally and 84 mm (3.3 in.) overall.
Thus, the nature of the der,it was also predominantly local with only a .,
slight overall distortion of the specimen. The dentdepth-to-diameter ratios for
Specimens PI and P2 were 2. 7% and 5.5%, respectively.
The surfaces of the dented specimens were mapped and contour plots were ~
rnade. A complete description of the dent geometry of both specimens including
the surface contour plots is given in Referenc.e [9).
2_.2.3.2 Energy Dissipation
The amount of energy dissipated during the indentation process was l .
determined from the area· under the curve plotted from the load vs. dent depth
data. Figure 7 shows the total energy absorbed vs. the dent depth for each
• specimen. -.
The total i energy absorbed included both~ the elastic and plastic
deformations since this would be of interest · in considering the mechanics of a r
collision.
12
r .
\\
'
.,, ..
•
Chapter· 3
Finite Element Analysis ,
In order to investigate the tu be indentation problem analytically, finite
element models were developed and solutions were obtained using the 1981
version of the program ADINA.* This program was selected for its capability
\
regarding material and geometric nonlinearities. The analysis was performed on
a Control Data Corporation Cyber 180 Model 850 computer running the NOS
and NOS /VE oper'ating systems.
The indentations of Specimens P 1 and P2 as well as Specimens IBII, IIAII,
IIICI were analyzed with ADINA. Pertinent information on the latter three
specimens which are a representative sampling of the specimens tested by Taby
and Rashed are given in Appendix A and Reference [12]. These five specimens
covered a wide range of tube geometries and material properties for which
·---
results of the analysis could be compared ,. to experimental data. The basic
modeling technique used is similar to that employed by Hypponen and Raiko in L.
the analysis of a pipe whipping against a rigid support. [7]
3.1 Introduction
The response of a tubular· member subjected to indentation is highly
nonlinear due to the large deformations of. the tube and plastification of the
,,
material. The analysis is also complicated by the nature of the contact between
the indenter and the tube wall. The contact area increases with the dent depth
and the distriqution of the load over the contact surface is continuously I • .
• * . ADINA Engineering AB, Vasteras, Sweden, and ADINA Engineering Inc., Watertown, Massachusetts
\ 13
'·
.,, .I
•
I •
,
--~ ,.
changing. Because the contact area and the distribution of the load a:re both
dependent\ on the response of the tube, the applie<l load (actually, an induced
nodal point displacerr1ent) could not be given as prescribed input for the
computer prograrr1. This necessitated the use of a special modeling technique.
The material and geometric nonlinearities due to plastification and large
deformations were within the capabilities of ADINA, and the difficulty was only
'
in determining computational parameters such as load increments and response·
tolerances.
3.2 Modeling
The finite element model consisted of two basic components: an assemblage
of shell elements representing the tu be and a set of truss elements designed to
model the contact between a rigid indenter and the tube wall. The shell
,.
elements used the isoparametric shell elements with · variable number of nodes
from the ADINA element library. Two node truss elements with nonlinear
stress-strain relationships were used to model the rigid indenter. The internal
bracing used during the indentation of Specimens P 1 and P2 was modeled with
a single linear elastic truss element. Due to symmetry of the problem, only one
fourth of the tube was modeled. The tube was sectioned along· the longitudinal
and transverse planes of symmetry which passed through the center of the
indentation. An overall view of a typical model is shown in Fig. 8.
f .
. . . . .
.. 14
-
.. '
' I
. .
..
' ....
·-
S.2.1 Contact Problem
The ~)em of modeling the contact of a rigid indenter agai~st a
cylindrical tube was simulated by• a series of truss elements with nonlinear
..
material properties. At one end, the truss elements were connected to the shell
element nodal points in the indentation area of the tube wall. The o'pposite
ends of all the truss elements were connected to a co\11n:on node at sufficient
distance from the surface of the tu be to consider the line of action of the forces
to be parallel. A prescribed displacement was imposed on this node to produce
the indentation of the tube.
The truss elements used to model the· indentation of Specimens PI and P2
were arranged in three rows corresponding to the 175 mm (7 in.) width of the
indenter used. Since the specimens tested by Taby were subjected to a
edge loading, the indentation was modeled with a single row of truss el
on the centerline of the indentation.
Simulation of the contact was achieved through the definition of the
constitutive relationships for the truss elements. Non linear elastic material
property defined by a piecewise-linear stress-strain ( u-£) relationship was selected
from the material models available for truss elements in ADINA. Pairs of <1-£
values input into1 ·, the program defined the stress and tangent modulus as
functions of strain.
A typical stress-strain diagram for a truss element is shown in Fig. 9. To
model the condition of contact (no tension forces may develop between the tube
surface and the indenter), the truss elements were made ~xtremely soft in
· t.ension .. by defini~~. a . ve~y. smal~odulu.s of elasticity for positive strains . ..
Modeling of· the initial .gap between the indenter and -the tube was accomplished .,
. .., ....
15 · \
..
,,
by extending the soft material response into the compression range. At . the •
point of contact between the indenter and tube wall the modulus of elasticity
was very large. Typically, this range was preceded by a short transition of
moderate s.tiff ness (See Fig. 9.).
The values of { , the strain at which the modulus of elasticity increases to B
its ultimate value, were determined for each truss element from the geometry as
shown in Fig. 10, where 6
{ == -. J L
The transition from an essentially zero modulus
....
of elasticity to rigid was also determined from the geometry. The value of { 6
calculated for a truss element marked the initiation of the transitional stiffness
for the adjacent truss element. This constitutive relationship 'allowed the truss
elements to have virtually no stiffness until the deformed geometry of the model
was consistent with contact at a nodal point by a rigid indenter.
The use of a trapsition in the stress-strain relationships proved to be
computationally expedient. It was also justified in the simulation of the
physical probl~m. In a direct comparison of analyses with bilinear and trilinear
stress-strain curves _(with and without a transition), the bilinear relationship was
slightly more costly, requiring 4% more CPU time for a 13%
number of equilibrium iterations performed for the analysis.
. . Increase In the
The greatest
difference in the two runs was in the calculated load vs. dent depth response of
the modeJ. The respo~se using a trilinear stress-'strain relationship was
considerably smoother. I
The physical justification for using the transition in moduli of elasticity
lies in the continuous nature of the .actual distributed loading as opposed to the
application: of the· lQad ,at discrete nodal points. The transition simulates a,.
~
continuous loading by allowing a more .. gradual shifting· of lc,ad from one nodal
16
..
' ......... ·"'"",;.•,::.:.~
,,
t_
,
.. ' ..
.J
I
,,
point to the adjacent node as the dent depth is increased. For this reason, a ·
quad-linear stress-strain relationship {2 transitions) was used in the analyses
performed with Model 2 (See Sec. 3.4.3).
S.2.2 Discretization of the Tube
Excluding preliminary attempts, three discretizations 6f the tube were used.
One model was used for the analysis of the test specimens PI and P2 only,
while two other more refined models were used in the analysis of all five
specimens. The latter two models differed from the first by the type of shell
elements and by the coarseness of the mesh at the indentation. The principal
difference between the · two latter discretizations was basically a modification to
accommodate larger dent depths.
In modeling, advantage was taken of the symmetry of the problem
allowing the analysis to be performed on a model consisting of one-fourth of the
actual tube. Planes of symmetry, passed through the center of the indentation
transversely to and along the longitudinal axis of the tube, divided it into
quarter segments. Appropriate boundary conditions were imposed at the cuts
(See Sec. 3.3).
A description of the three models is given in the following paragraphs
indicating the types of shell elements used and the number of nodal points. In
the course of the work, these models were somewhat arbitrarily given the
designations Model 2, 4, and 8 corresponding to a scheme for labeling · each of
the computer runs made. Dimensions related · to , the di\cretization for each
model and the particular specimens are shown in unfotded views of the meshes
• in Figs. l1, 12 and· 13.
Model 2, the model first used for the · analysis ·of Specimens Pl and P2, ·
17
\
J
•
..
. ~
consisted of 32 shell ..elements and 150 nodal points as shown in Fig. 14. Nine
node shell elements were employed, except for the two elements used as a
transition to a finer mesh at the indentation. At the indentation, the
circumferential discretization consisted of two elements span~ning 20 ° of arc.
' Th·us, three rows of five nodal points in the circumferential direction were
connected to truss elements. The remaining 160 ° of arc consisted of two
elements of 20 ° and three elements of 40 ° •
The discretization of Model 4 shown in Fig .. 15 consisted of 26 shell
elements which, except for the transition elements, were 16-node elements.
Thus, this model had a total of 196 nodal points. Due to the much finer mesh
in the region of indentation the response produced by this model was much
smoother than Model 2. The circumf ereEJ,ial discretization at the indentation
consisted of six elements spanning· 5 ° of arc each followed by one element with
30 ° and two elements with 60 °. The effect of the finer mesh was an improved
simulation of the continuous application of a load distributed over the surface of
the tube because of the denser population of truss elements transmitting load to
the shell as well as an increased sensitivity to deformations. The use of
16-node shell elements also permitted a more rapid transition from the fine
mesh over the indentation to a coarser mesh away from the dented area.
The third discretization, Model 8, was used to accommodate larger relative
dent depths. This model, shown in Fig. 16, is a modification of Model 4 with
the fine mesh in the region of indentation. extending over 60 ° of arc as opposed
to 30 ° ... The mesh in this region wa~ slightly coarser since only six elements in
the circumferential direction were used over 60 ° of arc. This model consisted ·_: . ...... .
' ' •' ..!, ~ ,..:, /, ~ lot.._ ~, • .0C-., • • •"""•: I O ' ' j l • • ' •
of 28 shell elements, typically, 16-node, and a total of 227 nodal po.in ts.··. . . .. --
18
Q
I•
I
(!
\ . -1
J r
•
••
3.3 Boundary Conditions
The boundary conditions imposed on the models were dictated by two
' criteria; the enforcement of deformations consistent with the symmetry of the
problem and the imposition of the support conditions of the two different test
arrangements used for the indentation of Specimens PI and P2 (See Sec. 2.2)
vs. Specimens IIJCI, IBII, and IIAII (See Appendix A).
The· boundary conditions required to impose the condition of symmetry on
the quarter section model were the same for all five specimens. At the
circumferential cut made by the transverse plane of symmetry at the center of
indentation, the translational degree of freedom in the longitudinal direction and
rotation about a tangent to the circumference were eliminated. Along the two ,,
longitudinal cuts made by the longitudinal plane 'of symmetry, the translation in
the circumferential direction, as well as, the rotation about the longitudinal axis
were prohibited.
The support condition of the test setup for Specimens .Pl and P2 were
modeled by preventing translation in the transverse plane at the end of the
model. This accommodated the effect of the support arrangement as well as of
the end rings attached to these two specimens (See Chap. 2).
The support arrangements for the indentation and the length of the
Specimens III CI, IBII, and IIAII -(See Appendix A), permitted the analytical
models to be shortened for the sake of economy of computation. The length of
the models was made not less than one and a half diameters since the portions
of the t.ube outside this region w_ould · have negligible effect on the indentation.
The actual lengths of the models used for these three specimens are given ip
Figs. 12 and 13. All degrees of freedom were allowed at the truncated _free end
J
.. 19
..
' .>. .....
,.
of the model. The. cradle support for these specimens was modeled by
' prohibiting translation in the radial direction at the nodal points directly
opposite the indentation.
3.4 ComputBtionBl PBrarr1eters \ ' .
the ~m. resulting from large " The high degree of nonlinearity of
I ' ~ displacements coupled with material nonlinearity and the aforementioned contact
problem presei:i,ted some computational difficulties. When unresolved, these
-
difficu.Jties typically manifested themselves in erratic calculated response or
abnormal termination of computation. However, results were obtained after
gaining sorr1e experience with the computer program. In particular, some
experimentation was necessary to determine the effect of the various user input
parameters which relate tci the formulation and solution of the incremental r
equilibrium equations on the calculated response. In general, the load
increments had to be made very small and equilibrium iterations performed at
every load step. The stiffness matrix was also updated at every load step.
Even with these measures taken, the calculated response was not always as
smooth as would be desired.
3.4.1 Formulation of Equat.ions
Ill'
For the shell elements, total Lagrangian formulation was used (large
displacements and rotations with small strains) together with elasto-plastic
material behavior. The von Mises yield criterion was used for the material
model. [2]
-
In the formulation · of the element matrices, ADINA ·employs Gauss ~~-
.. v.,h. --~.;f'T;..:.:_~:)
numerical· integration for which the order of integration-· (number of integration
20
• ~· "'· -- . r ..
\
I
'
..........
,
f
-.. . points) is controlled by the analyst. The program documentation offers
somewhat nebulous advice on suggested integration orders but seems to favor
higher integration orders for nonlinear analysis. [I, 2J The likely reason is that
lower integration orders can result in an assembled structure stiffness rnat,Jiix ~__..
that is singular or ill-conditioned. [3] However, it has been ~uggested that in
general "it is best to use as low an order as possible without precipitating a·
numerical disaster". [4) The first analyses performed with Model 2 used higher
integration orders and produced load vs. dent-.depth responses th_at were very
much stiffer than the experimental response. The subsequent use of reduced
integration orders with this model resulted in a much improved agreement with
the experimental data. This may be attributed to the fact that the resulting
inaccuracies in the numerical integration may compensate for the inherent
stiffness of the finite element solution. [3]
ADINA allows up to 4 integration points in the in-plane directions of the •
shell elements as well as through the thickness. The default values for the in
plane directions are 2 and 3 for the 9 and 16 node elements, respectively. [I]
However, higher integration orders of 3 and 4 respectively are suggested. [2]
Although it is suggested that a higher integration order throu_gh the thickness
may be more effective for elasto-plastic analysis, no significant difference was I
)
noted in a compari~on of 2 and 3 integration points through the thickness. For ' ~J
. /
the sake of economy of computation, 2 (pojnt integration through the thickness_ '-~ /
'
was used thereafter. Tables 2 and 3 show the integration orders used in the
analysis for the • models. A single integratio~ point used for the various was •
truss elements. . , .... ,..,._ .
't ,
'· . .
21
,r
,/ .... , ,,
...
3.4.2 Solution of Equations
The Broyden-Fletcher-Goldfarb-Shanno (BFGS) method, which utilizes an
updated stiffness matrix for the equilibrium iterations, was selected ( as opposed
to the modified Newton iteration) to solve the equilibrium equations. Due to
its improved convergence _characteristics, this is the recommended method when
significant nonlinearities are expecfed. [1, 2] The convergence criteria were the
default values in ADINA. Hence, only an energy convergence tolerance was
used.
Although some attempts were made at smoothening the calculated response
by tightening the convergence tolerances, greater success was obtained by
reducing the load increment. This is likely due -to the history dependence of
the solution because of the elasto-plastic material model used and the local
unloading of the shell elements as a result of the redistribution of load over the
contact area as the dent depth increased.
3.4.3 Development of Analytical Procedure • j
The analysis of Specimen Pl was the first to be performed, and the first
'-
runs with a reasonable calculated response and correlation with experimental
data were achieved with Model. 2. The first requisite for an analysis with
reasonable correlation to the experimental response with Model 2 was the use of
reduced integration orders for the shell elements (2x2 in the in-plane directions
since 9 node shell elements were used). This resulted in a significant reduction
in the stiffness of the response and provided a much improved agreement with
the experimental response as discussed in Sec. 3.4.1 .
.. .. .
. . In . order to more closely model the · application of a distributed load over
"
the relatively coarse mesh of Model· 2 .. in the- region of , the indentation,
22
.. ..
•
•
# •
• -. -
..
. '
p -- .
.J
J ,
quad-linear stress-strlin relationships for the truss elements were used. That is,
two transitions between essentially zero and infinite modulus of elasticity were
used causing each truss element to gradually stiffen as the indentation spread ..
circumferentially from one nodal point to the next. However, determination of
the specific values of stress and strain at the transitions for each truss element
. ~
{5 sets) that would result in a reasonably smooth calculated response proved to
be a trial and error process requiring considerable effort from the analyst as
well as significant computational resources.
Initial attempts at analyzing the indentation of Specimen P2 with Model 2
were abandoned as it was realized that the same trial and error process would
have to be repeated. This prompted the development of Model 4 with a mu~h
finer·· mesh in the dented area allowing the use of a single transition in the
stres~strain relationships for the truss elements which could l5e predetermined
from the geometry of the model (See Sec. 3.2.1).
The analysis of Specimen IIICI was also performed with Model 4. For
this analysis it was found that use of higher integration orders ( 4x4 in the in
plane directions) gave slightly better agreement with the experimental data.
However, the difference in the responses calculated __ with reduced and higher .
integration orders was not as significant as with Model 2· due to the finer mesh
of Model 4. '
Model 8 was used in the analysis of Specimens IBII and IIAII in order to
accommodp,te their larger dent depths. Although this model produced results
which correlated well. _with the experimental response overall, the slightly coarser
mesh of Model 8 • reflected • the lack of smoothness of the calculated lS lil
response . . ,
" -23
.......
\
1
3.5 Results of Analysis
The analytical results are presented as comparisons of the calculated and
experimental· load vs. dent depth responses. In each case, the response is shown
in non-dimensionalized form, the load being expressed as a fraction of the
magnitude of a concentrated load at midspan which would produce a plastic
moment according to simple
percentage of · the diameter.
.
All
computation, such as the specimen
~....ar:, and the dent depth is given as a
information related to . the
analyzed, number of load increments,
integration order for the shell elements, and the model used is given in Table 3. I
The load vs. dent depth response for Specimen PI calculated with Model 2
is shown in Fig. 17 along with the experimental re·sponse. The results of the
·analysis of Specimens Pl and P2 with Model 4 and their experimental response
are shown in Figs. 19 and 18. The analytical and experimental response of
Specimen IIICI is shown in Fig. 20. Figures 21 and 22 show the responses of ) ~ .
Specimens IBII and IIAII from the analysis with Model 8.
' 3.6 Discussion
The validity of the finite element analysis was verified by comparison of
.. the calculated response with the experimental. The correlation with the
. ' experimental data from the two large-diameter, fabricated specimens was not as ·
good as was obtained for the smaller, manufactured specimens which had been
stress relieved. Specifically, the calculated response was initially much stiffer
than the:· experimental for the fabricated specimens as shown in Figs. 17, 18,
.... and 19. ,.An implication is that residual stresses which are· not· taken into
. ~·.
account in the finite element analysis . but are present in the fabricated ~
specimens have a softening effect on the indentation response. The residual
' 24
•
·,
'"
•
,, .
....
-~
stresses due to cold-rolling were assumed to be significant and an investigation
of their effect was made. The results are discussed in Chap. 4.
The effect of the number of integration points used in the calculation of
the shell element stiffness matrices also seerned to have a significant effect for
the responses calculated with Model 2. However, the effect of integration orders
on the response calculated with Model 4, which has a much finer mesh, was not
nearly as great. This supports the reasoning that the inaccuracy resulting from
reduced integration orders may offset the excessive stiffness inherent in a coarse
mesh as discussed in Sec. 3.4.1.
3. 7 Comp11tational Cost
The computational work was executed on a Control Data Corporation
Cyber 180 Model 850 computer running the NOS and NOS/VE operating
systems. For the most part, the NOS/VE operating system was used because it
was more economical than the NOS operating system. Two benchmark jobs
were run to compare costs under the two operating systems. In each case the
run under the NOS /VE operating system showed a cost savings in CPU time of
better than 40%.
The cost of each analysis in terms of CPU time varied· with each of the
·three models. It was also sharply dependent on the integration order used with
the shell elements, but otherwise was generally consistent in terms of CPU time
per load step for each model. Computational times listed in Table 2 are
representative values for the runs made with each model. .
Cost for each run ·varied considerably. At the high extreme, CPU · time
per load incremen~ for Model 8 with reduced integration orders averaged 57 '
' '""'·
,.
seconds and over 300 load increments were used__ in_ the· analysis ,of a dent depth
25
•
•
.. /
•
r
, .
equal to 10% of the diameter. - This required several hours of CPU time for a .-
single load-deformation relationship. .
More typically, 150 to 200 load increments
.. were used with 12 · to 36 CPU seconds per increment. The obvious conclusion is
that considerable computational resources are required to conduct such a finite
element analysis.
,
-,.
26 ..
...
.,·
I •
••
. ,·"
"' ;.. '
Chapter 4
Effect of Residual Stresses
The much improved correlation between the results of the finite element
analysis ( which does · not include consideration of residual stresses) and the
experimental data on the manufactured, stress relieved specimens (Specimens
1811, IIAII, and IIICI) in comparison with the fabricated specimens (Specimens
Pl and P2) prompted the investigation into the effects of residual stresses on
the indentation behavior.
To gain an appreciation of the phenomenon, the formation of a circular
ring from a straight bar was analyzed since the residual stresses that develop
are analogous to the rolling residual stresses in a fabricated tube. The analogy
was extended to the indentation of a tube by considering the flattening of a
segment of the ring. The results showed that the residual stresses in a ring
had a significant effect on the moment required to flatten a segment of the
• ring.
4.1 Residual Stresses in a Circular Ring •
As a first step in determining the effect of residual stress on the
indentation behavior, the magnitude and pattern of residual stresses in a ring
resulting from cold-bending were determined. This was readily done considering
. . .
elastic-perfectly plastic material property and a rectangular cross section. An
equation for the initial curvature, g> i, required to prodµce a ring with a f}pal
curvature <I> (equal to the reciprocal of the radius, : } is given by;
( q> i ) 3 - ( S + t ) ( ~-i ) 2 + ! = 0 for <I> > ~Y ~ 2 Df. 4> 2
11 ,' Y 11 .
(4.1) ..
......... .
27
I •
..... '·
11
. . .
..
..
where
t = the wall thickness
D = the diameter of the ring
...
t the yield strain of the material 11
2t
4> 11
the yield curvature 11
t
'
An explicit solution for 4>. is somewhat difficult to obtain. However, it is l
possible to make a very good approximation considering that the difference/
between the initial and final curvatures is equal to 1.5 ·times the yield curvature
i.e., <l>. l
I t This approximation is very good for values of t > 2.0 - - - 1.5 <l> .
R y y
due to the asymptotic nature of the moment-curvature relationship for elastic-
. perfectly plastic materials. This lower bound for the approximation translates
t
to DE > 2.0, which, for even moderately high strength steels, say ( ~ 0.0025, is y
11
D satisfied for - ratios up to 200. With this approximation, which is valid for
t
h f D .
t e range o ·- ratios t
and yield strains
structures, Eq. ( 4.1) simplifies to
<l>i <l> 3 -==-+-<l> <l> 2 y y
or ·
1 3 {y
<l>.==-+-1 R t
typically encountered in offshore
(4.2)
which gives the maximum required curvature in terms of the thickness, yield
strain, and the· ·final radius, R. Since the final curvature is equal to 1
and the R'
.. 3 l
linearly elastic relaxation curvature 'must be --.!. , the residual stress distribution t .
is as shown in Fig. 23. The residual stress at the outer fiber is equal to 1/2
. 28
'
•
. .
i
the yield stress and is opposite in direction to the stress due to rolling. The D ( •
maximum residual stress, " ( 1 - So ) where a = 11 + 3 t occurs at a distance 11 2t Y
of ot from the neutral axis.
It should be noted that these residual stresses are not in self equilibrium
(but only slightly so) due to the approximation made for Eq. (4.2) or (4.3).
4.2 Effect of ·Residual Stresses in a Circular Ring
With the residual stress distribution for the cold-rolling process known, it
is possible to determine the moment required to flatten (return to zero
curvature) a segment of the ring by superimposing the stress distribution due to
the change in curvature onto the residual stresses. The elastic moment required
is directly proportional to the change in curvature.
superposition are shown in Fig. 24.
The results of this
A comparison of the stresses resulting from fl!lttening a segment · of a
circular ring with and without residual stresses indicates a reduction in the
moment in the flattened region when residual stresses are present. The
reduction calculated for a ring having the same radius, thickness, and material
properties as Specimen Pl was 21.1% and 22.1% for P2.
Although these calculations are only an approximate attempt to quantify
the effect of residual stresses due to cold-rolling plate into tubular members, ,
they support the contention that the residual stresses lead to a significant
reduction in the load required to produce an indentation and in the energy
dissipated in the process. •' .. .,
•
29
'· •
,j .· \
)
\
. .
4.3 Limited Range of Effect
The load vs. dent-depth relationships for the two fabricated specimens, Pl "
and P2, shown in Figs. 18 and 19 indicate that, in the initial stages of
indentation, the response calculated by ADINA is much stiffer than the
experimental response. However, the calculated and experimental curves seem to
rou'ghly parallel each other for some distance beyond this initial range.
The limited extent of the range for which the calculated response is stiffer
than the experimental response is a consequence of tfie1ocal plastification and
unloading that occur during deformation. This plastification and unloading have
a mitigating effect on the residual stresses due to cold-rolling since this process
results in the formation of its own residual stresses. An assumed deformation
model and observed deformations are used to demonstrate that the effect of
residual stresses due to cold-rolling is limited to the initial stages of indentation.
4.3.1 Plastificatio'n and Residual Stresses Due to Indentation
A simple model of the deformation of a cross section of a tube subjected
to indentation is shown ·in Fig. 26. The indentation results . 1n local
plastification followed by unloading as the localized area of plastification or
plastic hinge migrates through a given point in the deformation process. As a
result, residual stresses are formed in a manner similar to· that resulting from
cold-rolling during fabrication and have a similar effect. However, it appears
from the comparison of the analytical and experimental results that the effect is
not realized until some finite deformation occurs.
Wierzbicki and Suh presented an analytical method for analyzing the
denting of tubes under . combined. loading. (I5J Their · method involves the . .
.:,.,._..,. . . .
analysis of · a simplified · shell model .... consisting of a - series ···of rin.gs. - and
30
longitudinal strips. The deformation assumed for the ring elements is used here
to show ihat the effect of residual stresses due to cold-rolling is mitigated in
the deformation process. A deformed ring was assumed to be divided into four
segments of constant curvature separated by moving hinges as shown in Fig. 25.
Although this deformation is not consistent with indentation due to lateral
loading, it does approximate observed deformations.
The shape of the deformed ring for a given dent depth, d, is a function of
three parameters, R1, R2, and O defined in Fig. 25. From the assumed
geometry and the assumption of inextensibility of the ring in the circumferential
direction, the following two equations are obtairred:
I,
(4.4)
(4.5)
Since one more equation is needed to define the assumed geometry in terms of
the dent depth, the following relationship was suggested·:
R2 = (:J n R (4.6)
Wierzbicki and Suh further suggest that n==l and that 00 , the initial value of ()
7r
( undeformed geometry), be set to - resulting in the relationship 2
(4.7)
With this assumed deformation field, the curvature of the segments adjacent to
the flattened portion of the ring increases since R2 1ecreases. with increasing
dent depth. Plastification · ensues as the change in curvature in these segments
• · . increases I · 1
beyo~d the yield curv.ature (- - - > t )~ . . R2 R Y
As the deformation
... .,
'
increases, the hinges adjace~t to the · flattened segment migrate apart, resulting ., . ~-. . '·- ......... - . ...__ -- . . -
l
31 .
. '
. ' \
..
·- I .. -
in a reversal in curvature from one side of the hinge to the other. . If
plastification has occurred in the segments with radius R2, the moment required.
for this reversal in curvature- is reduced.
plastification is given by
The condition for i~cipient
•·
r2 > t
D( + t y
(4.8)
This local plastification followed by a reversal in curvature is analogous to cold-
rolling and then flattening ( denting). The relative dent depth at which
plastification is initiated is determined from Eqs. ( 4.4), ( 4 .5) and ( 4. 7) and is
given by
d - -D
[
1r ( 1 - r 2) + r 2( 0 + sin 0) r 2 ] 1 - . ( I - cos ()) + - ( 1 + cos O)
2 ( () + SID 0) 2 (4.9)
The solution of Eqs. ( 4.8) and ( 4.9) for the dent depths at which plastification
initiates in Specimens Pl and P2 gives the relative dent depths of 6.1 % and
10.3%, respectively. This indicates that the residual stresses due to denting
deformation have no effect until a finite dent depth is reached. However, these
calculated values of the dent dept~ are obviously dependent on the assumptions
made for the deformed shape.
4.3.2 Assumed and Observed Deformations ~
The calculated relative dent depth at which the effect of residual st.resses
is mitigated by plastification during deformation is- higher than is indicated by
. . the comparison· of th~ analytical and experimental load vs. dent depth curves
... . , . .
(Figs. 18 and- 1'9). . This is apparently--=-d1te to the assumed deformation geometry
·used in. the .. calculations .. __
32 · Q
---., .. -·
. . ' I :
' .,.
\
\ \
\
Although Wierzbicki and Suh based their assumed deformation on
observation of test • specimens and certain analytical considerations, the
deformations observed for Specimens Pl· and P2 differed somewhat from this
assumed geometry. The primary difference was in the formation of yield . lines P'
around the flattened section of the ,tube similar to the idealized dent geometry
shown in Fig. 3. The actual deformation of P 1 and P2 resemble the geometry
shown in Fig. 3 rather than the cross sectional geometry of Wierzbicki and
Suh 's model shown in Fig. 25. This is likely due to the relatively high D /t
ratios of these two specimens. A deformation model of a ring w,ith migrating
. plastic hinges based on the geometry shown in Section A-A of Fig. 3 is shown
in Fig. 26. The, two plastic hinges migrate apart as the dent depth and the
length of the flattened segment of the . .
ring 1 ncrease. The effect of the
formation of a plastic hinge followed by a reversal in curvature (flattening), as
the plastic hinges migrate, is the same as discussed in Sec. 4.3.1. f
According to this deformation model, the formation of the . migrating 'ii
plastic hinges occurs at infinitesimal dent . depth. This means that the effect of
residual stresses due to cold rolling would be immediately nullified. Thus, this
mo~el obviously does not reflect the actual deformation process b~t does provide
a qualitative indication that the dent depths calculated in Sec. 4.3.1 should be
greater than the actual values. Hence, the dent depth at w.hich the effect of
residual stresses becomes insignificant in the deformation process is somewhat
less than calculated from Eqs. ( 4.8) and ( 4.9), especially for tubes with large
D /t ratios.
• ' . ·,
.. . ·" ..
33
·•
. .,. ...
' .I
I
'·· ~ - .
Chapter 5
Summary, Conclusions and
Recommendations
5.1 lntroductior1 and Scope .
The investigation of the indentation behavior of tubular members reported
here consisted of experimental and analytical phases.
The experimental ph&se of the project provided data on the indentation
behavior and energy dissipation of two large-d_jameter fabricated tubular
. specimens. The data together with the result~ . of three tests conducted by
.
others were compared with the results of the analytical work.
The analytical phase of the project consisted_ of a finite element analysjs of
the indentation problem. The program ADINA was used because of its
capability for performing large displacement materially nonlinear analysis. Some
innovative modeling techniques were employed to simulate the contact of a rigid
indenter with the tube wall.
5.2 Experimental Work
An indentation was introduced into two large-diameter, fabricated tubular
specimens by the application· of a lateral load through a rigid indenter. The·
load vs. deformation response during indentation was used to calculate the · •'
energy absorption as a function of the dent depth for each specimen. Both
Jpecimens exhibited similar characteristics ~n this regard.
,,.
D
. ' \ . I
34 \
i . • J
,• .
'4
.,
/
r
5.3 Analytical Work
The finite element analysis of the indentation of the test specimens was
performed with the ADINA program which has ,t,he capability for material and
geometric nonlinearities. To further assess the validity of the finite element
modeling over a broader range of tube geometries and materials, the analysis
was extended to include the indentation of three additional specimens from
Reference [ 12). In contrast to the two test specimens of the current program, I • ,
"'-' ' / ,,, 1
these small-scale specimens were manufattured stf_ess relieved tubes.
The finite element model consisted of an assemblage· of shell elements to
model the tube and a set of truss elements to simulate the application o{ a
lateral load through a rigid indenter. Due to the high degree of nonlinearity
inherent in the problem as a result of large deformations, plastification, and the
nature of the loading, the incremental analysis had to be performed with a large
number of load steps. ·
The correlation of the analytical and experimental results was significantly
better for the manufactured stress reliev.,ed specimens than ,. for the fabricated )
specimens. This prompted the investigation of the effect of residual stresses due
to cold-rolling. The. results of the investigation confirmed the discrepancies in
the behavior of the fabricated and manufactured specimens.
5.4 Concll1sions C'
The finite element method, specifically, the commercially available ge.neral
analysis programs, can be used for predicting the elastic-plastic large-deformation
response of tubular members subjected to .concentrated lateral loads . .... .. .,
.-.
However, the finite element analysis of a nonlinear system is not always a
well defined or direct process. The modeling· of the - physical problem may not
35*'
• ..
..
' I
.,. .
i)
•
•
be straightforward; it may require innovative techniques or may only be an
.approximation due to the limitations of the computer program. Both of these
situations were encountered in the analytical work in modeling the contact with
a rigid indenter. Furthermore, several -other factors can affect the results of the
analysis. These can be the types of elements used and the discretization of the
t model to varia"tions in the way the governing· equations are formed and solved
within the program. To determine the effect of these factors on the results, the
analyst may have no alternative other than to perform further analyses with a
rediscretized mesh or modified computational parameters. Obviously, this can
be an expensive process, in terms _of both time and computational resources.
In view of the above considerations and of the results of this investigation,
acceptance of the analysis · should be contingent on an investigation of the
ramifications of the modeling and the assumptions made in the analysis.
Ideally, the analyst should have some empirical eviden.ce with which to correlate
the solution. Specifically, the results of this investigation indicate that the
....
indentation behavior of full scale fabricated tubular members may vary
significantly from the behavior predicted "by a finite element analysis. This is f"'
due, at least i~ part, to residual stresses in· the fabricated members .
.
· Since it has been shown that residual _stresses can. have a fairly significant
effect on the indentation response, some consideration should · also be given to
'
the application of experimental results obtained from stress relieved specimens to
the behavior of fabricated structures.
)
86
...
·/
\ '
I I
'
•
,
•
5.5 Recommendations for Future Wor.k
1 In order to develop a more complete understanding of the indentation
behavior of tubulars, research is needed to generate a more complete set of
data .. Simplified procedures for determining the indentation behavior could then
be developed from this database . Experimental , work, particularly, full scale ..
testing is suggested in conjunction with analytical methods. An effort should
· also be made to quantify the effects of re:idual stresses or d_ncorporate them into1
the analytical methods.
l'n light of the results of this investigation it is recommended that results, .. ;;-,- .
whether obtained throupf numerical methods, simplified analytical treatment, or
. experimentation, be correlated with f u1l scale testing. Specifically, more
indentation tesfs are needed on specimel1S)fabricated by cold-rolling and welding
and thus having residual stresses which are typical for real structures.
....
. '
• . , ......
.. : ..
.. ' ., ~· . _;.
3'1
•
•
Spec.
No.
J7' ys
Table 1: Specirru~n l)ata
l)irnensions Dent l)epth
d d/D
---------------------------------------------------------------------------------.---------------------------------
IBII IIAII IIICI
(MPa)
203.8
203.8
230
351 472
( 111 ) ( rn rn ) ( rr1 )
1.02 6.7:l
1.53 6. 1:3
0.125 2.51
0.161 2.52
0.250 6.02
2.44 150. 7 6.80
2.13 226.5 3.96
3.5 3.5
3.5
49.9 79.1
63.6 61.8
41.6 39.5
28 85
12.5
16.1 12.6
.
(%)
2.7 5.5
10.0
10.0 5.0
------------------------------------------------------------------------------------------------------------------
Pl P2
IBII IIAII IIICI ··
Model
{ksi)
29.56
29.56
33.4
50.9
68.5
(in.) (in.) (in.)
40.2 0.265 96.0 150.7 6.80
60.3 0.265 84.0 226.5 3.96
4.93 0.099 138.. 49.9 79.]
6.31 0.099 138 63.6 61.8
9.86 0.237 138 41.6 39.5
Table 2: '· Computational Cost
(in.)
1.1 3.3
0.492
0.633
0.496
(%)
2.7 5.5 ·
10.0 10.0 5.0
Shell Element Integration Order
In-Plane Through Thickness CPU time/Load Step
(sec.)
------------------------------------------------------------------------------------------------------------------
2 2 2 4 4 8
2 2 3 3 4 3
39
.3
2 3 2 2 2
<
\
...
\.
·-
16 12 27 36 66 57
..
Specirncn
Table 3: Details of Analytical Models
Analytical Model No.
Shell Elen1ent Number of .Load •
Integration · Order _ Increments l.1oad vs. Dent
l)epth Response
----------------------------------------------------------------------------------------------------------------~-PI PI P2
IIICI IBII I IA II
2 4 4 4 8
8
2x2x3 3x3x2 3x3x2 4x4x2 3x3x2 3x3x2
-
•- .
144 144 172
172 332 302
Fig. 17
.Fig. 18 Fig. 19 Fig. 20 Fig. 21 Fig. 22
;
•
Figure 1: Set-up for Indentation of Specirr1en Pl
•I
f
Figure 2: lndentA.tion of Specimen P2 •
!
42
I '
'
t
.. .
•
, vi • · .. ft.
..
Section B-8
8
r-~_...-_____ --t~ d
J_.. 8
Section A-A
Figure 3: Schematic Representation of Ideal Dent Geometry
.43
,,
•
•
•
Dial Gages
Figure 4:
\
I
-- Testing Machine Head -+
Jack 8 Load Cell
WF Beam ---
Intern al --Bracing
450
200 365
Dimensions rn mm
• C
Schematic RefM"esentation · of Test Set-up for Indentation
44
,.. .. --
•
,
PL
co 0
0 U:l < 0
0 _J
(\J 0
0 0 . O~-----,.--___.__-~--__.;._----------
0.00 1.00
•
2.00 3.00 4.00
DENT DEPTH/DIAMETER (%)
SPECIMEN Pi
" ','' .,,
5.00
..
Figure 5: Experimental Load vs:· Dent Depth Curve for Specimen Pl
\
45
.:. O• ...
. .
•
<
. '
. '
Pl ....
4D·t0' y
tn 0
0 (T") <t 0
0 _J
(\J 0
0 0
'
...
0 ;------,-----,----___;·~· -----.-----
0.00 2.00 4.00 6.00 8.00 10.00
DENT DEPTH~ETER . (%)
SPECIMEN P2 0
Figure 6: Experimental Load vs. Dent Depth Curve for Specimen P2
46
•
------~·---- .
' ,
. '·
........ 2:
* z ~
0 ... X 0
• tn ...
tn •
ru ...
0 Cl . LU o CD ... a: 0 en CD c( tn
•
>- " c.!)
a: UJ z UJ
...J 0 < . I- an 0 I-
an •
N
0 •
. ('
P2
.0 2.0 4.0 6.0 8.0 10.0X10 1
DENT DEPTH (MM)
ENERGY ABSORPTibN
Figure 7: Energy Absorption vs. Dent Depth for Specimens, Pl and P2
47
(1
E
Figure 9: Typical Stress-Strain Relationship for Stiffening Truss Element
,,
,,
...
. •
I
6
Figure 10: Geometry to Determine f.8
49 . ,.
' .. ,
"
.•
,
1
I I .
. .
-.,j ·-~ C ~ I.,
~ -... -::::l u a..
~ '\
',..;
I
I
I
I . I
1·
i .
L 24 Pl 1 610
Figure 11:
Longitudinal
1T'
-D 9
,r
-D 9
71'
-D 9
1f
-D 18
71'
-D 18
1f
-D 36 ,r
-D 36
L 12
* 6 ~" 3 L 3 L (in. J
71 >r .., 305 152 76 76 (mm)
Dimensions for Discretization of Model 2
50
.,
·~·
-~ ·--
·~ '
Pl
P2
mc1
24 L,
A
610
21 t;..:
'T 533
7.80 1.i .,
198
Figure 12:
Longitudinal
15 L
1 381
12 ~
'I 305
I.: 4.72
'I 120
JII'
-D 6
1f
-D 6
1f
-D 12
~
60-D 72
3 3 3 (in~) k i.. J.. L
:,r 76, 76, 76:.r (mmj
k 3 L, 3 " 3 '-' (in.) .>r 16 >r 16 >r 76,, ( mm)
~.94 ~.94 L,.94 i... (in.) ,, 24 >r 24 >r 24,, (mm)
Dimensions for Discretization of Model 4
51
-~ ·-~ C QJ L.t
~ ~ ... ~ r...i L.t ·-,,. "I
'-'
"
•
Longitudinal
1f
-D 6
1f
-D 6
1(
60-D 36
3.90 le 2.36 L...47 ~.47 1,,.47 ~ (in.) IBil -A-~------------->,.Jl!l'---------,,.--...... ..,..._"""'l~ ..... _,A .. --
. 99 I 60 · 12 12 1 12 1 (mm)
IlAil~~~4 _____ ._s_.9_1 _____ _..~------~-2_._9s __ ~~~-·5_9~4_._s9..,..~_·5_9~~-{_in_.)
150 >F \. 75 >r 15" 15 >r 15 >r (mm)
Figure 13: Dimensions for Discretization of Model 8
52
.,.,
.. Figure 16: Discretization of Tube - Model 8
',.;
i 'I
55
•
'
"" .
\ \ \
I i I
.' .... "',•- -· .
PL
, I
CD 0
:..0 0 0 <r 0
,. ~
(\J
0
0 0
"\- . --..)
..: ' .
Analytical
E;xperimen tal
•
0 -+-----,---_..._-,-----~--.-----------0.0
•••
1.0 2.0 3:0 4.0
DENT DEPTH/DIAMETER (%) ·
MODEL 2 - SPECIMEN P1
... '
Figure 17: Load vs. Dent Depth, Speicm~n Pl' - Model 2
56
5. 0 .
"
•
•• ,"Ii
'/ \
CD 0
0 c.o < ~ 0 _J
(\J
0
0 0
•
.i\.nal v ti cal "
Experimental
0-t---------'-----------------------. 0.0 1.0 2.0 3.0 4.0
DENT DEPTH/DIAMETER (%)
MODEL 4 - SPECIMEN Pi '
' .,• ,·
1,
Figure 18: Load vs. Dent Depth, Speicmen Pl ... Model 4
"': . . ,.,
57 ,.
5.0
....
.....
.. . -.( -,; • -t"
t[; 0
0 ('Tl
<t 0
0 _J
C\J 0
0 0
:\nalytical
Experimental
0 ......------------------....:..-----
0.0 2.0 4.0 6.0 8.0
DENT DEPTH/DIAMETER (%)
MODEL 4 - SPECIMEN P2 .r
•
' .
F,igure 19: Load vs. Dent Depth, Speicmen P2 - Model 4
58
I
10.0
..
,·.,-"'.
-
_J
Pl
0 0
0 CD
a o 4: '1J 0 _J
0 V
0 !'\J
0 0
\
•
Experimental
AnaJyticaJ
o_.,_ ___________________ _
0.0 2.0 4.0 6.0 8.0
DENT DEPTH/DIAMETER (%)
MODEL 4 ~ SPECIMEN IIICI
. ' ...,,,, ''- .. . .. ;. ... ~ ....
Figure 20: Load vs. Dent Depth, Speicmen IIICI - Model 4 .
59
10. 0
,.,
. t9
' . ' '
..
•
PL '
0 0
(\J
0 f l.iJ
0 0 < f"\J 0 'M
..J
0 CD
0 0
.. •
•
I
Analytical
Experimental
0-+------------------.......-----.. 0.0 · 4. 0 8.0 12.0 16.0 20.0
,. DENT DEPTH/DIAMETER (%)
' . M O·D EL 8 - SPEC I MEN I B I I
•· . •.. > :· ...
•
. . ...
., .,( , . ~ •,t, • ..;: ' )., . "" . . Figure 21: ~ .
Load vs. Dent Depth, Speicmen IBII - Model 8
-· .. .
' ' . . .-, . . . 4
.,i.:.,., ' '
' . '• . , ",.. r, -
• • • ~ ' , • • • .f ,.
,,,, f
'.
_) -...., ___ ,.
' ' j ~ ,{ ,{. ., . ..f.
PL ')
-tD·t<1 lj
0 0
~
0 ']J
0 0 ..D. <: 0 ..J
0 ~
0 f'\J
0 0
•
Experimental
:\nalvtical •
O~------------------,.-------. · 0. 0 4. 0. · 8.0 12.0 16.0
DENT DEPTH/DIAMETER (%),
MODEL 8 - SPECIMEN IIAII
' c ,. • _I t ' ", " ._,, ' ,( ,--
Figure 22: . Load vs. Dent Depth, -Speicmen IIAII - Model 8 . ~ .
61
20.0
·~ I , ''• ., .., •. -~ ,, ",f-.
. '
•
't
2 t
t
2
3
t
3
(J II
2 . ,_. L,
<1 ( l - 3a) lj
I,
1'
ot
(l t
Figure 23: Residual Stresses Th-rough Thickness Due to Cold-Rolling
t
6
t
3
t
2
.,,
Figure 24·:
>'t
•: ··- . .,,
at
at
Stress Distribution after Flattening
62
•
' " :. ,•.,
j
~--
Figure· 25:
I
/
I
/
Assumed Deformation of a Ring · (From Reference [15])
-migrating plastic hinge
\ \
•
Figure 26: Deformation of a Ring from Idealized Dent Geometry
63
, n ~-··
0 0 0 0 0 0
0
0 0 0 Q
0 Q
\j
0 0 0 0 0 Q
0
0 0 .0 0
0 0
Figure· 27: Test Setup for Indentation (From Reference (t2J)
64
..
...
..,
References .
II] ADINA User's Manual Report AE 81-1 edition, ADINA Engineering, Inc., 71 Elton Ave.,
Watertown, Mass. 02172, 1981.
[2] ADINA System Theory and Modeling· Guide Report AE 83-4 edition, ADINA Engineering, Inc., 71 Elton Ave.,
Watertown, Mass. 02172, 1983.
I 3] Bathe, K.J. Finite Element Procedures in Engineering Analysis. Prentice-Hall, Inc., 1982.
14) Cook, R.D. Concepts and Applications of Finite Element Analysis. John Wiley & Sons, New York, 1981 .
. [5] Ellinas, C.P., and Valsgard, S. Collision and Damage of Offshore Structures: A State-of-the-Art.
[6]
IJ? Proceedings of the Fourth International Offshore Mechanics and A retie Engineering Symposium, Vol. 2, pages 475-495. American Society of . Mechanical Engineers, New York, February, 1985.
(Symposium held in Dalias, TX, on February 17-21, 1985).
Grimm, D.F ., and Ostapenko, A. Local Buckling of Steel Tubular Columns . .In Proceedings, pages 25-28. Structural Stability Research Council,
·· Bethlehem, PA, 1982.
[7] Hypponen, ·r. and Raiko, H. Experiences in Nonlinear Shell Analysis Using Adina. Computers and Structures 17(5-6):649-652, 1983.
[8) Ostapenko, A., and Grimm, D.F. Local Buckling of Cylindrical Tubular Columns Made of A-96 Steel. Fritz Engineering Laboratory Report No. 450. 7, Lehigh University,
{9]
'
Bethlehem, PA, February, 1980.
Padula, J .A., and· Ostapenko, A. Indentation and Axial Tests of Two Large-Diameter Tubular Columns. Fritz Engineering L~boratory Report No. 508.5, Lehigh University,
Bethlehem, PA, February, 1987.
[10] Sherman, D.R.
. "
Tests of Circular Steel Tubes in Bending. Jo·urnal of the Structural Division, ASCE 102(ST11, Pape"r
12568):2181.:.2195, November, 1Q76. , .. •
65
I
..
I
[ 11] Soares, C.G., and Soreide, T.H. }>}astir Analysis of l.1aterally Loaded Circular 1'ubes.
[ 12)
[ 13;
[ 14]
[ 15]
r 161 I J
Journal of S'tructural Engineering, AS'()E 109(2):451-467, February, 1983.
1'aby, .J., and }lashed, S.M.H. l~xperirnental Investigation of the Behaviour of Damaged Tubular Members. r]'echnical J{eport MK/R92, Department of Naval Architecture and Marine
l~ngineering, The Norwegian Institute of 1"echnology, Trondheim,
Norway, 1980. ~
rraby, .J., and Moan, 1'. • (~ollapse and Residual Strength of Damaged Tubular Members. Behaviour of Offshore Structures. Elsevier Science Publishers B. V ., Amsterdam, 1985, pages 395-408.
Thomas, S.G., R.eid, S.R., and Johnson, W. Large Deformations of Thin-Walled Circular Tubes under Transverse
Loading-I. International Journal of Mechanical Sciences 18(6):325-333, June, 1976.
\\'ierzbicki, T., and Suh, M.S. l)enting Analysis of Tubes Under Combined Loading. Technical Report MITSG 86-5, MIT Sea Grant College Program,
Massachusetts Institute of Technology, 77 Massachusetts Ave.,
Cambridge, MA 02139, March, 1986. NA84AA-D-0046 R/0-19.
Wierzbicki, T., and Bhat, S.U. A Moving Hinge Solution for Axisymmetric Crushing of Tubes. International Journal of Mechanical Sci·ences 28(3):135-151, 1986 .
...
66
('
~-
Appendix A
Experime~tal Work by Others
Experirnental data reported by other researchers was used to assess the
validity of the finite clernent analysis. Specifically, the indentation behavior of
th rce speci rr1cns selected f rorn llef erence [ 12] { Specimens I I IC I, IBI I, and IIAII)
was analyzed and the results corr1pare\l to the experimental data. The
experimental work on these three specimens is described here since the details
are relevant to understanding the conclusions drawn from the analytical work.
A.I Scope
The experimental ,vork described in Reference [12] was part of a study to
form the basis of a simplified analytical method for determining the residual
strength of dented tubular columns. This work included indentation and axial
load tests of 24 tubular members. Experimental load vs. dent depth curves
were presented for the 24 specimens as well as a comparison of the theoretical . .
c
and experimental axial strengths of the dented specimens.
A.2 Description of Test Speci1nens
The test specimens were cold-drawn manufactured seamless tubes which
were heat treated to relieve residual stresses from the manufacturing process and
improve ductility.** The heat treatment consisted of heating to 550 ° C
( l 020 ° F) for one hour fallowed by slow cooling.
The specimen geometries were representative of a 1 :4 · scaling of members
' .
** Pertinent information, including geometric data and material properties of the three specimens
analyzed, is listed in Table 1.
67
•
"'
-
r
J \
cornr11on)y found in offshor<1 structures. 1"he J)/t ratios of the specirnens varied
frorn 40 to 64 with diarnPters ranging frorn 125 to 250 rnrn (5 to 10 in.). AIJ
spciciTIH'JlS had a length of :J5()(} lllTll {]38 in.).
spPcirnens rartged f rorn 2~~c1 t.o 20%, of th(' diameter.
A.3 I11de11tatio11 <>f SpPcimens
rrht· dent depth of the
ThP rnethod of indrntation of the specirnens was different from that used
for Specimens I1 1 /and P2. rl'he objPct i ve of the ind en tat ion process was to
produce specimens without overall bending deformations so that the effect of
indentations could be isolated. To accon1plish this. the tubes were supported in
a \vooden cradle directly below the indenter as sho\vn in Fig. 27. The denting
force \\'as transmitted to tbe tube through a "knife edge" (5 mm radius)
indenter. During inderitation, the dent depth and the load, provided by a
hydraulic jack, were rr1easured with a dial gage and manometer, respectively.
Although not indicated on the load v~. dent depth curves presented in the
reference, the specimens required multiple load cycles to produce the desired ..
dent depths.
The type of support and the "knife ·edge" loading were the prinlipal
considerations in modeling these specimens for the finite element analysis.
•
\ ,., '··-...t,
68
/~
/)
\
• '
D
d
L
I~
r ., .,
t
(
( y
<I> y
(J
(J y
e
- ...
l)ent depth
l.Jength
lladi us
• 1 I
Appendix B N ornenclature
J{adii as defined in Fig. 25
Nondin·1ensionalized Radius
Thickness
Coefficient D(
y + ') - ~(
2 t Y
•
•
(;ap Distance bet\veen indenter and tube wall
Strain ( engineering)
)'ield Strain
Curvature
Yield Curvature
Stress
Yield -Stress
2( y
t
Angle as defined in Fig. 25
69
I
Vita /
Joseph A. r>adula is tiu1 son of llelen and Joseph A. fladula and was born
011 I\1arrh 8, 1955 in San l)iego~ (;alifornia.
IIP graduated frorn I.Jake rl'aylor Senior 1Iigh School in Norfolk, Virginia in
1971. 1-Iis undergraduate studies ,.verc taken at Virginia Polytechnic Institute
and State LJniversity ~ I3lacksburg, Virginia and at Old Dominion University in
Norfolk, Virginia. In 1985~ hP ,vas a\\1arded the Bachelor of Science in Civil
Engineering from Old Dominion t~niversity. Graduate studies were undertaken
in the fall of 1985 in the l)epartment of Civil Engineering at Lehigh University
\vhere he has been a teaching and rescarth assistant.
70 · ,
' .
·. .