Experimental and numerical analysis of toughness anisotropy in AA2139 Al-alloy sheet T.F. Morgeneyer a,c, * , J. Besson a , H. Proudhon a , M.J. Starink b , I. Sinclair b a Mines ParisTech, Centre des mate ´riaux, CNRS UMR 7633, BP87 91003 Evry Cedex, France b Materials Research Group, School of Engineering Sciences, University of Southampton, Southampton SO17 1BJ, UK c Alcan Centre de Recherches de Voreppe, BP 27, 38341 Voreppe Cedex, France Received 13 March 2009; received in revised form 21 April 2009; accepted 24 April 2009 Available online 28 May 2009 Abstract Toughness anisotropy of AA2139 (Al–Cu–Mg) in T351 and T8 conditions has been studied via mechanical testing of smooth and notched specimens of different geometries, loaded in the rolling direction (L) or in the transverse direction (T). Fracture mechanisms were investigated via scanning electron microscopy and synchrotron radiation computed tomography. Contributions to failure anisot- ropy are identified as: (i) anisotropic initial void shape and growth; (ii) plastic behaviour including isotropic/kinematic hardening and plastic anisotropy; and (iii) nucleation at a second population of second-phase particles leading to coalescence via narrow crack regions. A model based in part on the Gurson–Tvergaard–Needleman approach is constructed to describe and predict deformation behaviour, crack propagation and, in particular, toughness anisotropy. Model parameters are fitted using microstructural data and data on defor- mation and crack propagation for a range of small test samples. Its transferability has been shown by simulating tests of large M(T) samples. Ó 2009 Acta Materialia Inc. Published by Elsevier Ltd. All rights reserved. Keywords: Toughness anisotropy; Aluminium; Synchrotron radiation computed tomography; Gurson model; Kinematic hardening 1. Introduction Anisotropic mechanical properties are common in plas- tically deformed or thermomechanically processed metallic materials, e.g. in rolled sheet. One particularly important issue in design is the toughness anisotropy of these materi- als. Furthermore, the transferability of toughness trends between small test pieces and larger structures is an impor- tant aspect in optimizing materials performance in practice. Thus, a validated model linking microstructure and fracture micromechanisms to full-scale component behav- iour (e.g. full-scale toughness) will be of great value in optimizing materials performance and in providing predic- tions of full-scale component behaviour. Anisotropic plastic behaviour has been the subject of many studies, and a number of models have been proposed at both the microscopic level using a polycrystalline description for the material (e.g. [1]) and at the macro- scopic level (e.g. [2]). Studies dealing with anisotropic rup- ture properties are less numerous, although there are many examples for cases where the fracture resistance of struc- tures made of sheet materials must be qualified, e.g. steel pipelines, aluminium alloys for aircraft fuselage, zirconium alloys for nuclear fuel cladding. Several causes may lie at the origin of anisotropic rupture properties: (i) Anisotropic plastic properties, usually related to the development of specific crystallographic textures, lead to different mechanical responses in different directions so that the plastic energy dissipated during fracture may be anisotropic [3,4]. In addition, local crack tip stresses and strains may be affected by plastic- ity and in particular by the shape of the yield function. 1359-6454/$36.00 Ó 2009 Acta Materialia Inc. Published by Elsevier Ltd. All rights reserved. doi:10.1016/j.actamat.2009.04.046 * Corresponding author. Address: Mines ParisTech, Centre des mate ´ri- aux, CNRS UMR 7633, BP87 91003 Evry Cedex, France. Tel.: +33 1 60 76 30 37; fax: +33 1 60 76 31 50. E-mail address: [email protected](T.F. Morgen- eyer). www.elsevier.com/locate/actamat Available online at www.sciencedirect.com Acta Materialia 57 (2009) 3902–3915
Transcript
Available online at www.sciencedirect.com
www.elsevier.com/locate/actamat
Acta Materialia 57 (2009) 3902–3915
Experimental and numerical analysis of toughness anisotropyin AA2139 Al-alloy sheet
T.F. Morgeneyer a,c,*, J. Besson a, H. Proudhon a, M.J. Starink b, I. Sinclair b
a Mines ParisTech, Centre des materiaux, CNRS UMR 7633, BP87 91003 Evry Cedex, Franceb Materials Research Group, School of Engineering Sciences, University of Southampton, Southampton SO17 1BJ, UK
c Alcan Centre de Recherches de Voreppe, BP 27, 38341 Voreppe Cedex, France
Received 13 March 2009; received in revised form 21 April 2009; accepted 24 April 2009Available online 28 May 2009
Abstract
Toughness anisotropy of AA2139 (Al–Cu–Mg) in T351 and T8 conditions has been studied via mechanical testing of smooth andnotched specimens of different geometries, loaded in the rolling direction (L) or in the transverse direction (T). Fracture mechanismswere investigated via scanning electron microscopy and synchrotron radiation computed tomography. Contributions to failure anisot-ropy are identified as: (i) anisotropic initial void shape and growth; (ii) plastic behaviour including isotropic/kinematic hardening andplastic anisotropy; and (iii) nucleation at a second population of second-phase particles leading to coalescence via narrow crack regions.A model based in part on the Gurson–Tvergaard–Needleman approach is constructed to describe and predict deformation behaviour,crack propagation and, in particular, toughness anisotropy. Model parameters are fitted using microstructural data and data on defor-mation and crack propagation for a range of small test samples. Its transferability has been shown by simulating tests of large M(T)samples.� 2009 Acta Materialia Inc. Published by Elsevier Ltd. All rights reserved.
Anisotropic mechanical properties are common in plas-tically deformed or thermomechanically processed metallicmaterials, e.g. in rolled sheet. One particularly importantissue in design is the toughness anisotropy of these materi-als. Furthermore, the transferability of toughness trendsbetween small test pieces and larger structures is an impor-tant aspect in optimizing materials performance in practice.Thus, a validated model linking microstructure andfracture micromechanisms to full-scale component behav-iour (e.g. full-scale toughness) will be of great value inoptimizing materials performance and in providing predic-tions of full-scale component behaviour.
1359-6454/$36.00 � 2009 Acta Materialia Inc. Published by Elsevier Ltd. All
doi:10.1016/j.actamat.2009.04.046
* Corresponding author. Address: Mines ParisTech, Centre des materi-aux, CNRS UMR 7633, BP87 91003 Evry Cedex, France. Tel.: +33 1 6076 30 37; fax: +33 1 60 76 31 50.
Anisotropic plastic behaviour has been the subject ofmany studies, and a number of models have been proposedat both the microscopic level using a polycrystallinedescription for the material (e.g. [1]) and at the macro-scopic level (e.g. [2]). Studies dealing with anisotropic rup-ture properties are less numerous, although there are manyexamples for cases where the fracture resistance of struc-tures made of sheet materials must be qualified, e.g. steelpipelines, aluminium alloys for aircraft fuselage, zirconiumalloys for nuclear fuel cladding. Several causes may lie atthe origin of anisotropic rupture properties:
(i) Anisotropic plastic properties, usually related to thedevelopment of specific crystallographic textures,lead to different mechanical responses in differentdirections so that the plastic energy dissipated duringfracture may be anisotropic [3,4]. In addition, localcrack tip stresses and strains may be affected by plastic-ity and in particular by the shape of the yield function.
Depending on the loading direction, local parameterscontrolling damage growth (such as stress triaxialityratio) may depend on the loading direction [5].
(ii) Processing conditions (e.g. hot rolling) may createinitially anisotropic defects such as elongated voidsand/or inclusions and anisotropic defect distributionwhich will lead to anisotropic fracture properties asexperimentally shown in Refs. [6–10].
(iii) Sheet materials are often prestrained so that they canexhibit anisotropic properties due to kinematic hard-ening. Recent experimental results have shown thatprestrain can affect ductility [11].
Several models incorporating the above-mentioned pos-sible mechanisms for fracture anisotropy have been pro-posed in the literature. Models are either based on themicromechanical Gurson model [12] and its ‘‘standard”
extension proposed by Tvergaard and Needleman (theso-called GTN model) [13] or the phenomenologicalLemaitre model [14,15]. In the present study, extensionsbased on the GTN model will be used. Introducing plasticanisotropy can be easily done by replacing the von Misesstress in the expression of yield surface given by the GTNmodel by any anisotropic stress measure. The Hill [16]equivalent stress approach was first used as in Refs.[3,17,18] but more advanced macroscopic models[2,19,20] recently proposed can also be used as shown inRefs. [4,21]. Models accounting for initial void shape andvoid shape evolution have been developed for prolate andoblate voids by Gologanu and co-workers [22,23]. Themodel was further extended to account for void coales-cence [8,24–26] based on the initial developments of Tho-mason [27]. These works have shown that ductility andtoughness are increased in the case of elongated cavitieswith the principal loading direction corresponding to theaxis of symmetry due to both the cavity shape which slowsdown void growth and the increased inter-void ligamentwhich delayed void coalescence. The opposite effect isobtained for flat cavities. The model has, however, a majorlimitation: cavities are assumed to be and remain axisym-metric so that the model must be adapted for non-axisym-metric mechanical loadings (in practice as soon as themodel is used in a finite-element code) [28]. The modelwas coupled with Hill anisotropy in Ref. [28] to study duc-tility of an X52 pipeline steel. Models based on the GTNapproach that simultaneously account for ductile damageand kinematic hardening have been proposed in the litera-ture, but little verification or testing in comparison withactual experiments has been undertaken [29–31]. Up tonow, these models have not been coupled either with
Table 1Composition limits of alloy AA2139 (wt.%).
Si Fe Cu Mn
60.1 60.15 4.5–5.5 0.20–0.6
plastic anisotropy or with void shape effects. These modelsaccount for void growth leading to final failure by internalnecking [27] but do not account for coalescence by voidsheeting [32]. This phenomenon can, however, be observedin thin sheet materials [33] and should be accounted for.
In this work, an experimental study involving the deter-mination of microstructural parameters, mechanical testingand fractography including novel tomography studies ofarrested cracks at high stress triaxiality is presented. Subse-quently a new model is suggested that incorporates: (i)anisotropic initial void shape and growth; (ii) plasticbehaviour, including isotropic/kinematic hardening andplastic anisotropy; and (iii) nucleation at a second popula-tion of second-phase particles leading to coalescence. Tothe best of our knowledge it is the first model to includethese three components. The effect of void shape isaccounted for using a novel simplified description whichhas the advantage of not being restricted to axisymmetriccases. Model parameters are determined using the experi-mentally obtained data. The model incorporates simplerepresentations of coalescence by internal necking and voidsheeting. The model is validated by comparing simulatedand experimental load–displacement curves obtained onlarge M(T) panels [34].
2. Experimental
A 3.2 mm sheet of AA2139-T351 was supplied, i.e. solu-tionized, 2% stretch and naturally aged (see Table 1 forcomposition). Testing was carried out on T351 material(for brevity identified here as ‘‘T3”), and after additionalageing at 175 �C for 16 h to approximate a T8 condition.The intermetallic content has been measured via grey valuethresholding of field emission gun scanning electronmicroscopy (FEG-SEM) images obtained in backscatteredelectron mode. Dispersoids have been observed with a FEIQuanta 600 microscope.
In this study four types of specimen have been utilised(see Fig. 1): smooth flat tensile specimens, notched flat ten-sile specimens (EU2), Kahn tear test specimens, and largeM(T) panels. Tests on notched EU2 specimens in particu-lar allow fracture properties to be investigated at increasedstress triaxiality. Two orientations of loading in the sheetplane have been investigated for all samples: rolling direc-tion (L) and long transverse direction (T). In Kahn andM(T) specimens loaded in the L direction, cracks will prop-agate in the T direction; these tests are referred to as L–T,and vice versa for T–L designated tests. At least two testshave been performed in each condition/direction combina-tion, whilst for the M(T) sample only one test has been
performed per condition/direction. For technical reasons,M(T) tests for T–L loading have only been carried outfor the T3 condition. Testing speeds are given in Ref. [21].
The sample preparation for synchrotron radiation com-puted tomography (SRCT) and SEM has been carried outas described previously [10]. For the analysis of arrestedcracks in the initiation region, use was made of customimage data manipulation routines. The cracks are firstbinarized using a series of morphological operations thenanalyzed using a ‘‘sum along ray algorithm” [35]. Theaim was to precisely determine and quantify the local crackcharacteristics such as opening within the three-dimen-sional (3-D) volume.
3. Experimental results and analysis
3.1. Material microstructure
Mean anisotropic pore dimensions (3-D Feret measure-ments) and volume fractions of pores and particles aregiven in Table 2. Mean Feret dimensions of 3-D Voronoitessellation [36] of cells around pores and intermetallic par-ticles revealed isotropic distribution of pores and particles.
Some intermetallic particles were, however, seen to bealigned as stringers in the L direction with stringer dimen-sions of the order of 15–30 lm (cf. 1–10 lm in T and1–6 lm in the short-transverse direction (S) (see also Ref.[10])). Fig. 2 shows a FEG-SEM image in backscattered
Table 2Porosity and intermetallic particle content, dimensions and distribution of thpreviously [10]).
Porosity Intermeta
fv in (%) 0.34 0.45With a variation of ±10% when setting extreme greyvalues
±15% (stmagnifica
Mean Feret dimensions of pores in lm Mean Fer
L T S L
7.6 5.4 4.5 23
mode of the material in the L–T plane. Dispersoids canbe seen to be elongated in the L direction.
3.2. Tensile testing on smooth and notched flat specimens
Fig. 3 shows the results of tensile tests on smooth spec-imens. In the T3 condition (Fig. 3a) tensile behaviour isanisotropic: for testing in the L direction yield strength aswell as loads for the same elongation are higher than fortesting in the T direction. The transition between the elasticand plastic part of the deformation curve is smooth for Ttesting but relatively sharp for L testing. The through-thickness deformation is essentially the same for the twotesting directions; the slope of the through-thickness varia-tion vs. applied strain is close to 0.5 as for isotropic behav-iour. The slight difference in initial tensile curve shape islikely to be mostly due to the prestraining by �2% thatthe material has undergone. For the material in the T8 con-dition (Fig. 3b) tensile deformation curves in the differentloading directions, as well as the corresponding through-thickness deformation curves, are essentially identical.
The results of EU2 testing (curves not presented here forbrevity) reveal anisotropy in the load curve for the T3material only, whilst final failure occurs at similar openingdisplacements. Consistent with the tensile tests, the L and Tloading of EU2 samples in the T8 condition do not showsignificantly different plastic behaviour.
e AA2139 alloy (pore content and pore Feret dimension were reported
llic particles
andard error based on repeat measurements at different locations andtions)
et dimensions of Voronoi cells around 2nd phase particles and pores in lm
T S
24 25
(a) (b)
0
100
200
300
400
500
0 0.05 0.1 0.15 0.2 0.25 0
0.02
0.04
0.06
0.08
0.1
0.12
0.14F/
A 0 in
MPa
thic
knes
s va
riatio
n: Δ
s/s 0
Δl/l0
T3
tensile L experimentaltensile T experimental
L thickness variationT thickness variation
tensile L simulationtensile L simulation
0
100
200
300
400
500
0 0.05 0.1 0.15 0.2 0.25 0
0.02
0.04
0.06
0.08
0.1
0.12
0.14
F/A 0
in M
Pa
thic
knes
s va
riatio
n: Δ
s/s 0
Δl/l0
T8
tensile L experimentaltensile T experimental
L thickness variationT thickness variation
tensile L simulation
Fig. 3. Tensile tests experimental and simulation for naturally aged and artificially aged (T3 and T8) material.
Table 3Unit initiation energy (UIE) for Kahn tear tests for the loading directionsL–T and T–L and T3 and T8 conditions.
Fig. 4 shows the results of the Kahn tear tests [37] in termsof force F divided by the initial ligament area A0 as a functionof the crack mouth opening displacement (CMOD) alongwith the crack length as a function of the CMOD for L–Tand T–L testing for the T3 and T8 conditions. For the T3material (Fig. 4a) the nominal load is smaller for the T–Ltests as compared to the L–T tests up to maximum loadsfrom �100 MPa onwards (i.e. indicating a lower initiationtoughness). The load differences between the T–L and L–Ttests are even higher in the propagation region and crackgrowth is faster in the T–L test orientation than in the L–Torientation. The unit initiation energy (UIE, defined as theintegral
RF/A0 dld, where dld is the pin displacement, taken
from the start of the test to maximum load [7]) for the testsare shown in Table 3. For the T3 condition the UIE forthe T–L sample is �15% lower than for the L–T sample.For the T8 material (Fig. 4b) the nominal load is very similarfor both sample orientations up to the maximum load of theT–L sample. However, as the maximum load of the L–Tsample is higher and is reached at increased pin displacement,the UIE is 30% higher for the L–T sample than for the T–L.Nominal stresses in the propagation region are substantiallylower for the T–L sample than for the L–T sample and crackgrowth is faster for the T–L test compared to the L–T.
(a)
0
50
100
150
200
0 0.5 1 1.5 2 2.5 3 3.5 4 0
5
10
15
20
25
30
F/A 0
in M
Pa
crac
k le
ngth
in m
m
CMOD in mm
T3
Kahn L-T experimentalKahn T-L experimental
Kahn L-T simul.Kahn T-L simul.
L-T exp. cracklengthT-L exp. cracklength
Fig. 4. Kahn tear test tests experimental and simulation for n
3.4. M(T) testing
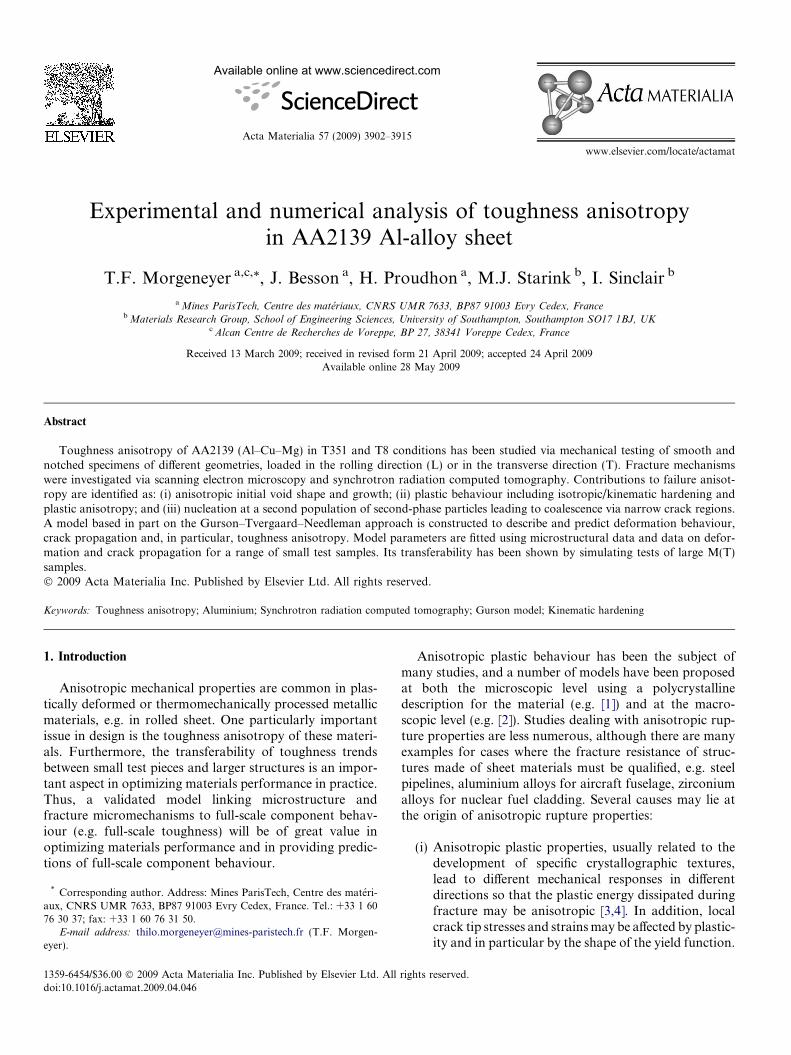
Fig. 5 shows the results of M(T) tests for (a) the T3 con-dition (T–L loading only) and (b) the T8 condition (forboth loading directions). Strong toughness anisotropycan be identified for the T8 material. The maximum loadof the L–T sample is �24% higher than for the T–L sample,which is clearly higher than the corresponding anisotropymeasured for the Kahn tear tests (8%, see Fig. 4).
4. Fractography
4.1. Fractography of Kahn samples
For brevity the fractography images are not presentedhere but the results are briefly summarized. In the flat tri-angular region where the crack initiates from the notch[33] coarse voids appear to have mainly coalesced via
(b)
0
50
100
150
200
0 0.5 1 1.5 2 2.5 3 3.5 4 0
5
10
15
20
25
30
F/A 0
in M
Pa
crac
k le
ngth
in m
m
CMOD in mm
arrested
arrested T8
Kahn L-T experimentalKahn T-L experimental
Kahn L-T simul.Kahn L-T simul.
L-T exp. cracklengthT-L exp. cracklength
aturally aged and artificially aged (T3 and T8) materials.
(a)
0
50
100
150
200
250
300
350
0 1 2 3 4 5 6
F/A
0 in
MPa
CMOD in mm
test validity limit T3
M(T) T-L exp.M(T) L-T simul.M(T) T-L simul.
0
50
100
150
200
250
300
350
0 1 2 3 4 5 6
F/A
0 in
MPa
CMOD in mm
T8
M(T) L-T exp.M(T) T-L exp.
M(T) L-T simul.M(T) T-L simul.
(b)
Fig. 5. M(T) test results for simulation and experiment for naturally aged and artificially aged (T3 and T8) materials.
impingement. The dimples are coarser for the T3 conditionthan for the T8. For the T–L samples the surface morphol-ogy is more obviously directional, with void chains appar-ent on the fracture surface parallel to the material rollingdirection.
In the propagation region (the slanted crack growth) atmid-thickness, fracture still seems to be dominated bycoarse voiding. However, areas containing fine dimplescan also be observed which appear consistent with sheardecohesion or also called void sheeting [32]. At the edgeof the specimen, the area coverage of microscopically flatregions is higher than at mid-thickness. Fractographicassessment of M(T) sample fracture surfaces has not beencarried out here: it has been identified previously that forsimilar strength Al-alloy sheet, stress states and fracturemechanisms are very similar for Kahn tear test samplesand M(T) samples [33].
4.2. SRCT study of fracture initiation in Kahn tear testsamples
Tomography scans of arrested cracks allow observationof the initial stages of failure and the subsequent evolutionof the fracture process immediately ahead of the crack tip.In the present study the fracture evolution during (flat)crack initiation at high levels of stress triaxiality ahead ofthe machined notches has been captured in arrested cracksvia tomography (also see Fig. 4).
Fig. 6a and b shows a local crack opening map of thosecracks for the different loading directions and conditions,as obtained via the sum along ray method [10,35] and 2-D sections normal to the crack propagation direction ofcracked scanned volumes (Fig. 6a and b). The locationswhere the sections are taken from are indicated with lineson the respective COD maps. In all cases there are voidsreaching out ahead of the main triangular body of thecrack that are often linked to the main crack through nar-row (in terms of opening) coalescence regions that mayresult from nucleation of voids at a second population ofsmall second-phase particles [33]. An especially long voidchain reaching ahead the main crack can be seen for theT8 T–L image (see dashed box). Even at this stage of
fracture, which is governed by high stress triaxiality thatis expected to favour void growth and subsequent coales-cence via void impingement [33], clear evidence of coales-cence through narrow flat regions is provided in Fig. 6 atthe respective crack fronts. Comparison of Fig. 6a with bfurther shows that coarse voids are larger and morealigned/elongated in crack growth direction in the T8 T–L sample than in the T8 L–T sample, which is consistentwith the observation made in T8 T–L and L–T samplesof the same material in the propagation region [10]. Thisresults in shorter intervoid ligament distances between forthe T–L T8 sample than for the T8 L–T sample.
2-D sections of the crack in the T8 T–L sample are seenin Sections 1 and 2 of Fig. 6c at �550 and 200 lm from thecrack tip, respectively. Abrupt jumps of 100–200 lm arediscernible in the cracks in Fig. 6c. The different crackheights are seen to be linked via narrow regions that liein the sheet plane (see Fig. 6). In the first instance theyare thought to lie on grain boundaries as has been identi-fied for an AA6156 alloy [38], but this has not been explic-itly confirmed.
Fig. 6d, Sections 1 and 2, show the T8 L–T crack at�700 and �300 lm from the crack tip, respectively. Voidimpingement in columns and shear decohesion that maybe the start of slant fracture are discernible. Section 2 ofFig. 6d shows the crack at �300 lm from the notch tip:at the right part of the crack a narrow region links twocoarse voids.
5. Constitutive model
The model aims at representing anisotropic ductile fail-ure of the 2139 aluminium alloy and therefore needs toinclude the description of the following phenomena: (i)plastic anisotropy, (ii) mixed isotropic/kinematic harden-ing, (iii) ductile damage by void growth and void sheeting.The model is based on extensions of the GTN model[12,13]. Kinematic hardening is represented by an internalback stress tensor X . The yield surface is then expressedas a function of B = r – X, where r is the Cauchy stresstensor. Plastic anisotropy is introduced using an aniso-tropic stress measure BE defined as [2,20]:
Fig. 6. Representation of the local cack tip opening via a ‘‘sum along ray method” for: (a) T–L loading in the T8 condition; (b) L–T loading in the T8condition (with lines indicating locations of the 2-D sections) and 2-D sections of the SRCT data normal to the crack growth direction; (c) T–L loading inthe T8 condition; (d) L–T loading in the T8 condition.
where ~B1 � ~B2 � ~B3 are the eigenvalues of a modified stressdeviator ~B ¼ L : B where the fourth-order tensor L is ex-pressed as:
L¼
ðcTT þcSSÞ=3 �cSS=3 �cTT =3 0 0 0
�cSS=3 ðcSSþcLLÞ=3 �cLL=3 0 0 0
�cTT =3 �cLL=3 ðcLLþcTT Þ=3 0 0 0
0 0 0 cLT 0 0
0 0 0 0 cTS 0
0 0 0 0 0 cSL
0BBBBBBBB@
1CCCCCCCCA; ð2Þ
where ci = LL,. . .,SL are material coefficients representingplastic anisotropy. Directions L, T and S are assumed tobe material directions. Coefficient b represents the shapeof the yield function. An isotropic material correspondsto ci = LL,. . .,SL = 1. The usual von Mises yield criterion is
then obtained for b = 2 or 4. The Tresca yield criterion cor-responds to b = 1 or b = +1.
To describe ductile damage, the GTN model is used todefine effective scalar stresses [12,13]. Let a be any sec-ond-order tensor. The corresponding effective stress, a*, isimplicitly defined by:
Wða�; aE; aK ; f Þ ¼a2
E
a2�þ 2q1f� cosh
q2
2
aK
a�
� �� 1� q1f 2
� ¼ 0;
ð3Þwhere f represents the void volume fraction (porosity). f* isa function introduced by Tvergaard and Needleman [13] torepresent the increased damaging effect of voids duringcoalescence:
where fc represents the critical growth void volume fractionfor which coalescence via impingement starts. d is an‘‘accelerating” factor which represents the increased soften-ing effect of voids once coalescence has started. aE is theanisotropic stress measure defined by Eq. (1). aK is intro-duced to represent in a simplified way 3-D anisotropic voidgrowth and is defined by:
aK ¼ aLLaLL þ aTT aTT þ aSSaSS ; ð5Þwhere ai = LL,TT,SS are parameters to be determined. Thisapproximate solution is indeed easier to implement andcomputationally more efficient than the anisotropic modelsproposed in Refs. [22,23,25,28] which explicitly account forcavity shape effects. Note that these models are limited toaxisymmetric cavities subjected to axisymmetric loadingconditions (although they are extended to deal with generic3-D loadings), whereas the extension proposed here is al-ways valid. The yield function is then constructed usingthe effective stress associated to B:
U ¼ B� � RðpÞ; ð6Þwhere the function R(p) represents isotropic hardening andp a scalar effective plastic strain. The plastic strain rate ten-sor is given by the normality rule as:
_ep ¼ ð1� f Þ _p @U@r¼ ð1� f Þ _p @B�
@r¼ _pn: ð7Þ
It is then necessary to derive evolution laws for the variousmodel variables. The model uses an additive decompositionof the elastic and plastic strain rates so that _e ¼ _ee þ _ep,where _e is the strain rate tensor and _ee and _ep are the elasticand plastic strain rate tensors, respectively. The Cauchystress is computed from the elastic strain tensor usingHooke’s law as r ¼ E : ee, where E is the fourth-order stiff-ness tensor. Damage growth is controlled by void growthand void nucleation. Accordingly the evolution law forporosity is expressed as [39]:
_f ¼ ð1� f Þtraceð_epÞ þ ðA1n þ A2
nÞ _p; ð8Þwhere the first term on the right-hand side corresponds tovoid growth (i.e. mass conservation) and the second termcorresponds to void nucleation. Material parameter A1
n
controls nucleation rate for void nucleation at coarse inter-metallic particles. A2
n controls nucleation at a second popu-lation of smaller second-phase particles observed in slantedareas, which appears to control fracture in low-stress triax-iality regions as evidenced in Ref. [33]. A2
n accounts forshear decohesion and void sheeting although slanted crackpaths are not simulated (see below). Kinematic hardeningis described using an intermediate tensorial variable, a,for which the evolution law is given following the standardexpression for non-linear kinematic hardening [40] by:
_a ¼ _ep �3
2
DC
_pX ¼ _p n� 3
2
DC
X� �
; ð9Þ
where D and C are two material parameters. The equationused for undamaged materials [40] to relate a and the back
stress X (i.e. X ¼ 23Ca) cannot be directly used as the macro-
scopic back-stress would not vanish as the material breaks(i.e. for f* = 1/q1). To solve this problem, one defines anintermediate back-stress, v, which can be interpreted as theback-stress at the microscopic level. v is related to a usingby: v ¼ 2
3Ca. Following Besson and Guillemer-Neel [31],
the actual back-stress, X, is computed such that:
v ¼ 2
3X �
@X �@X
: ð10Þ
In practice, this equation must be iteratively solved with re-spect to X. Computing X � as the solution of WðX �;X E;X K ; f Þ = 0 would not give expressions equivalent tothat proposed in Ref. [40] for the undamaged material inthe limit case f = 0 as plastic anisotropy would be takeninto account. For that reason, it is preferable to use an iso-tropic definition of the effective stress to apply the previousequation. In that case, X � is defined as the solution ofWðX �;X eq;X kk; f Þ = 0 where Xeq and Xkk are, respectively,the von Mises invariant of X and its trace.
When standard finite-element techniques are used, mod-els including damage lead to material softening and meshsize dependence. In that case, it is necessary to fix the meshsize in order to obtain results transferable from one sampleto another [21,41–43] (although improved, so-called ‘‘non-local” models can be used to obtain mesh-independentresults [44,45]). Consequently, the mesh size, and in partic-ular the mesh height in the direction perpendicular to thecrack plane, h [46], should be considered as an adjustableparameter tuned to represent crack growth. It needs to betuned on specimens containing cracks.
Experiments show that the crack initiates with a flat tri-angle and propagates in a slant mode of ductile tearing.Simulation of flat to slant transition was performed inRef. [47] in the case of dynamic crack growth but noattempt was made to compare results with actual tests.The transition was also modelled in Ref. [48] but matchingsimultaneously crack paths and load–displacement curveswas not possible. More recently the flat to slant transitionwas obtained in Ref. [49,50] but comparison with experi-ments was also missing. Due to the difficulties en counteredto model the transition, the crack is also modelled here asbeing flat. Material parameters were adjusted to matchboth load levels and crack lengths. The same solutionwas adopted in Ref. [21] using the Rousselier model [51]and in Ref. [52] using a 3-D cohesive zone model.
The finite strain formulation is described in Appendix Aand the simulation technique is explained in Appendix B.
6. Parameter identification
6.1. Procedure for the naturally aged T351 material
The main material characteristics that are accounted forin the model are: (i) plastic behaviour, consisting of isotro-pic/kinematic hardening and plastic anisotropy; (ii) voidgrowth; and (iii) nucleation of voids.
Fig. 7. Example of a 2-D unit cell mesh for loading in the L (vertical)direction. The anisotropic void shape/pore elongation in L can be seen.
For the description of the plastic behaviour the materialdefects such as initial porosity and void nucleation atcoarse second-phase particles needs to be incorporatedas volume fractions are high enough for the present mate-rial to influence the overall structural behaviour. Thefitting of the parameters associated with each of thesecomponents is conducted in stages. To fit void growthparameters, unit cell calculations will be used as this hasthe advantage of providing physical justification to the fit-ting parameters [53]. In the present identification methodthe void growth parameters will be fitted before fittingthe plastic behaviour using a simplified plastic behaviourthat does not account for plastic anisotropy and kinematichardening. This is justified by the fact that plastic anisot-ropy is fairly weak and kinematic hardening only influ-ences the material behaviour for strains that aresubstantially lower than at coalescence. The parametersfor void sheeting and nucleation of voids on a smallerpopulation of second-phase particles will be identifiedfor tests on Kahn specimens. An overview over the differ-ent steps and parameters of the identification procedure isgiven in Table 4. The procedure is explained in detail inthe following sections.
6.1.1. Identification procedure step 1
2-D axisymmetric unit cell calculations for differentstress triaxialities (0.85, 1.00, 1.25, 1.50) have been carriedout. The stress triaxialities correspond to values found infinite-element analyses of crack propagation in Kahn teartest specimens. The unit cell is a cylinder with a height of2H0 (oriented in the loading direction) and radius R0 (seeFig. 7). Periodic boundary conditions are used. The initialporosity is set at 0.34% (determined via microcomputedtomography) and the initial cell aspect ratio H0/R0 is setequal to the measured mean Feret dimensions ratios forVoronoi cells around pores and particles, which providesH0/R0 = 1. To enhance calculation speed, cell calculations
Table 4Parameter identification procedure for the naturally aged (T3) condition.
Step (1)Void growth parameters: fitting the model to unit cell calculations usi
were carried out on 2-D meshes. Here for every loadingdirection (L, T, S) different axisymmetric 2-D meshes areused to account for the average initial pore Feret dimen-sions in the loading direction obtained from the tomogra-phy data of the as-received material. The cavity isassumed to be a different ellipsoid for each loading direc-tion (L, T, S): only the cavity dimension in the directionin which the loads are applied corresponds to the measuredaverage dimension. The other void dimensions are given bythe geometrical average of the two other Feret dimensions.For instance, for the case of L-direction loading the voidsize is given by (see also Fig. 7):
Rz ¼ l=2
Rx ¼ffiffiffiffitsp
=2ð11Þ
where l, t, s are the measured initial average pore Feretdimensions of the material (see Table 2) and Rz and Rx
ng an automatic optimization procedure
q1
aTT aLL aSS
: (a) Numerical simulation of prestraining by 2% in rolling direction; (b)rameter fitting using an automatic optimization procedure
R0 K1 k1
C D
ci = LL,. . .,SL b
ial and error simulation of Kahn tear tests with the aim to fit the nominal
pcrit L pcrit T
h\
0
0.01
0.02
0.03
0.04
0.05
0.06
0.07
0 0.1 0.2 0.3 0.4 0.5 0.6
volu
me
fract
ion
f
ln(1+ΔH/H0)
τ=1.25L direction MisesT direction MisesS direction MisesL direction; b = 8T direction; b = 8T direction; b = 8
0
0.01
0.02
0.03
0.04
0.05
0.06
0.07
0 0.1 0.2 0.3 0.4 0.5 0.6
volu
me
fract
ion
f
ln(1+ΔH/H0)
τ=1.25L direction; b = 8T direction; b = 8S direction; b = 8GTN L-directionGTN T-directionGTN S-direction
fc at coalescence
(a) (b)
Fig. 8. Results of unit cell calculations for rotation symmetric void cells for different directions at a stress triaxiality of s = 1.25: (a) comparison of unit cellcalculations for b = 4 (von Mises) and b = 8; (b) comparison of unit cell calculations for b = 8 and fitted anisotropic GTN element results (coalescencepoints are indicated by open square symbols) (alloy in T3 condition; b = 8).
Table 5Parameters for the naturally aged (T3) material simulations.
Fig. 9. Results of unit cell calculations of rotation symmetric void cells,critical strains at coalescence for different stress triaxialities and loading inthe L and T directions (alloy in T3 condition; b = 8).
are major and minor axis of the pore ellipse. The initialvoid volume fraction is 0.34% for all calculations. Fig. 8ashows the results of a unit cell calculation in terms of defor-mation and evolution of void volume fraction for a stresstriaxiality of 1.25 for the three loading directions and fordifferent values of b, which is the exponent influencingthe yield surface shape as described in Section 5 (b = 4 cor-responds to the von Mises criterion and b = 8 is closer tothe Tresca criterion). An initial identification of the param-eter b via simulations of EU2 samples and tensile tests onsmooth samples neglecting material softening throughvoids and comparison to experiments lead to b = 8. Valueshigher than 4 are consistent with values given in the litera-ture for Al alloys [2,20]. It can be seen that void growth andcoalescence (abrupt slope change corresponds to coales-cence) occurs at larger deformation for loading in the Ldirection than for loading in the T and S directions(Fig. 8a). This trend is consistent with the anisotropic voidgrowth prediction made by the Gologanu–Leblond–Dev-aux model [22,23]. It can also be seen that the plasticity cri-terion influences the results substantially: void growth andcoalescence occurs faster for the b = 8 setting than for thevon Mises criterion. The parameter identification is per-formed using an optimization algorithm and using an elas-tic–plastic material fitted to L direction tensile test data.Comparison is made for void volume fraction and forceevolution. Fig. 8b shows the results of a calculation witha GTN material element using fitted anisotropy parametersfor the three different directions. For all subsequent calcu-lations the critical void volume fraction fc is set to 4.5%,which represents an average of the values found in unit cellcalculations for different directions and stress triaxilities.The weighting factor d is set to 3.0. The results of the fittingof the parameters q1, aLL, aTT, aSS (see also Eq. (5)) areshown in Table 5.
Fig. 9 shows the critical strains at coalescence obtainedfrom unit cell calculations at different stress triaxalities forthe L and T loading directions. The difference between crit-ical strain for L and T loading are the higher the lower thestress triaxiality. The higher the stress triaxiality, the lowerthe strain at coalescence.
To simulate the prestraining, an ‘‘imaginary” material,whose properties are supposedly close to the real non-pre-strained material, is used which is prestrained in the simu-lation through loading on a volume element by 2% in therolling direction L. Subsequently, the prestrained material,whose parameters are initialized during the prestraining, isused to simulate tensile and EU2 tests in the L and T direc-tions. The simulation results are fitted to the experimentalresults using a simplex optimization algorithm. Parametersfor isotropic hardening, kinematic hardening and plasticanisotropy are identified simultaneously in this optimiza-tion process. Coefficients cLT,TS,SL play a limited role andare assumed to be equal to 1 as the corresponding shearstresses are close to zero. The following law for the isotro-pic hardening is used:
RðpÞ ¼ R0½1þ K1ð1� e�k1pÞ�: ð12ÞThe values for void growth parameters (q1, aLL, aTT,
aSS) obtained in step 1 are used. The nucleation of voidson a first population of coarse second-phase particles istaken into account for parameter fitting. Microtomogra-phy studies on the material have shown that a certain strainis needed until all coarser second-phase particles are frac-tured [41]. To represent this effect A1
n is expressed as:
A1n ¼
A01n
0
for ps 6 p 6 pe
otherwise
(; ð13Þ
where A01n is a constant. Nucleation starts at the beginning
of the deformation (ps = 0) and ends at pe = 10% strain.This means that the entire volume fraction of coarse sec-ond-phase particles (0.4%) is considered to have ‘‘trans-formed” into voids at 10% strain.
6.1.3. Identification procedure step 3Fig. 10 shows the results of a calculation of Kahn tear
tests using the parameters obtained from the first two opti-mization processes. It can be seen that the anisotropic voidgrowth parameters (aLL, aTT, aSS) do cause a toughnessanisotropy in this calculation. It shows that the use of theanisotropic void growth parameters may be an alternative
0
50
100
150
200
0 0.5 1 1.5 2 2.5 3 3.5 4
F/A 0
in M
Pa
CMOD in mm
L-T experimentalT-L experimental
L-T simul. no 2nd pop.; 100 μmT-L simul. no 2nd pop.; 100 μmL-T simul. no 2nd pop.; 50 μmT-L simul. no 2nd pop.; 50 μm
Fig. 10. Simulation of the Kahn tear tests (for alloy in T3 condition)without second nucleation for different mesh sizes (100 and 50 lm elementheight).
to the Gologanu–Leblond–Devaux model [22,23]. It hasbeen suggested in Ref. [42] that the height of the localizationband should be used as the element height. From tomogra-phy data it can be seen that the mesh height used (100 lm)may be a reasonable localization band height.
However, the maximum loads as well as the propagationloads are overestimated for a mesh height of 100 lm. Asshown in Fig. 10 with an element height of 50 lm, thepropagation loads are reduced but still higher than theexperimentally found loads. The simulation carried outhere does not, however, account for shear decohesion orvoid sheeting that have been observed experimentally.
In order to be able to fit the descending curve part of theKahn tear tests it is therefore suggested here to use differentcritical strains for each loading direction at which thenucleation at a small population of second-phase particlesstarts. A2
n controls nucleation of voids at a second popula-tion of smaller second-phase particles leading to coales-cence. For the L and T directions different critical strains(pcrit L, pcrit T) are used:
A2n ¼
A02n
0
for pcriti 6 p
otherwise
(; ð14Þ
A02n has high values so that the material is almost immedi-
ately breaking when the critical strains are reached.Using different critical strains is a simplified method to
represent damage and coalescence anisotropy and may,for example, be justified by an anisotropic distributionand the shape of small second-phase particles, such as dis-persoids (see Fig. 2).
The final parameters found in the optimization andother measured parameters are given in Table 5. They pro-vide mostly excellent fits to the data (see the next section).
6.2. Procedure for the artificially aged (T8) material
The parameter identification for the artificially aged T8material has been carried out similarly to the naturally agedmaterial (see Table 6). However, as the artificially aged mate-rial hardly exhibited any effect of kinematic hardening andplastic anisotropy, these features will not be accounted forin the model. For this reason no prestraining is simulated.
0
50
100
150
200
0 0.5 1 1.5 2 2.5 3 3.5 4
F/A
0 in
MPa
CMOD in mm
Kahn L-T experimentalKahn T-L experimental
Kahn L-T simul.Kahn T-L simul.
Fig. 11. Simulation of the Kahn tear tests for pcrit L = pcrit T = 42%(T3 condition).
Table 6Parameters for simulations of the artificially aged (T8) material.
It has been found that a good EU2 curve fit can only beobtained for b = 12 (close to the Tresca criterion). Forb = 4 (the von Mises criterion) the loads were too high.The following equation is used for isotropic hardening:
RðpÞ ¼ R0½1þ K0p þ K1ð1� e�k1pÞ þ K2ð1� e�k2pÞ�: ð15ÞThe parameters used for the artificially aged material sim-ulations are shown in Table 6.
7. Model predictions
The simulation results for tests on small samples withthe fitted parameters are shown here. Using these parame-ters simulations for tests on large M(T) samples were sub-sequently performed.
7.1. Comparison with data for small specimens and M(T)
specimens
Figs. 3 and 4 show the simulation and experimentalresults for tensile and Kahn tear testing for the two testingdirections and the different heat treatment conditions. Agood fit is achieved for the tensile curves (see Fig. 3). TheEU2 curves (not presented here) are well predicted for mostof the test, but the samples break earlier in the simulationsas compared to the experiments, a discrepancy that may bedue to the fitting of fracture parameters at higher stresstriaxility. The Kahn tear test curves (Fig. 4) are well fittedfor the T–L naturally aged and T–L artificially aged mate-rials. The loads obtained from the M(T) simulation of thenaturally aged T–L sample are only slightly above theexperimental results (see Fig. 5a). The overall predictionis good. Whilst the artificially aged T–L sample loads areslightly overestimated in the simulation, the maximum loadratio between L–T and T–L testing is well represented. Thegood results of the simulations carried out for M(T) samples
(see Fig. 5) provide an independent validation of the model’spredictive capabilities (this data has not been used forparameter identification), and thus shows that this methodof accounting for toughness anisotropy may representtoughness anisotropy on samples of very different sizes.
7.2. Parametric study on the naturally aged (T3) material:
study with the same critical strain (for pcrit L = pcrit T) forboth loading configurations
Fig. 11 shows a simulation for the naturally aged materialwhere the same critical strains for the T–L and L–T direc-tions are applied for the second-stage nucleation of voidsat small particles. It can be seen that only the first part ofthe curves is slightly different due to the kinematic hardeningand plastic anisotropy. This is consistent with the idea that inthis part of the loading the material behaviour is mainly gov-erned by plastic properties. It can be seen that from maxi-mum load onwards the two curves almost superpose. Thisimplies that neither kinematic hardening nor plastic anisot-ropy are the main cause of the toughness anisotropy. Thissimulation also shows that the anisotropic growth parame-ters (aLL, aTT, aSS) have a minor effect in this simulation,and that they cannot explain the toughness anisotropy. Unitcell calculations show that coalescence through impinge-ment occurs at substantially higher strains than the strains(pc) at which the second-stage nucleation of voids starts,especially at lower stress triaxialities, so that the influenceof the anisotropic void growth parameters (aLL, aTT, aSS) isreduced through this second-stage nucleation of voids (alsosee Fig. 9).
8. Discussion
In a previous finite-element study Pardoen and Hutchison[26] have linked anisotropic shape of initial voids to frac-
ture toughness anisotropy (JIC). In Ref. [10] a comparisonbetween these results and the results on the AA2139 alloyin T8 condition has been made in terms of initial voidaspect ratio and toughness anisotropy, in terms of unit ini-tiation energies, at a high level of stress triaxiality. Despitethe model simplifications a similar trend in toughnessanisotropy has been found for similar initial void volumefractions, consistent with the initial anisotropic void shapecontrolling the fracture toughness anisotropy.
The present SRCT results provide new insights into frac-ture mechanisms in the crack initiation region at high stresstriaxiality, indicating that coalescence mechanisms involvingnucleation at a second population of small second-phaseparticles may play a role in this stress state. The model pre-sented here can reproduce a similar influence of anisotropicinitial void shape on fracture toughness anisotropy as themodel of Pardoen and Hutchinson [26] when neglectingnucleation at small particles. However, it is found that forreproducing actual (absolute) toughness values and the loadevolution at lower levels of stress triaxiality, an anisotropicnucleation process at the small second-phase particle popu-lation must be included in the model. Thus the present mod-elling indicates that initial void shape anisotropy may not bethe only reason for toughness anisotropy and that aniso-tropic coalescence mechanisms involving a small populationof second-phase particles, such as dispersoids [54,55], thatdisplay anisotropic morphologies and distributions (seeFig. 2) could substantially contribute to toughness anisot-ropy. The necessity to introduce different nucleation strainsfor different directions may also be linked to the distributionof initial porosity and coarse intermetallic particles: the mea-surement of the mean aspect ratio of Feret dimensions ofVoronoi cells around particles and pores provided a valueclose to one for our material. However, stringers of poresand second-phase particles were observed (see Section 3.1).The heterogeneous distribution of pores and particles maybe at the origin of the apparently average isotropic poreand particle distribution measurement. It has been identifiedthat clustering and alignment of pores and particles in thecrack propagation region [7,56] can reduce toughness, andTL orientation tests in the present work clearly showed pref-erential crack advance along individual particle chains(‘‘tongues” appearing at the crack front, as shown inFig. 6a and b, and also in Ref. [10]). For a better understand-ing of ductile fracture anisotropy, additional experimentalinvestigation and modelling of pore and particle stringers,and the corresponding percolation of damage though sucha heterogeneous structure, may be expected to provide valu-able future insights. It is also worth noting that modelling ofslant fracture has not been attempted in the present studyand the use of the Lode parameter as suggested in Ref.[49,57] should be considered to address this issue.
9. Conclusions
Mechanical tests on smooth and notched specimens ofdifferent sizes have been carried out in two loading directions
for T351 and T8 heat-treated materials. The T351 materialdisplays isotropic and kinematic hardening, and some plasticanisotropy also plays a role. The T8 material is plasticallyisotropic. Fractography of Kahn samples has revealed frac-ture mechanisms linked to coarse voiding and shear decohe-sion, especially in the propagation region. Some alignment ofdimple stringers is prevalent on the T–L sample fracture sur-faces in the rolling direction. SRCT studies of arrested cracksin the crack initiation region have revealed the unexpectedpresence of coalescence through narrow regions that canbe linked to void nucleation at a small population of sec-ond-phase particles. Anisotropic initial void shape has beenidentified through SRCT studies of the as-received material.No significant anisotropic average distribution of pores andparticles could be measured using Feret dimensions aroundVoronoi cells. Dispersoid particles are elongated in the Ldirection of the material.
A model based on the GTN approach has been devel-oped incorporating: (i) anisotropic initial void shape andgrowth; (ii) plastic behaviour, including isotropic/kine-matic hardening and plastic anisotropy; and (iii) nucleationat a second population of second-phase particles leading tocoalescence via narrow crack regions.
For the first time a model for kinematic hardeningaccounting for ductile damage has been successfully applied.A new simple method to account for initially anisotropicvoid shape and growth is suggested that is easier to imple-ment than other approaches and is not restricted to axisym-metric cavities. Parameters have been fitted on mechanicaltesting results of small samples. It has been found that nei-ther kinematic hardening nor anisotropic void shape canfully describe the fracture toughness anisotropy. It is pro-posed to account for coalescence and nucleation at a secondpopulation of small second-phase particles via nucleation atdifferent critical strains for the different material directionswhich may be linked to the anisotropic shape and/or distri-bution of small second-phase particles such as dispersoids.
Simulation of fracture of large M(T) samples usingparameters obtained by fitting on small sample tests showsthe good predictive capabilities of the model; the fracturetoughness anisotropy on these M(T) panels is correctly pre-dicted. The effect of prestrain and plastic anisotropy is rel-atively weak for the present material. However, it may beimportant to use these model features to describe thebehaviour of other materials (e.g. steel X100).
Acknowledgements
The authors would like to acknowledge Alcan CRV forfinancial support and material supply, and Frederic Bronand Bernard Bes for technical discussion.
Appendix A. Finite-strain formulation
Ductile rupture is always accompanied by largedeformations so that a finite-strain formalism must beused when implementing constitutive equations. Specific
implementations using the finite strain formalism proposedby Simo [58] and Simo and Miehe [59] have been used byMahnken [60] and Reusch et al. [61]. A computationallymore efficient treatment of finite strain may be obtainedusing generic formulations based on reference frames whichfacilitate keeping the standard small strain formulation, i.e.using an additive strain decomposition (_e ¼ _ee þ _ep) [62].Invariant stress and strain rate measures s and _e are definedby transport of the Cauchy stress r and the deformation ratetensor rate D into the co-rotational reference frame which ischaracterized by the rotation Qc : s ¼ Qc � r � QT
c and_e ¼ Qc � D � QT
c . The evolution law for Qc is expressed as:
_Qc ¼ X:Qc with _Qcðt ¼ 0Þ ¼ 1; ð16Þ
where D and X are, respectively, the symmetric and theskew-symmetric parts of the velocity field gradient. Thecorresponding objective stress rate is the Jaumann rate.
Appendix B. Simulation technique
The modified GTN model was implemented in the finite-element software Zebulon, developed at Ecole des Mines deParis [63,64]. Similar meshes as in Ref. [21] have been used.An implicit scheme is used to integrate the constitutiveequations. The consistent tangent matrix is computed usingthe method proposed in Ref. [65]. The material is consid-ered as broken when f* reaches 1/q1. In that case, the mate-rial behaviour is replaced by an elastic behaviour with avery low stiffness (Young’s modulus: Eb = 1 MPa). A sim-ilar technique was used in Ref. [63] showing convergence ofthe results for sufficiently low values of the Young’s mod-ulus Eb. Gauss points where these conditions are met arereferred to as ‘‘broken Gauss points”. Calculations weredone using 3-D brick linear elements with full integrationusing a B-bar method to control volume change in each ele-ment [66]. When all Gauss points in an element are ‘‘bro-ken”, the element is removed from the calculation.Convergence in terms of macroscopic load and local dam-age growth was checked as proposed in Ref. [59]. Usualsymmetry conditions are accounted for in order to reducethe size of the calculations.
References
[1] Cailletaud G. Int J Plasticity 1992;8:55–73.[2] Bron F, Besson J. Int J Plasticity 2004;20:937–63.[3] Rivalin F, Besson J, Pineau A, Di Fant M. Eng Fract Mech
2000;68:347–64.[4] Tanguy B, Luu TT, Perrin G, Pineau A, Besson J. Int J Press Vess Pip
2008;85:322–35.[5] Benzerga A, Besson J, Batisse R, Pineau A. Modell Sim Mater Sci
Eng 2002;10:73–102.[6] Steglich D, Brocks W, Heerens J, Pardoen T. Eng Fract Mech
2008;75:3692–706.[7] Dumont D, Deschamps A, Brechet Y. Mater Sci Eng A 2003;A356:
326–36.[8] Benzerga A, Besson J, Pineau A. J Eng Mater Technol 1999;121:
221–9.[9] Benzerga AA, Besson J, Pineau A. Acta Mater 2004;52:4623–38.
[10] Morgeneyer TF, Starink MJ, Sinclair I. Acta Mater 2008;56:1671–9.[11] Enami K. Eng Fract Mech 2005;72:1089–105.[12] Gurson AL. J Eng Mater Technol 1977;99:2–15.[13] Tvergaard V, Needleman A. Acta Metall 1984;32:157–69.[14] Lemaitre J, Desmorat R, Sauzay M. Eur J Mech 2000;19A:187–208.[15] Hammi Y, Horstemeyer MF. Int J Plasticity 2007;23:1641–78.[16] Hill R. The mathematical theory of plasticity. Oxford: Clarendon
Press; 1950.[17] Benzerga AA, Besson J. Eur J Mech 2001;20A:397–434.[18] Brunet M, Morestin F, Walter-Leberre H. J Mater Process Technol
2005;170:457–70.[19] Karafillis AP, Boyce MC. J Mech Phys Solids 1993;41:1859–86.[20] Barlat F, Lege DJ, Brem JC. Int J Plasticity 1991;7:693–712.[21] Bron F, Besson J. Eng Fract Mech 2006;73:1531–52.[22] Gologanu M, Leblond J, Devaux J. J Mech Phys Solids 1993;41:
1723–54.[23] Gologanu M, Leblond JB, Devaux J. J Eng Mater Technol
1994;116:290–7.[24] Gologanu M, Leblond JB, Perrin G, Devaux J. Int J Solids Struct
2467–512.[26] Pardoen T, Hutchinson JW. Acta Mater 2003;51:133–48.[27] Thomason PF. Acta Metall 1985;33:1079–85.[28] Benzerga AA, Besson J, Pineau A. Acta Mater 2004;52:4639–50.[29] Mear ME, Hutchinson JW. Mech Mater 1985;4:395–407.[30] Ristinmaa M. Mech Mater 1997;26:227–45.[31] Besson J, Guillemer-Neel C. Mech Mater 2003;35:1–18.[32] Garrison WM, Moody NR. J Phys Chem Solids 1987;48:1035–74.[33] Bron F, Besson J, Pineau A. Mater Sci Eng A 2004;A 380:356–64.[34] ASTM E561-98; 1999.[35] Toda H, Sinclair I, Buffiere J-Y, et al. Philos Mag 2003;83:2429–40.[36] Yang N, Boselli J, Sinclair I. J Microsc 2001;201:189–200.[37] ASTM B 871-01; 2001.[38] Morgeneyer TF, Starink MJ, Wang SC, Sinclair I. Acta Mater
2008;56:2872–84.[39] Chu C, Needleman A. Eng Mater Technol 1980;102:249–56.[40] Lemaitre J, Chaboche JL. Mechanics of solid materials. Cam-
bridge: Cambridge University Press; 1990.[41] Rousselier G. Nucl Eng Des 1987;105:97–111.[42] Gullerud AS, Gao X, Dodds RH, Haj-Ali R. Eng Fract Mech
2000;66:65–92.[43] Ruggieri C, Panontin T, Dodds R. Int J Fract 1996;82:67–95.[44] Enakoutsa K, Leblond JB, Perrin G. Comput Methods Appl Mech
Eng 2007;196:1946–57.[45] Mediavilla J, Peerlings RHJ, Geers MGD. Int J Numer Meth Eng
2006;66:661–88.[46] Siegmund T, Brocks W. Int J Fract 1999;99:97–116.[47] Mathur KK, Needleman A, Tvergaard V. J Mech Phys Solids
1996;44:439–59.[48] Besson J, Brocks W, Chabanet O, Steglich D. Eur J Finite Elem
2001;10:401–15.[49] Xue L. Int J Solids Struct 2007;44:5163–81.[50] Xue L, Wierzbicki T. Eng Fract Mech 2007;75:3276–93.[51] Rousselier G. In: Continuous damage and fracture; 2000. p. 293–303.[52] Roychowdhury S, Roy YDA, Dodds RH. Eng Fract Mech
2002;69:983–1002.[53] Faleskog J, Gao X, Shih CF. Int J Fract 1998;89:355–73.[54] Broek D. Eng Fract Mech 1973;5:55–66.[55] Van Stone RH, Merchant RH, Low JR. ASTM STP, vol. 556; 1974.
p. 93–124.[56] Decamp K, Bauvineau L, Besson J, Pineau A. Int J Fract 1997;88:
1–18.[57] Nahshon K, Hutchinson JW. Eur J Mech 2008;27A:1–17.[58] Simo JC. Comput Method Appl Mech Eng 1992;99:61–112.[59] Simo JC, Miehe C. Comput Method Appl Mech Eng 1992;98:
41–104.[60] Mahnken R. Int J Plasticity 1999;15:1111–37.