Experimental and numerical investigation of boiling flow in a vertical pipe with phase change using a multi-fluid modelling approach
R. Kopun1 & L. Škerget2 1AVL-AST d.o.o., Maribor, Slovenia 2Faculty of Mechanical Engineering, University of Maribor, Slovenia
Abstract
Multi-phase boiling flow inside a vertical pipe is simulated as part of a preliminary study of the heat transfer characteristics of coolant flow inside water cooling jackets in IC engines. Based on increasing demands for higher efficiency inside the engine cooling block, heat transfer plays an important role in a conceptual and thermal analysis used to provide efficient cooling. The simulations of thermal and flow phase change characteristics inside a vertical pipe boiling system were made to prevent component failure and to create a uniform temperature distribution inside the water cooling jacket. The developed boiling mass transfer model, such as the BDL (Boiling Departure Lift-off) model, has empirically correlated heat transfer coefficients and is implemented within the commercial computational fluid dynamics code AVL FIRE®. Governing equations are based on the Eulerian multi-fluid approach which treats each phase as interpenetrating continua coexisting in the flow domain, with inter-phase transfer terms accounting for phase interactions. Turbulence is modelled by using an advanced - - model. In this paper, we focus on comparison and suitability of the mentioned boiling model with two different boundary condition approaches to determine the HTC (heat transfer coefficient) for multi-phase boiling flow inside the vertical pipe. Temperature measurements along the height of the pipe were performed at three different positions. Comparison with the available experimental data for different boundary conditions is presented. Simulation results exhibit good agreement with the experimental data. Keywords: multiphase flow, boiling, vertical pipe, HTC, CFD, IC engines.
Detailed knowledge of flow and heat transfer analysis is essential in order to achieve a controlled boiling over a wide range of working conditions. Heat transfer applications such as those introduced in automotive industries often play an important role in conceptual and thermal analysis of cooling system (Dong et al. [1]). Vapour bubbles usually start growing in superheated zones near the walls and are normally able to condense harmlessly back into the cooler liquid, but under certain conditions (flow geometry, fluid conditions, est.) Transition from nucleate to film boiling regime occurs. That kind of behaviour dramatically reduces heat transfer rate which leads to large rise (upturn) of component temperature and contributes to the failure of the device. Hence, efficient cooling is essential to prevent component failure and provide even temperature distribution. This leads to reduction of thermal stresses and higher durability and has consequently influence on power requirements (Campbell et al. [2]). Modelling of flow boiling heat transfer usually relies on the empirical approaches. It is based on the superposition of convective and boiling components, as first suggested by Rohsenow, i.e. represented by simple addition of the nucleate and convective coefficient. This approach was afterwards extended by Chen (Steiner and Taborek [3]). In recent years many new approaches and correlations have been proposed. One of them is the newly developed model for mass transfer function based on the assumption that the mass transfer parameters are proportional to the heat transfer coefficient from the fluid system as proposed by Srinivasan and Wang [4]. The model has already been successfully implemented and applied to the quenching boiling heat transfer process showing significant improvement as reported by Wang et al. [5]. Heat transfer of coolant flows inside water cooling jacket often involves a phase change which can be simulated, as a preliminary study, with the horizontal and the vertical pipe for easier explanation of flow characteristics. Recently, Srinivasan [6] has developed the new mass transfer model to simulate thermal and phase change characteristics for binary mixture during flow boiling process inside a horizontal channel. Good agreements of numerical predictions with experiments are presented and the applicability of developed model shows that it can be easily extended to automotive applications. In this work we simulate the multi-phase boiling flow inside a vertical pipe with commercial CFD code AVL FIRE. A brief overview of the governing equations of the newly developed mass transfer model is described first. Boundary conditions, numerical setups and simulation results are presented and compared with the available experimental values. Results are discussed and summarized in the concluding.
2 Numerical background
Eulerian multi-fluid methods consider each phase as interpenetrating continua coexisting in the flow domain, with inter-phase transfer terms accounting for
phase interactions where conservation laws apply. From the theoretical work of Lahey and Drew [7] the averaged continuity and momentum equations are presented as follows:
2.1 Continuity
∙ Γ,
1,… ,
(1)
where , and v stand for volume fraction, density and velocity. Phase change rate (in this particular case, boiling) is Γ and the subscript is a phase indicator ( or ).
2.2 Momentum
v Γ
(2)
while , and v are respectively the pressure, stress and interfacial velocity. Interfacial momentum transfer term with the drag is being the most important force and due to boiling initiated along the solid and liquid interface, mass interfacial exchange occurs. Interfacial momentum exchange term is given as:
18
| |
(3)
where is the drag coefficient, is the interfacial area density and
is the relative velocity. Subscripts and denote the continuous and dispersed phases of the given flow. Drag of coefficient is defined as
241 0.15 .
0.438
1000
1000
v
(4)
Presented model does not account for the turbulence dispersion force on the momentum interface. In the framework of the two-fluid model, an individual energy equation is be solved for each phase, where it is assumed that two phases are in thermal equilibrium, because the heat transfer rate between vapour and liquid phase is relatively rapid. Further details concerning modelling interfacial mass exchange can be obtained from AVL FIRE Multi-fluid model, solver theory guide [8].
2.3 Energy
An advanced - - model developed by Hanjalic et al. [9] was implemented inside the code to model the effects of turbulence within the multiphase system.
enthalpy volumetric flow is denoted as with , energy interfacial exchange between phases and is denoted as and , and represent volume fraction, dynamics viscosity and conductivity, respectively heat flux is given by
,
(7)
where , is the mixture specific heat. Eqn. for turbulent kinetic energy and dissipation rate are given by
,
Γ,
(8)
,
Γ,
v
(9)
further details about turbulence modelling and poly-dispersed bubble flow equations can be obtained from AVL FIRE Multi-fluid model, solver theory guide [8].
2.4 Boiling model
Based on the assumption that the heat transfer rate is proportional with the phase change rate, since the mass transfer predominantly controls heat transfer, the phase change rate due to boiling process can be written as
where , , and are the closure coefficient, the boiling correction coefficient, the boiling heat transfer coefficient and the latent heat of vaporization, respectively. Wall superheat temperature ∆ , the interfacial area density and the closure coefficient used to correct the interfacial area density in eqn. (10) are defined by
∆
6 1
(11)
with being the dispersed dry phase packing limit and being the minimum volume fraction. The boiling correction coefficient is imposed to correlate nature of boiling process such as film, partial nucleate, transition boiling model etc. The heat transfer coefficient in the eqn. (10) is used for computing the mass transfer exchange rates and assumes the computed value of boiling heat transfer coefficient for different boiling regimes. Heat transfer coefficient for binary mixture is evaluated with the Chen correlation [10] as
∙ (12) where the microscopic heat transfer coefficient is modelled as
0.00122. ∙ . ∙ .
. ∙ . ∙ . ∙ ..
∙ .
(13)
From eqn. (13) parameters like , , , , , , , ,
refer to liquid thermal conductivity, liquid specific heat at constant pressure, surface tension, liquid dynamics viscosity, latent heat of vaporization, wall temperature, bubble point temperature, saturation pressure at and saturation pressure at . Recent modification of the Chen model were made by Steiner et al. [11] with combination of Zeng et al. [12] and the model was fully implemented into FIRE as the BDL model. The main difference between the two models is in determination of suppression factor where the Chen model cannot take local fluid state into account as a function of a reference Reynolds number of the global geometry. The BDL model is a recent improvement in which the suppression factor is computed from local velocity and length scales. The boiling suppression factor used in eqn. (12) is decomposed in two parts as
where the first suppression faction is based on study of bubble dynamics and growth and the second suppression factor correlates correction to the defined heat transfer coefficient modelled in eqn. (14) as
∙1 ∙
(15)
The departure diameters and lift-off diameters in eqn. (18) are calculated as a function of local velocity and differences in saturation to local cell temperature, where and in eqn. (19) stand for local coefficient and Nusselt number. Detailed information about parameters can be found in AVL FIRE Multi-fluid model, solver theory guide [8].
3 Experimental and numerical simulation set up
The present study consists of the experimental and numerical investigation on the vertical pipe boiling case. The experimental setup is schematically demonstrated in Fig. 1.
Figure 1: Schematic of vertical pipe experimental cross-section in z-direction.
The total length of the pipe is 1.9 m with the outer diameter of 0.03 m. Heated section, length of 1.5 m with the inner diameter of 0.012 m, has a measured constant heat flux of 44139 W/m2. At the inlet and outlet there are small parts of the pipe with length of 0.2 m which are blind, i.e. not exposed to heat flux. There are three thermo-sensors known as IEC 584, tip-K with working temperature ranged from 200 to 800 with measurement deviations of 1.5 or 0.004 ∙ | |. Thermo-sensors , and are placed on three
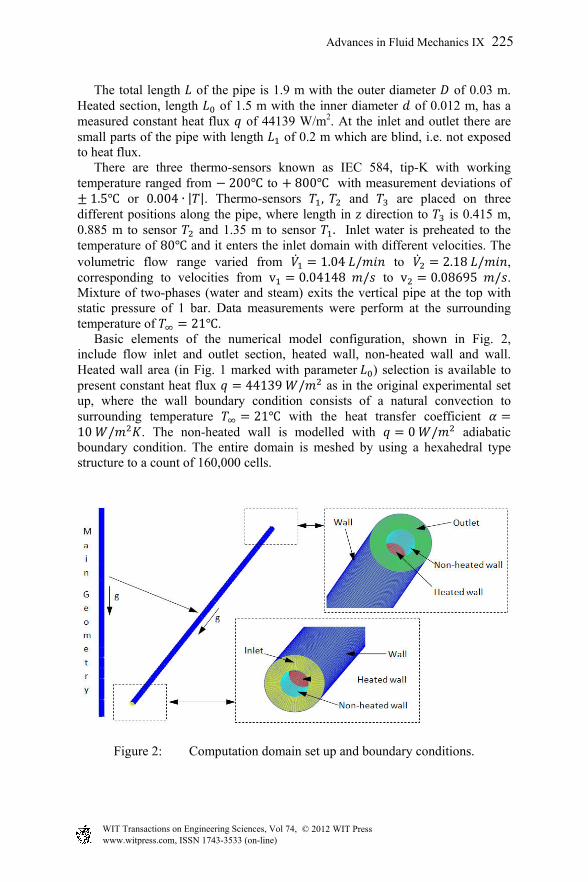
different positions along the pipe, where length in z direction to is 0.415 m, 0.885 m to sensor and 1.35 m to sensor . Inlet water is preheated to the temperature of 80 and it enters the inlet domain with different velocities. The volumetric flow range varied from 1.04 / to 2.18 / , corresponding to velocities from v 0.04148 / to v 0.08695 / . Mixture of two-phases (water and steam) exits the vertical pipe at the top with static pressure of 1 bar. Data measurements were perform at the surrounding temperature of 21 . Basic elements of the numerical model configuration, shown in Fig. 2, include flow inlet and outlet section, heated wall, non-heated wall and wall. Heated wall area (in Fig. 1 marked with parameter ) selection is available to present constant heat flux 44139 / as in the original experimental set up, where the wall boundary condition consists of a natural convection to surrounding temperature 21 with the heat transfer coefficient 10 / . The non-heated wall is modelled with 0 / adiabatic boundary condition. The entire domain is meshed by using a hexahedral type structure to a count of 160,000 cells.
Figure 2: Computation domain set up and boundary conditions.
At the pipe inlet the fluid velocity is set only for z-direction (in our case in the liquid flow direction) with different velocities v and v with preheated water to 80 as it is described in the experimental set up. The minimum volume fraction admissible for each phase in the entire domain is set to 1 ∙ 10 and phase one stands for water and phase two is vapour. Transient simulations with different time steps are conducted to compare with the experiment which lasted for 100 sec. The numerical simulations were performed with the commercial CFD code AVL FIRE® v2010.1 in which the Finite Volume approach was used to solve governing equations and where numerical solution procedure was based on SIMPLE algorithm extended for a multiphase flow case. The normalized residual limit for mass, momentum, and volume fraction were set to2 ∙ 10 , while the turbulence was allowed to drop until it reaches1 ∙ 10 , where the energy relaxation was extended to the value of1 ∙ 10 . Turbulence was modelled with an advanced - - model, where homogeneous turbulence interface exchange between different phases was used.
a) b)
Figure 3: Contour plots of liquid volume fraction at inlet velocity v0.04148 / with experiment for different times, a) t 1 and b) t 100 with zoom area of the thermocouples , and .
The 3D results presented in the following section focus around the monitoring points , and for easier visualization purpose and to observe the flow variable and physic effects on details between numerical and experimental results. The effect of constant heat flux on the growth and propagation of volume fraction, for a given inlet velocity condition v 0.04148 / , can be identified from Fig. 3. It can be seen that after t 1 (Fig. 3a) no vapour bubble is generated because the heat flux produces a temperature that is lower than the saturation temperature. By a close look at the experimental results in Fig. 3a, it is observed that there is also no vapour bubbles generated, whereas at the time t 100 (Fig. 3b) vapour bubbles are initiated in the heated wall area section and develops to the upstream of the tube. Good agreement between experimental and numerical results can be observed in Figs. 3a and b. From the Fig. 3b at t 100 of heating time, it can be seen that heavy boiling occurs in area by zooming thermocouples , and
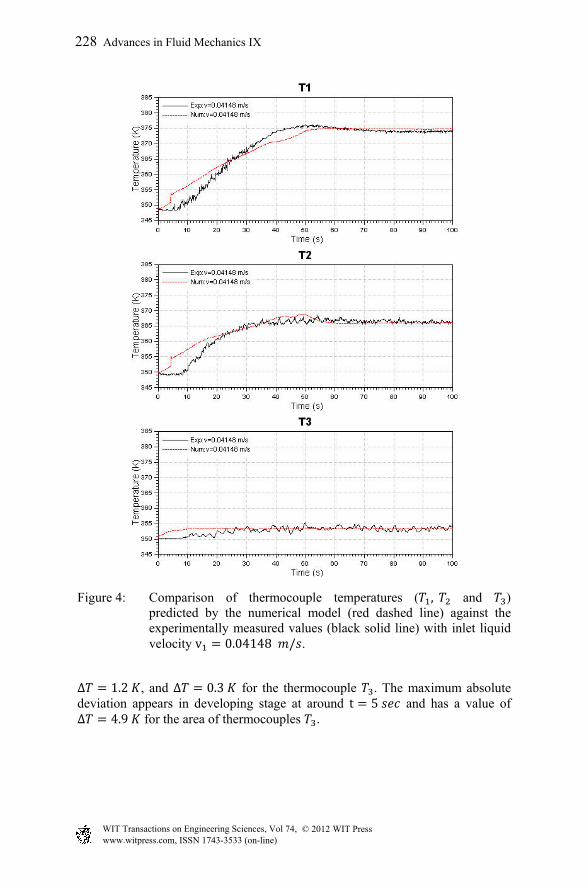
areas. It is found that the temperature has almost reached the saturation temperature in the area of as some bubbles can be observed in the heated area, whereas in the area no vapour bubbles are observed which implies that the temperature at this height is lower than the saturation temperature. Similar results were generated with other inlet velocity conditions (v 0.08695 / ). The results are not presented here. Detailed comparison of experimentally measured temperatures and the corresponding simulated ones for two different inlet velocity cases (v0.04148 / and v 0.08695 / ) on 3 different positions along the height of the pipe are displayed in Figs 4 and 5. Fluctuations of the experimental values appearing in Figs. 4 and 5 could be partly caused by noise during the measurement as expected. At the lower inlet velocity (v 0.04148 / ), Fig. 4 shows the deviation in temperature predicted by the model against the measured values, noted for all 3 positions along the height of the pipe in transition area, between the beginning and before calculation reaches a steady state. In general, the model captures the trend of the experimental temperature histories. It can be seen that when calculation reaches a steady state (t 100 ), for the position of thermocouple
, it has just the absolute deviation of ∆ 0.8 from the experiment, and deviations of ∆ 0.2 and ∆ 0.5 for the thermocouples and , respectively. The maximum deviation for thermocouple is ∆ 5.7 at around t 5sec, whereas the deviation for the thermocouple is ∆ 5.9 . Similar results are obtained also with higher velocity (v 0.08695m/s, see Fig. 5), where the difference between the measured and simulated values are presented at the same positions along the height of the pipe. Good agreement is obtained in this case. The maximum deviation reaches ∆ 3.5 at t=100 s (relative deviation of 1%) in the area of thermocouple . When the calculation reaches a steady state in the area of thermocouple , the absolute deviation is
Figure 4: Comparison of thermocouple temperatures ( , and ) predicted by the numerical model (red dashed line) against the experimentally measured values (black solid line) with inlet liquid velocity v 0.04148 / .
∆ 1.2 , and ∆ 0.3 for the thermocouple . The maximum absolute deviation appears in developing stage at around t 5 and has a value of ∆ 4.9 for the area of thermocouples .
Figure 5: Comparison of thermocouple temperatures ( , and ) predicted by the numerical model (red dashed line) against the experimentally measured values (black solid line) with inlet liquid velocity v 0.08695 / .
5 Conclusion
A new BDL model based on the multi-fluid modelling approach implemented within the commercial CFD code AVL FIRE® is capable of predicting boiling under different conditions in a vertical pipe. It can be concluded that all numerical results show a good agreement with the available experimental data. While better trends and lower deviations were observed for lower inlet velocities, higher inlet velocities can have a maximum relative deviation of 1.4% during the whole boiling process. In the current contest all calculations were performed
with the advanced - - turbulent model, but the forthcoming work will perform present simulation with the variety of turbulence models and different inlet velocities to identify flow pattern predictions. Comparison of the vapour size and volume fraction with measurements will be performed. The computational method and workflow discussed in this article are capable of reporting the temperature values in combination with phase characteristics in the flow domain and can be used as a preliminary study of heat transfer characteristics of coolant flow inside water cooling jackets in internal combustion engines.
References
[1] Dong F., Fan Q., Cai Y., Jiang S., Guo C., Norihiko W., Lee W.T., Numerical simulation of boiling heat transfer in water jacket of DI engine, SAE International, 2010.
[2] Campbell N.A.F., Charlton S.J., Wong L., Designing towards nucleate boiling in combustion engines, IMechE C496/092, 1995, pp. 587-595.
[3] Steiner D., Taborek J., Flow boiling heat transfer in vertical tubes correlated by an asymptotic model, Heat Transfer Engineering, Vol. 13, No.2, 1992, pp. 43-69.
[4] Srinivasan V., Wang D.M., Modelling and simulation of the heat and mass transfer characteristics of binary mixtures for boiling flow applications, J. ASTM international, Vol.8, No.2, 2011, pp. 1-22.
[5] Wang D.M., Alajbegovič A., Su X.M., Jan J., Numerical simulation of water quenching process of an engine cylinder head, Proceedings of ASME FEDSM 2003, 4th ASME JSME Joint Fluids Engineering Conference, Honolulu, Hawaii, USA, July 6-10, 2003.
[6] Srinivasan V., Numerical simulation of flow boiling of binary mixtures using multi-fluid modelling approach, ASME international Mechanical Engineering Congress and Exposition, Colorado, 2011, pp. 1-12.
[7] Lahey R.T.Jr., Drew D.A., An Analysis of Two-Phase Flow and Heat Transfer Using a Multidimensional, Multi-Field, Two-Fluid Computational Fluid Dynamics (CFD) Model, Japan/US Seminar on Two-Phase Flow Dynamics, Santa Barbara, California, 2000.
[8] AVL LIST GmbH, FIRE CFD Solver, Eulerian Multi-fluid model. Solver Theory Guide. 2010, Graz, Austria.
[9] Hanjalic K., Popovac M., Hadziabodic M., A robust near-wall elliptic-relaxation eddy-viscosity turbulence model CFD, Int. J. Heat and Fluid Flow, 25, 2004, pp. 1047-1051.
[10] Chen J.C., Correlations for boiling heat transfer to saturated liquids in convective flow, I&EC Process Design and Development, Vol.5, No.3, 1966, pp. 322-329.
[11] Steiner H., Kobor A., Gebhard L., A wall heat transfer model for subcooled boiling flow, Int. J. Heat and Mass Transfer, vol.48, 2005, pp. 4161-4173.
[12] Zeng L.Z., Klausner J.F., Bernhard D.M., Mei R. A unified model for the prediction of bubble detachment diameters in boiling systems-II. Flow boiling, Int. J. Heat Mass, Vol. 36, No.9, 1993, pp. 2271-2279.


![Flow boiling heat transfer of HFO1234yf and HFC32 ... boiling heat transfer of... · boiling heat transfer coefficient is calculated from the pool boiling correlation of Cooper [7].](https://static.documents.pub/doc/80x56/6060f16e796df51c036c4972/flow-boiling-heat-transfer-of-hfo1234yf-and-hfc32-boiling-heat-transfer-of.jpg)

