Experimental and Numerical Study of the Key Non-Dimensional Geometrical Parameters on the Noise Level of Dry-Type Cast Resin Transformers Mahdi Soltanmohammadi 1 and Vahid Monfared 2,* 1 Department of Technical Office, Iran Transfo Co., Zanjan, Iran 2 Young Researchers and Elite Club, Zanjan Branch, Islamic Azad University, Zanjan, Iran *Corresponding Author: Vahid Monfared. Email: [email protected]. Abstract: Dry-Type Cast Resin Distribution Transformers (CRT) is the second- generation of air-cooled distribution transformers where oil is replaced by resin for electrical insulation. CRT transformers may installed indoor adjacent to or near residential areas since they are clean and safe comparing to the conventional transformers. But, as it is obvious, noise discrepancy is intrinsically accompanied with all types of transformers and is inevitable for CRT transformers too. Minimi- zation of noise level caused by such these transformers has biological and ergo- nomic importance. As it is known the core of transformers is the main source of the noise generation. In this paper, experimental and numerical investigation is implemented for a large number of fabricated CRT transformers in IT Co (Iran Transfo Company) to evaluate the effective geometrical parameters of the core on the overall sound level of transformers. Noise Level of each sample is mea- sured according to criteria of IEC60651 and is reported in units of Decibel (dB). Numerical simulation is done using noncommercial version of ANSYS Workbench software to extract first six natural frequencies and mode shapes of CRT cores which is reported in units of Hz. Three novel non-dimensional vari- ables for geometry of the transformer core are introduced. Both experimental and numerical results show approximately similar response to these variables. Correlation between natural frequencies and noise level is evaluated statistically. Pearson factor shows that there is a robust conjunction between first two natural frequencies and noise level of CRTs. Results show that noise level decreases as the two first natural frequencies increases and vice versa, noise level increases as the two natural frequencies of the core decreases. Finally the noise level decomposed to two parts. Keywords: Experimental; FEM; mean noise level; CRT transformers; IEC60651 1 Introduction Cast resin transformers (CRT) are the most attractive type of transformers in the field of distribution systems all over the world. These types of transformers are installed near residential areas since they are clean and safe in contrast to the common oil transformers. Despite of all benefits of these transformers, restriction of the noise in a standard level is a hot topic in debate. According to the literature the SV. doi:10.32604/sv.2019.05811 www.techscience.com/sv Sound & Vibration ech T Press Science
Transcript
Experimental and Numerical Study of the Key Non-Dimensional GeometricalParameters on the Noise Level of Dry-Type Cast Resin Transformers
Mahdi Soltanmohammadi1 and Vahid Monfared2,*
1Department of Technical Office, Iran Transfo Co., Zanjan, Iran2Young Researchers and Elite Club, Zanjan Branch, Islamic Azad University, Zanjan, Iran*Corresponding Author: Vahid Monfared. Email: [email protected].
Abstract: Dry-Type Cast Resin Distribution Transformers (CRT) is the second-generation of air-cooled distribution transformers where oil is replaced by resinfor electrical insulation. CRT transformers may installed indoor adjacent to ornear residential areas since they are clean and safe comparing to the conventionaltransformers. But, as it is obvious, noise discrepancy is intrinsically accompaniedwith all types of transformers and is inevitable for CRT transformers too. Minimi-zation of noise level caused by such these transformers has biological and ergo-nomic importance. As it is known the core of transformers is the main source ofthe noise generation. In this paper, experimental and numerical investigation isimplemented for a large number of fabricated CRT transformers in IT Co (IranTransfo Company) to evaluate the effective geometrical parameters of the coreon the overall sound level of transformers. Noise Level of each sample is mea-sured according to criteria of IEC60651 and is reported in units of Decibel(dB). Numerical simulation is done using noncommercial version of ANSYSWorkbench software to extract first six natural frequencies and mode shapes ofCRT cores which is reported in units of Hz. Three novel non-dimensional vari-ables for geometry of the transformer core are introduced. Both experimentaland numerical results show approximately similar response to these variables.Correlation between natural frequencies and noise level is evaluated statistically.Pearson factor shows that there is a robust conjunction between first two naturalfrequencies and noise level of CRTs. Results show that noise level decreases asthe two first natural frequencies increases and vice versa, noise level increasesas the two natural frequencies of the core decreases. Finally the noise leveldecomposed to two parts.
Keywords: Experimental; FEM; mean noise level; CRT transformers; IEC60651
1 Introduction
Cast resin transformers (CRT) are the most attractive type of transformers in the field of distributionsystems all over the world. These types of transformers are installed near residential areas since they areclean and safe in contrast to the common oil transformers. Despite of all benefits of these transformers,restriction of the noise in a standard level is a hot topic in debate. According to the literature the
SV. doi:10.32604/sv.2019.05811 www.techscience.com/sv
geometry of the core and magnetostrictions caused by the magnetic field are the most two important sourcesof noise in transformers.
Valkovic [1] has investigated the effects of overlap length of the core laminates and the assemblyprecision on the noise level in a single-phase model. It is reported that the noise level increases as theoverlap length at the joints of the core is increases. Also, Valkovic and Rezic [2] have also examined thecore losses and exciting power in a three phase transformer with step lap configuration core. Resultsshowed that step lap cores have lower losses and exciting power in comparison with overlap ones.Literature survey showed that step lap configuration also has much better sound level characteristics.Laminated configuration of the core is the main cause of noise generation when magnetostrictionhappens. In addition, other parameters such as noise insulators, rubber dampers, and clamping force ofthe core may be the effective parameters on the overall noise level of the transformer. Snell [3] has usedan experimental setup to evaluate the noise level of a step lap transformer according to the IEC60651criteria. Due to the experimental results the choice of noise insulators between core and ground supportand optimum clamping force are vital parameters for minimization of noise level. It is reported that coreswith two laminated layers has higher noise level comparing to the cores with one laminated layers. Baehr[4] reported the effects of cutting shape of laminations and magnetic properties of them on the magneticfield characteristics and resulted noise level due to the magnetostriction forces. According to this workthe uniform field is a way to minimize noise level. Weiser et al. [5] reported that the audible noise oftransformer cores is depended on both magnetostriction and magnetic forces. Flux distribution highlyinfluenced the Maxwell stress vectors especially at core corners which have the maximum dislocationnormal to the lamination planes. Overlap regions has an attractive interlaminar force due to the normalcomponents of induction field. According to their work multi-step-lap (MSL) configurations has loweraudible noise in contrast to the single-step-lap (SSL) cores science even after dislocations are greater inMSL configuration but the lower harmonic distortions offsets the deficiencies. Inter laminar friction isalso reported as another possible source of audible noise. Ilo et al. [6] reported the effects of overlaplength, air gap length and length of overlap areas of adjacent core packages for both SSL and MSLconfigurations.
Distribution of magnetostriction at different regions of the core such as T-joints corners, and mid pointsof rolling and transverse direction of the core is reported in literature [7]. According to this work themagnetostriction at T-joints is greater than strain values at corners. Also it is reported that themagnetostriction in transverse direction is lower than rolling one. Krell et al. [8] have investigated thereasons of increased magnetostriction at T-joint regions of the transformer core. According to this paperrotational magnetization patterns at the T-joint region may be the cause of distinct increasedmagnetostriction. Magnetostriction stress tensor can be evaluated using finite element and Witczak andWeiser methods [5, 6, 10]. In this method, magnetostriction stress field can be evaluated from a known2D magnetic field distribution. To minimize computational costs and time, some special 2D models isdeveloped that could model the real three-dimensional structures of laminated thin sheets computationally[9]. Even after Witczak [10] has evaluated generated noise by magnetostriction as the dominant cause inno-load state but results show [11] that assumption of magnetostriction as the main cause of vibrationincrease in all situations is not sufficient. Ferromagnetic materials have both magnetic and elasticproperties. The relation between these two properties is known as magnetostriction. According to theliterature [12], there is different ways such as annealing that could be used to enhance magnetostrictioncharacteristics of grain-oriented alloys of transformer cores.
In some other works two ways for noise controlling and reduction nominated passive and active methodsrecommended [13, 14]. In passive case some vibration absorbers can be used to reduce the mechanicalvibrations amplitude. But this method could be useful at high frequencies which is useless for lowworking frequencies. Active noise controlling method uses a source of noise generation in an anti-phase
178 SV, 2019, vol.53, no.5
to minimize or cancel the audible noise for both low and high operational frequencies [15]. Even after thereare a large number of parameters that affect noise level of transformer but it is obvious that geometry of thetransformer and structure of its core have a vital effect on the generated noise level. For instance laminatedstructure of the core has the most important role in noise generation. There are some efforts to model the corenumerically considering its real laminated structure [16, 17]. According to these papers magnetostrictivestrains which has the alternative frequency twice the power system supply and magnetic flux frequency isthe main cause of noise generation. Also, as a new research work [18], the purpose of the paper [18], isto propose three imperialist competitive algorithm (ICA)-based models for predicting the blast-inducedground vibrations in Shur River dam region, Iran. In addition, according to reference [19], themagnetostriction damps the vibrations at some frequencies and increases them at some other ones.Recently, novel and applied research works have been done and analyzed about modeling andmeasurement of a tunable acoustoelastic system [20], and experimental and numerical investigation onthe external aerodynamic noise of high-speed train [21]. Also, applied and different research works havebeen performed about test instrument for the automatic compliance check of cast resin insulated windingsfor power transformers [22], bushing failure in power transformers [23], and comparison of electricalparameters of oil-immersed and dry-type transformer using FEM [24].
All tests have been carried out at Iran Transfo Co. as the largest manufacturer of transformer types andthe owner of the largest and most comprehensive laboratory of laboratory transformers in the Middle East.Also, good agreements were found between the obtained results and available real data with high accuracy.On the other hands, the validations of data with test samples have been measured with high precision in thispaper. Estimation of noise in the transformers is one of the important problems. This presented methodpredicts this undesired noise before designing and manufacturing of transformers, and then solve thisproblem using changes in geometrical parameters (resulted in optimum noise amount). Therefore, in thispaper, with the help of statistical data with experimental results, the formula is finally extracted. Theamount of noise of the transformer is estimated with a maximum of 10% error.
In this paper, experimental and numerical investigation will implement to evaluate the effectivegeometrical parameters of the core on the overall sound level of transformers. Noise Level of eachsample will measure according to criteria of IEC60651 and ANSYS Workbench 14 commercial softwarewill be used to extract natural frequencies of the transformer core using FEM method for a 3D laminatedcore model (Standard International First Edition [Conference], IEC: 2001-05).
2 Experimental Test-Rig for Measurement
Test-rig, all experimental measurements, and all other considerations for noise evaluation are accordingto the IEC60651 criteria. Due to this standard, the fabricated transformer is located on a special stand in anappropriate acoustic room denominated acoustic chamber that is shown in Fig. 1.
Measurement points has one meter horizontal distance from transformer where are marked with whitepoints on the stand as illustrated in Fig. 1. An appropriate sound-probe is implemented to record sound levelnear marked points with approximately one meter vertical distance from stand. Measurements are repeatedfor every point in two states which one of them is no-load state when transformer has no load at all andrecorded sound level is only relative to the ambient noise. The other state is loaded one when thetransformer is under electrical load and recorded sound level is the summation of both ambient andtransformer noises together.
Equations (1, 2) may be used to evaluate mean noise level of transformer for both states- loaded and no-load states respectively-after recording the sound level for each point in each state. Then these two meanvalues should be subtracted from each other to give an approximate value of mean noise level of desiredtransformer.
SV, 2019, vol.53, no.5 179
LpA0 ¼ 10 log1
N
Xni¼0
10:2LpA0 !
(1)
LbgA ¼ 10 log1
M
Xmi¼0
10:2LbgA !
(2)
The so-called noise test was implemented for eighteen different transformers with different coredimensions as tabulated in Tab. 1. The second column of this table shows the power of the transformersthat are used in this study. Third column shows the measured and calculated mean noise level of everytested transformer. Main dimensions of the transformer core such as width of the core “l”, overall heightof the core “H”, overall thickness of the core “T”, maximum width of the core legs “Pmax”, minimumwidth of the core legs “Pmin” where are illustrated in Fig. 2 may also be found in appropriate columns ofthis table.
Three novel non-dimensional geometrical parameters which are nominated HPR (Height to Pan Ratio),HBR (Height to Bore Ratio), and HTR (Height to Thickness Ratio) in this study are defined according to Eqs.(3–5). Using these values one can estimate the dimensions where mean noise level of the transformer maybecome minimum or maximum. These values can also be used to find dimensions where the first two naturalfrequencies of the transformer core are maximum or minimum. This is included in numerical analysis sectionof the present work.
HPR ¼ H=L (3)
HBR ¼ H=pmax (4)
HTR ¼ H=T (5)
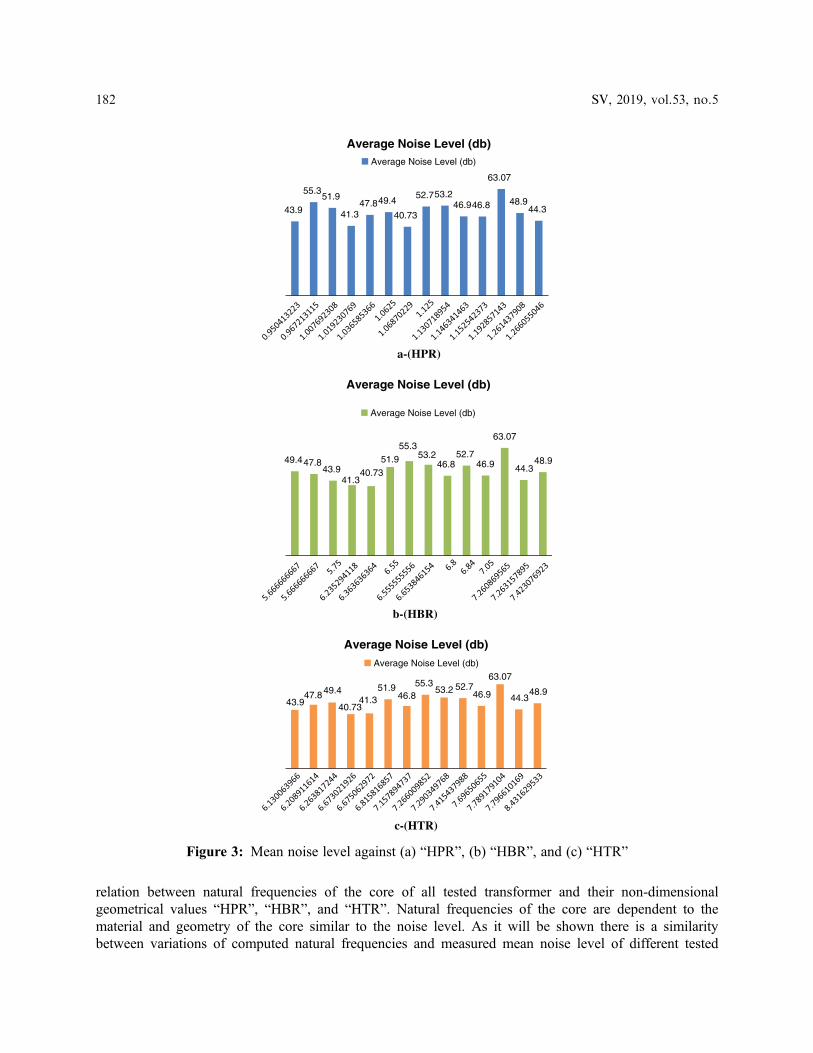
As it is mentioned in abstract section of this paper, core of the transformers are the main source of noisegeneration in transformers. To trace the relation of the calculated mean noise level of the tested transformersto the dimensions of the core, the column graphs “HPR”, “HBR”, and “HTR” are plotted as it is shown inFig. 3. These graphs could give an insight to the non-dimensional values of the geometry of the core that mayminimize noise level. This knowledge could be very helpful to minimize the final overall noise of the
Measurement point
Acoustic walls
Testing stand
Dry-type castresin transformer
Figure 1: Test-rig for noise value evaluation due to IEC60651
180 SV, 2019, vol.53, no.5
transformers prior to the manufacturing of them. In the other words, using these graphs the core dimensionsof the transformers under construction may be changed considering other design criticisms in such a way thatmean noise level fall between values as minimum as possible.
Even after experimental results and plotted column graphs in this study may be useful to find appropriatedimensions that could minimize overall noise of the final fabricated transforms prior to the manufacturing butthis method is very expensive, time consuming and most of them the obtained results could only be expandedto cases that are located in limitations of the tested samples. On the other hand numerical simulations are lessexpensive and could be used to find a general solution. In this work we used modal simulation to find the
Table 1: Measured values of mean noise level
No. Power (KVA) Mean noise level (db) L (mm) H (mm) T (mm) Pmin (mm) Pmax (mm)
1 200 41.3 1040 1060 158.8 80 170
2 400 44.3 1090 1380 177 80 190
3 400 43.9 1210 1150 187.6 90 200
4 500 51.9 1300 1310 192.2 90 200
5 500 46.8 1180 1360 190 90 200
6 630 46.9 1230 1410 183.2 90 200
7 800 40.73 1310 1400 209.8 110 220
8 1250 52.7 1520 1710 230.6 120 250
9 1250 63.07 1400 1670 214.4 110 230
10 1600 53.2 1530 1730 237.3 130 260
11 1600 48.9 1530 1930 228.9 130 260
12 2500 55.3 1830 1770 243.6 130 270
13 2800 49.4 1600 1700 271.4 150 300
14 3000 47.8 1640 1700 273.8 150 300
Figure 2: Main dimensions of the core
SV, 2019, vol.53, no.5 181
relation between natural frequencies of the core of all tested transformer and their non-dimensionalgeometrical values “HPR”, “HBR”, and “HTR”. Natural frequencies of the core are dependent to thematerial and geometry of the core similar to the noise level. As it will be shown there is a similaritybetween variations of computed natural frequencies and measured mean noise level of different tested
a-(HPR)
b-(HBR)
43.9
55.351.9
41.347.849.4
40.73
52.753.246.946.8
63.07
48.944.3
Average Noise Level (db)Average Noise Level (db)
49.447.843.9
41.340.73
51.955.3
53.246.8
52.746.9
63.07
44.348.9
Average Noise Level (db)
Average Noise Level (db)
c-(HTR)
43.947.8 49.4
40.7341.3
51.946.8
55.353.2 52.7
46.9
63.07
44.348.9
Average Noise Level (db)Average Noise Level (db)
Figure 3: Mean noise level against (a) “HPR”, (b) “HBR”, and (c) “HTR”
182 SV, 2019, vol.53, no.5
transformers. To search for a correlation between natural frequencies of the transformer core and overallmean noise level of the transformer, the statistical Pearson factor will also be calculated.
3 Numerical Method
3.1 Geometry of the ModelGeometry of the model is depicted in Fig. 4. This model is 1/8-fraction of the 3-phase transformer core
that its dimensions are given in Tab. 1. Four symmetry planes are highlighted with red color as illustrated inFig. 5. The fixed area of the core which is pressed by the press-plates is shown with PP (Press-Plate) balloonin Fig. 5.
3.2 Meshing and Grid IndependencyRectangular hexahedral elements are used to mesh the model. To check the effects of grid size on the
results, the mesh is refined three times and the total deformation on an arbitrary edge of the core middle
)b()a(
Figure 4: (a) The 1/8-fraction of the 3-phase transformer core, (b) model ready for simulation in ANSYS
Figure 5: Illustration of symmetry planes
SV, 2019, vol.53, no.5 183
leg is considered as a sample in each grid size which is highlighted in Fig. 6a. The extracted values of totaldeformation along the selected edge for each grid size are plotted as is shown in Fig. 6b. According to thisgraph the mesh with 2 cm and lower maximum size is good enough to be ensured of grid independency.
Meshing with elements in an appropriate maximum size range will give us the model like Fig. 7. Notethat all laminates of the core are bonded together and there is no slip between layers.
Mesh parameters are as follow: Aspect ratio of final mesh “1.06–2.01”, Jacobian ratio “1–1.04”,Warping factor “zero”, parallel deviation “0.02–1.48”, maximum corner angle “90.02–103.17”,orthogonally quality “98–100%”, and Skewness “0–15%”. All elements have good quality conditions inthe range of 87–100% so the results are numerically validated.
3.3 Governing EquationsModal analysis is done with calculation of the eigenvalues. Assuming linear elastic behaviors of the core
material the Hook’s law is applicable and dynamic equation of motion for FEMmodel is according to Eq. (6)as below.
M½ � €U� �þ C½ � _U
� �þ K½ � U½ � ¼ F½ � (6)
Where [M] is mass matrix, €U� �
acceleration vector, [C] damping, _U� �
velocity vector, [K] elasticity, and[U] the displacement vector. For free vibration without damping, [C] and [F] is zero and Eq. (6) will simplifyto Eq. (7).
Figure 7: (a) Final grid that is used for simulation, (b) exaggerated view of generated mesh
184 SV, 2019, vol.53, no.5
M½ � €U� �þ K½ � U½ � ¼ 0½ � (7)
In the case of free vibration, replace acceleration vector €U� �
with � U½ � and we have:
� U½ � þ K½ � U½ � ¼ 0½ � (8)
Solving this set of the linear equations will give eigenvalues.
4 Results and Discussion
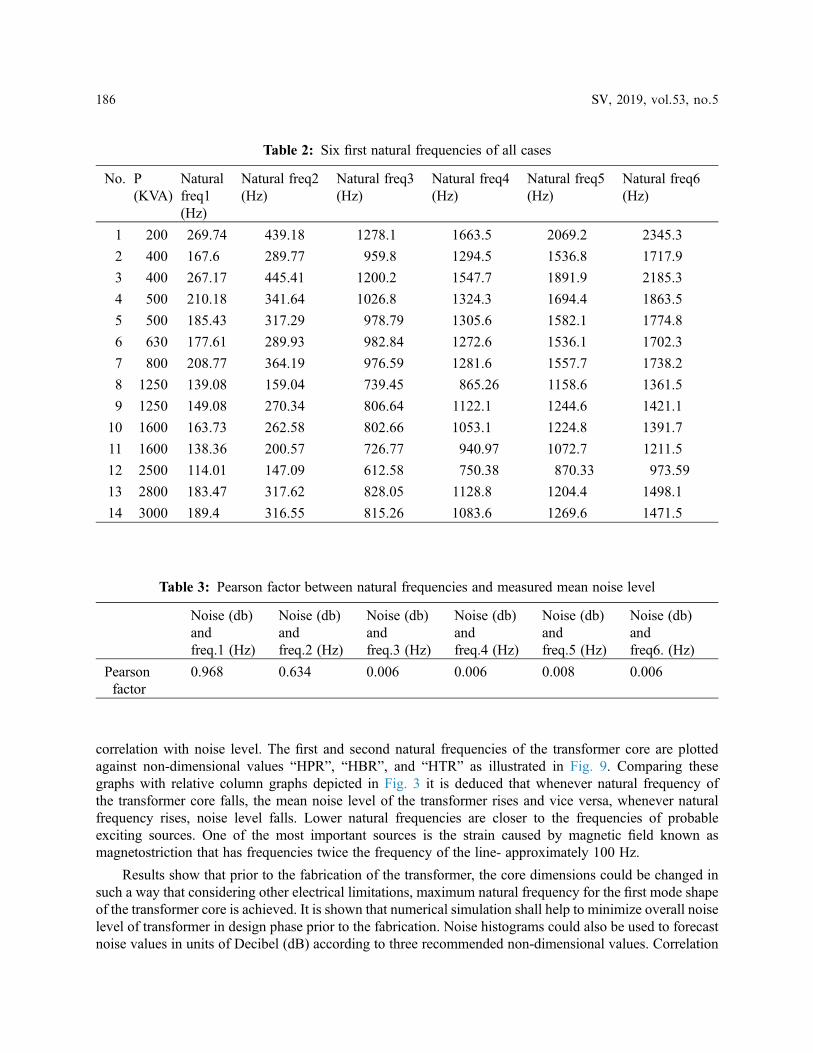
Figure 8 shows the deformation contours of the core for six first mode shapes of case5 as a sample. Inmode 1 and 2 the right and middle legs of the core will deform in a walking-like manner respectively. Inmode 3 the core will bend relative to the yoke axis. Mode 4 and 5 show the bending of the middle andright legs of the core relative to the normal axis respectively. In the mode 6, a simultaneous oppositebending of the core legs relative to the normal axis in a scissors-like manner is observed. There is asimilar behavior for all other cases. Values of six first natural frequencies are extracted for all cases thatare reported in Tab. 2.
To search a correlation between natural frequencies of the transformer core and measured mean noiselevel of transformer, the statistical Pearson factor is calculated using SPSS software. Calculated Pearsonfactors between each natural frequency and mean noise level are according to Tab. 3.
Pearson factor between first natural frequency of the tested transformers and corresponding measurednoise level is 0.968. This value is 0.634 between second frequency and noise. High Pearson factor showsthat there is a robust correlation between first and approximately second natural frequency of thetransformer core and mean noise level of the transformer. It seems that other frequencies have no
Figure 8: First six mode shape of vibration-case5
SV, 2019, vol.53, no.5 185
correlation with noise level. The first and second natural frequencies of the transformer core are plottedagainst non-dimensional values “HPR”, “HBR”, and “HTR” as illustrated in Fig. 9. Comparing thesegraphs with relative column graphs depicted in Fig. 3 it is deduced that whenever natural frequency ofthe transformer core falls, the mean noise level of the transformer rises and vice versa, whenever naturalfrequency rises, noise level falls. Lower natural frequencies are closer to the frequencies of probableexciting sources. One of the most important sources is the strain caused by magnetic field known asmagnetostriction that has frequencies twice the frequency of the line- approximately 100 Hz.
Results show that prior to the fabrication of the transformer, the core dimensions could be changed insuch a way that considering other electrical limitations, maximum natural frequency for the first mode shapeof the transformer core is achieved. It is shown that numerical simulation shall help to minimize overall noiselevel of transformer in design phase prior to the fabrication. Noise histograms could also be used to forecastnoise values in units of Decibel (dB) according to three recommended non-dimensional values. Correlation
Table 3: Pearson factor between natural frequencies and measured mean noise level
Noise (db)andfreq.1 (Hz)
Noise (db)andfreq.2 (Hz)
Noise (db)andfreq.3 (Hz)
Noise (db)andfreq.4 (Hz)
Noise (db)andfreq.5 (Hz)
Noise (db)andfreq6. (Hz)
Pearsonfactor
0.968 0.634 0.006 0.006 0.008 0.006
Table 2: Six first natural frequencies of all cases
No. P(KVA)
Naturalfreq1(Hz)
Natural freq2(Hz)
Natural freq3(Hz)
Natural freq4(Hz)
Natural freq5(Hz)
Natural freq6(Hz)
1 200 269.74 439.18 1278.1 1663.5 2069.2 2345.3
2 400 167.6 289.77 959.8 1294.5 1536.8 1717.9
3 400 267.17 445.41 1200.2 1547.7 1891.9 2185.3
4 500 210.18 341.64 1026.8 1324.3 1694.4 1863.5
5 500 185.43 317.29 978.79 1305.6 1582.1 1774.8
6 630 177.61 289.93 982.84 1272.6 1536.1 1702.3
7 800 208.77 364.19 976.59 1281.6 1557.7 1738.2
8 1250 139.08 159.04 739.45 865.26 1158.6 1361.5
9 1250 149.08 270.34 806.64 1122.1 1244.6 1421.1
10 1600 163.73 262.58 802.66 1053.1 1224.8 1391.7
11 1600 138.36 200.57 726.77 940.97 1072.7 1211.5
12 2500 114.01 147.09 612.58 750.38 870.33 973.59
13 2800 183.47 317.62 828.05 1128.8 1204.4 1498.1
14 3000 189.4 316.55 815.26 1083.6 1269.6 1471.5
186 SV, 2019, vol.53, no.5
(a)
(b)
(c)
Figure 9: First and second natural frequencies of the transformer core against non-dimensional geometricalvalues (a) “HPR”, (b) “HBR”, (c) “HTR”
SV, 2019, vol.53, no.5 187
between numerical and experimental values to evaluate mean noise level of the transformers prior tofabrication in design phase, a correlation between the numerical and experimental values will be studiedin this section in such a way that knowing dimensions of the core of the transformer and first naturalfrequency of the core as the main effective parameters, approximate value of the mean noise level couldbe forecasted.
To do so, there are some assumptions. First, it is assumed that the overall mean noise level of thetransformer is the superposition of the noises caused by two known major sources. First source is thegeometry of the core of the transformer. Dimensions of the core of the transformer may be designed insuch a way that produces as minimum noise as possible. But there is a fact that the bios value of noisethat seems to be dependent to the geometry of the core of the transformer could not be canceledcompletely but could be minimized.
On the other hand some part of the noise seems to be depended to the resonance of the core when the naturalfrequency of the core is near to the frequency of the magnetostriction frequency read twice the line frequencyequal to 100 Hz. We denominated this frequency here as the critical frequency. We also assumed that intransformers with cores having first natural frequency far enough from critical frequency the overall noise isjust affected by the geometrical dimensions of the core and the compartment of the resonance is negligible.
In this study, the first natural frequencies greater than 200 Hz are assumed to be far enough from criticalfrequency so the effects of resonance is negligible. Mean noise values for fourteen cases are measurednumerically and their first natural frequencies are extracted numerically that are tabulated in Tab. 4. Thecases with first natural frequencies greater than 200 Hz have approximately the lowest values of meannoise level (see Tab. 4).
We denominated frequencies greater than 200 Hz as safe frequencies and 200 Hz frequency itself as thethreshold frequency in this work. As it is mentioned previously the effects of geometry on noise level couldbe considered using three non-dimensional values HBR, HTR, and HPR. In cases with safe naturalfrequencies the experimentally measured noise values could be plotted against these three non-dimensional values according to Figs. 10–12, respectively,
According to Fig. 10 noise in transformers with safe frequencies could be approximated by a first orderpolynomial that means there is a linear relation according to Eq. (9) between overall noise of transformer thatis shown with �noise and non-dimensional geometrical parameter HBR.
�noise ¼ �5:22 HBRð Þ þ 73:9 (9)
Table 4: Numerical and experimental case studies show the first natural frequencies and average noiselevel respectively
ExperimentalCase Number
First NaturalFrequency
Average NoiseLevel (db)
ExperimentalCase Number
First NaturalFrequency
Average NoiseLevel (db)
1 183.47 49.4 8 163.73 53.2
2 189.4 47.8 9 185.43 46.8
3 267.17 43.9 10 139.08 52.7
4 269.74 41.3 11 177.61 46.9
5 208.77 40.73 12 149.08 63.07
6 210.18 51.9 13 167.6 44.3
7 114.01 55.3 14 138.36 48.9
[Q2]
188 SV, 2019, vol.53, no.5
The graph illustrated in Fig. 11 shows the relation between HPR and measured mean noise level. As itcould be deduced from this graph there is a second order polynomial relation according to Eq. (10) betweenHPR and measured mean noise level in transformers with cores having safe first natural frequency.
�noise ¼ 222 HPRð Þ2 � 475:0ðHPRÞ þ 294:9 (10)
The graph illustrated in Fig. 12 shows the relation between HTR and measured mean noise level. As itcould be deduced from this graph there is an exponential relation according to Eq. (11) between HTR andmeasured mean noise level in transformers with cores having safe first natural frequency.
�noise ¼ 187:0 HTRð Þ�0:8 (11)
y = 221.99x2- 475.03x + 294.85R2 = 1
40.5
41
41.5
42
42.5
43
43.5
44
44.5
0.94 0.96 0.98 1 1.02 1.04 1.06 1.08
Mea
n N
ois
e L
evel
HPR
M easured Mean Noise Level (dB)Poly. (M easured Mean Noise Level (dB))
Figure 11: Measured mean noise level against non-dimensional value HPR
y = -5.2187x + 73.896R² = 0.9991
40.5
41
41.5
42
42.5
43
43.5
44
44.5
5.7 5.8 5.9 6 6.1 6.2 6.3 6.4
Mea
sure
d M
ean
No
ise
Lev
el(d
B)
Non-Dimensional Value HBR
Measured Mean Noise Level(dB)Linear (Measured Mean Noise Level(dB))
Figure 10: Measured mean noise level against non-dimensional value HBR
SV, 2019, vol.53, no.5 189
As it is mentioned we assumed that the noise level of transformers for cases with first natural frequenciesbelow threshold frequency is the superposition of two parts a part from resonance and the other fromgeometry of the core. If we assume that Eqs. (9–11) also be valid for transformers below thresholdfrequency level, one can approximate the share of resonance in noise generation of the transformersubtracting the values caused by geometry from overall measured mean noise level. A new parameter thatnominated frequency weight factor is also defined according to Eq. (12) to showing how far is the firstnatural frequency of the core's natural frequency from critical frequency,
!f ¼ 200� freq
100(12)
Tables 5–7 show the share of noise caused by resonance after subtracting geometry share of the noiseaccording to Eqs. (9–11) based on HBR, HPR, and HTR.
y = 187.04x-0.799
R2 = 0.9685
40.5
41
41.5
42
42.5
43
43.5
44
44.5
6.1 6.2 6.3 6.4 6.5 6.6 6.7 6.8
Mea
n N
ois
e L
evel
(dB
)
HTR
Measured Mean Noise Level (dB)Power (Measured Mean Noise Level (dB))
Figure 12: Measured mean noise level against non-dimensional value HTR
Table 5: Decomposition of measured mean noise level to two parts, share of noise caused by puregeometry and share of noise caused by pure resonance according to HBR
HBR !f Average Noise Level (db)Measured experimentally
Share of noisecaused by PureGeometry
Share of noise caused bypure resonance
5.67 0.1653 49.4 44.32 5.08
5.67 0.106 47.8 44.32 3.48
6.56 0.8599 55.3 39.68 15.62
6.65 0.3627 53.2 39.17 14.0
6.8 0.1457 46.8 38.41 8.4
6.84 0.6092 52.7 38.2 14.5
7.05 0.2239 46.9 37.1 9.8
7.26 0.5092 63.07 36.0 27.1
7.26 0.324 44.3 36.0 8.31
190 SV, 2019, vol.53, no.5
To extract an approximated relation between resonance share of noise and new defined parameter namedfrequency weight factor we could plot three graphs as below due to average noise level against frequencyweight factor (!f ) from Tabs. 5–7:
Share of overall noise due to resonance could be approximated with three different second orderpolynomials as it is plotted in Figs. 13–15. These equations could be summed with correspondingequations showing the share of noise due to non-dimensional geometrical parameters. Finally, threedifferent Eqs. (13–15) will be deduced to evaluate overall noise level.
Table 6: Decomposition of measured mean noise level to two parts, share of noise caused by puregeometry and share of noise caused by pure resonance according to HPR
HPR !f Average Noise Level (db)Measured experimentally
Share of noise causedby Pure Geometry
Share of noise causedby pure resonance
0.97 0.1401 55.3 43.07 12.23
1.037 0.894 47.8 40.97 6.83
1.06 0.8347 49.4 40.74 8.66
1.13 0.3908 52.7 41.40 11.3
1.131 0.6373 53.2 41.55 11.66
1.147 0.7761 46.9 42.02 4.88
1.15 0.8543 46.8 42.24 4.561
1.193 0.4908 63.07 44.08 19.0
1.26 0.3836 48.9 48.87 0.035
Table 7: Decomposition of measured mean noise level to two parts, share of noise caused by puregeometry and share of noise caused by pure resonance according to HTR
HTR !f Average Noise Level (db)Measured experimentally
Share of noise causedby Pure Geometry
Share of noise causedby pure resonance
6.21 0.106 47.8 43.48 4.32
6.26 0.1653 49.4 43.18 6.22
7.16 0.1457 46.8 38.81 7.99
7.27 0.8599 55.3 38.35 16.95
7.29 0.3627 53.2 38.25 14.95
7.415 0.6092 52.7 37.73 14.97
7.7 0.2239 46.9 36.63 10.27
7.79 0.5092 63.07 36.28 26.8
7.8 0.324 44.3 36.25 8.05
8.43 0.6164 48.9 34.05 14.85
SV, 2019, vol.53, no.5 191
�noise ¼ �5:22 HBRð Þ þ 73:9f g þ �23:66 !f
� �2 þ 36:4 !f
� �þ 1:351n o
(13)
�noise ¼ 222 HPRð Þ2 � 475:0ðHPRÞ þ 294:9n o
þ �14:5 !f
� �2 þ 22:69 !f
� �þ 3:37n o
(14)
�noise ¼ 187:0 HTRð Þ�0:8n o
þ �20:7 !f
� �2 þ 34:7 !f
� �þ 2:02n o
(15)
To search the accuracy of these equations the measured mean noise level is compared withcorresponding computed values using Eqs. (13–15) where are plotted in Figs. 16–19 respectively. Fig. 16(Graph) shows that overall noise values computed using Eq. (13) has –6.95% mean underestimation and
0
2
4
6
8
10
12
14
16
18
0 0.2 0.4 0.6 0.8 1
Res
on
ance
Sh
are
of
No
ise(
dB
) ac
cord
ing
to H
BR
dec
om
po
siti
on
Weight Factor
Series1Poly. (Series1)
Figure 13: Resonance share of Noise according to HBR decomposition against frequency weight factor
0
2
4
6
8
10
12
14
0 0.2 0.4 0.6 0.8 1
Res
on
ance
Sh
are
of
No
ise(
dB
) ac
cord
ing
to
H
PR
dec
om
po
siti
on
Weight Factor
Series1Poly. (Series1)
Figure 14: Resonance share of Noise according to HPR decomposition against weight factor
192 SV, 2019, vol.53, no.5
2.87% mean overestimation comparing the experimental ones. Eq. (14) has –4.53% underestimation and13.41% overestimation. Corresponding values are –6.5% and 2.71% for Eq. (15).
To make a unit equation to approximate mean noise level, three equations are summed together and isdivided by 3 to make an averaged equation as Eq. (16) for cases with first natural frequency below thresholdfrequency and equation 16b for cases with first natural frequency in safe.
�noise ¼ �1:74 HBRð Þf g þ 74 HPRð Þ2 � 158:34ðHPRÞn o
þ 62:34 HTRð Þ�0:8n o
þ �19:62 !f
� �2 þ 31:263 !f
� �þ 125:18n o (16)
0
2
4
6
8
10
12
14
16
18
0 0.2 0.4 0.6 0.8 1
Res
on
ance
Sh
are
of
No
ise(
dB
) ac
cord
ing
to
H
TR
dec
om
po
siti
on
Weight Factor
Series1Poly. (Series1)
Figure 15: Resonance share of Noise according to HTR decomposition against weight factor
40
45
50
55
60
65
0 2 4 6 8 10 12
No
ise
Lev
el (
dB
)
Case Number
Measured Average Noise Level (dB)
Approximated Noise Level Using Eq.(13) (dB)
Figure 16: Comparison of measured average noise level with approximated noise level using Eq. (13)
SV, 2019, vol.53, no.5 193
40
45
50
55
60
65
0 2 4 6 8 10 12
No
ise
Lev
el(d
B)
Case Number
Average Noise Level (db)
Approximated Noise Level Using Eq.(14)
Figure 17: Comparison of measured average noise level with approximated noise level using Eq. (14)
40
45
50
55
60
65
0 2 4 6 8 10 12
No
ise
Lev
el(d
B)
Case Number
Average Noise Level (db)Approximated Noise Level Using HTR
Figure 18: Comparison of measured average noise level with approximated noise level using Eq. (15)
40
45
50
55
60
65
10 2 4 6 8 10 12 14 6
No
ise
Lev
el(d
B)
Case Number
Average Noise Level (db)
Approximated Noise Level Using Eqs. (16, 17)
Figure 19: Comparison of measured average noise level and approximated noise level using Eqs. (16, 17)
194 SV, 2019, vol.53, no.5
First natural frequency<200 Hz
�noise ¼ �1:74 HBRð Þf g þ 74 HPRð Þ2 � 158:34ðHPRÞn o
þ 62:34 HTRð Þ�0:8n o
þ 125:18 (17)
For natural frequencies � 200 Hz
Finally, we implemented all the procedure for 8 other cases as the witness cases to test the correctnessand precision of the proposed equation for overall noise level evaluation. Experimental tests are implementedto evaluate noise values and numerical simulation is used to evaluate first natural frequency. Fig. 20 and Tabs.8–11 list the values.
Figure 20: Comparison of measured mean noise level with approximated values for witness cases usingEqs. (16, 17)
CRT transformers as the second-generation of air-cooled distribution transformers may be installedindoor adjacent to or near residential areas since they are clean and safe comparing to the conventionaltransformers. Since noise discrepancy is inevitable, minimization of the noise level has biological andergonomic importance. As it is known the core of transformers is the main source of the noise generation.In this paper, experimental and numerical investigation was implemented for a large number of fabricatedCRT transformers in Iran transfo Co. to evaluate the effective geometrical parameters of the core on theoverall sound level of transformers. Noise Level of each sample was measured according to criteria ofIEC60651 and was reported in units of Decibel (dB). To do so the fabricated transformers were locatedon a special stand in an acoustic chamber and using a special sound-probe both mean background noiseand mean loaded transformer plus background noise were recorded in a specified distance from standaccording to the standard. Finally, an approximate value of mean noise level of transformers wascalculated subtracting these two measured values. Numerical simulation was done using ANSYSWorkbench 14 commercial software to extract first six natural frequencies and mode shapes of CRT coreswhich was reported in units of Hz. 1/8-fraction of the 3-phase transformer core considering symmetrieswas modeled for numerical analysis. Rectangular hexahedral elements were used to mesh the model. The
Table 9: Measured mean noise level of witness case studies and approximated values usingEqs. (16, 17)
No. First naturalfrequency
!f Measured MeanNoise Level (dB)
approximated noise according tosuperposed equation (16, 17)
error
15 206.28 >200 53.7 43.01 −19.9141
16 211.8 >200 48.99 43.2 −11.8353
17 219.92 >200 48.8 45.35 −7.08091
18 199.39 0.0061 47.78 43.2 −9.58715
19 187.97 0.1203 50.1 46.04 −8.1069
20 170.09 0.2991 49.6 50.06 0.921936
21 147.94 0.5206 52.3 52.9 1.080008
22 127.79 0.7221 55.3 54.6 −1.25985
Table 10: Measurments
Overstimated Underestimated
−7.29032 5.071474
Table 11: Measurments
Overstimation Underestimation
1.000972 −9.63069
196 SV, 2019, vol.53, no.5
mesh was refined three times to ensure grid independency. All elements of implemented mesh have goodquality conditions so the results are numerically validated. Assuming the Hook’s law is applicable modalanalysis was done with calculation of eigenvalues. Three novel non-dimensional variables for geometryof the transformer core were introduced. Both experimental and numerical results show that there is asimilarity between variations of computed natural frequencies and measured mean noise level of differenttested transformers against these variables.
To search a correlation between natural frequencies of the transformer core and measured overall meannoise level of transformer, the statistical Pearson factor was calculated using SPSS software. High Pearsonfactor showed that there is a robust correlation between first natural frequency of the transformer core andmean noise level of the transformer. It is deduced that whenever natural frequency of the transformer corefalls, the mean noise level of the transformer rises and vice versa, whenever natural frequency rises, noiselevel falls.
Lower natural frequencies are closer to the frequencies of probable exciting sources. One of the mostimportant sources is the strain caused by magnetic field known as magnetostriction that has frequenciestwice the frequency of the line. Results showed that prior to the fabrication of the transformer, the coredimensions could be changed in such a way that considering other electrical limitations, maximumnatural frequency for the first mode shape of the transformer core is achieved. It is shown that numericalsimulation shall help to minimize overall noise level of transformer in design phase prior to thefabrication. Noise histograms could also be used to forecast noise values in units of Decibel (dB)according to three recommended non-dimensional values.
References1. Valkovic, Z. (1996). Investigations of core noise levels using a dry-type transformer model. Journal of Magnetism
and Magnetic Materials, 160, 205–206. DOI 10.1016/0304-8853(96)00170-9.
2. Valkovic, Z., Rezic, A. (1992). Improvement of transformer core magnetic properties using the step-lap design.Journal of Magnetism and Magnetic Materials, 112(1–3), 413–415. DOI 10.1016/0304-8853(92)91216-G.
3. Snell, D. (2008). Measurement of noise associated with model transformer cores. Journal of Magnetism andMagnetic Materials, 320(20), 535–538. DOI 10.1016/j.jmmm.2008.04.143.
4. Baehr, R. (1978). Investigation into flux distribution in variable shape transformer cores. Journal of Magnetismand Magnetic Materials, 9(1–3), 167–169. DOI 10.1016/0304-8853(78)90044-6.
5. Weiser, B., Hasenzagl, A., Booth, T., Pf'titzner, H. (1996). Mechanisms of noise generation of model transformercores. Journal of Magnetism and Magnetic Materials, 160, 207–209. DOI 10.1016/0304-8853(96)00171-0.
6. Ilo, A., Weiser, B., Booth, T., Pfützner, H. (1996). Influence of geometric parameters on the magnetic properties ofmodel transformer cores. Journal of Magnetism and Magnetic Materials, 160, 38–40. DOI 10.1016/0304-8853(96)00099-6.
7. Shilyashki, G., Pfützner, H., Hofbauer, F., Sabic, D., Galabov, V. (2010). Magnetostriction distribution in a modeltransformer core. Journal of Electrical Engineering, 61(7), 130–132.
8. Krell, C., Baumgartinger, N., Krismanic, G., Leiss, E., Pfützner, H. (2000). Relevance of multidirectionalmagnetostriction for the noise generation of transformer cores. Journal of Magnetism and Magnetic Materials,215-216, 634–636. DOI 10.1016/S0304-8853(00)00247-X.
9. Hihat, N., Napieralska-Juszczak, E., Lecointe, J.-P., Sykulski, J. K., Komeza, K. (2011). Equivalent permeabilityof step-lap joints of transformer cores: computational and experimental considerations. IEEE Transactions onMagnetics, 47(1), 244–251. DOI 10.1109/TMAG.2010.2089800.
10. Kubiak, W. (2006). Identification of magnetostriction vibrations in power transformers. Zeszyty Naukowe.Elektryka/Politechnika Łódzka, z, 109, 51–61.
11. Hilgert, T., Vandevelde, L., Melkebeek, J. (2006). Vibrations in magnetic cores due to magnetic forces andmagnetostriction (Ph.D. Symposium). Faculty of Engineering, Ghent University, Ghent, Belgium.
12. Chudakov, I. B., Cha, S. Y., Woo, J. S., Chang, S. K. (1998). Effect of magnetic annealing on magnetostriction ofgrain oriented electrical. Journal of Magnetics, 3(1), 15–20.
13. Ross, C. F. (1978). Experiments on the active control of transformer noise. Journal of Sound and Vibration, 61(4),473–480. DOI 10.1016/0022-460X(78)90449-2.
14. Ilo, A., Pfützner, H., Nakata, T. (2000). Critical induction – a key quantity for the optimization of transformercore operation. Journal of Magnetism and Magnetic Materials, 215-216, 637–640. DOI 10.1016/S0304-8853(00)00248-1.
15. Berge, T., Pettersen, O., Sorsdal, S. (1998). Active cancellation of transformer noise field measurements appliedacoustics Conference, Acoustics Research Center, ELAB-SINTEF, The Norwegian Institute of Technology. Norway23, 309–320.
16. Masti, R. S., Desmet, W., Heylen, W. (2004). On the influence of core laminations upon power transformer noiseProceedings of ISMA, 3851–3862.
17. Soltanmohammadi, M., Eslamian, A. (2012). The investigation of the effect of cast resin transformer’s core on thenatural mode shapes and vibration. ISME (conference), Shiraz, ISME.
18. Behzadafshar, K., Mohebbi, F., Soltani Tehrani, M., Hasanipanah, M., Tabrizi, O. (2018). Predicting the groundvibration induced by mine blasting using imperialist competitive algorithm. Engineering Computations, 35(4),1774–1787. DOI 10.1108/EC-08-2017-0290.
19. Belahcen, A. (2004). Magnetoelasticity, magnetic forces and magnetostriction in electrical machines (Doctoralthesis). Helsinki University of Technology, Laboratory of Electromechanics.
20. Deborah, F., Garrett, L., Bansal, D., Schultz, R., Brake, M., Shepherd, M. (2018). Modeling and measurement of atunable acoustoelastic system. Sound and Vibration, 52, 12–17.
21. Jiang, S., Yang, S., Zhang, B., Wen, B. (2019). Experimental and numerical investigation on the externalaerodynamic noise of high-speed train. Sound and Vibration, 53(4), 129–138.
22. Dolce, S., Fiorucci, E., Bucci, G., D'Innocenzo, F., Ciancetta, F., Di Pasquale, A. (2017). Test instrument for theautomatic compliance check of cast resin insulated windings for power transformers. Measurement, 100, 50–61.DOI 10.1016/j.measurement.2016.12.039.
23. Arias Velásquez, R. M., Mejía Lara, J. V. (2018). Bushing failure in power transformers and the influence ofmoisture with the spectroscopy test. Engineering Failure Analysis, 94, 300–312. DOI 10.1016/j.engfailanal.2018.08.006.
24. Amin, U., Talib, A., Qureshi, S. A., Hossain, M. J., Ahmad, G. (2018). Comparison of electrical parameters of oil-immersed and dry-type transformer using finite element method. World Academy of Science, Engineering andTechnology International Journal of Energy and Power Engineering, 12(5), 341–345.