Page 1
Experimental Bond Behaviour of GFRP and Masonry Bricks under Impulsive
Loading
João M. Pereira a*, Paulo B. Lourenço a
a ISISE, Department of Civil Engineering, University of Minho, Guimarães, Portugal
* Corresponding author: Department of Civil Engineering, University of Minho,
Campus de Azurém, Guimarães, 4800-058, Portugal; email: [email protected]
Abstract: Fibre Reinforced Polymers have become a popular material for strengthening
of masonry structures. The performance of this technique is strongly dependent on the
bond between the FRP and the substrate. Understanding the strain rate effect on these
materials and strengthening techniques is important for proper design and proper
modelling of these systems under impacts or blast loads. This work aims to study the
behaviour of the bond between GFRP and brick at different strain rates. A Drop Weight
Impact Machine specially developed for pull-off tests (single shear tests) is used with
different masses and different heights introducing different deformation rates. The strain
rate effect on the failure mode, shear capacity and effective bond length is determined
from the experimental results. Empirical relations of dynamic increase factors (DIF) for
these materials and techniques are also presented.
Keywords: GFRP, Masonry, Impact, Drop Weight, Strain rate, DIF
Page 2
1. Introduction
Different loading conditions might lead to different strain rates. Quasi-static loading
produces strain rates of around 10-5 s-1, while impacts and blast loading produce strain
rates of well over 100 s-1. When subjected to dynamic loading conditions, materials can
have a much different behaviour when compared with their static behaviour
(Meyers [1], Hiermaier [2], Ngo et al [3], Stavrogin and Tarasov [4]). Most research
work on structural response and damage under impact and blast loading assumes
typically static material properties (Baylot et al [5], Moreland et al [6].
In recent years, composites materials such as fibre reinforced polymers (FRPs) have
been increasingly accepted as effective strengthening technique for civil engineering
structures, particularly in the case of reinforced concrete and masonry (Bakis et al [7],
Pampazopoulou et al [8]). The effectiveness of these strengthening techniques is
strongly dependable on the bond behaviour between the substrate and the FRP fabric.
Studies on the influence of the strain rates on the bond behaviour of these strengthening
systems are scarce and cannot be found easily in the literature. Recently, Al-
zubaidy et al [9] studied the bond behaviour between CFRP fabrics and steel plate joints
under tensile loads with deformation rates up to 5 m/s. This work concluded that the use
of multi-layer reinforcement was ineffective and the effective bond length was not
affected by the deformation rate. They have also shown that the failure modes obtained
under impulsive regime were similar to those obtained under quasi-static loading
regime. Shi et al [10] studied the bond behaviour between FRP laminates and concrete
using double-lap shear bond tests up to strain rates of 0.1 s-1. These authors showed that
for strain rates of 0.1 s-1 the increase in the ultimate shear strength is 1.3 times the quasi-
static value. These authors also concluded that the influence of the strain rate is more
pronounced for weaker concrete, and it is not significantly affected by the properties of
Page 3
bonding adhesives and the type of FRP composite. Similar conclusions were obtained
by other authors when studying the bond behaviour of different FRP laminates and
concrete (Li et al [11], Shen et al [12]).
In order to fully understand the influence of the strain rates in these strengthening
systems and to develop empirical relations able to estimate the response of these
materials under high strain rates, it is necessary to study the substrate and the fabric
independently and the strengthening systems itself.
Dynamic behaviour of common construction materials such as concrete
(Grote et al [13]) or reinforcement bars (Malvar and Ross [14]) have been studied in
recent years, being already introduced into some standards (CEB-FIP [15], UFC 3-340-
02 [16]) in the form of a dynamic increase factor (DIF) which represents the ratio
between the dynamic and static property. However, very limited studies can be found in
the literature for masonry materials. Recently, Hao and Tarasov [17], Pereira et al [18],
Lourenço and Pereira [19] and Asprone et al [20] studied this effect on masonry
components (clay brick, stone and mortar) and masonry specimens. It was shown that
Dynamic Increase Factors (DIF) up to 2.54 and 2.17, were obtained for the compressive
strength of clay bricks and masonry at a strain rate of 200 s-1. Similar values were
obtained for the Young’s modulus. Regarding the tensile behaviour of these materials,
DIF up to 3.1 for the tensile strength of mortar joints were obtained at a strain rate of
1 s-1 and DIF up to 3 were obtained for the tensile strength of the tested stones.
Composite materials were also studied under high strain rate effects in recent years and
some of these studies (Gurusideswar and Velmurugan [21], Okoli [22] and Correira and
Peixinho [23]) show that at strain rates of 500 s-1, DIF up to 2 can be obtained for Glass
Fibre Reinforced Polymer (GFRP) strips.
Page 4
In this paper, an experimental campaign on the influence of the strain/deformation rate
on the mechanical bond behaviour of GFRP-brick systems is described. The tests were
performed with a Drop Weight tower developed specifically for this purpose. This
equipment is able to perform single-lap shear bond tests under impulsive regime using a
drop hammer being releases at a specific height. Both materials are studied
independently previously – clay brick and GFRP strips – and in this paper the bond
behaviour of the strengthening systems is studied under high deformation rates.
2. Clay brick under high strain rates
Studies on clay bricks under high strain rates were performed previously and were
presented in detail by Pereira et al [18] and Lourenço and Pereira [19]. These bricks
were of the same material used in the single-lap shear bond tests presented in the next
section. A drop weight impact machine was used to perform the compression tests at
different strain rates. Two different ways were used to measure the deformation profile:
a) a FastCam video camera using targets in the specimen and video tracking software;
b) strain gauges in all faces of the specimen Pereira et al [18], Lourenço and Pereira
[19].
The results obtained by Pereira et al [18] and Lourenço and Pereira [19] can be seen in
Figure 1. It is clear that these material show strain rate dependency. At a strain rate of
200 /s Dynamic Increase Factors of 2.54, 2.43, 1.30 and 5.95 were reported for the
compressive strength, Young’s modulus, strain at peak strength and compressive
fracture energy, respectively. The obtained results are in agreement with other studies
(Hao and Tarasov [17]). The empirical equations able to estimate these mechanical
properties for strain rates up to 200 /s, as follows (Pereira et al [18], Lourenço and
Pereira [19]):
Page 5
For the compressive strength:
퐷퐼퐹(휎 ) = 1푖푓1퐸 − 5푠 < 휀̇ < 2푠0,3344 ln(휀̇) + 0.7682푖푓2푠 < 휀̇ < 200푠
(1)
For the Young’s modulus:
퐷퐼퐹(퐸) = 1푖푓1퐸 − 5푠 < 휀̇ < 2푠0,3105 ln(휀̇) + 0.7848푖푓2푠 < 휀̇ < 200푠
(2)
For the strain at peak strength:
퐷퐼퐹(휀 ) = 1푖푓1퐸 − 5푠 < 휀̇ < 2푠0,0673 ln(휀̇) + 0.9533푖푓2푠 < 휀̇ < 200푠
(3)
For the compressive fracture energy:
퐷퐼퐹(퐺 ) = 1푖푓1퐸 − 5푠 < 휀̇ < 5푠1,3419 ln(휀̇) − 1.1597푖푓5푠 < 휀̇ < 200푠
(4)
3. GFRP under high strain rates
Correia and Peixinho [23] tested GFRP strips under different strain rates. The tested
GFRP strips were of the same material used for the single-lap shear bond tests presented
in the next section. Two different testing equipments were used allowing two different
strain rate levels. A Servo-hydraulic testing machine (Instron, 25 kN capacity) was used
for lower loading speed (0.02 mm/s), while a high-speed servo-hydraulic testing
machine (Zwick, 20 kN capacity) was used for loading speed of approximately
6000 mm/s. Regarding the high-speed testing equipment, this includes a slack-response
bracket, allowing the pull-rod to accelerate before commencing to load the specimen;
the internal measuring systems of the equipment were used, including piezo-electric
load cell and vertical displacement transducer for the stroke of the pull-rod. The
Page 6
nominal strain rates obtained in the tests was calculated by dividing the linear speed of
the testing machine by the parallel length of the specimen.
The results obtained by Correia and Peixinho [23] can be seen in Figure 2 and the strain
rates varied from 0.655 /s to 446 /s. It is clear that this material shows strain rate
dependency. The observed dispersion in the experimental results is somehow expected
considering the impulsive nature of the experiments and the handmade building process
of the specimens. In the higher strain rate tests a higher tensile strength was obtained,
averaging 1862 MPa, while for the lower strain rate tests only a tensile strength of 1030
MPa (average) was obtained. This represents a Dynamic Increase Factor of about 1.8
for strain rates of about 500 /s. These results are in agreement with previous studies
regarding similar materials and similar tests (Gurusideswar and Velmurugan [21],
Okoli [22]).
4. Bond behaviour of GFRP-brick under high strain rates
In this work it is intended to study the effect of high strain rates in the bond behaviour
of GFRP-brick strengthening systems. The main objective is to develop empirical
relations, based on experimental results, able to relate the maximum bond capacity with
the slip rate. These empirical relations are based on the DIF (Dynamic Increase Factor).
During the tests both the load profile and slip profile are necessary. The load profile
relates to the quasi-static reference allowing calculating the DIF (Eq. 5) and the slip
profile allows calculating the slip rate as the gradient of the slip-time curve. Similar
procedures were used previously (Hao and Tarasov [17], Pereira et al [18], Lourenço
and Pereira [19]).
Page 7
퐷퐼퐹 =푃푟표푝푒푟푡푦(푑푦푛푎푚푖푐)
푃푟표푝푒푟푡푦(푞푢푎푠푖 − 푠푡푎푡푖푐),푓(훿)̇
(5)
Different test setups have been used to characterize the bond behaviour of concrete-FRP
systems, some being already implemented in international standards such as the
American Concrete Institute (ACI 440). In the case of masonry-FRP systems, due to the
lack of standard test setups, similar setups have been used to study this phenomenon
(Ghiassi [24]). Single-lap shear bond tests consist in imposing a load in the FRP strip,
along its longitudinal direction (Figure 3a). Usually, the composite is applied to one of
the faces of the substrate, leaving enough FRP strip free to be connected to the
actuators.
Ghiassi [24] studied the bond behaviour of GFRP-brick systems using single-lap shear
bond tests under quasi-static conditions. These tests were performed with similar
specimens to those studied in this work, using the same materials. These tests under
quasi-static regime were performed using a servo-hydraulic actuator with a 50 kN
maximum capacity. The test specimens were placed in a steel support structure
(Figure 3b), specially designed for this purpose. The load profile was measured using a
load cell and the slip was measured using several LVDTs placed along the
reinforcement (Figure 3c). Five tests were performed (Figure 4) averaging a maximum
load of 9.22 kN (Figure 4a) and a maximum slip of 1.43 mm (Figure 4b). These tests
were performed under a slip rate of around 10-5 mm/ms. These results are used in this
work as the quasi-static reference for the DIF calculation.
In order to study the bond behaviour of these systems under high strain rates, a new test
setup was developed based on the drop weight concept. This new testing equipment and
the obtained results are presented in the following sections.
Page 8
4.1. Testing equipment
A drop weight tower specifically developed for single-lap shear bond tests was used for
the dynamic testing (Figure 5a). This tower allows a drop height up to 3 meters and a
drop weight with a minimum of 14 kg.
The load profile was measured at the free end of the GFRP strip using a load cell
specifically for dynamic applications – VETEK VZ101BH (Figure 5b). This load cell is
connected to a National Instruments Acquisition System. This acquisition system is
composed of a SCXI-1000DC chassis (Figure 5c), a SCXI-1600 data acquisition and
control card for PC connection and a generic input module SCXI-1520 with a SCXI-
1314 mount. The SCXI-1600 limits the sampling speed to 200 kS/s (200 samples per
millisecond), which was found to be enough even at a later stage where 4 channels
where used at the same time, allowing an acquisition frequency of 50 kHz per channel.
The deformation behaviour of the specimen was measured in two different ways. First,
a FastCam video camera was used. It is a PHOTRON FastCam APX – RS (Figure 5d)
with a maximum frame rate of 250 000 frames per second. This equipment allowed the
visualization of the test in slow motion and the measuring of the slip. This slip
measurement was possible using targets in the specimen at a specific location and
performing a tracking sweep of those targets in the video (Figure 6a). To perform the
tracking sweep, the TEMA Tracking Software (v: 3.1-005) was used. With the relative
position of the targets, the slip at each instance was calculated. The second methodology
used to obtain the deformation behaviour was using strain gauges. The strain gauges
used were BFLA-5-8-3L (Figure 6b) from TML and were the same used in the quasi-
static testing performed by Ghiassi [24].
Page 9
4.2. Specimens preparation
The application of GFRP reinforcement usually involves two steps: a) preparation of the
substrate surface and b) application of the reinforcement. The preparation of the
substrate surface, in this case clay brick, should be taken with special attention in order
to obtain a good bond between the two materials (Juvantes [25]). The bricks used in this
study, 200x100x55 mm bricks, were similar to those already studied and characterized
previously by Pereira et al [18], Lourenço and Pereira [19] and Ghiassi [24] under
different conditions. Initially the bricks were grinded (approximately 7 mm) in the face
where the reinforcement was applied, in order to improve the mechanical and chemical
bond capacity of the application (Ghiassi [24]). After this initial treatment the bricks
were washed and placed in an oven at 100 ºC for a period of 24 hours. After this period
the specimens were removed from the oven and cleaned with compressed air, making
sure that the surface was kept clear of any small particles.
With the surface prepared, the reinforcement application can be initiated. Firstly, a
primer is applied, only in the bonded area (the rest of the surface is protected with duct-
tape) (Figure 7a). The applied primer was a MAPEWARP PRIMER 1 and the bonded
area can be seen in Figure 7b. The GFRP reinforcement was composed of glass fibre
MAPEWRAP UNI-AX and MAPEWRAP 31 epoxy. In order to apply the
reinforcement, the procedure was the following:
a) Cut the glass fibres with the required dimensions (400x50 mm) and place two
metallic sheets in one end of the fibres for bracing (Figure 7b);
b) In the brick surface a layer of epoxy is applied using a brush;
c) In the fibres a layer of epoxy is also applied and the fibres are placed in the
correct position. In order to have full contact between the fibres and the surface
a foam roll is used;
Page 10
d) A new layer of epoxy is applied on top of the fibres and the foam roll is also
used to have an even distribution of the epoxy;
e) After 60 minutes the duct tape is removed and the specimens are left to cure at
ambient conditions for three weeks (Figure 7c).
It should be noted that the bond behaviour of these strengthening systems is much
dependant on the preparation of the specimens. Although the specimens used for impact
testing were not from the same batch as the specimens used for the quasi-static tests
from Ghiassi [24], the same procedure was used and the same technician supervised the
preparation of both batches.
4.3. Impact test results
A total of 20 specimens were tested with the drop-weight tower developed for dynamic
testing. Five tests were not considered in this document due to failure of acquiring data
during the test. The hammer weight was kept at 14 kg and the drop height varied from
10 to 40 cm. By varying the drop height, different impact energies are introduced in the
system leading to different strain rates. The acquisition sampling speed was kept at 24
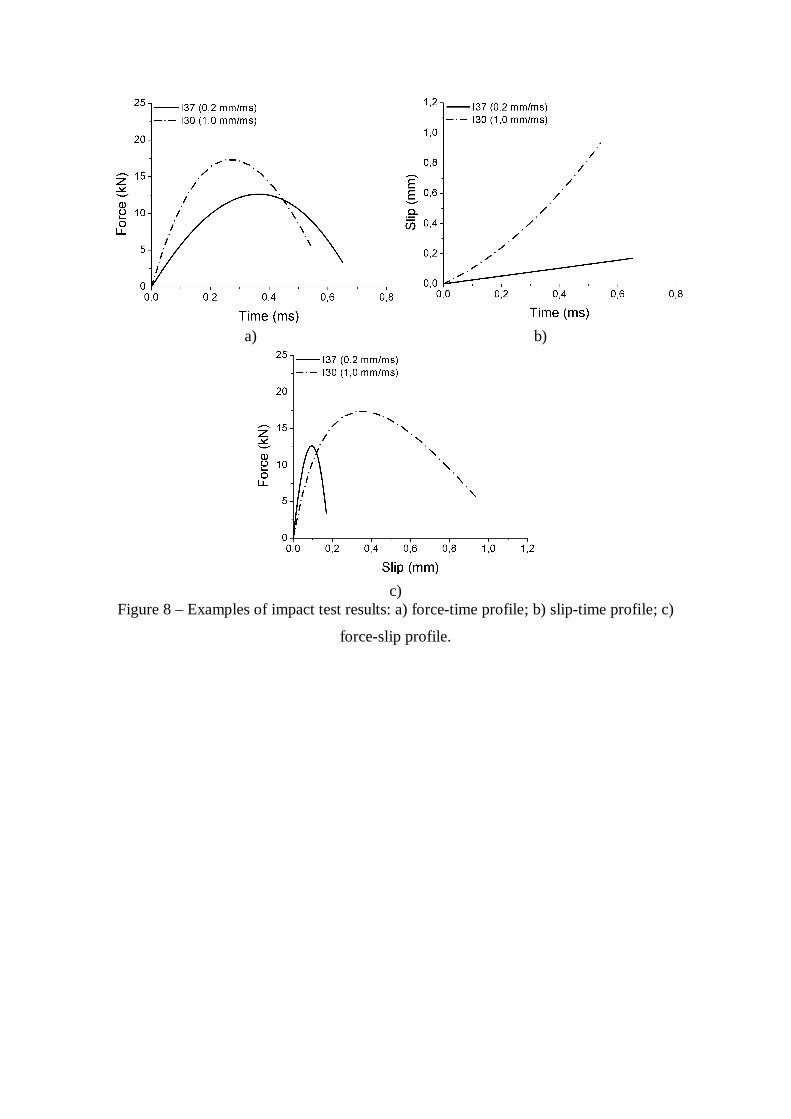
kHz for the force and strain profiles and 12000 fps for the video equipment. Figure 8
shows two examples for low (I37 – 0.2 mm/ms) and high (I30 – 1.0 mm/ms) slip rates
of force profile (Figure 8a), slip profiles (Figure 8b) and force-slip profiles (Figure 8c).
Figure 9 shows the typical failure modes obtained in the dynamic single-lap shear bond
tests, being similar to those obtained in the quasi-static tests by Ghiassi [24].
Table 1 shows the results obtained for the dynamic tests on GFRP-brick systems. It can
be seen that the maximum force ranged from 12.65 kN to 18.73 kN for slip rates of 0.06
mm/ms and 1.32 mm/ms, respectively. The slip rate was calculated as the gradient of
Page 11
the slip-time curve, similar procedure for strain rates was previously used (Hao and
Tarasov [17], Pereira et al [18])
It is clear that the slip rate influences the bond behaviour of these systems. For slip rates
of around 1 mm/ms the maximum force is about two times the maximum force obtained
for the same system under quasi-static conditions. This is equivalent to a 14 kg mass
being dropped at 40 cm. Using the quasi-static reference values from Ghiassi [24] it is
possible to calculate a Dynamic Increase Factor, as the relation between both the
reference and the dynamic test. With the relation between the Dynamic Increase Factor
(DIF) for the maximum force and the slip rate, it is clear how the slip rate influences the
bond behaviour of these systems (Figure 10). A trendline was obtained for slip rates
between 0.06 and 1.32 mm/ms (range of the performed tests). It was assumed that the
trendline would start, with the same orientation, from a DIF value of 1.00. Is was also
assumed that from the quasi-static slip rate until the point where the regime changes to
dynamic, the DIF remains constant and equal to 1.00. Further testing for smaller slip
rates is required to validate these assumptions.
The empirical relation that is able to translate the influence of the slip rate in the
maximum force of these GFRP-brick, based on the obtained trendline, can be presented
as Eq. (6), being the slip rate in mm/ms. This log-linear relation has an R2 of 75%,
which can be considered reasonable taking into consideration the nature of these
materials and these tests.
퐷퐼퐹(퐹 ) = 1푖푓2퐸 − 5 < 훿̇ < 2.71퐸 − 30,1554 ln(휀̇) + 1.9184푖푓2.71퐸 − 3 < 훿̇ < 1.32
(6)
As stated previously, tests using strain gauges were also performed. The two main
reasons for using the strain gauges are: (a) validate the video equipment acquisition
system, by comparing the slip from the two different sources; (b) determine the
Page 12
effective bond length in this dynamic regime. Three strain gauges were placed in each
specimen (50 mm spaced), as can be seen in Figure 7b. Figure 11 shows two examples
of the results obtained with strain gauges, for total detachment of the fabric (Figure 11a)
and partial detachment of the fabric (Figure 11b). As can be been in Figure 11 when the
first strain gauge is in plateau at maximum strain, the next strain gauge is registering a
very low strain value, close to zero. Knowing that the strain gauges are spaced 50 mm,
the effective bond length was considered to be 50 mm or less. This result for the
effective bond length is similar to the results obtained for the quasi-static regime, where
the same value for the effective bond length was determined by Ghiassi [24] meaning
that the slip rate does not influence the effective bond length of these systems. Because
when there is a detachment longer than the effective bond length, the maximum force is
already mobilized, this allow the inclusion of the experimental tests with a partial
detachment of 50 mm or higher in this analysis (Table 1; Figure 11).
As presented by Oliveira et al [26] and previously used by Ghiassi [24] it is possible to
estimate the slip profile (Figure 12) knowing the strain distribution along the
reinforcement at different instances, using the following:
훿 = 휀(푥)푑푥 (7)
With the slip profile obtained from the tests with strain gauges (Figure 12), it is possible
to compare these results with the ones obtained with the video tracking acquisition.
Table 2 shows the results obtained for the two different acquisition systems for the
selected specimens. Regarding the maximum slip, the results are very similar with the
exception of specimen I30 where the video equipment suggests almost the double of the
maximum slip suggested by the strain gauges. Regarding the slip rate, the results are
similar between both acquisitions. Adding these new results, obtained with strain
Page 13
gauges, to the results obtained with the video tracking acquisition (Figure 13) it is
possible to see that these values fit perfectly in the range obtained with the video
equipment, giving confidence in the obtained results. It is important to notice that
considering only the results from the strain gauges, the obtained trendline would have a
R2 of 95%. Although the smaller sample size (4 values) does have an impact in this
value, it seems that using strain gauges would improve the overall quality of the results.
However this technique increases considerably the costs involved in these experimental
studies.
5. Conclusions
An experimental campaign was performed to study the bond behaviour of GFRP
systems applied on clay bricks. Single-lap shear bond tests were considered to be the
most representative to study the bond behaviour of these systems under impulsive
loading. A new drop weight tower was developed specifically for this purpose allowing
masses over 14 kg and drop heights up to 3 meters. By varying the drop height it was
possible to introduce in the systems different slip rates, ranging from 0.06 mm/ms to
1.32 mm/ms.
From the obtained results it is clear that the slip rate influences the bond behaviour of
these systems. These results show that for slip rates of around 1 mm/ms there is an
increase of the maximum bond capacity of about two times the quasi-static value (with
slip rate of 10-5 mm/ms). These results, obtained with video tracking, were validated
with strain gauges along the reinforcement in some of the tests. These tests with strain
gauges also allowed determining the effective bond length, being the same as the
obtained in quasi-static regime. Leading to conclude that the slip rate does not influence
Page 14
the effective bond length of these systems, similar to what has been observed by
Al-Zubaidy [9].
The log-linear empirical relation translating the influence of the slip rate on the DIF for
the bond capacity of CFRP-Brick systems has been presented up to 1.32 mm/ms. This
empirical relation was assumed to be constant and equal to one from the quasi-static slip
rate until the intersection point with the trendline of the impulsive regime (2.7E-3
mm/ms). Additional tests with slip rates between 2.7E-3 mm/ms and 0.1 mm/ms are
required to validate this assumption. Also additional tests with slip rates higher than 1
mm/ms are required in order to verify if the proposed relation is valid for higher slip
rates or if the slope of the trendline changes. It should be noted that these results show
the bond behaviour between brick and GFRP and caution should be taken when
considering masonry structures (brick and mortar). The same type of experiments on
masonry units should be performed in order to evaluate possible differences in the bond
behaviour under high strain rates.
The failure modes obtained with these experimental tests under impulsive loading were
characterized by the ripping of a thin layer of brick. These failure modes are similar to
those obtained for quasi-static regime, leading to assume that the slip rate does not
influences the failure mode of these systems, similar to the observed by Al-Zubaidy [9].
As shown in this work the slip rate or the strain rate (depending on what is measured)
has considerable influence in the response of materials, including the bond behaviour of
modern reinforcement techniques and materials such as GFRP. This influence has to be
considered in the modelling and design of these systems under impulsive loading such
as impacts or blast loading, and need to be incorporated in the constitutive models of
Page 15
these materials under non-linear analysis; similar to what has been done previously for
masonry by Lourenço et al [27].
6. Acknowledgement
This work was performed under Project CH-SECURE (PTDC/EMC/120118/2010)
funded by the Portuguese Foundation of Science and Technology – FCT. The authors
acknowledge the support. The first author also acknowledges the support from his PhD
FCT grant with the reference SFRH/BD/45436/2008.
7. References
[1] Meyers MA. Dynamic behaviour of materials. John Wiley & Sons Publications,
USA 1994.
[2] Hiermaier SJ. Structures under crash and impact – continuum mechanics,
discretization and experimental characterization. Springer Publications,
Germany 2008.
[3] Ngo T, Mendis P, Hongwei M, Mak S. High strain rate behaviour of concrete
cylinders subjected to uniaxial compressive impact loading. In Proc. of the 18th
Australasian Conference on the Mechanics of Structures and Materials,
Australia, 2004.
[4] Stavrogin AN, Tarasov BG. Experimental physics and rock mechanics. Balkema
Publications, India 2001.
[5] Baylot J, Bullock B, Slawson T, Woodson S. Blast response of lightly attached
concrete masonry unit walls. Journal of Structural Engineering 2005; 131(8):
1186-1193.
[6] Moreland C, Hao H, Wu CQ. Response of retrofitted masonry walls to blast
loading. In Proc. of the 6th Asia-Pacific Conference on Shock and Impact Loads
on Structures, Australia 2005.
[7] Bakis CE, Bank LC, Brown VL, Cosenza E, Davalos JF, Lesko JJ, Mashida A,
Rizkalla SH, Triantafillou TC. Fiber-Reinforced Polymer Composites for
Page 16
Construction – State-of-the-art Review. Journal of Composites for Construction
2002; 6(2):73-87.
[8] Panpazopoulou SJ, Tastani SP, Thermou GE, Triantafillou T, Monti G, Bournas
D, Guadagnini M. Background to European seismic design provisions for the
retrofit of RC elements using FRP materials. Structural Concrete 2015; DOI:
10.1002/suco.201500102.
[9] Al-Zubaidy H, Xiao-Ling Z, Al-Mihaidi R. Experimental investigation of bond
characteristics between CFRP fabrics and steel plate joints under impact tensile
loads. Composite Structures 2012; 94(2):510-518.
[10] Shi J, Zhu H, Wu Z, Wu G. Experimental study of the strain rate effect of FRP
sheet-concrete interface. Tumu Gongcheng Xuebao/ China Civil Engineering
Journal 2012; 45(12):99-107.
[11] Li XQ, Yang ZJ, Chen JF, Lu Y. Loading rate effect on FRP-to-concrete Bond
Behaviour. Advanced Materials Research 2011; 250: 3571-3576.
[12] Shen D, Shi X, Ji Y, Yin F. Strain rate effect on bond stress-slip relationship
between basalt fiber-reinforced polymer sheet and concrete. Journal of
Reinferced Plastics & Composites 2015; 34(7):547-563.
[13] Grote D, Park S, Zhou M. Dynamic behaviour of concrete at high strain rates
and pressures. Journal of Impact Engineering 2001; 25(9): 869-886.
[14] Malvar LJ, Ross CA. Review of static and dynamic properties of steel
reinforcement bars. ACI Material Journal 1998; 95(5): 609-616.
[15] CEB-FIP. Comité euro-international du betón – model code 2010 – final draft.
Thomas Thelford Publications, Switzerland 2010.
[16] UFC 3-340-02. Structures to resist the effects of accidental explosions.
Department of Defence, USA 2008.
[17] Hao H, Tarasov BG. Experimental study of dynamic material properties of clay
brick and mortar at different strain rates. Australian Journal of Structural
Engineering 2008; 8(2):117-132.
[18] Pereira JM, Dias A, Lourenço PB. Dynamic properties of clay brick at different
strain rates. 12th Canadian Masonry Symposium, Vancouver 2013.
[19] Lourenço PB, Pereira JM. Characterization of masonry behaviour under high
strain rates. SAHC2014 – 9th International Conference on Structural Analysis of
Historical Constructions, Mexico 2014.
Page 17
[20] Asprone D, Cadoni E, Prota A, Manfredi G. Dynamic behaviour of a
Mediterranean natural stone under tensile loading. International Journal of
Rock Mechanics and Mining Sciences 2009; 46(3):514-520.
[21] Gurusideswar S, Velmurugan R. High strain rate sensitivity of glass/epoxy/clay
nanocomposites. ICCST/10 – International Conference on Composite Science
and Technology, Lisbon 2015.
[22] Okoli O. The effects of strain rate and failure modes on the failure energy of
fiber reinforced composites. Composite Structures 2001; 54:299-303.
[23] Correia P, Peixinho N. Static and Dynamic Tensile Behavior of Unidirectional
Glass/Epoxy Composites. Advanced Materials Research 2014; 1016:298-301.
[24] Ghiassi B. Durability analysis of bond between composite materials and
masonry substrates. PhD-thesis, University of Minho, Portugal 2013.
[25] Juvantes LFP. Strengthening and reinforcement of reinforced concrete
structures using CFRP composites. PhD-thesis, University of Porto, Portugal,
1999.
[26] Oliveira DV, Basilio I, Lourenço PB. Experimental bond behaviour of FRP
sheets glued on brick masonry. Journal of Composite for Construction 2010;
14(3):312-323.
[27] Lourenço PB, Rafsanjani SH, Pereira JM. A constitutive three-dimensional
interface model for masonry walls subjected to high strain rates. The twelfth
International Conference on Computational Structures Technology, Italy 2014.
Page 18
Table captions:
Table 1 – Impact tests on GFRP-brick specimens.
Table 2 – Comparison between video equipment and strain gauges results.
Page 19
Figure captions:
Figure 1 – DIFs for clay brick mechanical properties (Pereira et al [18], Lourenço and
Pereira [19]).
Figure 2 – GFRP strips tensile strength at different strain rates by Correia and
Peixinho[23].
Figure 3 – Single-lap shear bond tests: a) test schematic; b) steel support structure; c)
LVDT positioning (Ghiassi [24]).
Figure 4 – GFRP-brick quasi-static results: a) force-time profile; b) slip-time profile
(Ghiassi [24]).
Figure 5 – Test setup: a) drop weight tower setup; b) load cell; c) acquisition system; d)
video equipment.
(1) Photron video equipment; (2) Drop weight tower; (3) load cell; (4) hammer; (5)
specimen; (6) acquisition systems; (7) PC; (8) Strain gauges.
Figure 6 – Deformation acquisition: a) targets for video tracking; b) strain gauges.
Figure 7 – Specimens: a) specimen preparation; b) specimen geometry; c) final aspect
of the specimens.
Figure 8 – Examples of impact test results: a) force-time profile; b) slip-time profile; c)
force-slip profile.
Figure 9 – Examples of failure modes: a) total detachment of the fabric; b) partial
detachment of the fabric.
Figure 10 – Dynamic increase factor for shear capacity at different slip rates.
Figure 11 – Examples of strain gauges signal acquisition: a) total detachment of the
fabric; b) partial detachment of the fabric.
Figure 12 – Example of slip-time profile obtained from strain gauges.
Figure 13 – Dynamic increase factor for shear capacity of GFRP-brick at different slip
rates.
Page 20
Table 1 – Impact tests on GFRP-brick specimens.
Specimen Drop height (cm)
PHOTRON Load cell DIF
Failure mode
(Detachment length)
Maximum slip (mm)
Slip rate (mm/ms)
Maximum force (kN)
Quasi-static [19]
1.49 2E-5 9.22 1.00 Total
I37 11 0.19 0.06 12.65 1.37 Partial 5cm I41 15 0.32 0.07 14.97 1.62 Partial 5cm I7 16 0.17 0.08 14.66 1.59 Partial 7cm I25 14 0.14 0.09 13.16 1.43 Partial 5cm I1 17 0.29 0.10 14.94 1.62 Partial 6cm I20 16 0.45 0.13 14,85 1.61 Partial 6cm I40 19 0.49 0.15 15.96 1.50 Partial 7cm I26 21 0.41 0.25 16.81 1.82 Total I3 18 0.53 0.44 17.66 1.92 Partial 5cm I31 25 0.76 0.57 16.65 1.81 Total I46 30 0.84 0.74 17.15 1.86 Total I44 31 0.87 0.77 17.64 1.91 Total I36 28 0.58 0.83 15.64 1.70 Total I30 37 1.00 0.87 17.29 1.88 Total I49 36 1.28 1.32 18.73 2.03 Total
Page 21
Table 2 – Comparison between video equipment and strain gauges results.
Strain Gauges PHOTRON
Specimen Max Slip
(mm)
Slip rate (mm/ms)
Strain rate (/s)
Max Slip
(mm)
Slip rate (mm/ms)
Force (kN) DIF
I41 0.31 0.10 2.6 0.32 0.07 14.97 1.62 I40 0.36 0.23 2.5 0.49 0.15 15.96 1.73 I46 0.86 0.70 3.7 0.84 0.74 17.15 1.86 I30 0.56 0.98 7.4 1.00 0.87 17.29 1.88
Page 22
Figure 1 – DIFs for clay brick mechanical properties (Pereira et al [18], Lourenço and
Pereira [19]).
Page 23
Figure 2 – GFRP strips tensile strength at different strain rates by Correia and
Peixinho[23].
Page 24
a)
c) b)
Figure 3 – Single-lap shear bond tests: a) test schematic; b) steel support structure; c)
LVDT positioning (Ghiassi [24]).
Page 25
a) b)
c)
Figure 4 – GFRP-brick quasi-static results: a) force-time profile; b) slip-time profile
(Ghiassi [24]).
Page 26
a) b) c) d)
Figure 5 – Test setup: a) drop weight tower setup; b) load cell; c) acquisition system; d)
video equipment.
(1) Photron video equipment; (2) Drop weight tower; (3) load cell; (4) hammer; (5)
specimen; (6) acquisition systems; (7) PC; (8) Strain gauges.
Page 27
a) b)
Figure 6 – Deformation acquisition: a) targets for video tracking; b) strain gauges.
Page 28
a) b) c)
Figure 7 – Specimens: a) specimen preparation; b) specimen geometry; c) final aspect
of the specimens.
Page 29
a) b)
c)
Figure 8 – Examples of impact test results: a) force-time profile; b) slip-time profile; c)
force-slip profile.
Page 30
a) b)
Figure 9 – Examples of failure modes: a) total detachment of the fabric; b) partial
detachment of the fabric.
Page 31
Figure 10 – Dynamic increase factor for shear capacity at different slip rates.
Page 32
a) b)
Figure 11 – Examples of strain gauges signal acquisition: a) total detachment of the
fabric; b) partial detachment of the fabric.
Page 33
Figure 12 – Example of slip-time profile obtained from strain gauges.
Page 34
Figure 13 – Dynamic increase factor for shear capacity of GFRP-brick at different slip
rates.