UNIVERSITY OF BELGRADE SCHOOL OF ELECTRICAL ENGENNERING Giuma Saleh Isa Abudagel Experimental Characterization of Magneto-Optical Properties of Faraday Crystal Applied in Magnetic Field Sensor Doctoral Dissertation Belgrade, 2018
Transcript
UNIVERSITY OF BELGRADE
SCHOOL OF ELECTRICAL ENGENNERING
Giuma Saleh Isa Abudagel
Experimental Characterization of
Magneto-Optical Properties of Faraday
Crystal Applied in Magnetic Field Sensor
Doctoral Dissertation
Belgrade, 2018
UNIVERZITET U BEOGRADU
ELEKTROTEHNIČKI FAKULTET
Giuma Saleh Isa Abudagel
Eksperimentalna karakterizacija magneto-
optičkih osobina Faradejevog kristala
namenjenog za konstrukciju senzora
magnetskog polja
doktorska disertacija
Beograd 2018.
Mentor of Doctoral Dissertation Associate prof. Dr. Slobodan Petricevic University of Belgrade, School of Electrical Engineering Members of Committee: Full prof. dr Zlatan Stojković University of Belgrade, School of Electrical Engineering Dr Nebojša Romčević, scientific adviser University of Belgrade, Institute of Physics, Belgrade
Associate prof. dr Peđa Mihailović University of Belgrade, School of Electrical Engineering Assistant prof. dr Marko Barjaktarović University of Belgrade, School of Electrical Engineering
Defense date: ________________
Acknowledgements
First of all I would like thank my supervisor Professor Slobodan Petricevic
who have guided me and given me a lot of useful thoughts and ideas and for
help me in the experimental work. I would also like to doctor Pedja Mihailovic
for helping me in the experiment work especially on part of crystal transmission,
also I would like to thank doctor Nebojsa Romcevic for crystal samples
preparation. Finally, I am grateful to my parents and my wife, my son, and
daughters for their love, carrying hardship travel and alienation.
Dissertation Title: Experimental Characterization of Magneto-Optical Properties
of Faraday Crystal Applied in Magnetic Field Sensor
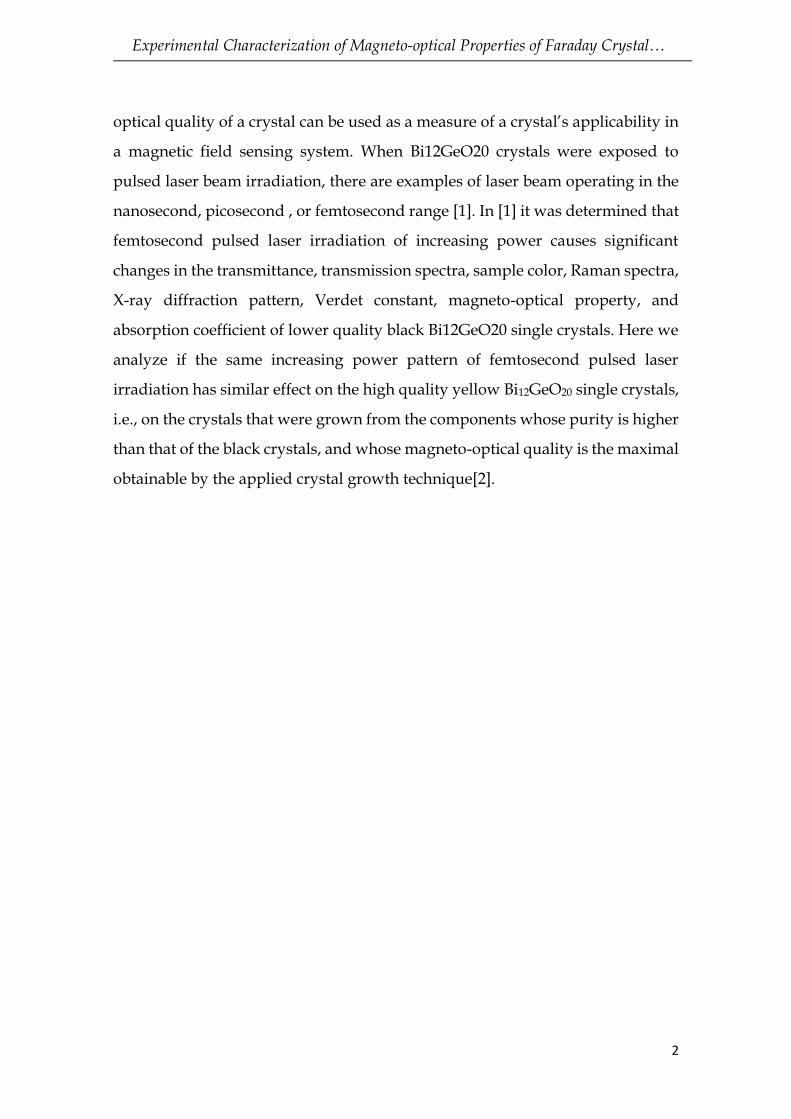
Abstract: The thesis explores preparation and magneto properties of bismuth
germanium oxide single crystal (B12GeO20) which is irradiated by pulsed
femtosecond laser of increasing power. Analyses performed on irradiated and
un irradiated samples showed significant changes in transmittance, transmission
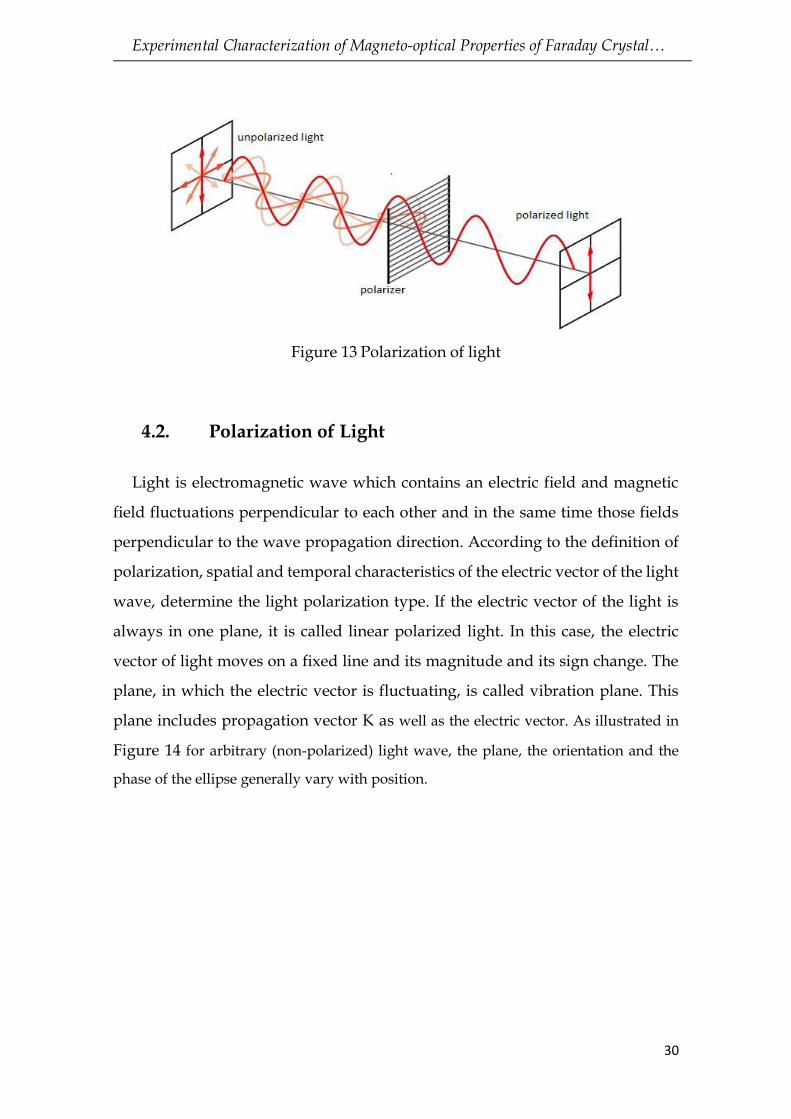
Experimental Characterization of Magneto-optical Properties of Faraday Crystal…
50
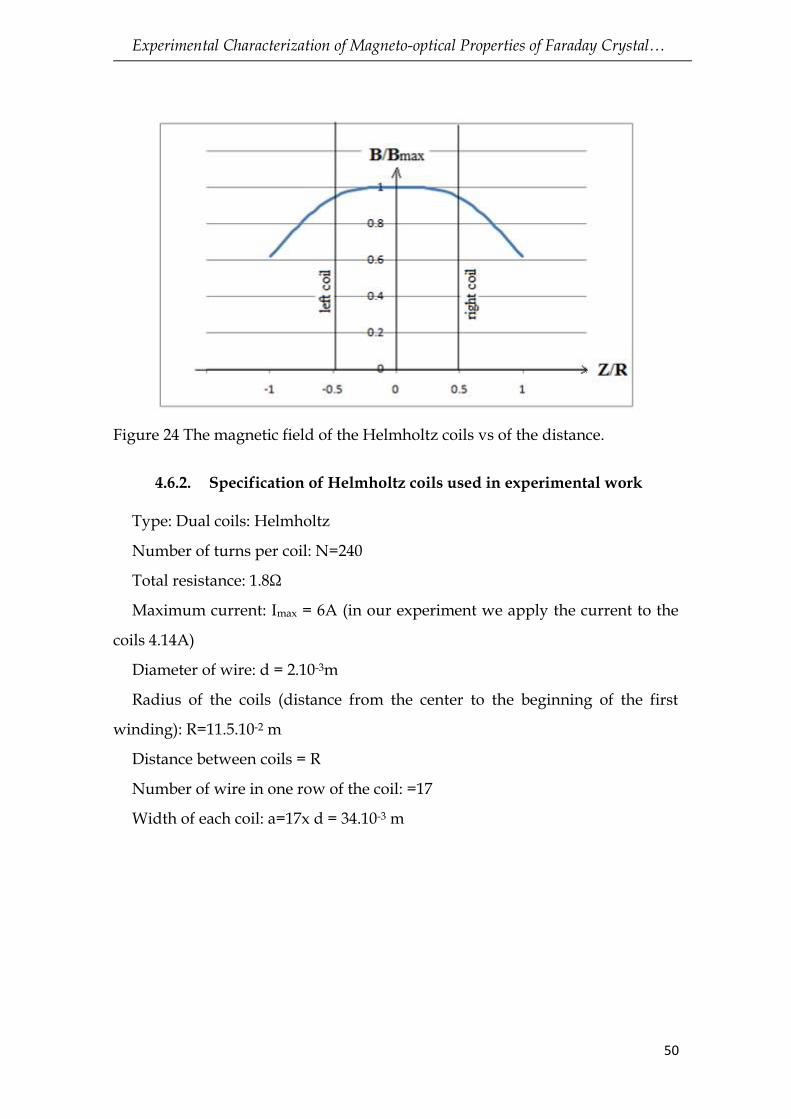
Figure 24 The magnetic field of the Helmholtz coils vs of the distance.
4.6.2. Specification of Helmholtz coils used in experimental work
Type: Dual coils: Helmholtz
Number of turns per coil: N=240
Total resistance: 1.8Ω
Maximum current: Imax = 6A (in our experiment we apply the current to the
coils 4.14A)
Diameter of wire: d = 2.10-3m
Radius of the coils (distance from the center to the beginning of the first
winding): R=11.5.10-2 m
Distance between coils = R
Number of wire in one row of the coil: =17
Width of each coil: a=17x d = 34.10-3 m
Experimental Characterization of Magneto-optical Properties of Faraday Crystal…
51
4.6.3. Experimental verification of the magnetic induction created by
the Helmholtz Coils
Since almost all equations tend to treat the magnetic induction in the crystal to
be of uniform nature it would be advisable that the magnetic induction intensity
be verified by an experiment. Such verification involves a magnetic sensor
(preferably of different nature than the Faraday sensor) that can sample the
magnetic induction value in a small volume, much smaller than the size of the
Helmholtz coils. Since the coil volume is quite large, positioning the sensor and
sampling the volume must be automated to avoid positioning mistakes. Further,
an automated data acquisition system must be constructed to acquire the
induction value and present the data in an understandable manner.
Scanning configuration is presented in Figure 25. A DC memsic magnetic
sensor (SH) was mounted on a plastic arm (L profile) that can move in a volume
of interest using two motorized positioner (MP) mounted in a cross
configuration. Using this arrangement it was possible to scan bigger part of the
coils volume in one plane (a 2D scan). This motorized stage block can be
controlled from the PC to automatize movements and readings. Sensor data was
acquired using measurement acquisition system (MAS) also connected to PC to
deliver data. Coils (HC) were powered from the current source (CS).
Experimental Characterization of Magneto-optical Properties of Faraday Crystal…
52
.
Figure 25 Setup for magnetic induction measurement.
A typical scan run involves PC controlling the motor stages thus moving the
sensor across a plane inside (typically y-z) and outside of the coils (x-y). A
constant current is powering the coils in order to make induction stable and
readings of the induction value were recorded for induction component in the
desired plane. We have chosen to measure induction in the Z direction since
crystals are oriented in the same way. It was possible to move the sensor in a 200
mm x 200 mm area that is much bigger than the crystal and covers the area in the
coils.
A sample scan in y-z plane is presented in Figure 26 with the crystal shape
symbolically placed in the magnetic induction in position that will be used for
Faraday Effect measurement. It can be seen that the induction is not constant in
the entire coil volume, yet it is very constant (surface plot is flat) in the area
covered by the crystal.
Experimental Characterization of Magneto-optical Properties of Faraday Crystal…
53
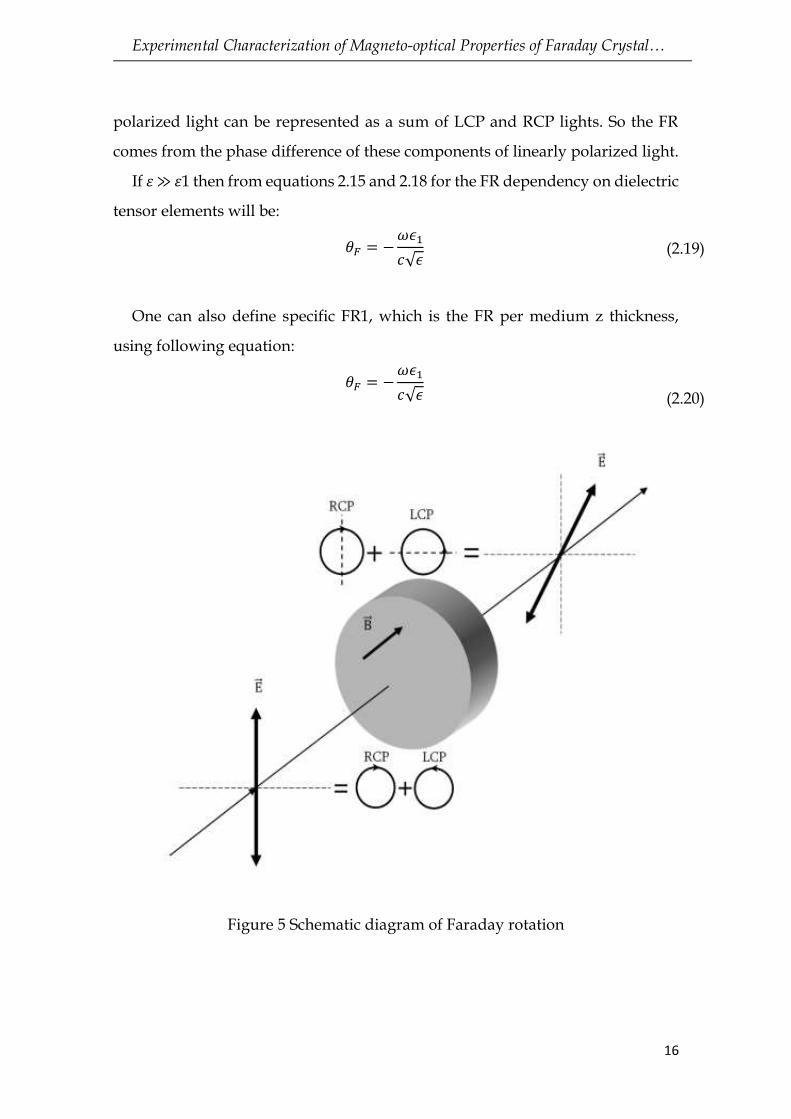
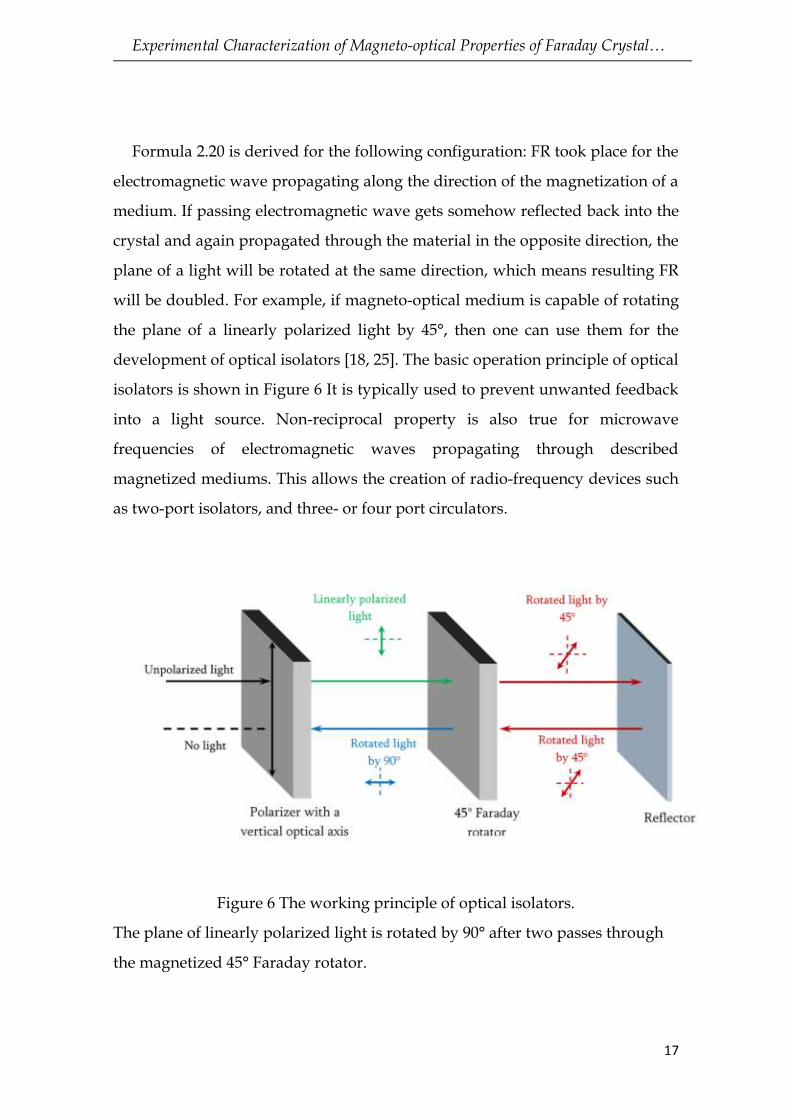
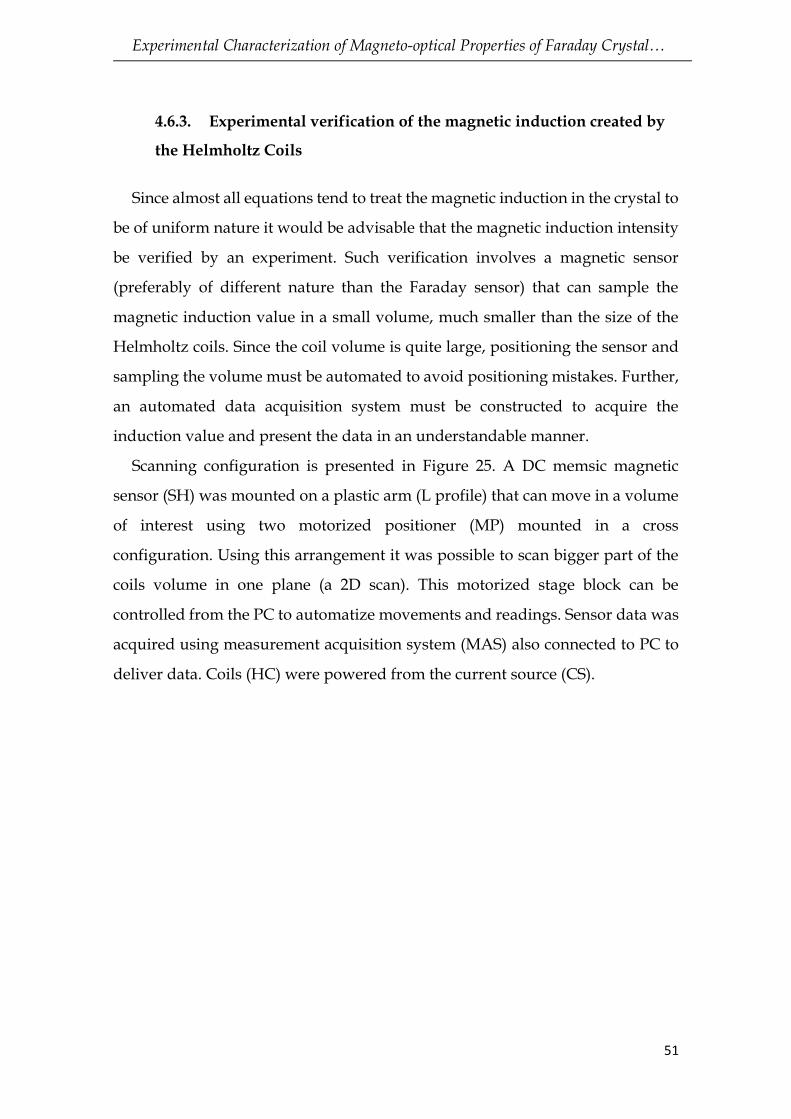
Figure 26 Magnetic induction inside the Helmholtz coils with symbolic shape of
the crystal immersed in the homogeneous magnetic field.
This data matches the induction flatness calculated in Figure 24 and proves
that it is correct to assume that the induction value is constant in the crystal
volume. In addition, magnetic field outside the coils is seen in Figure 27 for
information purposes.
Experimental Characterization of Magneto-optical Properties of Faraday Crystal…
54
Figure 27 Magnetic induction Outside Coils
Experimental Characterization of Magneto-optical Properties of Faraday Crystal…
55
5. Polarimetric Faraday Effect Magnetic Field Sensor
5.1. Sensor configurations
In order to detect the Faraday effect there are two most common sensor
configurations transmition and reflection configurations. In this chapter these
two configurations will be described as well as the components.
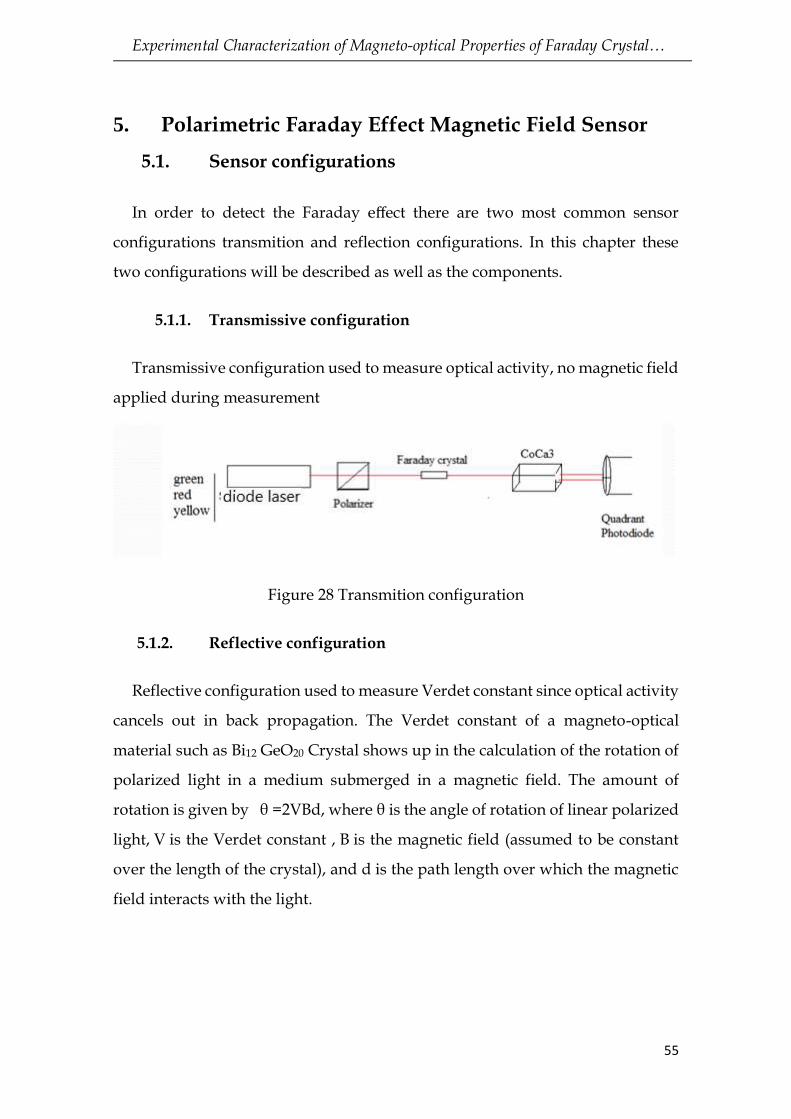
5.1.1. Transmissive configuration
Transmissive configuration used to measure optical activity, no magnetic field
applied during measurement
Figure 28 Transmition configuration
5.1.2. Reflective configuration
Reflective configuration used to measure Verdet constant since optical activity
cancels out in back propagation. The Verdet constant of a magneto-optical
material such as Bi12 GeO20 Crystal shows up in the calculation of the rotation of
polarized light in a medium submerged in a magnetic field. The amount of
rotation is given by θ =2VBd, where θ is the angle of rotation of linear polarized
light, V is the Verdet constant , B is the magnetic field (assumed to be constant
over the length of the crystal), and d is the path length over which the magnetic
field interacts with the light.
Experimental Characterization of Magneto-optical Properties of Faraday Crystal…
56
Figure 29 Reflective configuration
5.2. Sensors Classification
Intrinsic
Sensors use fiber as the sensing element
Extrinsic
The magnetic field is measured using a crystal
For Faraday rotation detection, polarimetric configuration was used instead
of interferometric, because it has some advantages.
Small amount of optical material that is needed
Short and simple optical path
The capability of constructing a portable sensor
Less signal processing
5.3. Extrinsic Faraday Effect Sensor
The measuring head depicted in Figure 30 was designed to provide two
antiphase channels for θ measurement and normalization. The two channels
designed for the Faraday rotation detection are constructed in reflection so that
the optical activity as a reciprocal effect cancels. In addition, the optical path is
doubled as well as the Faraday rotation. Since the refraction index of BGO crystal
is 2.55 there is sufficient light in the reflection without any kind of mirror.
Experimental Characterization of Magneto-optical Properties of Faraday Crystal…
57
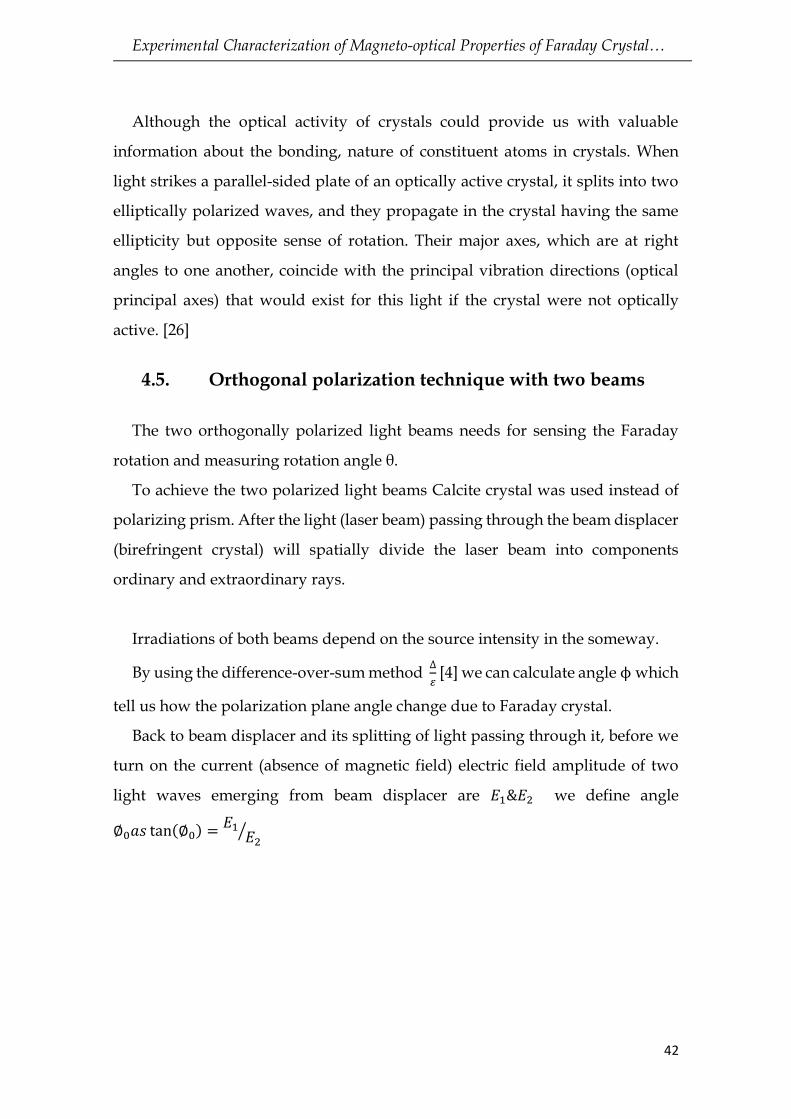
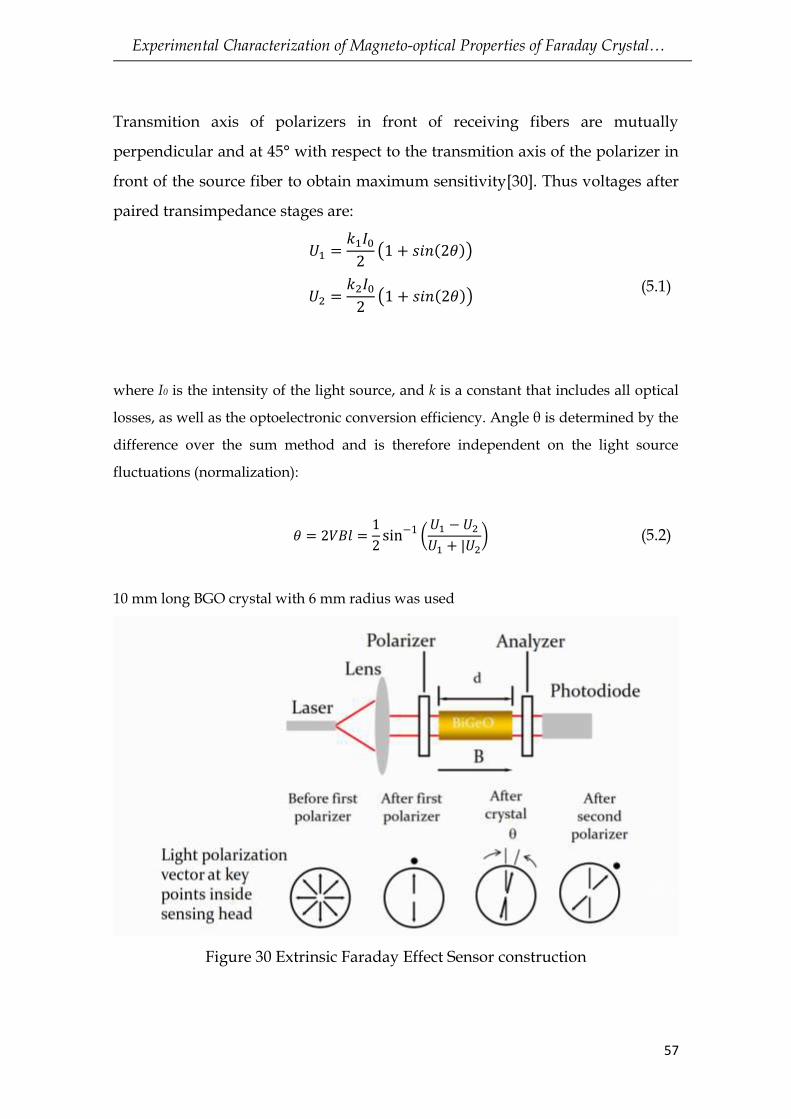
Transmition axis of polarizers in front of receiving fibers are mutually
perpendicular and at 45° with respect to the transmition axis of the polarizer in
front of the source fiber to obtain maximum sensitivity[30]. Thus voltages after
paired transimpedance stages are:
𝑈1 =
𝑘1𝐼02(1 + 𝑠𝑖𝑛(2𝜃))
𝑈2 =𝑘2𝐼02(1 + 𝑠𝑖𝑛(2𝜃))
(5.1)
where I0 is the intensity of the light source, and k is a constant that includes all optical
losses, as well as the optoelectronic conversion efficiency. Angle θ is determined by the
difference over the sum method and is therefore independent on the light source
fluctuations (normalization):
𝜃 = 2𝑉𝐵𝑙 =
1
2sin−1 (
𝑈1 −𝑈2𝑈1 + |𝑈2
) (5.2)
10 mm long BGO crystal with 6 mm radius was used
Figure 30 Extrinsic Faraday Effect Sensor construction
Experimental Characterization of Magneto-optical Properties of Faraday Crystal…
58
Fiber-optic current sensor (FOCS) technique. It's also based on the Faraday
Effect. There is several advantages of FOCS compared to conventional iron-core
current transformers: the immunity to electromagnetic interference noncontact
measurement, high dynamic range, compact design, and impossibility of
explosion and high bandwidth that allows harmonic analysis of current represent
the main advantages of FOCS from the electrical power industry aspect.
Experimental Characterization of Magneto-optical Properties of Faraday Crystal…
59
6. Non-contact temperature measurement of the
Faraday crystal temperature
Temperature is one expression for the kinetic energy of the vibrating atoms
and molecules of matter. This energy can be measured by various secondary
phenomena, e.g., change of volume or pressure, electrical resistance,
electromagnetic force, electron surface charge, or emission of electromagnetic
radiation. The most frequently used temperature scales are Celsius and
Fahrenheit, which divide the difference between the freezing and boiling points
of water into 100° and 180°, respectively. The thermodynamic scale begins at
absolute zero, or 0 Kelvin, the point at which all atoms cease vibrating and no
kinetic energy is dissipated. K = –273.15°C = –459.67°F
6.1. Non-contact temperature measurement advantages
The noncontact temperature measurement has some advantages which is
absent in contact temperature measurement methods.
It is fast (in the ms range) time is saved, allowing for more measurements and
accumulation of data (determination of temperature field).
It facilitates measurement of moving targets (conveyor processes).
Measurements can be taken of hazardous or physically inaccessible objects
(high-voltage parts, great measurement distance).
Measurements of high temperatures (greater than 1300°C) present no
problems. In similar cases, contact thermometers cannot be used, or have a
limited life.
There is no interference, no energy is lost from the target. For example, in the
case of a poor heat conductor such as plastic or wood, measurements are
extremely accurate with no distortion of measured values, as compared to
measurements with contact thermometers.
Experimental Characterization of Magneto-optical Properties of Faraday Crystal…
60
There is no risk of contamination and no mechanical effect on the surface of
the object; thus wear-free. Lacquered surfaces, for example, are not scratched and
soft surfaces can also be measured.
6.1.1. Determining Emissivity
There are various methods for determining the emissivity of an object. First,
you can find the emissivity of many frequently used materials in a table.
Emissivity tables also help you find the right wavelength range for a given
material, and, so, the right measuring device. Particularly in the case of metals,
the values in such tables should only be used for orientation purposes since the
condition of the surface (e.g. polished, oxidized or scaled) can influence
emissivity more than the various materials themselves. It is possible to determine
the emissivity of a particular material yourself using different methods. To do so,
you need a pyrometer with emissivity setting capability.
Heat up a sample of the material to a known temperature that you can
determine very accurately using a contact thermometer (e.g. thermocouple).
Then measure the target temperature with the IR thermometer. Change the
emissivity until the temperature corresponds to that of the contact thermometer.
Now keep this emissivity for all future measurements of targets on this material.
At a relatively low temperature (up to 260°C), attach a special plastic sticker
with known emissivity to the target. Use the infrared measuring device to
determine the temperature of the sticker and the corresponding emissivity. Then
measure the surface temperature of the target without the sticker and re-set the
emissivity until the correct temperature value is shown. Now, use the emissivity
determined by this method for all measurements on targets of this material.
Create a blackbody using a sample body from the material to be measured.
Bore a hole into the object. The depth of the borehole should be at least five times
its diameter. The diameter must correspond to the size of the spot to be measured
with your measuring device. If the emissivity of the inner walls is greater than
0.5, the emissivity of the cavity body is now around 1, and the temperature
Experimental Characterization of Magneto-optical Properties of Faraday Crystal…
61
measured in the hole is the correct temperature of the target. If you now direct
the IR thermometer to the surface of the target, change the emissivity until the
temperature display corresponds with the value given previously from the
blackbody. The emissivity found by this method can be used for all
measurements on the same material.
If the target can be coated, coat it with a matte black paint ("3-M Black" from
the Minnesota Mining Company or "Senotherm" from Weilburger Lackfabrik ,
either which have an emissivity of around 0.95). Measure the temperature of this
blackbody and set the emissivity as described previously [31].
Notice that, the second thickness were used in our case for measuring the
samples emissivity.
6.2. Infrared Measurement Technology, Pyrometry
The recognition of radiation heating of a hot body belongs to the basic
experiences of mankind. The measurement of temperature radiation (infrared
radiation) to determine the temperature of a body is one of the newer
temperature measurement methods in the industrial sector.
In a pyrometer the thermal radiation emanating from a body is focused by a lens
on a radiation receiver. As receiver, thermocouples, photomultipliers,
photoresistors, photo-diodes etc. can be used. The “heat radiation “generates an
electrical signal which can be utilized to determine the temperature.
A differentiation is made between the various pyrometer types, such as total
radiation pyrometer, spectral pyrometer, radiation density pyrometer,
distribution pyrometer and disappearing filament pyrometer.
Pyrometers can replace contacting thermometers only in a few applications.
More often they are used to supplement contacting methods in areas where no
or unsatisfactory results occur. Basically, pyrometry, in contrast to contacting
methods, can only measure the heat on the surface.
Experimental Characterization of Magneto-optical Properties of Faraday Crystal…
62
The application focus is the temperature measurement on surfaces, on fast
moving parts, on objects with minimal heat capacity or heat conductivity, on
objects with fast changing temperatures and on objects which are not easily
accessible. Also products which cannot be touched due to sterilization or
processing constraints (e.g. in the food industry) are suitable for temperature
measurements with pyrometers [32].
6.3. Thermal Imaging Cameras
In principle the thermal imaging camera has the same physical effects as a
pyrometer.
However, the pyrometers determine the average temperature of the entire
surface being measured while the thermal imaging camera produces a thermal
picture of the object. Area sensors are used for this. The number of available
detector elements defines the quality of the picture.
Thermal imaging cameras are primarily used today to monitor and control
machinery, electrical and mechanical systems and objects in which localized
heating could damage or destroy the item as well as where heat losses are to be
determined.
Experimental Characterization of Magneto-optical Properties of Faraday Crystal…
63
Figure 31 Intensity of detected signal (temperature) for crystal & tape measured
by radiation thermometer (at the beginning of heat transfer).
The difference of the information density can be clearly noticed
Figure 32 Intensity of detected signal (temperature) for crystal & tape,
measured by radiation thermometer (at Thermal equilibrium).
The difference of the thermal information almost zero
Experimental Characterization of Magneto-optical Properties of Faraday Crystal…
64
6.3.1. Setup for calibration of the radiation thermometer using the
infrared camera
An IR thermometer can be compared to the human eye. The lens of the eye
represents the optics through which the radiation (flow of photons) from the
object reaches the photosensitive layer (retina) via the atmosphere. This is
converted into a signal that is sent to the brain. Fig. 33 shows an infrared
measuring system process flow.
Figure 33 Calibration of the radiation thermometer
6.4. Verification of the temperature measurement method
It is possible to measure the temperature of the crystal by measuring ∆θ0 by ∆
/ Σ at the moment when the magnetic field induction is zero. There are two such
points per period, and further averaging is also possible since the temperature
changes slowly. This makes this method inherently capable of good signal-to-
noise ratios since averaging the temperature at, say, 100 points (2 points per
period, 50 period per second, and 1 reading of temperature per second)
significantly improves the SNR.
After the determination of temperature, it is possible to calculate V(T), and this
eliminates the temperature influence on the sensor transfer function. In other
words the temperature can be calculated as
Experimental Characterization of Magneto-optical Properties of Faraday Crystal…
65
𝑇 = 𝑇(∆𝜃0) (6.1)
Once the temperature of the crystal sample is determined, it is possible to
compensate the current measurement and obtain the compensated measured
current as
𝐼𝑐 = 𝑉(𝐵,𝑇(∆𝜃0)) =
𝑉(𝑇0)
𝑉(𝑇) 𝐼(𝑇) (6.2)
In order to calculate the temperature of the crystal sample, it is necessary to
know the optical activity of the crystal versus temperature. The temperature
dependence of the 𝐵𝑖12𝐺𝑒𝑂20 optical activity was measured, and the reported
value is 0.0001 rad/mmK = 0.00573 deg/mmK. It is possible to construct a setup
that would simultaneously measure the optical activity and the Verdet constant
against temperature and thus calibrate the sensor transfer function. Thus, with
knowledge of the temperature dependence of both the optical activity of the
crystal and the Verdet constant, it is possible to calculate the Faraday crystal
sample temperature, calculate V(T), and adjust (compensate) the calculated
current to make it temperature-insensitive [31].
6.5. Radiation thermometer characteristics
A solid understanding of infrared technology and its principles lies behind
accurate temperature measurement. When the temperature is measured by a
noncontact device, the IR energy emitted from the measured object passes
through the optical system of the thermometer and is converted to an electrical
signal at the detector. This signal is then displayed as a temperature reading.
There are several important factors that determine accurate measurement. The
most important factors are emissivity, distance-to-spot ratio, field-of-view, and
location of a hot spot [33].
Experimental Characterization of Magneto-optical Properties of Faraday Crystal…
66
6.5.1. Emissivity
All objects reflect, transmit, and emit energy. Only the emitted energy
indicates the temperature of the object. When IR thermometers measure the
surface temperature they sense all three types of energy, therefore all
thermometers have to be adjusted to read emitted energy only. Measuring errors
are often caused by infrared (IR) energy being reflected by light sources. Some IR
thermometers allow you to change the emissivity in the unit. The value of
emissivity for various materials can be looked up in published emissivity tables.
Other units have a fixed, preset emissivity of 0.95, which is the emissivity value
for most organic materials and painted or oxidized surfaces. If you are using a
thermometer with a fixed emissivity to measure the surface temperature of a
shiny object, you can compensate by covering the surface to be measured with
masking tape or flat black paint. Allow time for the tape or paint to reach the
same temperature as the material underneath. Measure the temperature of the
taped or painted surface. That is the true temperature.
6.5.2. Distance-to-spot ratio
The optical system of an infrared thermometer collects the infrared energy
from a circular measurement spot and focuses it on the detector. Optical
resolution is defined by the ratio of the distance from instrument to the object
compared to the size of the spot (90% of energy) being measured (DSR). The
larger the ratio number the better the instrument’s resolution, and the smaller the
spot size that can be measured.
The laser sighting included in some instruments only helps to aim at the
measured spot. A recent innovation in infrared optics is the addition of a Close
Focus feature, which provides accurate measurement of small target areas
without including unwanted background temperatures.
Experimental Characterization of Magneto-optical Properties of Faraday Crystal…
67
6.5.3. Field-of-view (FOV)
Make sure that the target is larger than the spot size the unit is measuring.
The smaller the target, the closer you should be to it. When accuracy is critical,
make sure that the target is at least twice as large as the spot size.
Figure 34 Measured target temperature & field of view
6.5.4. Radiation thermometer Specifications
In table shown below we can see the specification of radiation thermometer
used in the experiments [33].
Table 4 Radiation thermometer Specifications
Distance To Target Size Ratio (D:S)50:1
Emissivity Adjustable
Sighting Type3-point laser
Laser Class Class II
Min Temperature (° F) -25
Max Temperature (° F) 1600
Min Temperature (° C) -30
Max Temperature (° C) 900
Experimental Characterization of Magneto-optical Properties of Faraday Crystal…
68
Accuracy ±0.75% reading or ±2.0°F (±1.0°C),
whichever is greater
Resolution 0.2°F (0.1°C)
RS-232 Interface Yes
Battery AA Battery (2)
Description Model Noncontact Infrared Thermometer with Digital
Photography, Close Focus
Specification for the green laser used in experiments is obtained from [34].
Table 5 Green Laser Specification
Model GLM-5
Power 1 – 3 mW 3 – 5 mW 5 – 10 mW
Wavelength 532nm
Power 5 – 10 mW
Output Mode CW (continuous wave) +
modulation (DC – 10kHz, digital)
Operating Voltage 9V
Operating Current < 400mA
Beam Divergence < 1.4 mrad
Dimension 20 x 50 mm
Operating Temperature 25~30 °C
Experimental Characterization of Magneto-optical Properties of Faraday Crystal…
69
7. Measuring of the optical activity and Verdet constant
7.1. Setup for measurement of optical activity against
wavelength and temperature
Faraday crystal (𝐵𝑖12𝐺𝑒 𝑂20) is next in the optical path causing rotation of the
polarization plane due to its own temperature-dependent optical activity and the
temperature-dependent Faraday effect.
The magnetic field is created by Helmholtz coils (HC) powered from an AC
current source with a reference ampermeter connected in series. The relation
between the magnetic induction in the coil center and the coil current (I) is
known; thus, it is possible to measure the Verdet constant.
CaCO3 is used as a beam splitter producing two coaxial beams with
polarization planes set 90 ◦ apart. The intensities of the two beams emerging from
the BS are sensed using two quadrants from four quadrant photodiodes (QPDs).
This is preferred to two individual photodiodes since the quadrants on a
quadrant photodiode are more closely matched in responsivity. The
photocurrents from the diodes are amplified with transimpedance amplifiers
(DUAL TIA) and sampled using a 16-bit dual ADC. The results are relayed to a
PC over a USB interface and using a FIFO to prevent data loss. An electronic
processing unit (ECB) is encased in a Faraday cage to minimize EMI effects. The
temperature of the crystal is controlled by placing the HC and the crystal in an
enclosed chamber with temperature control. The chamber is depicted as a gray
area in the picture. The chamber contains a temperature measurement unit
(Radiation thermometer) for monitoring the crystal temperature [35].
Experimental Characterization of Magneto-optical Properties of Faraday Crystal…
70
Figure 35 Optical Activity Setup
Figure 36 The mounting setup used to suspend the crystal in the Helmholtz
coils magnetic field.
Experimental Characterization of Magneto-optical Properties of Faraday Crystal…
71
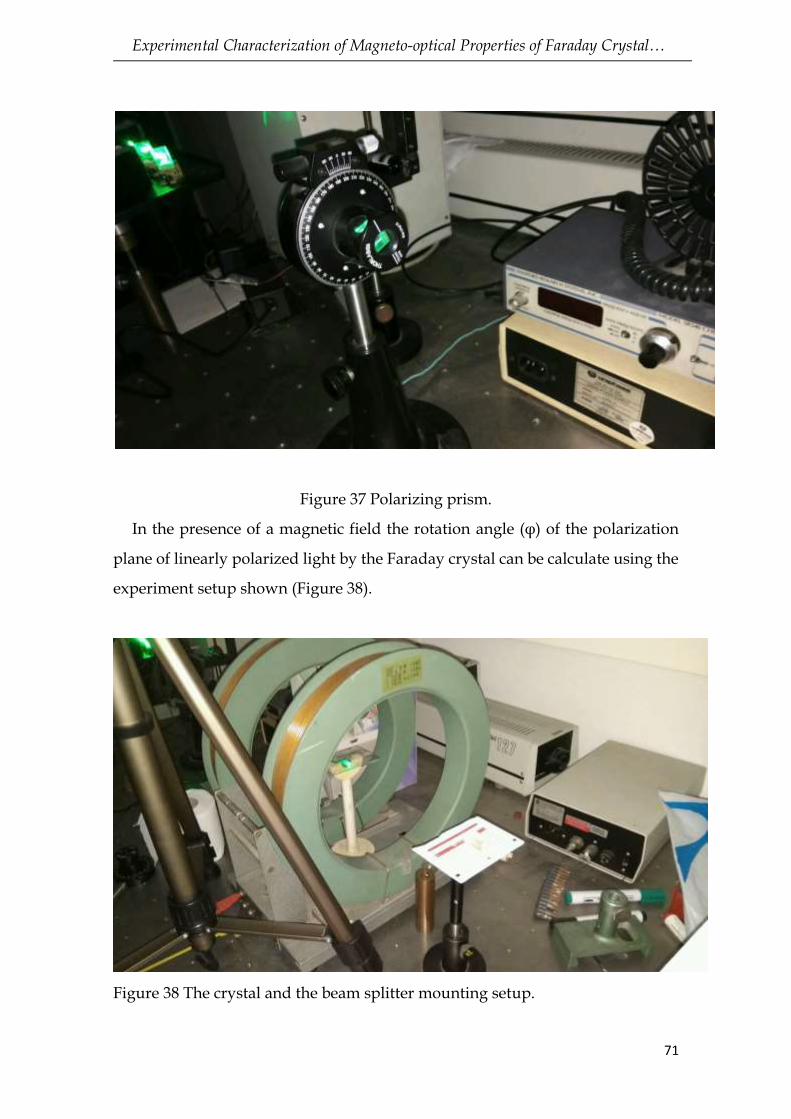
Figure 37 Polarizing prism.
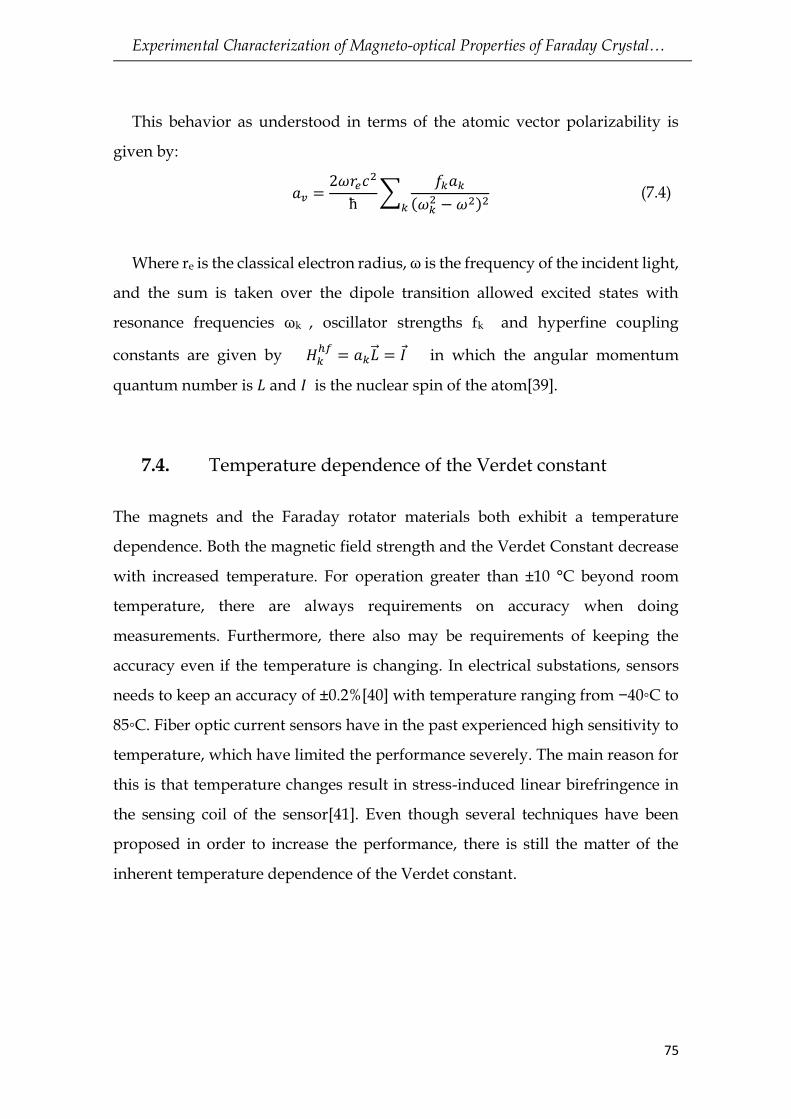
In the presence of a magnetic field the rotation angle (φ) of the polarization
plane of linearly polarized light by the Faraday crystal can be calculate using the
experiment setup shown (Figure 38).
Figure 38 The crystal and the beam splitter mounting setup.
Experimental Characterization of Magneto-optical Properties of Faraday Crystal…
72
7.2. Measuring of the Verdet constant
The Verdet constant is a measure of how strong the Faraday Effect is in a
particular material. The Verdet constant is also wavelength dependent and will
be affected by temperature. In order to keep high sensitivity for the sensor a
stable Verdet constant is required which in turn will put certain requirement on
both the material and the wavelength of operation.
The Verdet constant is calculated from
𝑉 =
Ө0𝐴𝐶𝐵0𝑙
=1
2𝐵0𝑙sin−1 [
𝑈1 − 𝑈2𝑈1 + 𝑈2
]0𝐴𝐶
(7.1)
where ӨAC is the amplitude of the AC signal, B0 is the amplitude of the
magnetic induction, whereas U1 and U2, are the output signal voltages obtained
after transimpedance stages from the vertically and horizontally polarized
components, respectively. The FFT was used to separate spectral components of
U1 and U2. The Faraday rotation was determined from the magnitude of the 50
Hz component. The absorption coefficients were obtained by measuring the
difference in beam intensities at the quadrant photodiode[36] with and without
BGO crystal in the beam path. The reflection on the BGO crystal was calculated
using the normal incidence and BGO refraction index of BGO, n = 2.55. The
absorption coefficient, α, was calculated from the beam intensities with and
without the crystal present in the beam path, I(x) and I(0), and the known crystal
length l = 9.8 mm as
𝐼(𝑙) = 𝐼0𝑒
−𝛼[𝑦𝑖𝑒𝑙𝑑𝑠→ 𝛼 = −
1
𝑙ln𝐼(𝑙)
𝐼0 (7.2)
Experimental Characterization of Magneto-optical Properties of Faraday Crystal…
73
The magneto-optical quality is calculated by dividing the Verdet constant by
the absorption coefficient. The obtained results are given in Table 6
Table 6 Magneto-optical properties of irradiated and unirradiated high purity
crystal samples
Property Unirradiated
sample
Irradiated sample
Verdet constant (rad T–1m–1) 72 72
Absorption coefficient (cm–1) 0.58 0,34
Magneto-optical quality (rad T–1) 1.24 2.1
The data given in Table 6 show the effects of femtosecond laser irradiation on
the magneto-optical properties of the high purity BGO crystal. The irradiation
caused 41.4% decrease in the absorption coefficient and did not influence the
Faraday constant. Consequently, the increase in crystal transparency resulted in
a significant 70% increase in the magneto-optical quality. As explained earlier,
increase in crystal transparency is an important gain from the point of view of a
sensor system since the system-level signal-to-noise ratio is directly proportional
to the magneto-optical quality of a crystal. Therefore, it is expected that the
signal-to-noise ratio of a sensor system would be improved by the same amount
as the improvement in the magneto-optical quality induced by the irradiation.
Consequently, it can be concluded that the femtosecond pulsed laser irradiation
affects the crystal in a positive manner.
Experimental Characterization of Magneto-optical Properties of Faraday Crystal…
74
7.3. Wavelength dependence of the Verdet constant
Early quantum mechanical considerations of visible and ultraviolet light
propagating through gaseous materials predicted a Verdet constant that varies
approximately as the square of the frequency, where 𝜈 ∝ 1/𝜆. Generally, the
Faraday Effect description reflected H. Becquerel's derived classical expression
for the Verdet constant,
𝑉 =
𝜔(𝑛−𝑛+)
2𝑐𝐵𝑙= (𝑒𝜆 2𝑚𝑐⁄ )𝑑𝑛 𝑑𝜆⁄ (7.3)
which shows that V is proportional to the dispersion, 𝑑𝑛/𝑑𝜆 . This describes a
change in the index of refraction as a function of wavelength, where, in the long
wavelength regime, as shown in Figure 39 , The Verdet constant is inversely
proportional to the wavelength squared, 1/λ2 [37].
Figure 39 The Verdet constant for various materials as a function of the
wavelength [38].
Experimental Characterization of Magneto-optical Properties of Faraday Crystal…
75
This behavior as understood in terms of the atomic vector polarizability is
given by:
𝑎𝑣 =
2𝜔𝑟𝑒𝑐2
ħ∑
𝑓𝑘𝑎𝑘(𝜔𝑘
2 − 𝜔2)2𝑘 (7.4)
Where re is the classical electron radius, ω is the frequency of the incident light,
and the sum is taken over the dipole transition allowed excited states with
resonance frequencies ωk , oscillator strengths fk and hyperfine coupling
constants are given by 𝐻𝑘ℎ𝑓= 𝑎𝑘�⃑� = 𝐼 in which the angular momentum
quantum number is 𝐿 and 𝐼 is the nuclear spin of the atom[39].
7.4. Temperature dependence of the Verdet constant
The magnets and the Faraday rotator materials both exhibit a temperature
dependence. Both the magnetic field strength and the Verdet Constant decrease
with increased temperature. For operation greater than ±10 °C beyond room
temperature, there are always requirements on accuracy when doing
measurements. Furthermore, there also may be requirements of keeping the
accuracy even if the temperature is changing. In electrical substations, sensors
needs to keep an accuracy of ±0.2%[40] with temperature ranging from −40◦C to
85◦C. Fiber optic current sensors have in the past experienced high sensitivity to
temperature, which have limited the performance severely. The main reason for
this is that temperature changes result in stress-induced linear birefringence in
the sensing coil of the sensor[41]. Even though several techniques have been
proposed in order to increase the performance, there is still the matter of the
inherent temperature dependence of the Verdet constant.
Experimental Characterization of Magneto-optical Properties of Faraday Crystal…
76
7.5. Experimental Results
Table 7 Results of absorptions and Rotations of plane polarization of crystals
due to magnetic field using experiment setup shown in Figure 35
Crystal Type Cur
rent
[A]
Rotation
[deg]
Absorption -
with crystal
Absorption -
without crystal
Crystal length
[mm]
Reference
Crystal 4,14 0,62 0,316 0,78 10
Z11 4,14 0,62 0,404 9,9
C11 4,14 0,315 0,065 9,7
C12 4,14 0,395 0,083 9,7
C13 4,14 0,502 0,11 9,6
C14 4,14 0,514 0,099 9,54
Background
level 0,065
Temperature
24 [deg]
Table 8 Results of Verdet constant (V)& Magneto Optical Quality (MOQ), for
different samples of crystals.
Sample Current[A] Length [m] Rotation
[deg]
Rotation
[rad]
Magnetic
field [T]
Verdet
const
[rad/mT]
MOQ [rad/T]
Reference
crystal 4.14 0.01 0.62 0.0108 0.0053 203.77 2.04
Z11 4.14 0.0099 0.62 0.0108 0.0053 205.83 2.04
C11 4.14 0.0097 0.315 0.0055 0.0053 106.98 1.04
C12 4.14 0.0097 0.395 0.0069 0.0053 134.22 1.30
C13 4.14 0.0096 0.502 0.0088 0.0053 172.96 1.66
C14 4.14 0.00954 0.514 0.0090 0.0053 178.00 1.70
Experimental Characterization of Magneto-optical Properties of Faraday Crystal…
77
The Magneto optical quality (MOQ), of reference crystal and the crystal Z11
are same, although their Verdet constants are nearly same that is supposed to be
happened because the small difference in their lengths.
For other crystals samples, (C11, C12, C13& C14), we can see from the results
that the proportionality between the Magneto optical quality and the Verdet
constant.
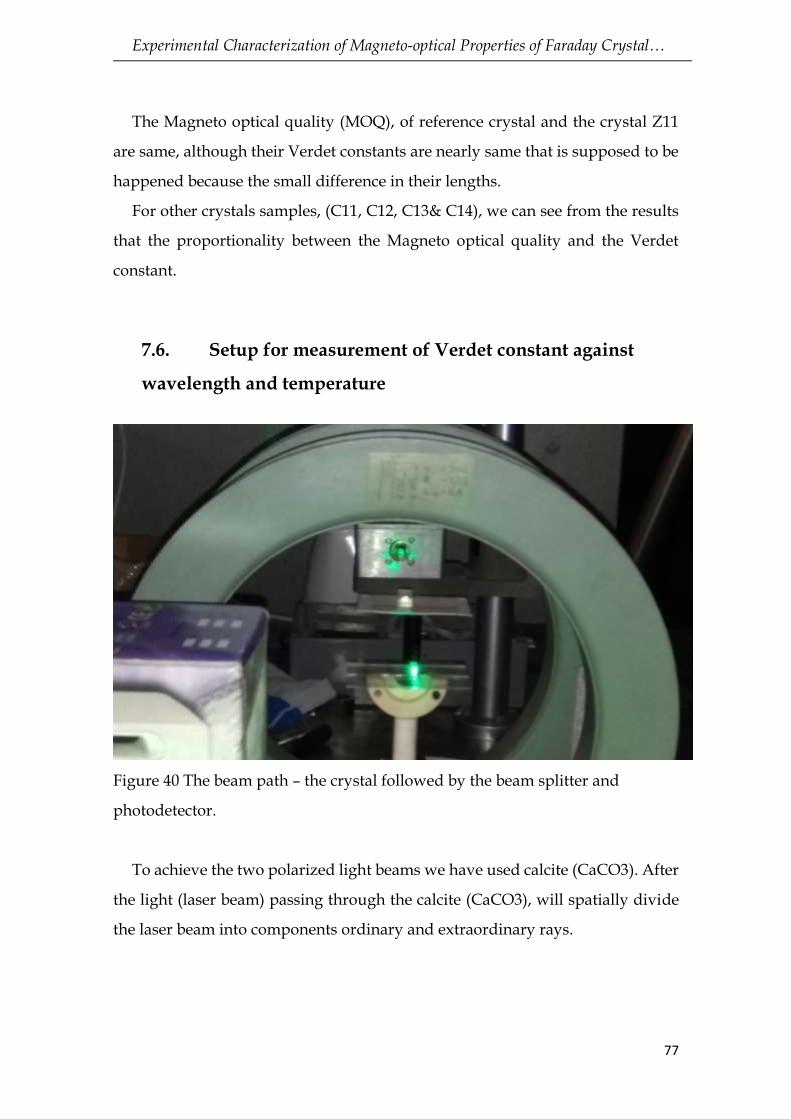
7.6. Setup for measurement of Verdet constant against
wavelength and temperature
Figure 40 The beam path – the crystal followed by the beam splitter and
photodetector.
To achieve the two polarized light beams we have used calcite (CaCO3). After
the light (laser beam) passing through the calcite (CaCO3), will spatially divide
the laser beam into components ordinary and extraordinary rays.
Experimental Characterization of Magneto-optical Properties of Faraday Crystal…
78
Figure 41 Beam splitter action on the polarized green laser beam following
optically active crystal.
Figure 42 Laser beam spots on the photodiode detector following the beam
splitting process.
Experimental Characterization of Magneto-optical Properties of Faraday Crystal…
79
7.7. Effects of laser irradiation on the BiGeO crystal
The equipment used to produce the femtosecond pulsed laser beam and
establish its wavelength was the Coherent Mira 900F femtosecond laser,
Coherent Verdi V-10 pump laser that provided a 532 nm continuous wave pump
beam, and Ocean Optics HR2000CG UV-NIR spectrometer. Crystal samples were
irradiated along the crystal growth direction (z), i.e. along the samples’ longest
axis. The irradiating laser beam radius provided partial irradiation of the exposed
crystal facet. The beam wavelength was 800 nm, whereas its power was increased
from 50 mW to 950 mW and was adjusted by a graded filter. The pulses were 90
fs long and had repetition rate of 76 MHz The samples were irradiated by each
beam power for 3 s. The beam power was measured with the Ophir power meter
with the thermal and photometric heads. In order to enable comparison of the
irradiation effects on the single crystal samples of different purity, i.e., on yellow
and black Bi12GeO20 samples, the irradiation conditions were intentionally
chosen to be identical to those applied to the lower purity black crystals in[1].
The sample color was calculated from the transmission spectra measured by the
Beckman Coulter DU 720 General Purpose UV/VIS spectrometer.
7.7.1. Transmission spectra
The irradiation pattern applied here to the higher purity yellow crystals is
identical to the one utilized in [2] to irradiate black crystals grown from the
components of lesser purity. Consequently, the obtained results can be compared
and the differences can be attributed solely to different sample purity. With the
increase of irradiating laser power, the transmittance of irradiated sample
undergoes initial growth followed by a decrease, as can be seen in Figure 43
Comparison with the dependence corresponding to the black crystal given in[1]
reveals that the transmittance curves for the black as well as for the yellow crystal
has the same shape and that the slopes of the two curves appear to be
approximately equal. The curve corresponding to the yellow crystal is shifted to
Experimental Characterization of Magneto-optical Properties of Faraday Crystal…
80
the larger values by approximately 18.8% compared to the curve corresponding
to the black crystal. For the yellow crystal, the maximal transmittance of 44.0%
occurs at the irradiating laser power of 451 mW, whereas the lower purity black
crystal was reported in [1] to have the smaller maximal transmittance value of
25.1% corresponding to 455 mW. It seems that both curves exhibit local
irregularities which occur at 197.4–249.7 mW, 552–605 mW and 800–857 mW for
the black crystal and at 593–641 mW for the yellow crystal. It is possible that the
irregularity in the yellow sample curve for large values of incident power P 0 is
not visible because it is outside the considered range of irradiating laser power,
or due to insufficient measurement accuracy achieved for yellow crystal data
points above 700 mW.
Figure 43 Change of crystal transmittance with increase of irradiating laser
power
For each value of the incident power P0, a sample is irradiated by the
femtosecond laser beam for 3s. The transmittance is given as P1 /P0, where P1 is
the transmitted power. The error bars were calculated from the uncertainties of
measured values of the incident and transmitted power, ΔP0 and ΔP1.
Experimental Characterization of Magneto-optical Properties of Faraday Crystal…
81
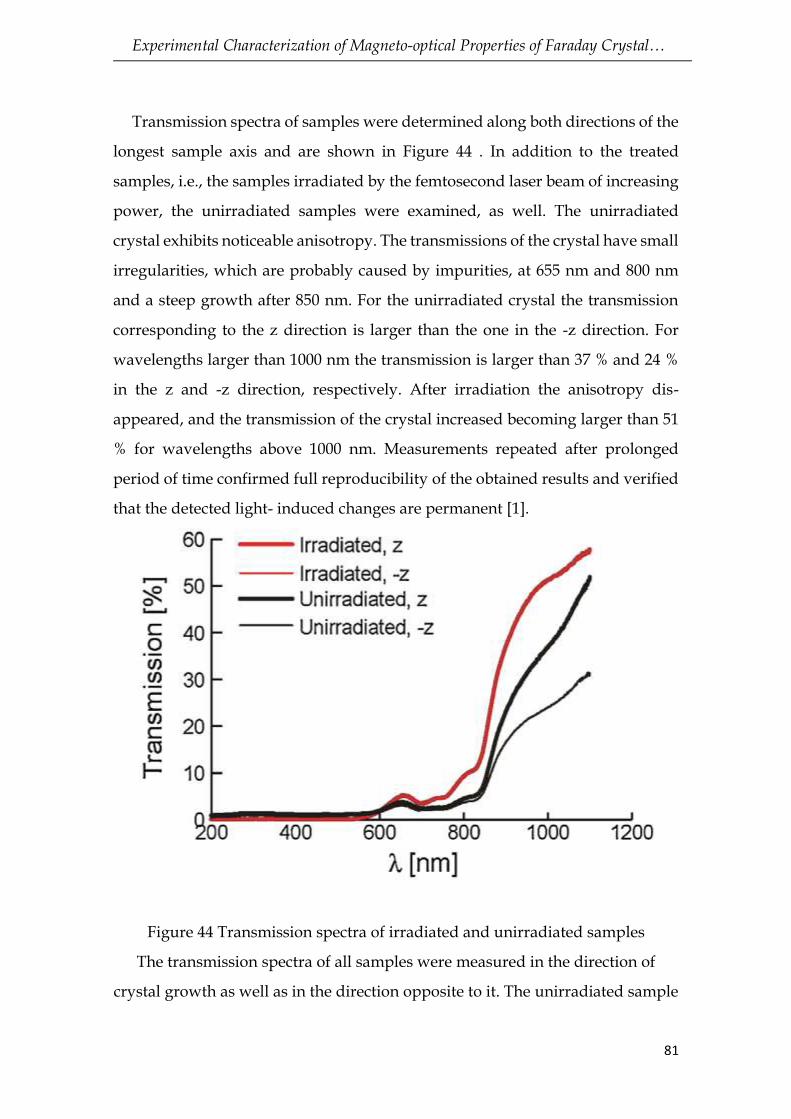
Transmission spectra of samples were determined along both directions of the
longest sample axis and are shown in Figure 44 . In addition to the treated
samples, i.e., the samples irradiated by the femtosecond laser beam of increasing
power, the unirradiated samples were examined, as well. The unirradiated
crystal exhibits noticeable anisotropy. The transmissions of the crystal have small
irregularities, which are probably caused by impurities, at 655 nm and 800 nm
and a steep growth after 850 nm. For the unirradiated crystal the transmission
corresponding to the z direction is larger than the one in the -z direction. For
wavelengths larger than 1000 nm the transmission is larger than 37 % and 24 %
in the z and -z direction, respectively. After irradiation the anisotropy dis-
appeared, and the transmission of the crystal increased becoming larger than 51
% for wavelengths above 1000 nm. Measurements repeated after prolonged
period of time confirmed full reproducibility of the obtained results and verified
that the detected light- induced changes are permanent [1].
Figure 44 Transmission spectra of irradiated and unirradiated samples
The transmission spectra of all samples were measured in the direction of
crystal growth as well as in the direction opposite to it. The unirradiated sample
Experimental Characterization of Magneto-optical Properties of Faraday Crystal…
82
exhibits significant anisotropy, which disappears after irradiation. Irradiation
also causes transmission increase.
7.7.2. Chromacity diagram
The change of Bismuth Germanium oxide single crystal (Bi12GeO20) color
caused by irradiation was noticeable to the naked eye. It was calculated from the
transmission spectra measured by the Beckman Coulter DU 720 General Purpose
UV/VIS spectrometer [2].
Figure 45 Sample colors in CIE chromaticity diagram.
The change in the crystal color was visible to the naked eye [2].
7.7.3. X-ray spectra
The X-ray diffraction patterns were measured with the Rigaku Ultima IV
Multipurpose X-ray diffraction system. The system was operated at 40 kV and 40
mA to produce nickel-filtered CuK a 1 X-ray with l = 0.1540 nm. The XRD data
Experimental Characterization of Magneto-optical Properties of Faraday Crystal…
83
were collected in the 2 u range between 20 and 70 at the scanning rate of 5 1/min.
The phase analysis was performed using the PDXL2 software, version 2.0.3.0[42].
7.7.4. Raman spectra
The Raman spectra of unirradiated and irradiated samples are recorded at
room temperature in the spectral range from 150 to 800 cm–1 and are shown in
Figure 46 The results obtained for unirradiated crystals are in agreement with
those given in[1] After irradiation the intensity of the F(TO) peak at 203 cm–1
decreased, whereas all other peaks became more pronounced. Despite the
difference in purity between the yellow samples studied here and the black
crystals considered in[36] the Raman spectra of unirradiated crystals do not differ
significantly. As reported in [36], irradiation of the black crystal caused all the
peaks of symmetry type E, i.e., the peaks at 234, 454, and 619.6 cm–1 , to disappear
and intensity increase of all other peaks. The change in the same Raman spectrum
peaks of
Bi12GeO20 was reported in[22]; however, the most, medium, and least intense
peaks correspond to the annealed, doped, and untreated samples, respectively.
Figure 46 Raman spectra. Irradiation caused a small upward shift of the crystal
spectrum except for the F(TO) type peak at 203cm-1
Experimental Characterization of Magneto-optical Properties of Faraday Crystal…
84
8. Results and discussions
This section will present results obtained in experiments in application
perspective trying to correlate experimental data with engineering application.
8.1. Optical activity of the BiGeO crystal with respect to
temperature
Temperature dependence of the change of optical activity of the BiGeO crystal
from set point obtained by experiments described in chapter 7 is shown in the
Figure 47. Difference in the variation of optical activity versus temperature of the
crystal and the laser wavelength implies not only that the wavelength is an
important factor in the design of a non-reflective configuration for a magnetic
field sensor but also opens a possibility to detect the crystal temperature using
wavelength multiplexing.
30 40 50 60 70 80 90 100
-20
-15
-10
-5
0
5
Incre
me
nta
l O
ptical A
ctivity []
Temperature [C]
Figure 47 BiGeO change of optical activity versus temperature.
For a single wavelength excitation in a transmissive configuration temperature
will affect the rotation of the plane of polarization due to its effect on optical
Experimental Characterization of Magneto-optical Properties of Faraday Crystal…
85
activity. Within a range of temperatures that were measured the shift will range from 5° up to 12° regardless of the magnetic field in the crystal. If a Δ/Σ method is used to determine plane of polarization rotation (θ) this shift will be detected and could create false indication of the magnetic field intensity change. Given small values of Verdet constant for a BiGeO crystal and small crystal lengths of few millimeters, optical activity temperature shift can easily mask the measurement. This issue is further complicated by the fact that temperature frequency spectra is close to DC thus preventing the magnetic field intensity measurement by frequency separation in the spectrum. Such an error is not acceptable and cannot be eliminated by calibration. In addition to creating an issue in Δ/Σ configuration, optical activity creates equal concern in an AC/DC normalization scheme. Verdet constant of the BiGeO crystal with respect to temperature. Variation of the Verdet constant with temperature is shown in
Figure 48 (experiments from chapter 7) that demonstrates that Verdet constant
decreases with increasing temperatures. A typical BiGeO crystal exhibits
0.5°/T/mm decrease in Verdet constant on a 30°C-70°C temperature range.
30 40 50 60 70 80 90 100
3.0
3.2
3.4
3.6
3.8
4.0
4.2
4.4
4.6
4.8
5.0
5.2
5.4
5.6
5.8
6.0
Verd
et consta
nt [
/T/m
m]
Temperature [C]
Figure 48 BiGeO Verdet constant versus temperature.
Experimental Characterization of Magneto-optical Properties of Faraday Crystal…
86
This change in Verdet constant is the chief reason that causes the optical
magnetic field or current sensors to show temperature dependent error, since
value of magnetic field intensity is usually calculated from
𝐵(𝑇) =
𝜃
𝑉(𝑇)𝑙(𝑇)
(8.1)
Since crystals expand thermally, crystal length l is also a function of temperature,
but the coefficient of thermal expansion of a BGO crystal is small with the value
of a = 16.8·10-6 K-1 thus making l(T) change negligible [27]. This change is actually
welcome, since increasing l with temperature compensates a little for decreasing
V with temperature, but insufficiently.
In a general case, rotation of the plane of polarization θ is caused by both the
Faraday Effect and optical activity
𝜃(𝑇) = 𝜃𝐹(𝑇) + 𝜃𝑂𝐴(𝑇) (8.2)
Aside from crystal expansion, when a crystal is subjected to temperature change
at least three additional variations take place:
1. Verdet constant changes with temperature θF(T)
2. Optical activity varies with temperature θOA(T)
3. Light source wavelength shift with temperature λ(T)
In a general case one can write
1 1 OAF
dd V d V l
dT V dT T l T dT
(8.3)
with various terms having different values depending on the sensor
configuration. Also, in a serious sensor design light source temperature is
regulated in such a manner so as to preserve the wavelength, i.e. wavelength shift
with temperature is negligible. Having this in mind and negligible crystal
expansion for a transmissive configuration Eq. (8.3) can be simplified to
Experimental Characterization of Magneto-optical Properties of Faraday Crystal…
87
1 OAF
dd V
dT V T dT
(8.4)
However, for a reflective configuration Eq. (8.4) is further simplified to
1F
d V
dT V T
(8.5)
since optical activity cancels out.
One can now appreciate the reasons for measuring Verdet constant variation
with temperature and optical activity shift with temperature when assessment of
temperature variation effect on Faraday magnetic field sensor is considered.
To address this issue it is possible to use at least two different wavelengths for
measuring magnetic field intensity and then use these results to correlate which
part of the plane of polarization rotation is caused by temperature and by
magnetic field. Due to difference in normalization, temperature compensation is
performed differently and accordingly shall be discussed separately.
8.2. Temperature Compensation with AC/DC
Normalization
A typical AC/DC configuration would have a linearized transfer function
defined as
0
0 01 cos 2 2 sin 22
L
UU (8.6)
where θ0 is rotation of the plane of polarization due to DC magnetic field,
optical activity and construction induced phase shift, θ is rotation of the plane
due to magnetic field only, U0 is detector output voltage at zero magnetic field.
θ0 is usually set to 45° by customizing transmission axis of polarizer and analyzer
to obtain maximum sensitivity (sin(90°)=1). Shift in θ0 due to temperature will
affect the measured DC value of UL from second term in the sum and the AC
Experimental Characterization of Magneto-optical Properties of Faraday Crystal…
88
value of the measured magnetic field from the third term in the sum. Since
AC/DC normalization operates by dividing the AC part of the UL with its DC
part resulting variation of the UL caused by temperature shift of the optical
activity is a serious problem.
When Eq. (8.6) is split into its DC and AC part one obtains
0
01 cos 22
LDC
UU
0 0sin 2LACU U
(8.7)
When AC/DC normalization is applied using previous equations one obtains
a number NACDC
0 0 0
0 00
sin 2 2sin 2
1 cos 21 cos 2
2
LACACDC
LDC
U UN
U
U
(8.8)
from which magnetic field intensity θ can be obtained as
0
0
1 cos 21
2 sin 2ACDC ACDCB N k T N
Vl
(8.9)
Since V and θ0 are both functions of temperature the result for B will also
depend on temperature even when magnetic induction is constant since scale
factor k is temperature dependent.
𝜕𝑘
𝜕𝑇=𝜕 (
1
2𝑉𝑙
1+cos2𝜃0
sin2𝜃0)
𝜕𝑇 (8.10)
Calculation of the first derivative of Eq. (8.10) takes some steps:
𝜕 (1
2𝑉𝑙)
𝜕𝑇= −
1
2𝑉2𝑙
𝜕𝑉
𝜕𝑇
,
𝜕 (1+cos2𝜃0
sin2𝜃0)
𝜕𝑇= =
−2𝑠𝑖𝑛22𝜃0 − 2𝑐𝑜𝑠2𝜃0 − 2𝑐𝑜𝑠22𝜃0
𝑠𝑖𝑛22𝜃0
(8.11)
Experimental Characterization of Magneto-optical Properties of Faraday Crystal…
89
Thus it is possible to obtain temperature derivative of the scale factor k
𝜕𝑘
𝜕𝑇= −
1
2𝑉2𝑙
1 + 𝑐𝑜𝑠2𝜃0𝑠𝑖𝑛2𝜃0
𝜕𝑉
𝜕𝑇
+1
2𝑉𝑙
−2𝑠𝑖𝑛22𝜃0 − 2𝑐𝑜𝑠2𝜃0 − 2𝑐𝑜𝑠22𝜃0
𝑠𝑖𝑛22𝜃0
𝜕𝜃0𝜕𝑇
(8.12)
Since θ0 is set to 45° to obtain maximum sensitivity one can further reduce to
0
0
2
45
1 1
2
k V
T V l T Vl T
(8.13)
Given negative values of temperature changes for V, noting that V is smaller
than 1 (in S.I. unit for V is rad/T/m) and that temperature affects Faraday effect
and optical activity with similar scale, second term can be neglected causing the
sensor scale to rise with temperature.
Thus in an AC/DC normalization system of primary concern is the scale
change of the sensor due to temperature effect on Faraday constant and to
compensate one must obtain accurate value of V at the crystal temperature.
There are several solutions available but the one option possible using data
obtained in this thesis is to measure the magnetic field strength at two
wavelengths λ1, λ2 and the find the crystal temperature using their relation. Thus
since V is also a function of λ one obtains
1 1 1 2 2 2, , ,ACDC ACDCB k T N B k T N (8.14)
However, by close examination of V(T, λ) graphs it is noticeable that the V(λ1)
and V(λ2) are similar, they both decrease in the same manner and maintain
constant ratio. This makes compensation impractical.
8.3. Temperature Compensation with Δ/Σ Normalization
When Δ/Σ method is used to extract rotation data reflective and transmissive
measuring configuration differ in that the reflective configuration requires only
compensation for temperature dependence of the Verdet constant whereas
Experimental Characterization of Magneto-optical Properties of Faraday Crystal…
90
transmissive configuration require compensation for both Verdet constant and
optical activity temperature effects.
8.3.1. Compensation in a reflective configuration
With reflective compensation optical activity cancels out and result of
measurement can be expressed as
1 2
1 2
( ) ( )1, , arcsin [ ]
4 ( , ) ( ) ( ) ( )R
U B U BR B T T
V T l T U B U B
(8.15)
Reflective configuration has therefore no use of the optical activity vs.
temperature function. It could be possible to detect the temperature of the crystal
by wavelength multiplexing, i.e. by illuminating the crystal at λ1 and taking the
result R1. At the later instance, the crystal shall be illuminated by another
wavelength λ2 that provides measurement result R2. Assuming that the
wavelength switching is fast enough to presume that the magnetic field and
temperature cannot change appreciably one can write
11 121 1
1 1 11 12
21 222 2
2 2 21 22
( ) ( )1, , arcsin ,
4 ( , ) ( ) ( ) ( )
( ) ( )1, , arcsin
4 ( , ) ( ) ( ) ( )
U B U BR B T
V T l T U B U B
U B U BR B T
V T l T U B U B
(8.16)
Since arguments of arcsin functions are known from measurements using Δ/Σ
normalization it is possible to eliminate magnetic field and crystal length from
measurement by dividing the results
21 22
1 1 21 222 212
2 2 1 1 21 22
21 22
( ) ( )arcsin
, , ( ) ( )( , )
, , ( , ) ( ) ( )arcsin
( ) ( )
U B U B
R B T U B U BV TR
R B T V T U B U B
U B U B
(8.17)
Experimental Characterization of Magneto-optical Properties of Faraday Crystal…
91
From Eq. (8.17) it is possible to determine the crystal temperature T by finding
the temperature where ratio of the Verdet constants equals R12. This is of course
possible only if Verdet constants exhibit different 𝜕𝑉
𝜕𝑇 change values. For BiGeO
crystal this at red and green wavelengths this is not the case, and therefore this
way of determining the crystal temperature is not applicable.
8.3.2. Compensation in a transmissive configuration
For a transmissive configuration one can write
1 2
0
1 2
( ) ( )1, , , , , arcsin [ ]
2 ( , ) ( ) ( ) ( )B
U B U BR B T R B T R T T
V T l T U B U B
(8.18)
With RB denoting result due to magnetic field and R0 result due to optical
activity. R0 is a nuisance causing a DC measurement offset that masks the
measurement of the DC component of the B. With proper calibration it is possible
to set R0 to zero under B=0 condition, i.e. no field and at a known temperature.
Thus when temperature changes R0 will shift allowing for determination of the
temperature using graphs of optical activity change with temperature. Where
only AC magnetic field is measured, this case actually reduces to a case similar
to reflective configuration albeit with a half the scale. A temperature
compensation for this case using this method has been verified in [27].
For a Δ/Σ method one can therefore conclude that only transmissive
configuration can be used if temperature compensation is required.
Experimental Characterization of Magneto-optical Properties of Faraday Crystal…
92
9. Conclusion
After the crystal samples were exposed to a femtosecond laser irradiation of
increasing power the changes in optical properties of Bi12 Ge O 20 single crystals
were observed[1]. The transmittance dependence on the applied irradiation
power undergoes initial growth, reaches maximum, and then decreases. The
maximal transmittance of 25.1% occurred at 455 mW. In the transmission spectra
of unirradiated sample anisotropy was detected see Figure 44. After irradiation,
the transmission increased, whereas the anisotropy disappeared. To the best of
our knowledge, photo-induced increase in BGO transmission has not been
reported before. The XRD measurements performed on the prismatic crystal
samples as well as on the powdered slices taken from the crystal facets confirmed
mechanical imperfections as well as femtosecond laser induced structural
changes. The laser-beam-incident side of the sample became almost amorphous,
indicating fragmentation of a mono crystal into disoriented fractals, whereas the
side of the crystal sample that was not incident with regard to the laser beam, can
be indexed to the Bi12 Ge O20 compound. The Raman spectra peaks became
somewhat stronger, except for the E type peaks at 234, 454, and 619.6 cm-1 (Figure
46), which disappeared[1]. Irradiation also caused significant change of the
crystal color as shown in Figure 45. The irradiation caused 41.4% decrease in the
absorption coefficient and did not influence the Faraday constant. Consequently,
the increase in crystal transparency resulted in a significant 70% increase in the
magneto-optical quality as shown in Table 6. Optical properties of Bi12 Ge O20
single crystals can be improved by irradiation with the femtosecond pulsed laser
beam. For the best results, the wavelength, duration, and power of irradiating
laser beam, need to be optimized.
In order to measure the temperature dependence of the optical activity and
Verdet constant of the BiGeO crystal special setups have been created optimized
for the measurement. Transmissive configuration was used to measure optical
activity and reflective configuration has been used to measure Verdet constant,
Experimental Characterization of Magneto-optical Properties of Faraday Crystal…
93
since optical activity cancels out in this configuration. An experimental setup was
constructed using calibrated Helmholtz coils that were tested for magnetic field
uniformity. Measurement of the crystal temperature was a particular problem
requiring non-contact measurement due to the sensitivity of the material and
possible field disturbance. It was decided to measure the temperature using a
radiation thermometer to constantly monitor the crystal. This thermometer was
calibrated using a high-performance FLIR IR camera and a material with known
emissivity value. Crystal was preheated with a hot gun to a temperature above
100°C and left to cool down while the measurements of optical activity or Verdet
constant were taken. Effect of the temperature on optical activity of the BiGeO
crystal has been experimentally recorded for two wavelengths, red and green
lasing colors. Results of the measurements demonstrate that bot optical activity
and Verdet constant are temperature dependent with negative first derivative.
Optical activity was also measured on the third wavelength (yellow) for
verification purposes. Optical activity vs. temperature curves show that different
wavelength exhibit different slope with temperature change. As for Verdet
constant, the slopes are very similar but the values of V are different - they
depend on the wavelength as is known from earlier work. A discussion of
temperature effect on both transmissive and reflective Faraday sensor design has
been undertaken as well as for two normalization methods. Analysis show that
different approaches need to be taken for temperature compensation. It turns out
that transmissive configuration offers greatest possibility for determining the
crystal temperature using two wavelengths (multi-color measurement).
Experimental Characterization of Magneto-optical Properties of Faraday Crystal…
94
LIST OF PUBLICATIONS:
Journal articles:
1. Aleksander Kovacevic, Jasna L. Ristic-Djurovic, Marina Lekic, Branka Hadzic,
Giuma Saleh Isa Abudagel, Slobodan Petricevic, Pedja Mihailovic, Branko
Matovic, Dragan Dramlic, Ljiljana M. Brajovic, Nebojša Romcevic ”Influence
of femtosecond pulsed laser irradiation on bismuth germanium oxide single
crystal properties”, Materials Research Bulletin 83 (2016), pp. 284–289, doi:
102 % Plots B as a function of z, where z is normalized in orders of the average
103 % radius (t h e distance from the center of the coil to the middle of the
104 % windings). The average radius is also the distance between the two coils.
105 % close all
106 % z=linspace (- 0.15/0.113,0.15/0.113,100);
107 % plot (z , B )
108 % grid on
109 % xlabel (' z/R –{av} ')
110 % ylabel (' B [T] ')
Experimental Characterization of Magneto-optical Properties of Faraday Crystal…
103
Biography
Personal Data Name: Giuma Saleh Isa Surname: Abudagel Nationality: Libyan Date of Birth: 01.01.1963 Specialization: Optoelectronics and Laser Technology Scientific Degree: Assistant Professor Job Place: Physics Dept- Faculty of Science- Azzaytuna University- Libya E Mail: [email protected] Tel: +381612774249 Tel: +218925614249 Scientific Qualification: 1987- B. SC in Physics from Department of Physics, Faculty of Science, University of Tripoli, Tripoli Libya. 2000- M. SC in Optoelectronics and Laser technology from Faculty of Electrical Engineering, University of Belgrade, Serbia. From Feb 2014 until now, Doctoral student at Faculty of Electrical Engineering, University of Belgrade, Serbia. Academic Appointments & Work experience: 1989-2008: full time Researcher in Laser & optics at Central Agency for Research and Manufacturing, Tripoli Libya. 2000-2005: half time lecturer of theoretical and experimental physics for undergraduate students Department of Physics, Faculty of Science, University of Tripoli. 2008-2013: full time lecturer of theoretical and experimental physics for undergraduate students, Azzaytuna University Libya.
Experimental Characterization of Magneto-optical Properties of Faraday Crystal…
104
Experimental Characterization of Magneto-optical Properties of Faraday Crystal…
105
Experimental Characterization of Magneto-optical Properties of Faraday Crystal…
106
Experimental Characterization of Magneto-optical Properties of Faraday Crystal…