Experimental determination of elastic properties of talc to 800‡C, 0.5 GPa; calculations of the e¡ect on hydrated peridotite, and implications for cold subduction zones Edward Bailey *, John R. Holloway Geology Department, Arizona State University, Tempe, AZ 85287-1404, USA Received 10 April 2000; received in revised form 21 September 2000; accepted 23 September 2000 Abstract We have measured compressional wave velocity (V P ) in talc as a function of temperature at 0.5 GPa. V P falls from 5.27 þ 0.23 km s 31 at 25‡C to 4.35 þ 0.15 km s 31 at 800‡C. Combining these results with a previously published bulk modulus (K) and NK/NP, gives a Poisson’s ratio (X) of 0.268 and a shear modulus (G) of 22.6 GPa under atmospheric conditions. Assuming that X is independent of temperature gives a NK/NT value of 319.3 þ 0.64 MPa K 31 at 0.5 GPa. We used the experimental data, in combination with published data, to calculate bounds on the elastic moduli of a peridotite hydrated with talc just above cold subducting lithosphere. We find that an assemblage hydrated by only 0.9 wt% H 2 O has elastic wave velocities (calculated from the Voigt^Reuss^Hill average) lower than the anhydrous rock by an average of 7.6% for V P , and 9.7% for shear waves (V s ) at 700‡C. These results are consistent with observations of converted phase behavior in the vicinity of the surface of a cold subducting slab, and may place the low-velocity layer observed in the lowermost mantle wedge, not the uppermost slab as has previously been suggested. ß 2000 Elsevier Science B.V. All rights reserved. Keywords: talc; elastic properties; subduction zones; peridotites; mantle; ultrasonic methods 1. Introduction 1.1. Hydrated mantle in subduction zones H 2 O, in £uids and hydrous phases, greatly in- £uences physical and chemical processes in sub- duction zones [1^3]. For example, H 2 O weakens the mantle and may £ux partial melting to pro- duce arc magmas [2,4]. Better understanding of the H 2 O distribution in the subducting slab and mantle wedge is therefore essential to understand- ing subduction zone processes. One of the most direct probes of deep-earth conditions is from seismological observations. These can be combined with experimental data on the physical properties of hydrous and anhy- drous phases at appropriate pressures and tem- peratures to estimate rock composition [5] and H 2 O abundance [6]. Seismic observations show that some regions in 0012-821X / 00 / $ ^ see front matter ß 2000 Elsevier Science B.V. All rights reserved. PII:S0012-821X(00)00288-0 * Corresponding author. Present address: Bayreisches Geoinstitut, Universita «t Bayreuth, D-95440 Bayreuth, Ger- many. Tel.: +49 (0) 921 55 3745; Fax: +49 (0) 921 55 3769; E-mail: [email protected]Earth and Planetary Science Letters 183 (2000) 487^498 www.elsevier.com/locate/epsl
Transcript
Experimental determination of elastic properties of talc to800³C, 0.5 GPa; calculations of the e¡ect on hydratedperidotite, and implications for cold subduction zones
Edward Bailey *, John R. HollowayGeology Department, Arizona State University, Tempe, AZ 85287-1404, USA
Received 10 April 2000; received in revised form 21 September 2000; accepted 23 September 2000
Abstract
We have measured compressional wave velocity (VP) in talc as a function of temperature at 0.5 GPa. VP falls from5.27 þ 0.23 km s31 at 25³C to 4.35 þ 0.15 km s31 at 800³C. Combining these results with a previously published bulkmodulus (K) and NK/NP, gives a Poisson's ratio (X) of 0.268 and a shear modulus (G) of 22.6 GPa under atmosphericconditions. Assuming that X is independent of temperature gives a NK/NT value of 319.3 þ 0.64 MPa K31 at 0.5 GPa.We used the experimental data, in combination with published data, to calculate bounds on the elastic moduli of aperidotite hydrated with talc just above cold subducting lithosphere. We find that an assemblage hydrated by only0.9 wt% H2O has elastic wave velocities (calculated from the Voigt^Reuss^Hill average) lower than the anhydrous rockby an average of 7.6% for VP, and 9.7% for shear waves (Vs) at 700³C. These results are consistent with observations ofconverted phase behavior in the vicinity of the surface of a cold subducting slab, and may place the low-velocity layerobserved in the lowermost mantle wedge, not the uppermost slab as has previously been suggested. ß 2000 ElsevierScience B.V. All rights reserved.
H2O, in £uids and hydrous phases, greatly in-£uences physical and chemical processes in sub-duction zones [1^3]. For example, H2O weakens
the mantle and may £ux partial melting to pro-duce arc magmas [2,4]. Better understanding ofthe H2O distribution in the subducting slab andmantle wedge is therefore essential to understand-ing subduction zone processes.
One of the most direct probes of deep-earthconditions is from seismological observations.These can be combined with experimental dataon the physical properties of hydrous and anhy-drous phases at appropriate pressures and tem-peratures to estimate rock composition [5] andH2O abundance [6].
Seismic observations show that some regions in
0012-821X / 00 / $ ^ see front matter ß 2000 Elsevier Science B.V. All rights reserved.PII: S 0 0 1 2 - 8 2 1 X ( 0 0 ) 0 0 2 8 8 - 0
Earth and Planetary Science Letters 183 (2000) 487^498
www.elsevier.com/locate/epsl
the mantle wedge have low elastic wave velocities[7]. These low velocities may be caused by eitherthe high temperatures associated with partialmelting, or the presence of hydrous phases orfree aqueous £uids at lower temperatures [8].Understanding of the causes of these low veloc-ities in speci¢c regions of the mantle is dependenton the use of experimental data on rocks andminerals at relevant pressures and temperaturesto calibrate seismic observations.
Previous studies have examined selected rockcompositions over a range of pressures and tem-peratures. Sato et al. [9,10] determined the com-pressional wave velocity of anhydrous peridotite,which decreases signi¢cantly only at temperaturesabove the solidus. Kern and Fakhimi [11] deter-mined compressional wave velocities in amphibo-lite and serpentinite to 700³C at 0.2 GPa, condi-tions under which di¡erential thermal expansionof sample phases may cause microcracks, prevent-ing con¢dent extrapolation of results to uppermantle conditions [12]. Ito [13] and Ito and Tat-sumi [14] also measured velocities in amphiboliteand serpentinite to 1000³C, 1 GPa. Many of theirexperiments were done over timescales too shortfor attainment of chemical and textural equilibri-um, and are therefore of limited applicability tothe Earth, in which reactions involving a freeaqueous £uid should go to completion easily.
1.2. Talc in a hydrated mantle
The identity of hydrous phases in mantle wedgeperidotite is crucial to the physical and chemicalprocesses in subduction zones. The di¡erent can-didates, which include talc, micas, serpentine min-erals, amphiboles, and chlorite, will have di¡erentelastic moduli, leading to di¡erent seismic obser-vations. These minerals also have di¡ering chem-istry, leading to di¡ering conditions of partialmelting, and di¡ering H2O storage and transportin the mantle wedge. Both the likely chemistry, aspredicted by phase equilibria, and the observableand measured seismic properties, of a hydratedperidotite can be used to constrain the identityof possible hydrous phases in the mantle wedge.The shortage of certain elements, such as potas-sium, and aluminum precludes large proportions
of amphiboles, micas and chlorite from forming.Subducted sediments may, however, provide asource for these elements, stabilizing these min-erals. The most likely H2O-bearing phases are,nevertheless, the magnesium silicates, such asserpentine, and talc. The dense hydrous magnesi-um silicates are important at higher pressuresthan those we consider here (e.g. 10 Aî phaseMg3Si4O10(OH)2b2H2O). Simple addition ofH2O to peridotite will, at low temperatures, gen-erate serpentinite. We show in a later section thatthis is unlikely from chemical arguments. We sup-port the hypothesis that talc is a major H2O-bear-ing phase in subduction zones [15^17], and, there-fore, this study was conducted to measurevelocities of compressional waves in talc at0.5 GPa as a function of temperature. Thesedata were then used to calculate whole-rock mod-uli and velocities for hydrated peridotite to inves-tigate the distribution of H2O in subductionzones.
In Section 2, we outline our experimental ap-proach to measuring the compressional wave ve-locity of talc at 0.5 GPa over its stability range.We then use the data we obtain, in combinationwith data on other minerals, to calculate hydratedrock moduli. We then evaluate the e¡ect of talcon the elastic moduli of a hydrated peridotite, andcompare the results of our calculations with seis-mic observations. We ¢nd that the presence oftalc-bearing layers in the mantle just above coldsubducting slabs can explain low velocities ob-served in narrow regions parallel to the descend-ing slab. Our results are consistent with a petro-logical and thermal model in which talc is presentin a layer in the mantle about 10 km thick abovea cold subducting slab. We suggest that this layermay be the cause of low velocities imaged by con-verted phases in this region.
2. Experimental method for compressional-wavevelocity measurements
The sample for this study was shown by X-raydi¡raction and chemical analyses to contain onlytalc (Table 1). The talc was ground, then com-pressed three times in a uniaxial cold-press, using
EPSL 5642 22-11-00
E. Bailey, J.R. Holloway / Earth and Planetary Science Letters 183 (2000) 487^498488
a larger diameter die for successive compressions,as a slight relaxation after each pressing preventedthe sample from ¢tting back into a die in which ithad been pressed previously. This produced a cyl-inder of 100% density (2.793 þ 0.002 g cm33), asdetermined by comparison with three measure-ments on a powdered sample in a helium pych-nometer. The resulting sample had a well-con-trolled grain size of less than ¢ve Wm. Attaining100% density is important, as open voids orcracks in a sample render it useless for determi-nation of bulk elastic properties. The sample wasthen placed between two mullite bu¡er rods andsealed, by hydrostatic pressing at 0.3 GPa, roomtemperature, into a gold^palladium tube (Fig. 1)similar to that described by Sato et al. [9,10].Bu¡er rods were used to transmit compressional
waves to and from the sample, allowing the trans-ducers, whose Curie temperature (the e¡ectivetemperature limit for their operation) is about300³C, to be outside the furnace. Initial sampledimensions were 2.420 þ 0.003 cm length, by0.790 þ 0.004 cm diameter.
Measurements were made to 800³C, 0.5 GPa inan internally heated argon pressure vessel [18].Pressure was measured with a manganin resis-tance cell, calibrated against a Heise Bourdongauge with an accuracy of þ 7 bar. Temperaturewas measured by three type-K-sheathed thermo-couples, one at each end and one in the middleof the sample, with a maximum observed gra-dient over the length of the sample of 10³C at800³C.
The sample and furnace assembly were de-signed to reduce electronic noise and standardizethe geometry of electronic connections. This isnecessary, as the piezoelectric transducers are ca-pacitors whose response is a¡ected by the geom-etry of any surrounding conductors. The trans-ducers used were lead^zirconate^titanate (PZTNavy type 5A), with 800 kHz resonant frequency.The pressure vessel used opens at both ends, al-lowing connections to be made without runningwires through the furnace, the greatest source ofelectronic noise in the system. The vessel itself wasalso ground, providing a shield for the trans-ducers. Electrical leads to the transducers weremade with gold-plated, spring-loaded `pogo' con-nectors. Grounded terminal to the transducerswas a thin layer of silver paint (GC Electronics#22-202) that also bonded the transducers to thebu¡er rods. Weights loaded onto the transducersduring attachment ensured that the ground termi-nals were thin and tight.
Table 1Compositions of talc sample, and of San Carlos peridotite
Oxide Amount in talca Amount in peridotite(wt%) (wt%)
SiO2 63.13 44.66Al2O3 0.28 3.95TiO2 0.00 0.13FeOb 0.60 7.68MnO 0.00 0.13CaO 0.00 3.42MgO 31.78 39.68K2O 0.00 0.01Na2O 0.05 0.38Cr2O3 n.a.c 0.28P2O5 0.008 0.01NiO 0.00 0.19Total 95.85 100.52aAnalyses performed by X-ray £uorescence at the GeoAna-lytical laboratory, Washington State University.bTotal Fe is expressed as FeO.cNot analyzed.
Fig. 1. The experimental sample assembly. Interaction between sample and bu¡er rods was limited by sputter-coating the ends ofthe bu¡er rods with a thin layer of gold palladium alloy. The sample is 24.2 mm long, 7.9 mm in diameter.
EPSL 5642 22-11-00
E. Bailey, J.R. Holloway / Earth and Planetary Science Letters 183 (2000) 487^498 489
Input signals to the transducers were half-peri-od square waves at 800 kHz, the fundamentalresonance frequency of the transducers. Squarewave inputs were used to produce well-de¢nedarrival events.
Signals from the receiving transducer were am-pli¢ed by 40 dB, digitized and averaged. Real-time monitoring on an oscilloscope, with a time-base down to 5 ns, provided a check against alias-ing. In all measurements the high-frequency partof the output waveform (above 2 MHz) was low-amplitude noise only. This allowed a linear inter-polation to be done on the digitized signals, dou-bling the e¡ective time resolution. Digitizationwas done using a DATEL PC414-H3 data acqui-
sition board in a personal computer at 12 bitresolution and a 10 MHz sampling rate. Linearinterpolation increased the sampling rate to20 MHz, e¡ectively setting the precision of mea-surements at þ 0.04 km s31. Single waveformsconsisted of 512 digitized points (before interpo-lation) over 51.2 Ws. A mean of at least 1024 in-dividual waveforms was taken, increasing the sig-nal-to-noise ratio for the arrival event to around 4(Fig. 2). These averages formed the base wave-forms for analysis. Time of £ight across the sam-ple assembly was determined as the time from thestart of data collection (the start of the outputwaveform, triggered synchronously with the inputwaveform generator), to the arrival event. Arrival
Fig. 2. (a) A typical output waveform, collected at 0.5 GPa, 740³C. The potential resolution is 12 bits (about 0.01% of full scale)and time resolution is 0.005 Ws. (b) The noise level for zero signal. (c) An arrival event. The spike at the start of the waveform isan impedance e¡ect from the input signal, and is useful for timing.
EPSL 5642 22-11-00
E. Bailey, J.R. Holloway / Earth and Planetary Science Letters 183 (2000) 487^498490
events were identi¢ed on waveforms with thehighest signal-to-noise ratios. These formed thebasis for cross-correlations to determine arrivalevents for other averaged waveforms with highernoise levels. (For example, the output waveformshown in Fig. 2 was used as an input waveformfor cross-correlation.)
3. Experimental results and discussion
Compressional wave velocity in talc was deter-mined in a series of 130 measurements, made on asingle sample over a temperature^time path last-ing for over 2000 h (Fig. 3), and in two measure-ments at room temperature, 0.5 GPa on the samesample. At 0.5 GPa, VP falls from 5.27 þ 0.23 kms31 at 25³C to 4.35 þ 0.15 km s31 at 800³C (Table2). Combining our results, and using a bulk mod-ulus K of 41.6 GPa and a NK/NP of 6.5 obtainedby Pawley et al. [19], gives a Poisson's ratio of0.268, and a shear modulus of 22.6 GPa atroom temperature and atmospheric pressure. As-suming X is independent of temperature in the
range from 25 to 800³C gives a NK/NT value of319.3 þ 0.64 MPa K31 at 0.5 GPa, which we useover the entire pressure range of this study. Thereare little data on Poisson's ratio as a function oftemperature, although Christensen [5] ¢nds only aslight variation (an average of 1%) for eight rocktypes between 25 and 700³C.
Fig. 3. Temperature^time path of VP measurements in talc at 0.5 GPa. Transducer failure prevented measurements between 510and 524 h, and the transducers were replaced at 524 h. Room temperature, 0.5 GPa measurements were taken before the hightemperature measurements.
Table 2Experimentally measured VP in talc at 0.5 GPa
Temperature VP Number of measurementsb
(³C) (km s31)a
25 5.27 2600 4.60 5700 4.51 20720 4.43 2740 4.43 33745 4.43 1750 4.43 15755 4.40 24800 4.35 30aMeasurements are þ 0.15 km s31, except the room tempera-ture measurement, which is þ 0.23 km s31.bEach measurement consists of an average of at least 1024waveforms.
EPSL 5642 22-11-00
E. Bailey, J.R. Holloway / Earth and Planetary Science Letters 183 (2000) 487^498 491
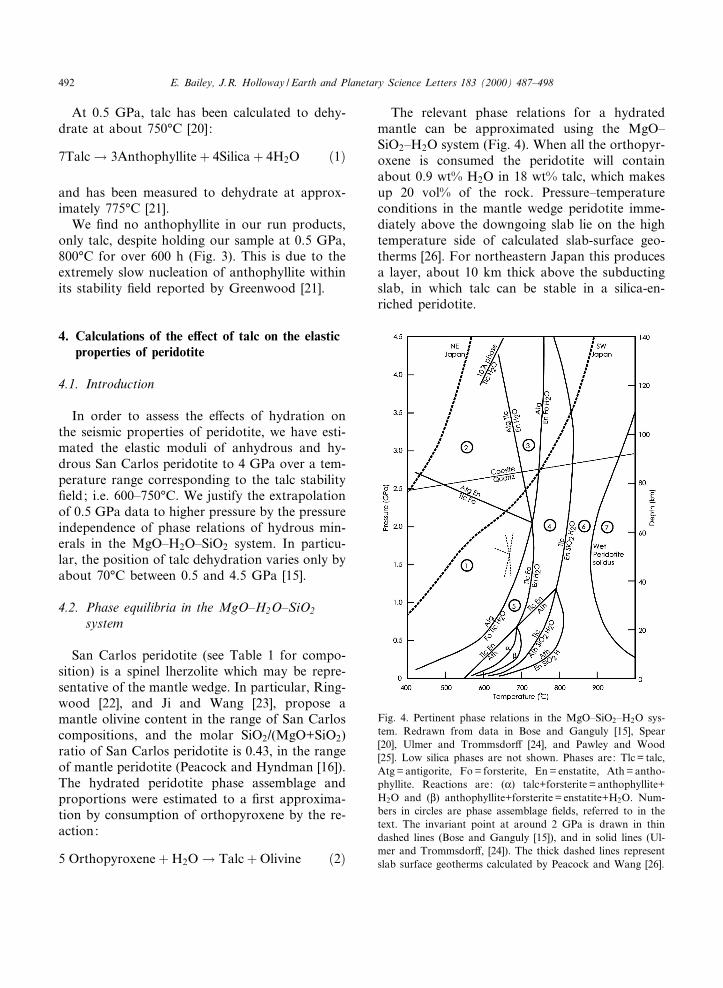
At 0.5 GPa, talc has been calculated to dehy-drate at about 750³C [20]:
7Talc! 3Anthophyllite� 4Silica� 4H2O �1�
and has been measured to dehydrate at approx-imately 775³C [21].
We ¢nd no anthophyllite in our run products,only talc, despite holding our sample at 0.5 GPa,800³C for over 600 h (Fig. 3). This is due to theextremely slow nucleation of anthophyllite withinits stability ¢eld reported by Greenwood [21].
4. Calculations of the e¡ect of talc on the elasticproperties of peridotite
4.1. Introduction
In order to assess the e¡ects of hydration onthe seismic properties of peridotite, we have esti-mated the elastic moduli of anhydrous and hy-drous San Carlos peridotite to 4 GPa over a tem-perature range corresponding to the talc stability¢eld; i.e. 600^750³C. We justify the extrapolationof 0.5 GPa data to higher pressure by the pressureindependence of phase relations of hydrous min-erals in the MgO^H2O^SiO2 system. In particu-lar, the position of talc dehydration varies only byabout 70³C between 0.5 and 4.5 GPa [15].
4.2. Phase equilibria in the MgO^H2O^SiO2
system
San Carlos peridotite (see Table 1 for compo-sition) is a spinel lherzolite which may be repre-sentative of the mantle wedge. In particular, Ring-wood [22], and Ji and Wang [23], propose amantle olivine content in the range of San Carloscompositions, and the molar SiO2/(MgO+SiO2)ratio of San Carlos peridotite is 0.43, in the rangeof mantle peridotite (Peacock and Hyndman [16]).The hydrated peridotite phase assemblage andproportions were estimated to a ¢rst approxima-tion by consumption of orthopyroxene by the re-action:
5 Orthopyroxene�H2O! Talc�Olivine �2�
The relevant phase relations for a hydratedmantle can be approximated using the MgO^SiO2^H2O system (Fig. 4). When all the orthopyr-oxene is consumed the peridotite will containabout 0.9 wt% H2O in 18 wt% talc, which makesup 20 vol% of the rock. Pressure^temperatureconditions in the mantle wedge peridotite imme-diately above the downgoing slab lie on the hightemperature side of calculated slab-surface geo-therms [26]. For northeastern Japan this producesa layer, about 10 km thick above the subductingslab, in which talc can be stable in a silica-en-riched peridotite.
Fig. 4. Pertinent phase relations in the MgO^SiO2^H2O sys-tem. Redrawn from data in Bose and Ganguly [15], Spear[20], Ulmer and Trommsdor¡ [24], and Pawley and Wood[25]. Low silica phases are not shown. Phases are: Tlc = talc,Atg = antigorite, Fo = forsterite, En = enstatite, Ath = antho-phyllite. Reactions are: (K) talc+forsterite = anthophyllite+H2O and (L) anthophyllite+forsterite = enstatite+H2O. Num-bers in circles are phase assemblage ¢elds, referred to in thetext. The invariant point at around 2 GPa is drawn in thindashed lines (Bose and Ganguly [15]), and in solid lines (Ul-mer and Trommsdor¡, [24]). The thick dashed lines representslab surface geotherms calculated by Peacock and Wang [26].
EPSL 5642 22-11-00
E. Bailey, J.R. Holloway / Earth and Planetary Science Letters 183 (2000) 487^498492
Tab
le3
Ela
stic
data
used
inca
lcul
atio
ns
Pha
seA
mou
ntin
anhy
drou
sSa
nC
arlo
spe
rido
tite
a
bK
NK/N
PNK
/NT
GNG
/NP
NG/N
Ta 0
a 1a 2
(wt%
)(g
cm3
3�(G
Pa)
(MP
aK
31)
(GP
a)(M
Pa
K3
1)
(U10
34�
(U10
38)
Oliv
ine
58.9
33.
325
129.
54.
563
18.0
77.6
1.71
313
.60.
3034
b0.
7422
30.
5381
Ort
hopy
roxe
ne24
.94
3.27
210
2.3
4.5c
326
.873
.92.
383
11.9
0.47
70D
iops
ide
13.5
93.
276
113
4.5c
321
.4d
671.
5c3
15.4
0.33
30Sp
inel
2.54
3.57
819
6.7
5.66
315
.710
8.3
4e3
9.4
0.24
90T
alcf
02.
793
41.6
g6.
5g3
19.3
22.6
0.26
06h
Dat
afr
omB
ass
[29]
,A
nder
son
and
Isaa
k[3
0],
and
Fei
[31]
unle
ssno
ted
belo
w.
aSa
nC
arlo
spe
rido
tite
phas
esar
e:ol
ivin
eM
g 1:8
Fe 0:2
SiO
4,
orth
opyr
oxen
eM
g 0:8
5F
e 0:0
9A
l 0:1
1Si
0:95
O3,
diop
side
Ca 0:7
8M
g 0:8
6F
e 0:1
0A
l 0:3
1N
a 0:0
9Si
1:87
O6,
and
spin
elM
g 0:8
Fe 0:2
Al 1:8
Cr 0:2
O4.
The
mol
arra
tio
MgO
/(M
gO+
FeO
)is
0.90
for
silic
ate
phas
es.
bT
herm
alex
pans
ion
expr
essi
on:K
(T)=
a 0+
a 1T
+a 2
T3
2,
c Hel
¡ri
chet
al.
[32]
.dNK
/NP
appr
oxim
ated
usin
g:
K(T
)=K
0[V
(T)/
V0]3
N saf
ter
And
erso
n[3
3]w
ithN s
=6.
0fr
omc.
e Val
uefo
rNG
/NP
assu
med
asap
prop
riat
efo
rm
any
geol
ogic
ally
rele
vant
oxid
es(e
.g.
Paw
ley
etal
.[1
9],
and
Poi
rier
[34]
).f D
ata
for
talc
are
take
nfr
omth
eex
peri
men
tal
resu
lts
pres
ente
din
this
pape
r,ex
cept
asno
ted
belo
w.
gP
awle
yet
al.
[19]
.hB
ose
and
Gan
guly
[15]
.
EPSL 5642 22-11-00
E. Bailey, J.R. Holloway / Earth and Planetary Science Letters 183 (2000) 487^498 493
At temperatures below the talc stability ¢eld,other hydrous minerals such as brucite and ser-pentine will be stable. At the temperatures consid-ered in this study, talc will be the dominant prod-uct of hydration of the mantle. We neglect thepossible e¡ect of calcic amphibole, because am-phibole has similar elastic properties to pyroxenes[14], and the 10^20 wt% tremolite which mightform would not signi¢cantly a¡ect whole-rockmoduli. If the £uids responsible for hydrationare derived from the top of a subducting slab,with accompanying sediments, then they will besilica rich [27,28] and talc will form according tothe reaction:
3Olivine� 2H2O� 5Silica � 2Talc �3�
If the olivine is exhausted, orthopyroxene maybe consumed:
3Orthopyroxene�H2O� Silica�aq� � Talc �4�
4.3. Calculation results
The elastic moduli and volumes (Table 3) ofphases produced as an end result of Reaction 2are used to calculate the following bounds oncompressional and shear velocities : Hashin^Shtrikman, Voigt, Reuss and the Voigt^Reuss^Hill average [35]. Compressibilities of minerals,and thermal expansivities, are taken into accountthrough di¡ering volume fractions with pressureand temperature, and in the change in whole-rockdensity. Results are shown for a peridotite hy-drated by Reaction 2 (Fig. 5). A peridotite hy-drated by Reaction 3 or 4 would show a greaterdecrease in velocities, as a greater amount of talcwould be produced, with no production of oli-vine.
4.4. Discussion of calculation results
The most striking feature of the calculated ve-locities is the large decrease between the anhy-drous and barely hydrous (0.9 wt% H2O) rocks.This is due to the low density of talc, its largevolume proportion in the hydrated rock, and its
low elastic moduli. This e¡ect is more pronouncedin Vs, increases with temperature, decreases withpressure, and is largest for the lowest bound (i.e.the Voigt bound). The bounds for anhydrousperidotite have a much smaller velocity rangethan those for hydrous peridotite, because almost
Fig. 5. Calculated Velocities in hydrous and anhydrous peri-dotite (for the full calculated dataset see the EPSL OnlineBackground Dataset1). Labels refer to: Hy hydrous assem-blage, An anhydrous assemblage, R Reuss bound, HS3 Ha-shin^Shtrikman lower bound, H Voigt^Reuss^Hill average,HS+ Hahin^Shtrikman upper bound, and V Voigt bound.The spread of velocities in the hydrated assemblage is due tothe large volume fraction of talc, and its consequent a¡ecton whole rock moduli. In the anhydrous peridotite theVoigt^Reuss^Hill average gives slightly higher velocities thanthe Hashin^Shtrikman upper bound, otherwise the calculatedvelocities have the same relative magnitudes as in the hy-drous assemblage.
E. Bailey, J.R. Holloway / Earth and Planetary Science Letters 183 (2000) 487^498494
all of the volume of the anhydrous rock is madeup of minerals with similar moduli. The large vol-ume fraction of talc in the hydrous rock, togetherwith its low moduli, is the cause of the large rangein calculated velocities.
Large-scale hydration of those portions of themantle wedge where talc is produced (by intensesilica metasomatism) should therefore be visibleto seismic methods. As discussed below, the ther-mal structure of subduction zones should lead todistinctive regions of seismic properties in thinlayers parallel to the top of the subducting slab.Manning [28] investigated the silica-saturatedmetasomatism of a mantle peridotite at the sur-
face of the downgoing slab. Here, we considerperidotite hydration along the ascent path of £u-ids leaving the slab, towards the hot center of themantle wedge.
5. Application to cold subduction zones
Fluid and solid material in the mantle wedgejust above a subducting slab will experience verydi¡erent pressure^temperature paths (Fig. 6). Forexample, in the Aleutian subduction zone [16],descending mantle just above the slab surface ex-periences an almost isothermal compression. Flu-
Fig. 7. Phase relations in the MgO^SiO2^H2O system for thepressure^temperature region of the mantle above a cold sub-ducting slab, corresponding to the upper part of Fig. 6. Ad-dition of a maximum of 7 mol% silica, at a minimum H2Ocontent, is needed to stabilize talc at the expense of antigor-ite, and this decreases with increasing H2O content. Numbersin circles are phase assemblage ¢elds from Fig. 4, referred toin the text.
Fig. 6. Solid and £uid movement paths above a cold sub-ducting slab. Phase relations are the same as in Fig. 4. Mi-gration paths of £uids (short dashes) leaving the top of theslab (long dashes) and mantle (solid lines) moving parallel toand above the slab cover the maximum talc stability range,which is dependent on hydration by silica-rich £uids. Athigher pressure the 10 Aî phase becomes stable, and, with ris-ing temperatures, a £uid-present region with no stable hy-drous phase is followed by the wet solidus and partial melt-ing.
EPSL 5642 22-11-00
E. Bailey, J.R. Holloway / Earth and Planetary Science Letters 183 (2000) 487^498 495
ids above the same slab rise through temperaturegradients of about 50³C/km, from 400³C at 70 kmon the slab surface to 900³C at 60 km depth in themantle wedge. The stable phase assemblages (Fig.7) in the hydrated peridotite over this ascent pathwill depend on the extent of hydration, and on thesilica content of the £uid.
Pressure^temperature conditions along the pathof £uid ascent described above would pass eitherthrough ¢elds 1, 2, 3, and 4 before dehydration in¢eld 6 and partial melting in ¢eld 7, or through¢elds 1, 4 and 5, before dehydration and partialmelting, again in ¢elds 6 and 7. In ¢elds 1 and 5,talc is the initial hydrous phase in the peridotitesystem no matter what the silica content of hy-drating £uid. High-silica £uids are required to sta-bilize talc in ¢elds 2, 3, and 4, and there is nostable hydrous phase in ¢eld 6. Talc is the onlystable hydrous phase in ¢eld 4. A fully hydratedperidotite will contain: in ¢elds 1 and 2 talc andantigorite or antigorite only, depending on silicacontent, in ¢eld 3 talc or antigorite, depending onsilica content, in ¢eld 5 talc, and in ¢eld 4 talc orenstatite and forsterite depending on silica con-tent. The position of the invariant point at around2 GPa, which is presently debatable [15,24], gov-erns the depth at which ¢elds 2 and 3 becomeimportant, and is therefore critical to the natureof the hydrated mantle in subduction zones. Wedo not consider here phases such as diopside andspinel which are important petrologically, butwhich have too low a volume contribution tohave a signi¢cant e¡ect on seismic properties.
Hydrated mantle will descend along a path ofalmost isothermal compression. Due to the pres-sure-insensitivity of hydrous phase stability, theassemblages formed by initial hydration will per-sist, with the exception that £uids released fromgreater depths in the slab may further hydrate themantle. This will tend to drive the peridotite to-wards H2O saturation, and, if the £uids are silicarich, towards a talc-bearing system. The extent ofthe initial hydrous phase assemblages will be lim-ited by the pressure-induced formation of densehydrous magnesium silicate phases such as the10Aî phase, or phase A [15,17,25], or by the back-bend of the dehydration reaction of talc to formenstatite+silica+H2O. We consider the e¡ective
limits to be the dehydration of talc and the for-mation of the 10Aî phase, because phase A has amolar MgO/MgO+SiO2 ratio of 7/9, which is toohigh to be applicable to this system. This limitstalc stability (which has the same MgO/MgO+SiO2 ratio as the 10Aî phase) to approxi-mately 3.9 GPa at 600³C, rising to a maximum of5 GPa at 710³C.
The presence of a thin peridotite layer hydratedwith talc, parallel and close to the top of a sub-ducting slab, can therefore lower VP by about7.6%, and Vs by about 9.7%, relative to anhy-drous mantle (estimated from the Voigt^Reuss^Hill average at 700³C over the pressure range ofthis study). This is consistent with studies of thestructure of subduction zones in the region of theslab surface (e.g., [36,37]), which infer a thin (2^10 km thick), slow velocity layer at the surface ofsubducting slabs in cold subduction zones. Thislayer acts as a dispersive waveguide (e.g., [38]),slowing high frequencies (v 3 Hz) by between 5and 7% relative to low frequencies (9 1 Hz) [36],and is imaged by inversions of P to S waveconverted phases (e.g., [37]). This layer has seis-mic velocities lower by between 4 and 10% thanthe overlying peridotite (e.g., [36]). The presenceof a peridotite layer containing talc o¡ers an al-ternative explanation of the observations to thatgenerally cited: i.e. that the low-velocity layer is inthe uppermost slab, not the lowermost mantle[36^41]. For example, Abers [36] interprets thelow velocity layer as blueschist facies hydratedoceanic crust. Serpentine is also a candidate forthe cause of the lower velocities, but the peridotitewould need to be entirely serpentinized to havevelocities low enough to match observations.The unusually high Poisson's ratio of serpentine,0.35 [5], rules it out, as the VP/Vs ratio would betoo high to match observations. The low velocitylayer is between 2 and 10 km thick, and has beenobserved to depths of 250 km [36], too deep fortalc to be stable. If the 10 Aî phase has low veloc-ities, then talc breaking down to form a peridotitelayer hydrated by the 10 Aî phase could still ex-plain the observations, although the seismic veloc-ities of the 10 Aî phase have not been measured.Another observation which is di¤cult to reconcilewith the presence of talc is that most earthquake
EPSL 5642 22-11-00
E. Bailey, J.R. Holloway / Earth and Planetary Science Letters 183 (2000) 487^498496
foci in the Alaskan subduction zone lie within thelow velocity layer [41], and the mechanicalstrength of talc is low, which would inhibit thebrittle failure associated with earthquakes. Also,Zhao [7] sites almost all earthquake foci beneathnortheastern Japan below the slab surface. Intensesilica metasomatism is needed to stabilize signi¢-cant quantities of talc in peridotite at pressuresabove 2 GPa, and the mass transfer would mostlikely be from mechanical mixing of subductedsediments. These sediments would not only con-tain silica; other constituents would include po-tassium, aluminum, calcium and H2O, stabilizingother phases, such as micas and chlorite, and pos-sibly driving the peridotite towards full hydration,which would produce velocities too low to matchobservations.
Acknowledgements
We thank Selwyn Sacks and Hiroki Sato forhelp with both technical and scienti¢c aspectsof this project. Comments from Simon Peacock,Ed Garnero, and Tom Sharp improved themanuscript, as did helpful reviews from W.G.Ernst and G. Hel¡rich. This work was supportedby NSF grants EAR-9614233 and EAR-9973066.[EB]
[2] A.R. Pawley, J.R. Holloway, Water sources for subduc-tion zone volcanism: new experimental constraints, Sci-ence 260 (1993) 664^667.
[3] M.W. Schmidt, S. Poli, Experimentally based water budg-ets for dehydrating slabs and consequences for arc magmageneration, Earth Planet. Sci. Lett. 163 (1998) 361^379.
[4] J. Gill, Orogenic andesites and plate tectonics, Springer-Verlag, New York, 1981.
[5] N.I. Christensen, Poisson's ratio and crustal seismology,J. Geophys. Res. 101 (1996) 3139^3156.
[6] H. Sato, H2O and magmatism in island arc mantle in-ferred from seismic anelasticity and heat £ow data,J. Phys. Earth 42 (1994) 439^453.
[7] D. Zhao, A. Hasegawa, S. Horiuchi, Tomographic imag-ing of P and S wave velocity structure beneath north-east-ern Japan, J. Geophys. Res. 97 (1992) 19,909^19,928.
[8] H. Sato, Laboratory seismic studies: a search for mechan-ical, chemical and thermal structures of the earth, J. Phys.Earth 43 (1995) 421^455.
[9] H. Sato, I.S. Sacks, T. Murase, G. Muncill, H. Fukuya-ma, Attenuation of compressional waves in peridotitemeasured as a function of temperature at 200 MPa, Pa-geoph 128 (1988) 433^447.
[10] H. Sato, I.S. Sacks, T. Murase, G. Muncill, H. Fukuya-ma, QP-melting temperature relation in peridotite at highpressure and temperature: attenuation mechanism andimplications for mechanical properties of the upper man-tle, J. Geophys. Res. 94 (1989) 10,647^10,661.
[11] H. Kern, M. Fakhimi, E¡ect of fabric anisotropy on com-pressional-wave propagation in various metamorphicrocks for the range 20^700³C at 2 kbar, Tectonophysics28 (1975) 227^244.
[12] H. Kern, Laboratory seismic measurements: an aid in theinterpretation of seismic ¢eld data, Terra Nova 2 (1991)617^628.
[13] K. Ito, E¡ects of H2O on elastic wave velocities in ultra-basic rocks at 900³C under 1 GPa, Phys. Earth Planet.Inter. 61 (1990) 260^268.
[14] K. Ito, Y. Tatsumi, Measurement of elastic wave veloc-ities in granulite and amphibolite having identical H2O-free bulk compositions up to 850³C at 1 GPa, Earth Plan-et. Sci. Lett. 133 (1995) 255^264.
[15] K. Bose, J. Ganguly, Experimental and theoretical studiesof the stabilities of talc, antigorite and phase A at highpressures with applications to subduction processes, EarthPlanet. Sci. Lett. 136 (1995) 109^121.
[16] S.M. Peacock, R.D. Hyndman, Hydrous minerals in themantle wedge and the maximum depth of subductionthrust earthquakes, Geophys. Res. Lett. 26 (1999) 2517^2520.
[17] N.J. Chinnery, A.R. Pawley, S.M. Clark, In situ observa-tion of the formation of 10 Aî phase from talc+H2O atmantle pressures and temperatures, Science 286 (1999)940^942.
[19] A.R. Pawley, S.A.T. Redfern, B.J. Wood, Thermal expan-sivities and compressibilities of hydrous phases in the sys-tem MgO^SiO2^H2O: talc, phase A and 10-Aî phase,Contrib. Mineral. Petrol. 122 (1995) 301^307.
[21] H.J. Greenwood, The synthesis and stability of antho-phyllite, J. Petrol. 4 (1963) 317^351.
[22] A.E. Ringwood, Composition and petrology of the earth'smantle, McGraw-Hill, New York, 1975.
[23] S. Ji, Z. Wang, Elastic properties of forsterite^enstatitecomposites up to 3.0 GPa, Geodynamics 28 (1999) 147^174.
[24] P. Ulmer, V. Trommsdor¡, Serpentine stability to mantledepths and subduction-related magmatism, Science 268(1995) 858^861.
EPSL 5642 22-11-00
E. Bailey, J.R. Holloway / Earth and Planetary Science Letters 183 (2000) 487^498 497
[25] A.R. Pawley, B.J. Wood, The high-pressure stability oftalc and 10 Aî phase: potential storage sites for H2O insubduction zones, Am. Mineral. 80 (1995) 998^1003.
[26] S.M. Peacock, K. Wang, Seismic consequences of warmversus cool subduction metamorphism examples fromsouthwest and northeast Japan, Science 286 (1999) 937^939.
[27] C.E. Manning, Phase-equilibrium controls on SiO2 meta-somatism by aqueous £uid in subduction zones: reactionat constant pressure and temperature, Int. Geol. Rev. 37(1995) 1074^1093.
[28] C.E. Manning, E¡ect of sediments on aqueous silicatransport in subduction zones, in: G. Bebout, D.W.Scholl, S.H. Kirby, J.P. Platt (Eds.), AGU GeophysicalMonograph 96: Subduction Top to Bottom (1996) 277^284.
[29] J.D. Bass, Elasticity of minerals, glasses and melts, in:T.J. Ahrens (Ed.), Mineral Physics and Crystallography:A Handbook of Physical Constants, AGU reference shelf2 (1995) 45^63.
[30] O.L. Anderson, D.G. Isaak, Elastic constants of mantleminerals at high temperature, in: T.J. Ahrens (Ed.), Min-eral Physics and Crystallography: A Handbook of Phys-ical Constants, AGU reference shelf 2 (1995) 64^97.
[31] Y. Fei, Thermal expansion, in: T.J. Ahrens (Ed.), MineralPhysics and Crystallography: A Handbook of PhysicalConstants, AGU reference shelf 2 (1995) 29^44.
[32] G.R. Hel¡rich, S. Stein, B.J. Wood, Subduction zonethermal structure and mineralogy and their relationshipto seismic wave re£ections and conversions at the slab/mantle interface, J. Geophys. Res. 94 (1989) 753^763.
[33] O.L. Anderson, A proposed law of corresponding statefor oxide compounds, J. Geophys. Res. 71 (1966) 4963^4971.
[34] J.-P. Poirier, Introduction to the physics of the earth'sinterior, Cambridge University Press, Cambridge, 1991.
[35] J.P. Watt, G.F. Davies, R.J. O'Connell, The elastic prop-erties of composite materials, Rev. Geophys. Space Phys.14 (1976) 541^563.
[36] G.A. Abers, Hydrated subducted crust at 100^250 kmdepth, Earth Planet. Sci. Lett. 176 (2000) 323^330.
[37] T. Matsuzawa, N. Umino, A. Hasegawa, A. Takagi,Upper mantle velocity structure estimated from PS-con-verted wave beneath the north-eastern Japan arc, Geo-phys. J. R. Astron. Soc. 86 (1986) 767^787.
[38] M. Barazangi, B. Isacks, J. Oliver, Propagation of seismicwaves through and beneath the lithosphere that descendsunder the Tonga island arc, J. Geophys. Res. 77 (1972)952^958.
[39] G. Hel¡rich, Subducted lithospheric slab velocity struc-ture: observations and mineralogical inferences, in: G.Bebout, D.W. Scholl, S.H. Kirby, J.P. Platt (Eds.),AGU Geophysical Monograph 96: Subduction Top toBottom (1996) 215^222.
[40] G.A. Abers, G. Sarker, Dispersion of regional body wavesat 100^150 km depth beneath Alaska: In situ constraintson metamorphism of subducted crust, Geophys. Res.Lett. 23 (1996) 1171^1174.
[41] G. Hel¡rich, G.A. Abers, Slab low-velocity layer in theeastern Aleutian subduction zone, Geophys. J. Int. 130(1997) 640^648.
EPSL 5642 22-11-00
E. Bailey, J.R. Holloway / Earth and Planetary Science Letters 183 (2000) 487^498498