Page 1
i
Experimental Evaluation of GeoJute Reinforced Sand Beds
under Repetitive Loading
by
Suraj D. Vedpathak
A Dissertation Submitted to
Indian Institute of Technology Hyderabad
In Partial Fulfillment of the Requirements for
The Degree of Master of Technology
Department of Civil Engineering
June, 2013
Page 4
iv
Acknowledgements
First and foremost, praise and thanks goes to my savior Lord Ganesha for the
many blessings undeservingly bestowed upon me.
I offer my enduring gratitude to Dr. Sireesh Saride who inspired me in this master
thesis and more than any others, interaction with him shaped the way I think as an
engineer.
This work would not have been possible without support of my research
colleague Vijay (PhD). I sincerely appreciate his assistance and contributions to the
work in this study.
Finally, I’m grateful to Rajashekar for helping and giving me so many valuable
suggestions throughout the thesis. The best suggestion he gave me was to include his
name in acknowledgements.
My experience at IITH was greatly cherished with all friends of 600 series. I
would like to appreciate and thanks my classmates, adorable PhD colleagues and
lovely juniors who went out their way to help me throughout the tenure at IITH.
I would not have accomplished many things without continual care from my
loveable sisters whose unconditional love and constant encouragement kept me
moving in life.
Page 5
v
Dedicated
to
My Parents
Page 6
vi
Abstract
In this research, a series of large scale dynamic model tests were carried out on geojute and
jute-geocell reinforced sand subgrade in controlled laboratory condition. The tests are
conducted on geojute and jute-geocell (made from waste jute bags) reinforced and
unreinforced sand subgrade under repeated loading to simulate traffic conditions. The
placement density of sand in all the tests was maintained at 70% (stiffer subgrade) and 30%
(weaker subgrade). A constant area of geojute and jute-geocell reinforcement was
maintained throughout the test series. Cyclic behavior was investigated through varying the
density, number of geojute layers and geojute arrangement. The influence of the width and
height of the jute-geocell reinforcement on the cyclic behavior of the loading system was
studied and performance improvement in terms of traffic benefit ratios and cumulative
plastic deformation was determined. The loading was applied through a circular steel plate
which replicates the load application from a passenger car replicating a single axle wheel
load. A single axle wheel load was applied through a sophisticated double acting linear
dynamic actuator which is attached to a 3.5m high reaction frame.
Page 7
vii
Nomenclature
b width of geojute / jute-geocell mattress
CPD cumulative plastic deformation
D width of footing
Dg Dial gauge
Df embedment depth of footing
δ surface deformation
H thickness of overlying sand layer
H1 height of reinforced zone with 70% relative density
H2 height of reinforced zone with 30% relative density
If bearing capacity improvement factor
h height of geocell mattress
Δh vertical spacing between consecutive geojute layers
MPT Multi-Purpose Test ware
N number of geojute layers
PRS percentage reduction in footing settlements
Φ angle of shearing resistance
RD relative density
Sr Settlement corresponding to reinforced bed at a given number of cycles
Su Settlement corresponding to unreinforced bed at a given number of cycles
TBR traffic benefit ratio
u depth of top of reinforced zone from the base of footing
Page 8
viii
Contents
Declaration .......................................................................................................................... ii
Approval Sheet .................................................................................................................. iii
Acknowledgements............................................................................................................ iv
Abstract .............................................................................................................................. vi
Nomenclature .......................................................................................................... vii
List of Figures ......................................................................................................... vii
List of Tables .......................................................................................................... xiv
1 Introduction.............................................................................................................1
1.1 Preamble ................................................................................................................... 1
1.2 Mechanism of Reinforcement ................................................................................... 3
1.3 Objective and Scope of the study .............................................................................. 5
1.4 Thesis Organization .................................................................................................. 5
2 Literature Review ...................................................................................................6
2.1 Introduction ............................................................................................................... 6
2.2 Studies on Sand Beds ................................................................................................ 8
2.2.1 Planar Reinforcement ........................................................................................ 8
2.2.2 Geocell Reinforcement .................................................................................... 11
2.3 Studies on Soft Soil Beds ........................................................................................ 15
2.3.1 Planar Reinforcement ...................................................................................... 15
2.3.2 Geocell Reinforcement .................................................................................... 18
2.4 Studies on Stiff Sand/Granular infill overlying Soft Soil Beds .............................. 19
2.4.1 Planar Reinforcement ...................................................................................... 19
2.4.2 Geocell Reinforcement .................................................................................... 21
2.5 Summary ................................................................................................................. 22
3 Materials and Methods.........................................................................................23
3.1 Introduction ............................................................................................................. 23
3.2 Characteristics of Sand ........................................................................................... 23
3.2.1 Sieve Analysis ................................................................................................. 23
3.2.2 Specific Gravity ............................................................................................... 24
3.2.3 Maximum and Minimum Dry Densities .......................................................... 24
Page 9
ix
3.2.4 Direct Shear Test ............................................................................................. 24
3.2.5 Interface Direct Shear Test .............................................................................. 26
3.3 Characteristics of Aggregate ................................................................................... 29
3.3.1 Sieve Analysis ................................................................................................. 29
3.3.2 Specific Gravity ............................................................................................... 29
3.3.3 Water Absorption ............................................................................................ 29
3.4 Characteristics of Geojute ....................................................................................... 29
3.4.1 Wide Width Tensile Test ................................................................................. 30
3.5 Test Methodology ................................................................................................... 31
3.5.1 Test Setup ........................................................................................................ 31
3.5.2 Relative Density Calibration Chart.................................................................. 32
3.5.3 Sand Bed Preparation ...................................................................................... 34
3.5.4 Static and Slow Cyclic Plate Load Tests ......................................................... 34
3.5.5 Cyclic Load Tests ............................................................................................ 35
3.6 Multi-Purpose Test ware ......................................................................................... 36
3.7 General Remarks ..................................................................................................... 36
4 Behavior of Geojute Reinforced Sand Beds .......................................................38
4.1 Introduction ............................................................................................................. 38
4.2 Experimental Programme ....................................................................................... 38
4.3 Test Results ............................................................................................................. 40
4.3.1 General ............................................................................................................ 40
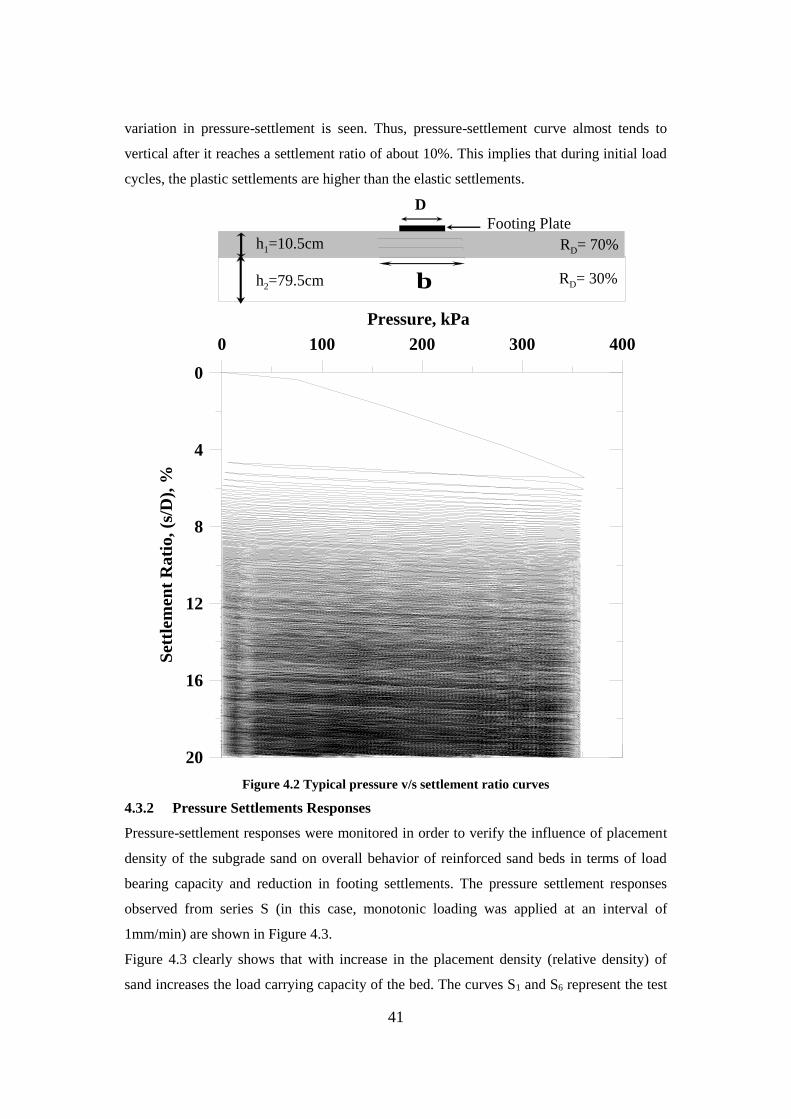
4.3.2 Pressure Settlement Responses ........................................................................ 41
4.3.2.1 Unreinforced Beds and Surface Deformation Responses ..................... 42
4.3.2.2 Effect of Number of Geojute Reinforced Layers in Homogeneous
Dense Sand ........................................................................................... 44
4.3.2.3 Effect of Number of Geojute Layers on Stiffer Beds overlying weaker
Beds ...................................................................................................... 50
4.3.2.4 Effect of Width of Geojute Reinforcement in Homogeneous Dense
Sand……………… .............................................................................. 53
4.3.2.5 Effect of Relative Density of Soil on Reinforced Sand Beds ............... 57
4.4 Concluding Remarks ............................................................................................... 59
5 Behavior of Jute-Geocell Reinforced Sand/Aggregate Beds .............................62
5.1 Introduction ............................................................................................................. 62
5.2 Experimental Programme ....................................................................................... 62
5.3 Model Tests ............................................................................................................. 64
Page 10
x
5.3.1 General ............................................................................................................ 64
5.3.2 Pressure Settlements and Surface Deformation Responses ............................. 66
5.3.2.1 Unreinforced Beds ................................................................................ 68
5.3.2.2 Effect of Width of Jute-Geocell mattress ............................................. 69
5.3.2.3 Effect of Height of Jute-Geocell mattress ............................................ 70
5.3.2.4 Effect of Additional Planar Geojute Reinforcement ............................ 72
5.3.2.5 Comparative Study on Geojute and JuteGeocell Reinforcement Form 72
5.3.2.6 Effect of Aggregate In-fill material ...................................................... 74
5.4 Concluding Remarks ............................................................................................... 76
6 Summary and Conclusions ..................................................................................78
6.1 Summary ................................................................................................................. 78
6.2 Conclusions ............................................................................................................. 79
6.2.1 Geojute Reinforced Beds ................................................................................. 79
6.2.2 Jute-Geocell Reinforced Beds ......................................................................... 79
6.3 Future Scope of the Work ....................................................................................... 81
References .................................................................................................................82
List of Publications from this Research .................................................................88
Page 11
xi
List of Figures
Figure 1.1 Life cycle of a jute material .................................................................2
Figure 1.2 Geosynthetic-soil interaction mechanism ...........................................4
Figure 1.3 Load transfer mechanism of geocell mattress ...................................4
Figure 2.1 Patterns used for construction of geocell .........................................14
Figure 2.2 Section of road prior and after construction ...................................18
Figure 3.1 Particle size distribution curve ..........................................................24
Figure 3.2 Direct shear test apparatus ................................................................25
Figure 3.3 Variation between shear stress and horizontal displacement ........25
Figure 3.4 Normal stress v/s maximum shear stress .........................................26
Figure 3.5 Large scale direct shear apparatus ...................................................27
Figure 3.6 Geojute specimen under testing for interfacial shear .....................27
Figure 3.7 Variation of stress with horizontal displacement ............................28
Figure 3.8 Variation of shear stress with normal stress ....................................28
Figure 3.9 Particle size distriution curve ............................................................29
Figure 3.10 Tensile testing apparatus ...................................................................30
Figure 3.11 Typical setup of loading system used in the study ...........................32
Figure 3.12 Devices used in the preparation of bed .............................................33
Figure 3.13 Calibration curve for the sand used in the study ............................33
Figure 3.14 Typical variation of pressure v/s settlement ratio ...........................34
Figure 3.15 Loading pattern used in the study ....................................................35
Figure 3.16 Typical closed-loop control program in MPT software ..................36
Figure 4.1 Experimental setup of geojute reinforced sand subgrade ..............39
Figure 4.2 Typical pressure v/s settlement ratio curve .....................................41
Page 12
xii
Figure 4.3 Monotonic loading on unreinforced sand (Series-S) .......................42
Figure 4.4 CPD v/s No. of cycles (Series-A) ........................................................43
Figure 4.5 Variation of surface settlements with number of cycles .................44
Figure 4.6 Typical placement of geojute layer in the test tank .........................45
Figure 4.7 Typical leveled sand bed before the test ...........................................45
Figure 4.8 CPD v/s No. of cycles (Series-B) ........................................................46
Figure 4.9 TBR v/s settlement ratio (Series-B) ..................................................47
Figure 4.10 Definition sketch for PRS and If .......................................................48
Figure 4.11 PRS v/s number of reinforcement layers (Series-B) ........................49
Figure 4.12 Surface settlements v/s number of cycles (Series-B) .......................50
Figure 4.13 CPD v/s No. of cycles (Series-C) ........................................................51
Figure 4.14 PRS v/s number of reinforcement layers (Series-C) .......................52
Figure 4.15 Surface settlements v/s number of cycles (Series-C) .......................53
Figure 4.16 CPD v/s number of cycles (Series-D) ................................................54
Figure 4.17 TBR v/s settlement ratio (Series-D) ..................................................55
Figure 4.18 PRS v/s width of reinforcement layers (Series-D) ...........................56
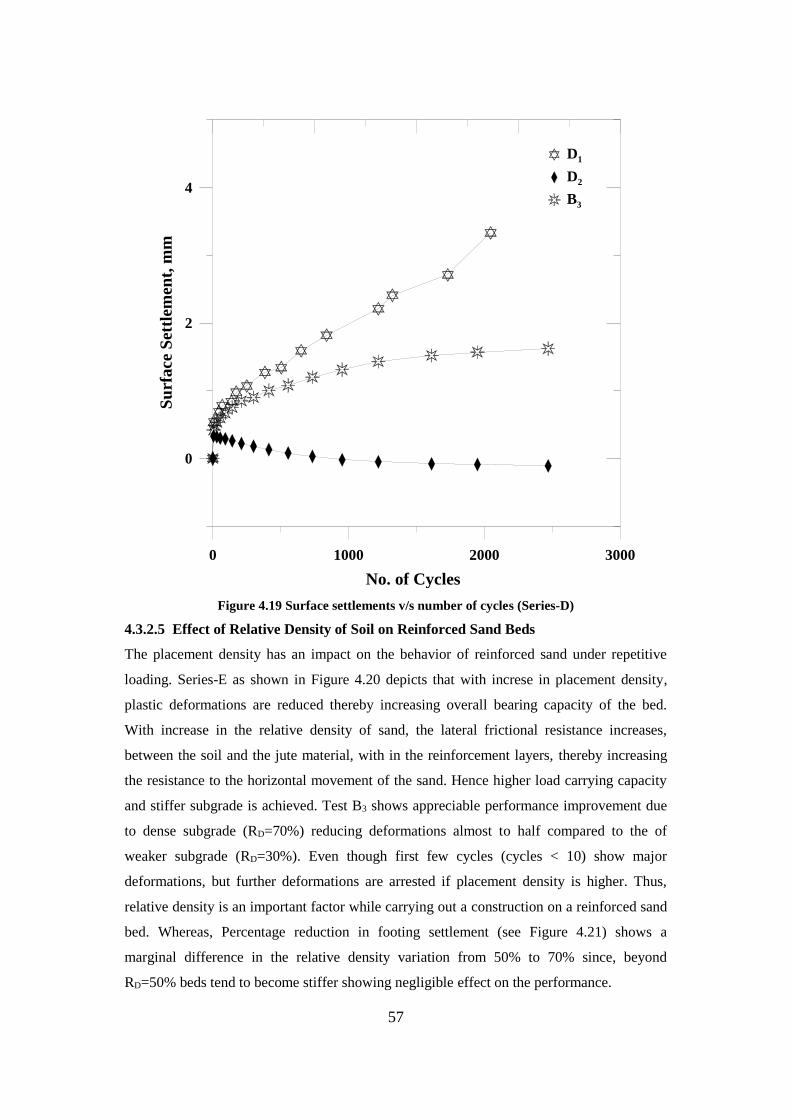
Figure 4.19 Surface settlements v/s number of cycles (Series-D) .......................57
Figure 4.20 CPD v/s number of cycles (Series-E) ................................................58
Figure 4.21 Variation of PRS with relative density (Series-E) ...........................59
Figure 5.1 Experimental setup of jute-geocell reinforced sand subgrade .......63
Figure 5.2 Typical settlement ratio v/s number of cycles ..................................65
Figure 5.3 Hand made jute-geocell used in the study ........................................65
Figure 5.4 Typical pressure v/s settlement ratio curve (Series-I4) ...................66
Figure 5.5 Variation of surface settlements with number of cycles (Series-G2)
...................................................................................................................................67
Figure 5.6 Plate and surface deformations after the test ..................................68
Page 13
xiii
Figure 5.7 CPD v/s No. of cycles (Series-A) ........................................................69
Figure 5.8 CPD v/s No. of cycles (Series-F) ........................................................70
Figure 5.9 CPD v/s No. of cycles (Series-G) ........................................................71
Figure 5.10 Weld failure in jute-geocell (Series-G2) ............................................71
Figure 5.11 CPD v/s No. of cycles (Series-H) ........................................................72
Figure 5.12 Variation of CPD v/s Number of cycles for same area of
reinforcement ......................................................................................73
Figure 5.13 Variation of TBR v/s settlement ratio for same area of
reinforcement ......................................................................................74
Figure 5.14 CPD v/s No. of cycles (Series-I) .........................................................75
Figure 5.15 Reinforced bed prior testing (Series-I4) ............................................75
Figure 5.16 Reinforced bed after test (Series-I4) ..................................................76
Page 14
xiv
List of Tables
Table 3.1 Properties of material .........................................................................30
Table 3.2 Properties of plate ...............................................................................31
Table 4.1 Testing scheme ....................................................................................39
Table 4.2 ESAL and modulus values .................................................................59
Table 5.1 Scheme of experiments conducted on Jute-Geocell reinforced sand
beds.......................................................................................................63
Table 5.2 Results from the test series .................................................................76
Page 15
1
Chapter 1
Introduction
1.1 Preamble
Time immemorial geosynthetics has been serving mankind in one or the other forms. Very
first use of geosynthetics was noticed by for making sand heap. Since then geosynthetics has
got over wide application in last six decades. Ground improvement techniques such as soil
reinforcement are certainly a great remedy to unstable soil problems. Thus, soil
reinforcement such as application of geotextiles can be fully benefited and blend in for
modern construction. Due to ongoing environmental concerns all over the world ecofriendly
and sustainable solutions are very much sought after. To fully explore the benefits and
functional mechanism of geotextiles, their interfacial behavior with infill soil is to be
understood thoroughly. The behavior is usually being investigated in terms of shear
properties between the geotextiles and sand.
Government of India (GoI) spends almost more than $25 billion annually using more than
15000 tons of aggregate for mere stretch of 1km road [1]. Since, 80% of road network in
India is comprised of rural roads stated by a NHDP survey [2] whose performance is always
questionable which forces engineers to seek alternative designs using different materials,
commercial construction aids, and innovative design practices. Among all of commercial
construction aids is utilization of geosynthetics, whose increased popularity is due to their
time tested versatile characteristics. Geosynthetics include a large variety of products
manufactured of different polymers which are adopted in numerous geotechnical and
transportation applications. Often, it is important to estimate the efficacy of such inclusions
in natural ground to improve the design methodologies and construction practices prior their
utilization. In this study, in particular, the natural, waste and green material obtained from
used jute bags are adopted in reinforcement applications under repeated loading and for all
practical purposes, the jute material used in this study is called as geojute material which
resembles coir geotextile in nature.
Page 16
2
Studies on the geojute/coir geotextile reinforcement are being carried out for about half a
century. Geojute is a natural and biodegradable material like coir geotextile. Increased
bearing capacity, stiffness, and tensioned membrane effects were identified as the major
reinforcement mechanisms for geotextile reinforcement [3].
The use of geo-materials for reinforcement as a reinforced soil structures is attractive from
an environment as well as economic viewpoint. Since the reinforcement forms ever used,
many different kinds of geosynthetics have been used and the foremost kind of
reinforcement is geotextile (fiber) reinforcement. These continuous fiber reinforcements
with soil may be of synthetic or natural materials. The natural fibers like jute, coir etc. being
cost effective and of environmental friendly, in contrast to that of synthetic fibers, can be
effectively used for low traffic volume unpaved roads like rural roads. It has the properties
of biodegradability, and is the strongest and most durable material among other natural
materials [4, 5]. Figure 1.1 shows life cycle of a jute material.
Figure 1.1 Life cycle of a jute material
In the case of geotextiles, the interface shear resistance against soil results solely from the
shear resistance between the geosynthetic surfaces against soil particles. In contrary, soil
particles are not interlocked with aperture openings as in case of geogrids. Cancelli et al.
Page 17
3
[11] investigated the shear strength of soil-geogrid interfaces using direct shear tests.
Similar observations were also made by Chia-Nan et al. [10]. Although coir is
biodegradable, due to its high lignin content, its degradation takes place much more slowly
compared to the other natural materials. Geotextiles are particularly effective in roads
constructed over weak subgrade soils [9]. To quantify the benefits, from the geosynthetics
especially in pavement applications, a non-dimensional parameter called traffic benefit ratio
(TBR), which is defined as the ratio number of load cycles obtained in reinforced bed to
unreinforced bed to obtain same amount of permanent deformation, has been introduced and
is expressed in terms of extension of life or by saving in base course thickness. Several
researchers worked on the cyclic behavior of geosynthetic reinforcements using geogrids
observed a TBR of about 3.3 in a large test tank (Haas et al. [7]). Similarly geogrid
reinforcement under a moving single wheel system observed a TBR of 1.2 (Barker et al.
[8]). Similar observations were made by many other researchers where the TBR varied from
1 to 4 under single axle wheel loads (Cancelli et al. [11]). Sreerama Rao A. [6] studied the
effective application of jute geotextiles over weaker pavement subgrade having lesser CBR
value. Recently Senthil et al. [12] have conducted few preliminary California Bearing Ratio
(CBR) tests on coir and jute geotextiles and found that the CBR values were higher for jute
geotextile than non-woven coir textile. Extensive applications of jute geotextiles including
rural roads were summarized by Abdullah [13] in a technical document on submitted to Jute
Diversification Promotion Centre (JDPC), Dhaka, Bangladesh. It is understand from the
literature study that there is a research knowledge gap in understanding the natural geojute
as reinforcement under repeated traffic loading.
1.2 Mechanism of Reinforcement
The reinforcement is very well understood when the in-situ conditions are replicated with
the effect provision of geotextile reinforcement within base course layer of pavements.
Figure 1.2 shows geosynthetic-soil interaction in geosynthetic reinforced pavements.
Page 18
4
Figure 1.2 Geosynthetic-soil interaction mechanism
As shown in figure the tensile force of the geotextile and the frictional force between soil
and geosynthetic reinforcement reduces the vertical and lateral deformation respectively. In
case of jute-geocell, reinforcement has an additional effect due to overall confinement due
to side walls of the geocell and also restrain due to vertical shear between soil and geocell
wall. Figure 1.3 shows the load transfer mechanism and forces acting on due to geocell
reinforcement compared to its unreinforced bed.
Figure 1.3 Load transfer mechanism of geocell mattress
Page 19
5
1.3 Objective and Scope of the Study
Objective of this study is to understand efficacy of reinforced beds under repetitive loading.
In the scope of the study Following aspects are given priority:
To understand the resilient behavior of geo-jute and jute-geocell reinforced sand
beds, sand beds overlying soft soil beds and stiffer beds/aggregate infill overlying
soft beds under repeated traffic loading conditions which can be preferably used in
increasing the life cycle of the unpaved roads.
To know the behavior of geosynthetic reinforcement and factors affecting the
performance of the geosynthetics under repeated loading.
Performance studies in terms of non-dimensional factors like TBR (Traffic Benefit
Ratio), CPD (Cumulative Plastic Deformation) to evaluate efficacy of the
reinforcement material in reinforced beds.
Comparison of various forms of reinforcement on sand beds and their effects on
settlements and heave of the footing.
1.4 Thesis Organization
In Chapter 2 provides the results of an extensive literature work of various factors
influencing reinforced sand beds. In addition, various studies on the soft beds and stiffer
beds/granular infill overlying soft beds for various forms of reinforcements have been
discussed in brief.
Chapter 3 describes the laboratory equipment used to test the sand, aggregate and
reinforcing material. Besides, in this section detailed discussion is done on loading pattern
and test methodology carried during testing.
In Chapter 4 detailed discussion is carried on to understand the influence of geojute
reinforcement on sand subgrade. Various parameters like width of reinforcing material,
number of reinforcing layers, and placement of reinforcing layer are studied to estimate the
benefit and optimality of the reinforced material.
Chapter 5 evaluates the influence of cellular geojute reinforcement (also known as jute-
geocell) on sand subgrade. Apart from some of the parameters discussed above, influence of
height of geocell and infill material is also studied to check the optimality of the material
under repetitive loading.
Conclusion is drawn in Chapter 6 based on the results obtained from Chapter 4 and
Chapter 5 and Future work is predicted from the present research.
Page 20
6
Chapter 2
Literature Review
2.1 Introduction
Roads are the arteries of communication and transportation, and are intended to provide a
level of serviceability with regard to safety and comfort compatible with the volumes, loads,
and speeds of the traffic for which they are intended. Road transport is vital to India’s
economy with annual expenditure of rupees 2,000-3,000 billion. India’s road network is
gigantic and is said to be only after the United States of America. Despite phenomenal
industrial progress, India continues to be mainly a rural country with only a meager 20% of
its total population residing in the cities. The importance of adequately constructed and
maintained rural roads in the context of national economy is self-evident. But one of the
striking underlying facts is the conditions of the roads. In view of massive rural population,
most of the rural areas do not have all weather roads and hence have tough time during
monsoons. According to 11th 5 year plan, INR 15,000 Cr. spent on maintenance of roads.
The amount of expenditure spent in order to repair roads is alarming and stress is given to
improve quality of road. Since roads directly contribute to the economic growth of the
country it is extremely essential that the roads are well laid out and strong. Thus, design of
pavement becomes a herculean task, considering importance of ‘stability’ in road and
accelerated rate at which road network is increasing in India. Thus, it is desirable that the
base of road network lies on subgrade should possess sufficient bearing capacity and should
be good enough for carrying safe carriage of goods and passenger traffic at desired speed
level. Here the term ‘good’ refers to a subgrade which possesses sufficient bearing capacity,
undergoing less settlement due to load or with time, not comprised of expansive soils, and
which is fairly leveled to avoid undulations or potholing in the road. However, it is
understandable that such a terrain and subgrade conditions are highly ideal which generally
does not exist. But, with the help of innovative techniques like geosynthetic reinforcement
the subsidence effects in pavement layers are minimized. An extensive research has been
Page 21
7
carried out to understand the behavior of geosynthetic reinforcement in geotechnical
applications like separation, reinforcement, filtration, drainage and confinement.
This chapter deals with the work carried out by various practitioners and researchers on
geojute and geotextile reinforced earth and pavement structures. However, there are
several research studies available on especially geogrid, only those important studies on
geogrids are included as the key focus of this study is on biodegradable geosynthetics.
Primarily this chapter is subdivided into following sections based on literature studies on
reinforced earth.
Studies on Sand beds
Studies on Soft soil beds
Studies on Stiffer sand / granular infill overlying soft soil beds
The literature work related to planar reinforcement and geocell reinforcement made of
geotextiles or geojute is discussed in detail in each of the above mentioned sections.
Page 22
8
2.2 Studies on Sand Beds
2.2.1 Planar Reinforcement
The concept of reinforced soil was introduced way back in late 1960s by Henry Vidal with
the heap of sand reinforced with pine needles. Soon after systematic approach was carried
by Binquet and Lee [14, 15] by performing series of tests on strip footing supported on
homogeneous sand and sand overlying deep soft soil. In their study, they have observed that
pressure-settlement behavior become stiffer and ultimate bearing capacity increases by
varying number of reinforcement layers and depth of placement of layers from ground
surface. They introduced a non-dimensional term Bearing Capacity Ratio (BCR). BCR is
defined as the ratio of footing pressure of reinforced bed to the ultimate footing pressure on
unreinforced bed at particular given settlement.
A series of laboratory model tests carried out by Guido et al. [16] on rectangular and square
footing showed that bearing capacity ratio at a settlement of 0.1B (B= width of footing
plate) increases rapidly with increasing strip length up to a length of about 0.7B after which
it remains relatively constant. Thus, better results can be obtained for a foundation on
weaker soil strata.
Laboratory model tests have been carried out by Omer et.al [17, 18] for determining the
ultimate bearing capacity of strip and square foundations on sand reinforced with geogrid
layers. Based on the test, the critical depth of reinforcement and dimensions of the geogrid
layers for mobilizing the maximum bearing capacity ratio have been determined and
compared. From observation they have drawn conclusion that for development of maximum
bearing capacity, the effective reinforcement is 2B (B= width of footing plate) for strip
footings and 1.4B for square footings. Further they have observed that maximum width of
reinforcement layers for optimum mobilization of maximum bearing capacity ratio is 8B for
strip and 4.5B for square footings.
Michael et al. [19] have attempted to find out the potential benefits of geogrid reinforced
sand beds supporting large scale model spread footing. An effect of planar geogrid and
geocell reinforcement on performance improvement was studied. Several parameters such
as number of layers of reinforcement, area of reinforcement, depth of initial layer of
reinforcement, vertical spacing between consecutive layers of reinforcement and relative
density of sand bed within soil mass were varied to analyze the performance of maximum
benefit ratio. Maximum benefits ratio occurs when depth of top layer of reinforcement is
within the one fourth width of model footing. In case of single reinforcement performance
improvement depends on higher placement of density. In addition to achieve maximum
Page 23
9
improvement out of single layer of reinforcement, depth should be within 0.4B (B= width of
footing) from the bottom of footing.
Michalowski [20] suggested a kinematic approach of limit analysis for evaluating bearing
capacity of strip footings resting on foundation soils reinforced with horizontal layers of
geosynthetics. He suggested that optimum reinforcement length is four times the width of
footing in an improvement of load bearing capacity beyond which marginal effect was
observed. In his study two mode of soil and reinforcement failure were considered viz. slip
and rupture. Optimum depth of reinforcement was found to be 0.35B for clay and silts and
as high as 0.8B for sands with angle of shearing resistance as 40°. To achieve maximum
benefits in multilayer reinforcement (3 layers in this case) effective spacing between
consecutive layers of reinforcement in sands is found to be 0.6 times width of footing while,
it is 0.2 times width of footing in clays.
Basudhar et al. [21] carried out detailed study on geotextile reinforced sand beds. A square
test tank of dimension 440 x 440 x 210mm was used in the study with different combination
of footing sizes as 30, 45 and 60 mm. From results it was noted that with increase in number
of layer and reduction in footing size, improves equivalent secant modulus. Experimental
results were also compared with FLAC results and found to be well within the acceptable
range.
Busudhar et al. [22] further studied the FEM analysis of geotextile reinforced sand bed
subjected to strip loading. A brief discussion on the theory of string effect and confining
effect is done in their study. They considered the effect of embedment depth ratio (d/B)
variation from 0.2-1.2 on reinforced sand settlement ratio and examined that maximum
settlement reduction with respect to unreinforced soil occurs when embedment depth ratio
(d/B) is at 0.6. Besides they have resulted that the effect of modular ratio on settlement
reduction of soil is minimal when Eg/Es>200 (Eg= Modulus of elasticity of geotextile and
Es= Modulus of elasticity of soil) and found that settlement reduction is 12% at modular
ratio=200.
A series of laboratory test were carried out by Sadoglu et al. [23] on reinforced sand to
evaluate ultimate loads for eccentric loaded model shallow strip footings. The tests were
conducted in a test tank of inner dimensions 0.9 x 0.1 x 0.65 m (length x breadth x height)
with model strip footing of 8mm thick rigid steel plate with V shaped groves at particular
interval for application of eccentric loading. They analyzed that vertical displacement at
failure decrease with increase in eccentricity and reinforced tests show higher bearing
capacity than unreinforced tests for same eccentricity.
Page 24
10
Vinod et al. [24] investigated the effectiveness of horizontally placed braided coir rope
reinforcement on the strength improvement and settlement reduction of loose sand. The tests
were carried out in a fixed tank with square shape of 900 x900mm in plan and 750mm in
depth with model footing of 25mm thick and 150 x150mm in size. On observation it was
noticed that provision of braided reinforcement improves substantially at all level of
normalized settlement. To achieve maximum benefit, location of reinforcement beneath the
base of footing should be at 0.4 times the width of footing. Strength improvement ratio
increases with increase in length ratio of 3 beyond which strength improvement is
substantial. They proposed that almost 6 fold strength improvement and 90% settlement
reduction can be achieved through coir reinforcement.
Puri et al. [25] investigated the settlement of reinforced subgrade under dynamic loading.
Tests were conducted in a rigid steel tank measuring 760mm from all sides and a square
shaped rigid footing of side 76.2mm. It was noticed that ultimate bearing capacity increases
with increasing number of reinforcement layers. Depth of placement of initial reinforcement
and spacing between consecutive layers were kept constant (u/D=h/D=0.33) for all tests.
Also, width of geosynthetic reinforcement was maintained four times width of model
footing. It was observed that increase in reinforcement layer (beyond N=4) does not
enhance the improvement in bearing capacity. Dynamic load tests were conducted based on
the optimum configuration obtained from static load test. Dynamic load was applied using a
rectangular shaped waveform and frequency of 1 Hz.
Lovisa et al. [26] studied the beneficial effects of prestressing the geosynthetic in reinforced
soil foundations supporting a loaded circular footing by performing a laboratory model
study and finite element analysis. Tests were conducted in large test tank with inside
dimensions of 800mm x 800mm in plan and 600mm in elevation with model footing of
100mm diameter and 20mm thickness. They found that load bearing capacity is doubled for
prestressed (with prestress equal to 2% of the allowable tensile strength of geotextile)
reinforced bed as compared to reinforced bed without prestress at 5mm of settlement.
Performance in prestressed reinforced configuration is more effective for greater depth as
compared to the unreinforced and reinforced (without prestress) case.
Discrete element approach was used by Bhandari and Han [27] to understand geotextile-soil
interaction under cyclic vertical load. Micro-parametric study of soil and geotextiles were
determined using biaxial and a tensile test. Sand used in the study was maintained at 70%
relative density. Asphalt Pavement Analyzer (APA) which is used in the study to understand
rut and fatigue behavior of hot mix asphalt samples was modified to simulate soil-
interaction behavior with the help of an aluminium box measuring 0.38 x 0.45 x 0.1m. A rut
Page 25
11
test was carried out by applying 88kN load on a pressurized hose of diameter 25 mm for
16000 cycles (1 cycle= 1 pass). Geotextile sheet was kept at 12.5 and 25mm below the
surface. Large triaxial test, pullout test and plate load test was carried out to understand
geosynthetic-soil interaction. From the tests it was observed that deformation due to
unloading was constant after 25 cycles. They also concluded that geotextile yielded minimal
surface deformation when placed at 12.5mm below the surface when compared to
placement at 25mm under cyclic vertical loading.
An experimental evaluation of the behavior of footings on geosynthetic-reinforced sand was
carried out by Farsakh et al. [28]. Factors affecting the benefit improvement like depth of
placement of initial reinforcement layer, ratio of width of reinforcement layer to the width
of footing plate, vertical spacing between reinforcement layers, tensile modulus, type of
reinforcement were studied. It is inferred from the results that reinforcement layout has a
very important role in behavior of reinforced sand foundations. Results depicted that with
two or more layer of reinforcement, the settlement is reduced almost by 20% at all footing
pressure. It is also presented that combined behavior of geogrid and geotextile show more
performance in improvement than those reinforced with geogrid or geotextile alone.
2.2.2 Geocell Reinforcement
Rea and Mitchell [29] performed laboratory tests to study the influence of the
interconnected paper cells filled with sand as reinforced layer for application of economical
highway construction. They studied various modes of failure viz. cell penetration, cell
bursting, cell wall buckling, bearing capacity failure, bending failure and excessive rutting.
The square shape cell was made of 0.203mm thick paper by keeping constant width of
51cm. The effects of ratio of radius of loaded area to cell width, ratio of the cell width to the
cell height, subgrade stiffness and repeated loading were examined. Results showed that
under static load ratio of loaded area to the cell width establish well within the range of
0.75-1.0 and ratio of cell width to the cell height was around 2.25. Besides cell reinforced
sand showed better resistance to repeated loading. It was noticed that tension in the
reinforcement yield compression on the sand encapsulated in the cell, by giving increase in
stiffness beyond edges of the loaded area and sand gets confined and restricted against
lateral movement, till strength of the cell reaches ultimate value.
Mitchell et al. [30] conducted model tests on geogrid cell reinforced sand beds. The grid cell
reinforced sand layer was placed directly on the rigid concrete for calculation of the
equivalent elastic modulus (Er) for the reinforced layer with the help of elastic theory
solutions for homogeneous elastic layers overlying rigid base. Some parameters were varied
viz. ratio of radius of loaded area to the cell height and ratio of loaded area to cell width to
Page 26
12
study its impact on performance. They proposed an approximate formula to find out the
equivalent elastic modulus (Er) of the reinforced layer.
…………………………………………...(1)
Where, a/B is loaded area to grid geometry ratio; h/B, grid geometry ratio; a/h, layer
geometry ratio; Eg/Em, modular ratio between grid material and cell fill material; Es,
modulus of the subgrade; Eu, modulus of the unreinforced sand layer and Nj is the number
of grid joints per unit area.
Performed test results point out that bearing capacity increases with size of loaded area and
thickness of grid layer. Effective moduli of sand layer improve substantially with grid cell
reinforcement.
Large scale field tests were conducted by De Garidel and Morel [31] on continuous
filaments, micro-geogrids and geotextiles cells filled soils. They compared the stability of
each reinforcement form for road construction by varying geocell width to height ratio as
0.5 and 1.0 and concluded that the reinforced structures showed remarkable strengthening
effects in terms of increased rigidity.
Khay et al. [32] carried out an experimental study to understand the efficacy of numerous
geotextile structures in the benefit improvement of sand subgrades. The geotextiles were
comprised of cell, fiber and prefab sheets. Geocell used in the study had cell to depth ratio
as 0.5 with varying depths of 10, 15 and 20cm. Substantial performance of geocell was
noticed with appreciable settlement reduction behaving like a slab.
Kazerani and Jamnejad [33] performed large scale experimental and FEM analysis on 3D
grid cell confinement systems in granular subgrades. On observation it is depicted that when
granular fill is subjected to cyclic loading each cell shares its load with the adjacent cells to
form overall confinement effect of cell (hoop strength) wall and resistance from adjacent
cell to restrict lateral movement and shear failure.
Koerner [34] noticed that in geocell reinforced foundation system failure is interrupted by
shear strength (τ) between geocell wall and soil contained within a statistically loaded
shallow foundation. For failure to occur the sand in a given cell must overcome the side
friction, punch out of it, there by loading the sand below the level of mattress. Based on the
concept of plastic limit equilibrium he proposed a maximum bearing capacity equation for
statistically loaded geocell reinforced shallow foundation.
Page 27
13
Where, p is maximum bearing capacity stress, τ, shear strength between geocell wall and
soil contained in it (τ = σh tanδ, where, σh is average horizontal force in the geocell (σh =
σvKa where, σv is applied vertical pressure and Ka is coefficient of active earth pressure
(according to Rankine’s theory)) and δ is angle of shearing resistance); c, cohesion; q,
surcharge load (q= γqDq, where, γq is unit weight of soil within geocell and Dq is depth of
geocell); B, width of applied pressure system; γ, unit weight of soil in failure zone; Nc, Nq,
Nγ, bearing capacity factors and 𝜁c, 𝜁q, 𝜁γ, shape factors in accordance with geotechnical
textbooks.
Mandal [35] carried out several tests on use of geocell mattress as reinforcing layer in
highway construction. The geocell used for testing were fabricated by using both woven and
non-woven geotextiles. On observation it was noticed that higher benefit improvement
estimated with CBR of 22 for non-woven type whereas 75 for woven type geocell material.
On calculation it is seen that in certain design procedure the thickness of unreinforced sand
was reduced almost to half with the inclusion of geocell reducing overall cost by 35%.
Dash et al. [36] performed model tests on strip footing on geocell reinforced sand beds with
additional planar reinforcement. The geocell used in the study was made from biaxial
geogrid with square aperture opening of 35mm x 35mm. The longitudinal and diagonal
members were jointed with the help of plastic strip of 6mm wide and 3mm thick. All tests
were conducted on a single layer of reinforcement by keeping constant parameters like
pocket size of geocell, width of the geocell layer and depth to the top of the geocell layer
from the base of the footing and varying height of geocell layer and placement position of
planar reinforcement. Improvement factor obtained from the results was defined as ratio of
footing pressure with additional planar reinforcement at a given settlement to the footing
pressure with geocell mattress without planar reinforcement at same settlement. From the
results maximum performance improvement of geocell mattress with additional planar layer
was obtained when height of geocell is twice the width of footing. Thus, further increase in
height of geocell reduces overall footing performance on combined geocell-planar mattress
since; increase in rigidity takes place leading to uniform settlement at base whilst obtaining
minimal contribution from base reinforcement layer. It is also deduced that overall
performance was negligible when planar layer was placed above the geocell layer. It is
because of the very small overburden pressure on the reinforcement layer generating meager
frictional resistance against tie pullout due to downward penetration of footing.
Dash, Sitharam and Sireesh [37] discussed the performance improvement of circular footing
supported by geocell reinforced sand beds. Several parameters like footing-settlement
response, surface deformations, strains in geocell wall, and pressure distribution below
Page 28
14
geocell wall were measured by conducting tests in test tank with inside dimensions of 900 x
900 x 600mm attached with loading frame assembly. Results indicate that substantial
benefits in terms of stiffness and ultimate load carrying capacity are achieved with the
inclusion of geocell reinforcement. It is seen that ultimate bearing capacity increases with
increase in area of geocell layer as high as 3.5 times the unreinforced case when width of
geocell layer is equal to four times the width of footing. Surface deformations and footing
settlements were measured in non-dimensional terms as δ/D (%) and s/D (%) respectively.
Appreciable reduction in surface heaving was noticed as since load is distributed to the
uniformly the tensile property of geocell wall confines lateral movement of soil and also
adjacent cells oppose movement with back pressure from soil contained in the cell pockets.
Further Dash et al. [38] performed model tests to evaluate performance of different
geosynthetic reinforcement materials in sand foundations. The geocell mattress was made-
up of cutting geogrids of required length and height and placing them in transverse and
diagonal directions connected with bodkin joints. Diamond and chevron pattern were used
to form geocell mattress. The patterns used in the construction of geocell are shown in
Figure 14. The hatched portion depicts the typical geocell pocket opening.
Figure 2.1 Patterns used for construction of Geocell
On observation it is noticed that geocell mattress as a the total reinforcing system acts as an
interconnected cage derived anchorage from both side of loaded area owing to frictional and
passive resistance developed at soil/ geocell interfaces. Because of the shear and bending
rigidity, geocell layer supports the footing even after shear failure of sand inside geocell
pockets.
Influence of static and cyclic loading condition on resilient response of geocell reinforced
sand was presented by Tafreshi and Dawson [39]. Results demonstrated that adequate mass
of geocell causes remarkable decrease in soil surface deformation and subsequently in
footing settlement due to reinforcement action. Whereas, when height to width of footing
Page 29
15
ratio increase from 0.33 to 1.33 the footing behavior changes from unstable response due to
excessive footing settlement to stable response. Also the geocell reinforced bed shows linear
variation when applied stress is slow whereas, disproportionate behavior was noticed under
quick loading condition.
Yang et al. [40] used an effective method of Accelerated Pavement Testing (APT) in
evaluation of pavement performance by applying wheel load under controlled
environmental conditions. In their study ATP test was performed for four unpaved road
sections. The results proved that geocell used in the study has significant role in improving
the stability and reducing permanent deformations in unpaved roads with sand bases. In one
of the thinner geocell reinforced section was noticed with excessive rutting. On subsurface
exploration it was brought to notice that geocell reinforced sand experienced “cell bursting”
a failure caused due to excessive loading on the reinforced base. This failure can be
overcome by providing higher geocell and/ or geocell with higher weld strength.
Shear strength of granular soil is improved significantly due to confinement effect of
geocell. Thus, to understand mechanism better, Confinement effects of geocells on sand
samples under triaxial test were studied by Chen et al. [41]. Volumetric strain is affected
due to variation size and shape of geocell, confining pressure and multiple cell effects. It is
noticed that confinement effect provided by geocells related mainly to the mobilization of
the tensile strength in the geocell which varies with induced volumetric strain. They resulted
that under low confining pressure behavior of geocell reinforced soil is governed by hoop
tension theory whereas under high confining pressure above theory is not applicable since
behavior of reinforced soil is similar to the stiff column subjected to the axial compression.
2.3 Studies on Soft Soil Beds
2.3.1 Planar Reinforcement
Yamauchi and Kitamori [42] reported the usage of synthetic meshes in improving the soft
ground bearing capacity. They explained the construction procedure of sand fill over clayey
hydraulic fill with the inclusion of synthetic mesh at the interface also expressed that
establishment of the sand mat is necessary to allow trafficking of the soft fill by construction
plant. They carried out model tests of same geometry and observed 40% increase in bearing
capacity of soft clayey hydraulic fill.
A case history of the construction of a reinforced high embankment on an extra soft ground
presented by Oikawa et al. [43] showed the successful application of geotextile
reinforcement on peat. Performance of geotextile showed that no evidences of rotational
failure, tension cracks, and extreme large deformation were observed without any ground
Page 30
16
improvement technique even though first stage of construction conducted up to critical
height without rest.
Hirao et al. [44] discussed the effect of bending stiffness of geotextiles on bearing capacity
improvement of soft clay. Based on findings they reported that sand mat placed on soft clay
has little influence on improvement of bearing capacity whereas placement of sand mat with
geotextile covering soft clay contributes to the improvement of bearing capacity of soft clay.
It is also noticed that bending stiffness owned by geotextiles has nothing to do with increase
in bearing capacity of soft clay.
Palmeira et al. [45] carried out back-analysis of geosynthetic reinforced embankment on soft
soils. Six case histories were considered for back-analysis. They found out that back
analysis of an embankment reinforced by geosynthetic layer with significant strain rate
dependency yielded satisfactory results. Also it was noticed analytical solution for factor of
safety for reinforced embankments on soft soil presented accuracy comparable to the slip
circle methods.
Unnikrishnan et al. [46] presented strength improvement due to reinforcement on clay bed
sandwiched between sand layers. They analyzed the behavior of reinforced clay by
conducting static and cyclic loading model test in triaxial compression testing equipment.
Study depicted that grid type of reinforcement is much better in improving strength
characteristics than sheet type of reinforcement because of the interlocking of sand particles
within grid opening.
A case study on construction of a damaged road section on soft marine soil at Kakinada port
area was carried out y Sreerama Rao [6] where in, a section of 360m long and 21.6m wide
was chosen with 1m deep trenches were excavated to a width of 1.2m to anchor jute
geotextiles. It was observed that geotextiles were effective where roads are constructed over
weak subgrade soils, having CR value less than 2. It was further noticed that water content,
void ratio and compression index decreased whereas, dry density and CBR increased on
introduction of jute geotextiles indicating improvement in the engineering behavior which
enhanced road life and even after 7 years of lapse, reinforced road section is still giving a
good service.
Mustafa et al. [47] anticipated beneficial effects of reinforcing weak subgrade soil with
single layer of geogrid and their behavior under static and cyclic loading. Permanent
deformations measured by varying deviator stress, number of load cycles, confining
pressure and reinforcement structure. They presented that with usage of geosynthetic
reinforcement in cohesive soil increases effective cohesion to almost two times. They also
suggested that degree of improvement in both resilient and permanent strains is mainly
Page 31
17
related to soil type and stiffness of the grid. Another observation showed almost 50%
reductions in permanent strains due to reinforcement.
Hufenus et al. [48] discussed membrane and confining effect of geosynthetic reinforced
unpaved road on soft subgrade. Full scale field test was carried out, including compaction
and trafficking, to investigate the bearing capacity and its performance on a soft subgrade.
Due to planar reinforcement significant bearing capacity improvement was achieved on soft
subgrade whereas meager improvement was noticed on stronger and stiffer subgrade.
Significant decrease in case of rut deformation is seen when geotextile reinforcement is
provided. Efficacy of geosynthetic reinforcement shows almost 30% reductions in thickness
of fill layer. In case of same rut depth, geosynthetic reinforcement can sustain maximum
number of vehicle passes when compared to unreinforced. Such type of practice is
beneficial in both economic and ecological aspects.
Tang et al. [49] studied the effect of geogrid properties including aperture size, wide width
tensile strength, and weld/junction strength on pavement stabilization on weaker subgrade
having low California Bearing Ratio (CBR). Properties were evaluated with the help of
interface test, direct test, pullout and Accelerated Pavement Testing (ATP). Study indicates
coefficient of interaction between geogrid and surrounding material play an important role
in pavement stabilization.
Jadhav and Damgir [50] studied the use of geotextile in improvement of bearing capacity of
subgrade. They performed laboratory California Bearing Ratio (CBR) with different soil
(B.C. Soil, Murum and both) types and reinforcement (thick and thin netted woven jute
geotextiles) types. Placement of geotextiles were kept at 1/3, 2/3 and half distance. Results
showed that inclusion of geotextiles improved subgrade strength and improvement was
appreciable (in terms of CBR) when the thick reinforcement was placed at 1/3 distance from
top surface for soil sample of 50% B.C. soil and 50% murum.
Choudhary et al. [51] carried out the field construction study on Andulia-Boyratala road
under PMGSY scheme which starts from Lauhati-Haroa state highway and ends at
Boyalghata. Since, soil condition were very weak (organic silt clay with occasional brown
clay mixed with little sand having soaked CBR value of 3.16%) entire stretch of road was
covered with Jute geotextile. The Figure 2.2 shows the layout of geotextile before and after
completion of road. It is seen from the study that with the help of Jute Geo-Textile (JGT)
pavement thickness got reduced by 85mm from conventional method of design saving up to
75mm thickness of brick aggregates. Further whopping cost reduction of Rs. 60,672.00 per
km stretch of road construction. They concluded that brief effective life of JGT is not a
Page 32
18
discouraging factor as soil gets consolidated to its maximum within year arresting
movement of particle on top.
Figure 2.2 Section of road prior and after construction
Noorzad and Manavirad [52] discussed beneficial effects of using reinforcement to improve
bearing capacity of strip footing on soft clay. A series of finite element analysis was carried
out on footing using two dimensional plane strain model in Plaxis. They reported that
bearing capacity was found to increase with increasing number of reinforcement layers if
reinforcement layers were placed within the range of effective depths. Further it was noticed
from the results that additional increase in reinforcement beyond threshold value does not
benefit in improvement of bearing capacity.
2.3.2 Geocell Reinforcement
Performance studies of road embankment on soft clay supported on a geocell mattress
foundation was completed by Cowland and Wong [53] in territories of Hong Kong. Geocell
mattress was laid to support embankment which has soft clay deposits underneath.
Performance was monitored using pneumatic piezometers, inclinometers, hydrostatic profile
gauges, surface settlement markers and lateral movement blocks. Appreciable improvement
was noticed with geocell reinforced embankment even though at one section excess pore
pressure was identified.
Influence of geocell configuration viz. geocell opening size and height on bearing capacity
and failure mechanism of geocell reinforced soil structure was investigated through
controlled laboratory experiments by Mandal and Gupta [54]. On observation of the results
showed significant improvement in the overall performance in load carrying capacity and
settlement reduction when geocell reinforcement was used.
Mhaiskar and Mandal [55] studied the influence of geocell reinforcement in strengthening
of soft soil subgrade. They conducted the laboratory tests done in mild steel tanks of
dimensions 0.85 x 0.75 x 0.6m and 1.15 x 1.05 x 0.75m (length x breadth x height).
Required density was maintained using standard proctor hammer compaction. The tank was
Page 33
19
filled with marine clay up to 0.48m and the geocell mattress was overlaid on it. It was
noticed that because of higher modulus woven geocell offered higher load bearing capacity
when compared to non-woven geocell even though the former has less seam strength. Thus,
indicating crucial role of modulus of reinforcement in strengthening of soft subgrade.
A series of model tests were conducted by Sireesh et al. [56] to assess potential benefits of
geocell sand mattress over clay subgrade bed with void. The model tests were carried out in
a test tank measuring 0.9m from all sides with footing thickness and diameter of 30mm and
150mm respectively. Influence of width and height of geocell along with relative density
and additional planar base layer on performance of bearing capacity and settlement
reduction was studied. They promoted that to quantify benefits, additional planar base layer
to be laid below the geocell mattress which performs more than 3 times in soft subgrade
with void. Results also pointed that load bearing capacity of footing increases as high as 40
times when coupled with improvement due to sand layer.
2.4 Studies on Stiff Sand/Granular Infill Overlying Soft Soil Beds
2.4.1 Planar Reinforcement
Love et al. [57] has systematically presented effectiveness of geosynthetic reinforcement in
soft soil beds. Model and analytical tests were conducted on granular infill soft soil beds
have shown significant shear stress reduction to the clay subgrade due to provision of
geogrid reinforcement. Also it is noticed that amount of reduction is a function of strength
of soft soil and thickness and stiffness of granular layer. They suggested that proper design
approach is necessary for reinforced fill since slight modification in the unreinforced road
design does not give optimum results.
Ochiai et al. [58] discussed different practice methods carried out in Japan for fill over soft
ground. They emphasized on use of geosynthetic material on soft soil having high water
content and low shear strength improved bearing capacity. Several studies like bearing
capacity theory, cable theory combined with modulus of subgrade reaction theory and plate
theory were useful in designing embankments on soft ground. They recommended
multilayer reinforcement since single layer does not withstand the external forces. Also, it is
suggested to provide an appropriate spacing to ensure proper bonding between soil mass and
reinforcement which acts as a single mass system.
Strength behavior of geogrid reinforced lithomargic clay soil subgrade which is frequently
available in Konkan region was studied in detail by Ravi Shankar and Subba Suresha [59] .
They conducted plate load tests on soaked and un-soaked condition for aggregate base,
reinforced and unreinforced subgrade. On observation it is noticed that Lithomargic clay
loses its strength under high moisture content giving rise to differential settlement which can
Page 34
20
be arrested with the help of geogrid reinforcement. Also results predicted that with the
placement of geogrid reinforcement in subgrade at depth half the width of footing settlement
reduction was almost 45-71% in case of un-soaked condition and 20-51% for soaked
condition.
Role of geotextile reinforcement underneath the embankment built on soft clay is explained
by Sarsby [60] through a parametric study. Based on results it is noticed that reinforcement
force required to maintain given factor of safety against rotational failure falls rapidly with
time due to consolidation of the foundation and greater stability is achieved through use of
geotextiles as basal reinforcement.
Krystyna [61] discussed the influence of geosynthetic reinforcement on load-settlement of
reinforced bed by conducting laboratory experiments on two layered soft subgrade and
comparing results with analytical modeling. Since, it is difficult to obtain naturally
occurring homogeneous bed, they proposed that geosynthetic reinforcement provided at
interface of two layer subgrade show higher benefit load capacity ratio and settlement
reduction. The results from analytical modeling were in accordance with the experimental
results.
Subaida et al. [62] have reported use of coir geotextiles as aggregate reinforcement in
unpaved road sections. Monotonic and repetitive loading tests were conducted in a large
concrete steel tank of 1.5m x 1m x 1m (length x width x height) using with 200mm diameter
and 25mm thick circular plate with a groove at center. Load transfer arrangement is through
load assembly prefabricated using steel channels and plates. To maintain verticality during
test, load is transferred on to the footing with screw and jack arrangement through a steel
ball kept in a groove of the footing plate. Construction of bed was done in two stages viz.
required thickness of clay subgrade overlying with reinforced base using aggregate infill by
compaction. Results reported that for 20mm of footing settlement under monotonic loading
load carrying capacity ratio increased almost to 35% and settlement reduction went down by
as much as 50% when reinforcement was kept at mid depth of the base instead at base-
subgrade interface.
Al Qadi et al. [63] provided a new insight into effectiveness of geogrids on the performance
of low volume flexible pavements. A full scale, highly instrumented (170 sensors) low
volume flexible pavement road sections were constructed on weak subgrade (CBR =4%) for
monitoring pavement performances and measuring pavement responses. The tests were
performed with several variables like tyre configuration, loading, inflation pressure, speed
and travelling offset using Accelerated Transportation Loading Assembly (ATLAS) test
program. They reported that for relatively thick granular base layer, geogrid placement at
Page 35
21
upper 1/3 of the base reduces the shear strain in both longitudinal and transverse direction
whereas for weak pavement base-subgrade interface reduces vertical deflections. Overall
performance in reducing rutting, cracking and lateral deformations was shown by inclusion
of geogrid reinforcement.
2.4.2 Geocell Reinforcement
Bush et al. [64] carried work on design and construction of geocell foundation mattress
supporting embankments over soft grounds. They concluded that differential and total
settlements were reduced due to load distribution through geocell mattress. Also cost
saving up to 30% can be achieved as by constructing geocell reinforced embankment over
soft soil as compared to conventional methods.
Mandal and Gupta [54] executed laboratory tests to analyze the performance of geocell
reinforcement in improvement of bearing capacity on marine clay overlain by sand layer. In
their study the determined the use of geocell with smaller opening size is appropriate for
paved roads where very low settlements are permissible whereas large size geocell can be
used for unpaved roads.
Dash, Sireesh and Sitharam [65] performed model studies on circular footing supported on
geocell reinforced sand underlain by soft clay. The conclusions drawn from their study are
provision of reinforcement in overlying sand layer improves the load bearing capacity with
reduction in settlements. With appropriate dimension of geocell reinforcement seven-fold
increase in bearing capacity can be achieved.
Pokharel et al. [66] conducted model tests to evaluate performance of geocell for base
course for low volume unpaved roads over weak subgrade. They varied base course
thickness keeping constant height of geocell (150mm) and non-woven geotextile as
separator between subgrade and base layer. On observation it was noticed that life of an
unpaved road can be increased up to 3.5 times depending upon aggregate used as infill.
Kumar et al. [67] studied the potential benefits of providing geocell reinforced sand mattress
over clay subgrade. On observation it was noticed that bearing capacity of foundation bed
increases with increase in thickness of geocell mattress. To achieve maximum benefit depth
of placement of reinforcement should be 10% of footing width. Improvement factor as
much as 5.5 times can be obtained with provision of geocell reinforcement two times the
width of footing in sand layer reinforced over clay bed.
Page 36
22
Summary
Initial literature study gives an outlook of the work carried out to understand various types
of reinforcement and its effect on reinforced beds. Some of the important consensuses are
drawn from literature review.
Planar form of reinforcement is commonly used in the most of the geosynthetic
application.
Emphasis is given in the study of surface footing resting on reinforced beds.
Several studies stated benefit of the use of reinforcement in improvement of bearing
capacity, settlement reduction and subgrade modulus.
Most of the studies concentrated on monotonic loading.
Honeycomb like structure gained popularity over the period due to property of
confinement effect.
Some of the studies mentioned benefit of use of additional layer of reinforcement at
the base of geocell mattress.
Though literature covers major aspect of reinforcement a very little attention is
given on the environmental friendly material like geojute and jute-geocell. There is need of
an hour to promote environmental sustainable solutions through green material.
In view of this, following chapters encompass experimental evaluation of reinforced sand
beds, stiff beds overlying soft beds and infill material over soft bed under repetitive loading.
Page 37
23
Chapter 3
Materials and Methods
3.1 Introduction
To understand the behavior of material on reinforced beds viz. sand beds, soft soil beds, stiff
beds, granular and aggregate infill etc. it is necessary to understand the material
characterization. Thus, in this chapter, the details of material and their characterization are
discussed.
3.2 Characteristics of Sand
The sand used in the study is dry sand, procured from Krishna river basin, Vijayawada. It
was air-dried by spreading in thin layers over a large area and sieved through 4.75mm sieve
to remove gravel particles.
3.2.1 Sieve Analysis
The particle size distribution of the sand was determined by dry sieve analysis as per IS
2720 (part-IV)-1985. The sand is classified as poorly graded sand with letter symbol SP
according to the Indian Standard Soil Classification System (ISSCS) since, coefficient of
uniformity, Cu is equal to 2.4. Coefficient of curvature, Cc was found to be equal to 1.01.
(Cu<6 is termed as poorly graded). The size of particle ranges from 0.15mm to 2.36mm.
Effective diameter (D10) of a soil sample is 0.20 and average grain size (D50) of the particle
is 0.50. The particle size distribution of the sand is shown in Figure 3.1.
Page 38
24
0.01 0.1 1 10
Particle Diameter, mm
0
10
20
30
40
50
60
70
80
90
100
Per
cen
t F
iner
, %
Cc=1.07
Cu=2.40
Figure 3.1 Particle size distribution curve
3.2.2 Specific Gravity
Specific gravity is conducted as per IS: 2720 (Part-III) – 1980 and a specific gravity of sand,
Gs, equal to 2.63 is obtained.
3.2.3 Maximum and Minimum Dry Densities
The physical property such as maximum and minimum void ratios of sand were determined
according to IS: 2720 (Part-XIV) – 1983. The maximum (γdmax) and minimum (γdmin) dry
density of the sample is 16.86 kN/m3 and 15.1 kN/m3. Thus, maximum (emax) and minimum
(emin) void ratio is 0.74 and 0.51 respectively.
3.2.4 Direct Shear Test
Direct shear tests conducted on unreinforced sand are performed in a small shear box of
dimensions 100mm x 100mm x 30mm as shown in Figure 3.2. The sand is compacted at its
70% relative density. These tests were conducted at 40kPa, 80kPa and 120kPa of normal
stresses to obtain the angle of shearing resistance of sand.
To know the shear strength parameter of the sand sample, direct shear tests are conducted as
per IS 2720 (Part XXXIX/Sec. I). Shear box has in-built horizontal and vertical load cells
has maximum capacity of 4.4kN and maximum allowable displacement of the box is 25mm.
Linear Variable Displacement Transformers (LVDT) are attached to the horizontal and
vertical dimension to measure the respective settlement of sand. The rate of displacement is
maintained at 1mm/min for all the tests. Values are recorded at every 1mm of horizontal
Page 39
25
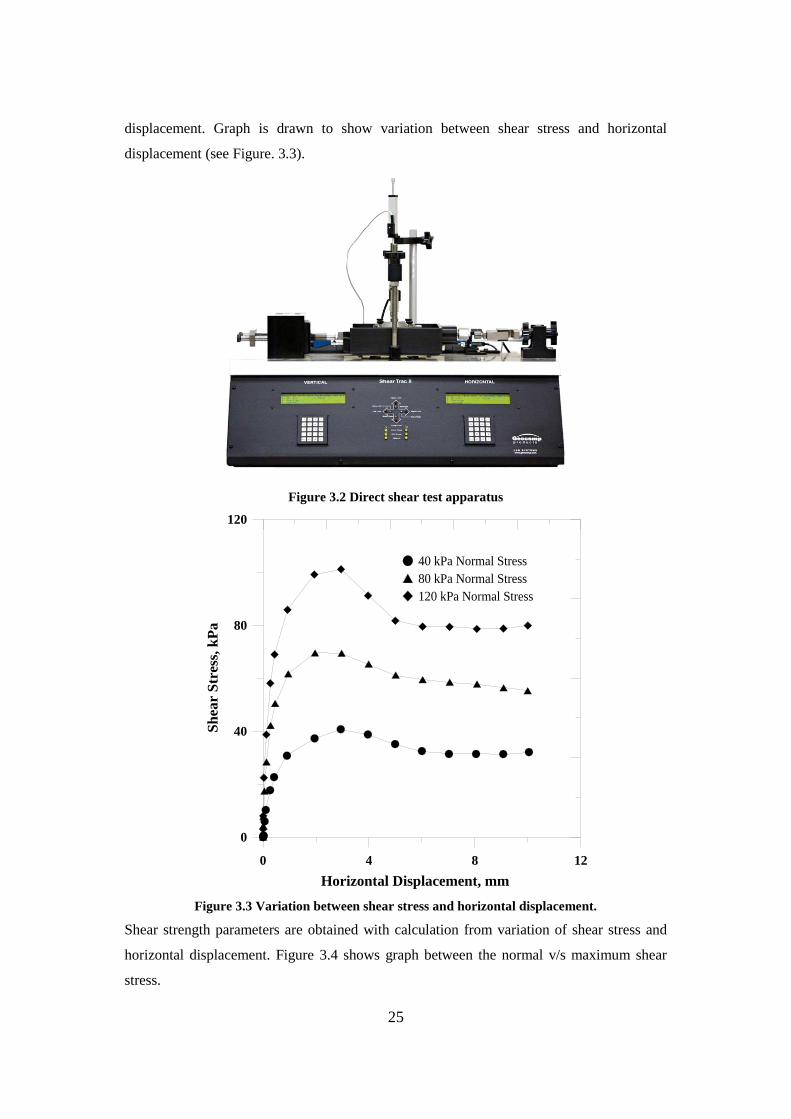
displacement. Graph is drawn to show variation between shear stress and horizontal
displacement (see Figure. 3.3).
Figure 3.2 Direct shear test apparatus
0 4 8 12
Horizontal Displacement, mm
0
40
80
120
Sh
ear
Str
ess,
kP
a
40 kPa Normal Stress
80 kPa Normal Stress
120 kPa Normal Stress
Figure 3.3 Variation between shear stress and horizontal displacement.
Shear strength parameters are obtained with calculation from variation of shear stress and
horizontal displacement. Figure 3.4 shows graph between the normal v/s maximum shear
stress.
Page 40
26
0 40 80 120 160
Normal Stress, kPa
0
40
80
120
Sh
ear
Str
ess,
kP
a
Direct Shear Test, = 37°
Figure 3.4 Normal stress v/s maximum shear stress
From Figure 3.4 the apparent cohesion and angle of shearing resistance is found to be 6.8
kPa and 37°, respectively.
3.2.5 Interface Direct Shear Test
In this study, large scale direct shear tests were carried out to determine the angle of
shearing resistance (Φ) by shearing geojute with sand material and only with sand material.
The tests were conducted under normal pressures at 40kPa, 80kPa and 120kPa respectively.
The tests were ended at the horizontal displacement of 10mm.
The interface shear strength parameters are calculated using fully automated direct and
residual shear tests on Shear Trac-II Systems under laboratory controlled conditions. The
Shear Trac-II system consists of a Shear load frame of capacity 44kN with a computer
attached network card for test control and data acquisition. Microsoft Windows application
software, called SHEAR is used for running the test. The large Shear box is of dimension
300mm× 300mm×200mm as shown in the Figure 3.5. After filling lower box through
required compaction technique (for maintaining 70% relative density in the box), Geojute of
size 320 mm wide and 500 mm long and whose weight is 80 gms is firmly attached to the
lower box. Figure 3.6 shows typical the sand specimen prepared in large scale shear box
with interfaced geojute material. Upper box is placed over it and required density sand is
filled. During tests, the sand is forced to slide along geojute under constant rate of
Page 41
27
displacement of 1mm/min, while a constant load is applied normal to the plane of relative
movement. The normal and shear forces applied to determine the point of failure.
Figure 3.5 Large-scale direct shear apparatus
Figure 3.6 Geojute specimen under testing for interfacial shear
It can be seen from Figure 3.7 that the shear stress values have reached to its peak and then
reduced to constant value for unreinforced case whereas for geojute reinforced case, the
shear stress was showing increasing trend until the end of the test. From the tests it is
observed that the angle of shearing resistance of the unreinforced sand is 37.0° and for the
geojute reinforced sand specimen the interfacial shear angle, δ is observed to be 30.9°. The
angle of shearing resistance and interfacial shear angle are presented in Figure 3.8. The
interfacial shear angle is found to be well within the range of values commonly observed for
geotextile materials.
Page 42
28
0 4 8 12
Horizontal Displacement, mm
0
40
80
120
Sh
ear
Str
ess,
kP
a
Reinforced, v=120 kPa
Unreinforced, v=120 kPa
Reinforced, v=80 kPa
Reinforced, v=40 kPa
Figure 3.7 Variation of stress with horizontal displacement
20 40 60 80 100 120 140
Normal Stress, kPa
20
40
60
80
100
120
140
Sh
ear
Str
ess,
kP
a
Direct Shear Test, = 370
Interface Shear Test,
Figure 3.8 Variation of shear stress with normal stress
Page 43
29
3.3 Characteristics of Aggregate
The material used for the study is aggregate infill material having fines obtained from the
local suburban quarry site near Hyderabad. Fine contents are removed by screening it
through 4.75mm sieve.
3.3.1 Sieve Analysis
Particle size distribution of aggregates is done by preforming dry sieve analysis as per IS.
Based on sieve analysis aggregate is classified as poorly graded. Fig. 3.9 shows the particle
size distribution curve.
Fig. 3.9 Particle size distribution curve
3.3.2 Specific Gravity
Specific gravity test is conducted as per IS: 2386-Part-3 and specific gravity value, Gs, equal
to 2.646 was obtained.
3.3.3 Water Absorption
Water absorption test was conducted according to IS: 2386-Part-3 and it was found that
water absorption of aggregate in the study is 0.251%.
3.4 Characteristics of Geojute
A waste jute material, from packaged jute bags is used in the study. The jute was cut into
various sizes and shapes for the testing purpose. Several tensile tests were conducted on a
Tinius Olsen tensile testing apparatus (as shown in Figure 3.10) with maximum capacity of
150kN for understanding the strength-elongation behavior of geojute material.
Page 44
30
Figure 3.10 Tensile testing apparatus
3.4.1 Wide width tensile test
A wide width tensile test conducted as per ASTM D-4595-11. Results show that a tensile
strength of geojute is 4.9kN/m.
Following Table 3.1 shows the comparison of Geojute material properties with the IJIRA
Jute-Geotextile. It is to be noted that the geojute used in this study is from waste gunny bags
with almost half the thickness of commercially available jute-geotextiles.
Table 3.1 Properties of material
Properties Values
(Present Study)
Values
(IJIRA)
Material Woven Geojute Jute-Geotextiles
Thickness (mm) 1.76 3.6
Mass per unit area
(kg/m2)
0.513 0.52
Aperture Size (mm) 1.65 x 1.65 2.8 x 2.8
Ultimate tensile
strength (kN/m)
4.9 5.7
Page 45
31
3.5 Test Methodology
3.5.1 Test Setup
The sand beds with 70% relative density were prepared in a test tank measuring
inner dimensions of 1m × 1m x 1m (length x width x height). A rigid thin steel plate
of 150 mm diameter (D) and 15 mm thickness was used to apply the repeated traffic
loading. The size of the plate was chosen such a way that the area of the plate
resembles the area of tire pressure. Following Table 3.2 shows properties of plate
used in the study.
Table 3.2 Properties of Plate
Properties Values
E (MPa) 2 × 10⁵
Μ 0.2
K (MPa) 1.11 × 10⁵
G (MPa) 0.83 × 10⁵
Loading was given by graphical user interfaced MTS MPT software with the help of
hydraulic power unit (HPU), hydraulic service manifold (HSM) and sophisticated
double acting linear dynamic 100 kN capacity actuator which is attached to a 3.5 m
high, 20ton capacity reaction frame as shown in Figure 3.11.
Page 46
32
Figure 3.11 Typical Setup of loading system used in the study
3.5.2 Relative Density Calibration Chart
To determine the density with which sand is to be placed in the test tank, a special technique
called sand raining or pluviation technique is used. To achieve this, a special device is
designed. It consists of a long steel pipe of diameter 30mm with a cone fixed at the bottom.
Apex of the cone is pointed up with cone apex angle of 60°. This pipe is fitted with a
movable scale to arrange different heights. An arrangement of a typical setup is shown in
Figure 3.12.
Page 47
33
Figure 3.12 Devices used in the preparation of bed
Calibration tests were conducted to obtain a relation between relative density and height of
fall as a calibration chart. Placement densities were measured physically by collecting
samples in small containers whose weights and volumes were known. With the known
values of the minimum and maximum void ratios of sand taken in the investigation, a
calibration chart was prepared for the height of fall against the corresponding relative
density. For any required relative density corresponding height of fall can be read from
calibration chart shown in Figure 3.13.
0 10 20 30 40 50 60
Height of Fall, cm
10
20
30
40
50
60
70
80
Rel
ati
ve
Den
sity
(R
D),
%
Figure 3.13 Calibration curve for the sand used in the study
Page 48
34
3.5.3 Sand Bed Preparation
The sand was placed in the test tank using a raining technique. This device has a hopper
with a pipe welded to its bottom which is 400 mm long with an inverted cone welded at its
tip. The sand passes through this 30 mm internal diameter pipe and disperses at bottom by a
60° inverted cone. The height of fall to achieve the desired relative density was determined
by performing a series of trials with different heights of fall earlier. In each trial, the
densities were monitored by collecting samples in small cups of known volume placed at
different locations in the test tank. With the known values of the minimum and maximum
void ratios of sand in the study, a calibration chart was prepared for the height of fall against
the corresponding relative density as shown in Figure 3.13. The height of fall can directly
read from the graph corresponding to the required relative density. In all tests, the relative
density of sand was kept constant at 70 % and 30% for each series of test.
3.5.4 Static and Slow Cyclic Plate Load Tests
The static and cyclic plate load test were carried to estimate the modulus of subgrade
reaction, shear modulus and modulus of elasticity of unreinforced and reinforced sand
subgrade. Slow incremental loading rate of 0.1kN/sec was applied up to 2kN with relieve of
load at 0.5kN, 1kN and 1.5kN. A typical variation of pressure v/s settlement ratio due to
slow cyclic plate load test for jute-geocell reinforced sand bed with b/D=2 and h/D=1 is as
shown in Figure 3.14.
Figure 3.14 Typical Variation of Pressure v/s Settlement Ratio
Page 49
35
3.5.5 Cyclic Load Tests
The procedure to test the beds under cyclic loads was in accordance with the Indian
Standard code IS 1880: 1982 (reaffirmed 1998). Upon filling the test tank up to the desired
height, the fill surface was leveled and the loading plate was placed on a predetermined
alignment such that the loads from the actuator applied would be transferred concentrically
to the footing to avoid eccentricity. To facilitate this, a recess was made into the footing
plate at its center to accommodate a ball bearing through which vertical loads were applied
to the plate. In the case of reinforced beds, upon ceasing the pluviation at predetermined
depth, the geojute/jute-geocell was stretched on the leveled subgrade and continued the sand
pluviation to fill the geojute/jute-geocell mattress.
The plate was located carefully at the center of the actuator against the reaction frame to
avoid eccentric loading. The cyclic load was applied to a loading plate using a computer-
controlled servo hydraulic actuator, with a maximum load of 7 kN and a minimum on 0.7
kN using a continuous haversine loading pattern as shown in Figure 3.15.
0 2 4 6 8
Time, s
0
2
4
6
8
Load
, k
N
Figure 3.15 Loading pattern used in the study
The load was estimated based on the field data using a strain type total pressure cells buried
under subbase layer just above the subgrade. Similar loading pattern was also adopted by
Edil et al. [68] for the case of geocell reinforced granular subbase layer. Since the
Page 50
36
intermediate layers have not been simulated in this model tests, the pressure exerted on to
the subgrade was directly applied through a plate. A 10% of load (0.7 kN) was constantly
applied on the plate to make the cycle a closed loop. The load form was applied at a
frequency of 1.0 Hz. Multi-Purpose Test Ware (MPT) software was set up to control and
acquire the applied load data as well as the deformation data.
3.6 Multi-Purpose Test ware
MPT (Multi-Purpose Test ware) allows user to create complex test designs with discrete
processes. Each process thus represents an individual test activity. A set of processes is
grouped together in a closed loop to generate a haversine loading pattern discussed in
Section 3.5.5. The tests can be done into two way viz. Force controlled method and
Displacement controlled method. The tests done in the study were based on Forced
controlled method in which the configuration of devices provides a means of comparing a
command signal (programmer output) to generate a signal with a feedback (transducer
output) signal to generate a signal that controls a servo valve. The servo valve controls
hydraulic flow of the actuator which moves the actuator piston rod. The actuator piston rod
is applies the force required to displace the component to be tested. Entire process is
referred as “closed-loop control system” since, process of command, feedback, comparison
and servo valve is a function of control circuitry and occur without operator interaction. A
typical MPT close-loop control program is shown in Figure 3.16.
Figure 3.16 Typical close-loop control program in MPT software
3.7 General Remarks
In this chapter, a detailed characterization of each material used in this study was discussed.
An elaborate discussion on the test setup and procedures followed to understand the
Page 51
37
behavior of geojute materials is presented. The MPT software is briefly discussed along
with the adopted loading pattern for conducting the cyclic load testing program.
Page 52
38
Chapter 4
Planar Geojute Reinforced Sand
Subgrades
4.1 Introduction
In this chapter the behavior of the planar geojute reinforced sand subgrades subjected to
cyclic loading is discussed. Influence of various parameters such as width of reinforcement
layers (b), number of reinforcement layers (N) are studied to understand the efficacy of
geojute material to achieve maximum performance benefits. In addition, experimental
results due to variation of relative density on reinforced sand beds are presented.
Performance improvement is presented in terms of non-dimensional parameters viz. Traffic
Benefit Ratio (TBR), Cumulative Plastic Deformation (CPD), Improvement Factor (If) and
Percentage Reduction in Settlements (PRS).
4.2 Experimental Programme
Figure 4.1 shows the experimental setup of geojute reinforced sand subgrades. A series of
experiments were conducted with variable parameters in terms of normalized ratios (u/D,
b/D, N) as described in Table 4.1. Within each series, one particular parameter was varied,
while the other parameters were kept at a constant value, to understand the effect of a
particular parameter on the overall behavior of the reinforced bed. Total six series of tests
were conducted. In Table 4.1, the nomenclature with subscript (in column 4) defines test
series and the testing scheme. In series S, static load tests were conducted on unreinforced
sand beds while varying the placement density of sand where rate of loading was
maintained at 1mm/min. In series A, repeated load tests are conducted on unreinforced sand
beds varying the relative density of the subgrade sand. In addition, a test is also done on
sand with aggregate infill material. In series B and C, tests are done on geojute reinforced
sand beds by varying number of geojute layers and also varying the placement of density
whereas keeping all other parameters (u/D, b/D, D) at a constant value. In series D, effect of
width of reinforcement layer on efficacy of the reinforcement system was studied. Series E
Page 53
39
was carried out with the variation in relative density by keeping all other parameters (u/D,
b/D, D) constant.
Figure 4.1 Experimental setup of geojute reinforced sand subgrade
Table 4.1 Testing scheme
Test
Series
Type of
Reinforcement
Details of Test
Parameters
Nomenclature Testing Scheme
(Subscript replicates Series)
S
Monotonic
Loading
(Static)
Constant
Parameter: Rate of
loading; 1mm/min
S1
S2
S3
S4
S5
S6
1. RD=30%
2. RD=70%+30%, h1=6cm, h2=84cm
3. RD=70%+30%, h1=10.5cm,
h2=79.5cm
4. RD=70%+30%, h1=16.5cm,
h2=73.5cm
5. RD=70%+30%, h1=21cm, h2=69cm
6. RD=70%
Page 54
40
A
Unreinforced
(Cyclic)
Constant
Parameter:
D=150mm
A1
A2
A3
A4
A5
A6
A7
1. RD=30%
2. RD=70%+30%, h1=6cm, h2=84cm
3. RD=70%+30%, h1=10.5cm,
h2=79.5cm
4. RD=70%+30%, h1=16.5cm,
h2=73.5cm
5. RD=70%+30%, h1=21cm, h2=69cm
6. RD=70%
7. RD=30%+Aggregate Infill, h1=21cm,
h2=69cm
B
Geojute
Reinforced
(Planar)
Constant
Parameters:
RD=70%, u/D=0.1,
b/D=4, D=150mm.
B1
B2
B3
B4
B5
1. N=1
2. N=2
3. N=3
4. N=4
5. N=5
C
Geojute
Reinforced
(Planar)
Constant
Parameters:
RD=70%+30%,
u/D=0.1, b/D=4,
D=150mm.
C1
C2
C3
C4
1. N=2
2. N=3
3. N=4
4. N=5
D
Geojute
Reinforced
(Planar)
Constant
Parameters:
RD=70%, u/D=0.1,
N=3, D=150mm.
D1
D2
B3
1. b/D=2
2. b/D=3
3. b/D=4
E
Geojute
Reinforced
(Planar)
Constant
Parameters: b/D=4,
u/D=0.1, N=3,
D=150mm.
E1
C2
B3
1. RD=30%.
2. RD=70%-30%.
3. RD=70%.
4.3 Test Results
4.3.1 General
The results are presented in terms of bearing pressure and settlement ratios. The settlement
ratio is defined as the ratio of settlement of loading plate to the width of the plate, expressed
in percentage. Typical bearing pressure-settlement ratio curve is shown in Figure 4.2. The
test bed configuration schematic is shown above the Figure 4.2. It is seen from the graph
that for the first few cycles (Number of cycles <10), the variation between pressure and
settlement is noticeable. Further, with increase in the number of load cycles, not much
Page 55
41
variation in pressure-settlement is seen. Thus, pressure-settlement curve almost tends to
vertical after it reaches a settlement ratio of about 10%. This implies that during initial load
cycles, the plastic settlements are higher than the elastic settlements.
20
16
12
8
4
0
Sett
lem
en
t R
ati
o, (s
/D),
%
0 100 200 300 400
Pressure, kPa
Footing Plate
D
RD= 70%
RD= 30%
h1=10.5cm
h2=79.5cm b
Figure 4.2 Typical pressure v/s settlement ratio curves
4.3.2 Pressure Settlements Responses
Pressure-settlement responses were monitored in order to verify the influence of placement
density of the subgrade sand on overall behavior of reinforced sand beds in terms of load
bearing capacity and reduction in footing settlements. The pressure settlement responses
observed from series S (in this case, monotonic loading was applied at an interval of
1mm/min) are shown in Figure 4.3.
Figure 4.3 clearly shows that with increase in the placement density (relative density) of
sand increases the load carrying capacity of the bed. The curves S1 and S6 represent the test
Page 56
42
bed with sand relative densities corresponding to 30% and 70%. The intermediate curves
represent the beds with stiffer sand layer (RD = 70%) overlaying weaker sand subgrade (RD
=30%) for different thickness of the upper layer. It is clear from these curves that the
bearing capacity of the weak subgrade can be improved by placing a dense granular layer;
however, the performance of the weaker subgrades may not be improved to a required
degree without a proper reinforcement in the upper layer. It is noted that the bearing
capacity of the weak subgrade has been increased by 1.5 times. Similar results were noticed
by Sireesh [69].
8
6
4
2
0
Set
tlem
ent
Rati
o, (s
/D),
%
0 100 200 300 400 500
Pressure, kPa
Series-S
S1
S2
S3
S4
S5
S6
Figure 4.3 Monotonic loading on unreinforced sand (Series-S)
4.3.2.1 Unreinforced Beds and Surface Deformation Responses
Series-A shows the variation of CPD with No. of cycles under repetitive loading for
different configurations of unreinforced beds, i.e., weak sand subgrades with and with out
different heights of dense sand overlays. Figure 4.4 clearly shows that the failure for weaker
subgrades with in first few cycles (Number of cycles <10), whereas, with increase in
relative density of upper layer shows better performance in reducing the CPDs to a great
extent. For sand bed with RD equal to 70%, as much as 90 cycles are required to reach 20%
Page 57
43
of cumulative plastic deformation, where as subgrade with RD = 30% reached 100%CPD at
5 cycles. Hence, it is clear that with an increase in placement density, overall load bearing
capacity of the sand bed increases. In case of aggregate overlying weaker sand beds shows a
significant improvement with number of cycles reaching almost 2500 (Series A7) for 20%
CPD.
0 40 80 120 160 200
No. of Cycles
0
40
80
120
Cu
mu
lati
ve P
last
ic D
eform
ati
on
(C
PD
), %
Series-AA1
A2
A3
A4
A5
A6
A7
Figure 4.4 CPD v/s No. of cycles (Series-A)
The surface deformation characteristics of the reinforced beds were recorded through set of
dial gauges as shown in Figure 4.1 were plotted against the footing settlement. The surface
deformations were measured through four dial gauges placed on either side of plate and on
the leveled surface on the test bed at a distance of 1D and 1.5D from the center of the
footing (see Fig. 4.1). From Figure 4.5, it is noticed from the surface settlement plots that
there is very negligible movement of the fill surface. It is also interesting to note that the
surface deformations measured on either side of the loading plate are same and hence shows
that the plate is settling uniformly. The place deformations were measured through two dial
gauges placed on the plate and compared the data with the inline actuator LVDT. Both the
measurements from the dial gauges and the LVDTs are matching and showing that there is
Page 58
44
no tilt in the loading plate movement with the application of the load. A very little change in
the plate settlement is seen at a settlement ratio of 20%.
0 1000 2000 3000 4000
No. of Cycles
0
10
20
30
40S
ettl
emen
t, %
Actuator Settlement (mm)
Surface Settlement (mm), Dg-1
Plate Settlement (mm), Dg-2
Plate Settlement (mm), Dg-3
Surface Settlement (mm), Dg-4
Figure 4.5 Variation of surface settlements with number of cycles
4.3.2.2 Effect of Number of Geojute Reinforced Layers in homogeneous dense sand
Figure 4.8 shows the effect of number of geojute layers on overall performance of the
homogenerous reinforced sand beds wherein geojute layers are placed at succesive interval
of u/D=0.1. Whereas, Figure 4.6 illustrates the placement of the geojute layer in the test
tank with incorporation of preliminary checks of centering with plumb bob arrangement and
Figure 4.7 displays the bed condition after the entire sand bed is prepared with required
density. A proper care has been taken while leveling the surface. A stepped light weight
wooden plank of 35cm x 35cm in plan and 6mm height is used for the tamping the surface,
by giving a single blow of a rubber hammer from a approximate height of fall equal to
10cm.
Page 59
45
Figure 4.6 Typical placement of geojute layer in the test tank
Figure 4.7 Typical leveled sand bed before the test
It is seen from Figure 4.8 that even with single layer of reinforcement appreciable
performaance is achieved. An optimum number of reinforcement layers were evaluated
through this test series. It is observed that with 3 geojute reinforcement layers (test-B4)
higher performance in terms of CPDs and benefit ratio is achieved. Beyond which an
appreciable increase in benefit is not seen. Thus, saving the material and overall cost of
construction.
Page 60
46
0 40 80 120 160 200
No. of Cycles
0
20
40
60
80
Cu
mu
lati
ve P
last
ic D
eform
ati
on
(C
PD
), %
Series-BA6
B1
B2
B3
B4
B5
Figure 4.8 CPD v/s No. of cycles (Series-B)
Overall performance of the number of layers of geojute material in reinforced sand beds is
tested through a non dimensional parameter Traffic Benefit Ratio (TBR) which is defined as
a ratio of number of cycles of reinforced sand (Nr) to that of unreinforced sand (Nu)
calculated at a given settlement ratio. The following is a mathematical equation for TBR
evaluation.
u
r
N
NTBR
Figure 4.9 shows TBR improvement with inclusion of number of layers of reinforcement.
TBR increased by 4 with single layer of reinforcement to as high as 27 with inclusion of 3
layers of reinforcement at 15% of settlement ratio. Further, TBR increased to 70 @ 20% of
settlement ratio showing substantial improvement for three layers of reinforcement.
Page 61
47
0 4 8 12 16 20
Settlement Ratio, s/D (%)
0
20
40
60
80
100
TB
RB1
B2
B3
B4
Figure 4.9 TBR v/s settlement ratio (Series-B)
The performance improvement can also be attributed by percentage reduction in footing
settlements (PRS). Figure 4.10 shows the definition sketch for calculation of percentage
reduction in footing settlement. It is calculated as ratio of footing settlements of reinforced
beds to the settlements of unreinforced beds as shown below.
100
u
ru
S
SSPRS
Where Su and Sr are settlements corresponding to unreinforced and reinforced beds at a
given number of cycle. In addition, benefit effects can also be accredited by Improvement
Factor which is defined as ratio of bearing pressure corresponding to reinforced bed to the
unreinforced bed at given settlement. It is denoted by If and formulated as follows.
u
rf
q
qI
Page 62
48
8
6
4
2
0
Set
tlem
ent
Rati
o, s/
D (
%)
0 100 200 300 400
Bearing Pressure, kPa
Unreinforced
Reinforced
Su
Sr
qu qr
Figure 4.10 Definition sketch for PRS and If
In Figure 4.11 it is clearly seen that footing settlements are reduced with increase in number
of reinforcement layers. Furthermore, it is also observed that the reduction in settlement
ratios have increased with increase in number of loading cycles. However, the reduction in
settlements can be arrested with the inclusion of at least two reinforcement layers. Further
increase in reinforcement layers did not indicate much improvement in terms of reduction in
the plate settlements. From surface settlement plot (see Figure 4.12) it is seen that surface
settlement is minimal for 3 layers of reinforcement, whereas, for a single layer of
reinforcement little heave is noticed. Also, surface settlements are almost 2% of plate
settlement.
Page 63
49
1 2 3 4 5
Number of Reinforcement Layers
0
20
40
60
80
100
Per
cen
tage
Red
uct
ion
in
Footi
ng S
ettl
emen
ts, P
RS
(%
)No. of Cycles
n=10
n=100
n=250
For,b/D=4, u/D=0.1, RD=70%
Figure 4.11 PRS v/s number of reinforcement layers (Series-B)
Page 64
50
0 1000 2000 3000
No. of Cycles
0
2
4
Su
rface
Set
tlem
ent,
mm
B1
B2
B3
B4
B5
Figure 4.12 Surface settlements v/s number of cycles (Series-B)
4.3.2.3 Effect of Number of Geojute layers on Stiffer Beds overlying Weaker Beds
In Series-C (see Figure 4.13) variation of stiffer beds overlying weaker beds are studied by
varying number of geojute layers in the overlaying dense sand layer. For initial cycles (<10)
plastic deformations are found to be predominant, thereafter, the plastic deformations are
marginal and almost constant even with increase in number of loading cycles. It is noticed
that the settlements are reduced while bearing capacity is increased. Thus, it is understood
that influence of geojute layers has a pivotal role in case of stiffer beds overlying weaker
beds. Also, whenever a stiffer beds are laid over soft soil the load is distributed to a larger
area causing failure due to excessive settlement or insufficient bearing capacity. Inclusion of
geojute layers improves subgrade sterngth in such cases there by decreasing excessive
settlements.
Page 65
51
0 40 80 120 160 200
No. of Cycles
0
10
20
30
40
Cu
mu
lati
ve
Pla
stic
Def
orm
ati
on
(C
PD
), %
Series-CC1
C2
C3
C4
Figure 4.13 CPD v/s No. of cycles (Series-C)
In the Figure 4.14, it is seen that for the stiffer sand overlying weaker sand beds percentage
reduction in footing settlements are maximum for 3 layers of reinforcement. Percentage
reduction in footing settlements were as high as 50% for 3 layers of reinforcement. It is
quite stimulating to note that further increase in number of layers (more than 3 number of
layers) does not contribute to the performance of reduction in the footing settlements. Thus,
the optimal number of layers were found to be 3 for the stiffer beds overlying weaker
subgrade. From Figure 4.15 it is seen that C1 has more surface settlements due to the thinner
stiffer bed overlying larger weaker bed. Surface settlements are noticed almost upto 4% of
the footing plate settlements. As the thickness of the stiffer beds increases with respect to
the weaker beds surface, settlements are minimized tending to zero.
Page 66
52
2 3 4 5 6
Number of Reinforcement Layers
10
20
30
40
50
60
Per
cen
tage
Red
uct
ion
in
Foo
tin
g S
ettl
emen
ts,
PR
S (
%)
No. of Cyclesn=10
n=100
n=250
n=500
For,b/D=4, u/D=0.1, RD=70%-30%
Figure 4.14 PRS v/s number of reinforcement layers (Series-C)
Page 67
53
0 1000 2000 3000 4000
No. of Cycles
0
2
4
6S
urf
ace
Set
tlem
ent,
mm
C1
C2
C3
C4
Figure 4.15 Surface settlements v/s number of cycles (Series-C)
4.3.2.4 Effect of Width of Geojute Reinforcement in homogeneous dense sand
The width of a geojute also plays a vital role in overall performance of the bed, however, it
is important to determine the optimum width of the geojute layer to economise the
pavement system. In this series-D, the width of the geojute has been sutdies and presented.
As the width of the geojute reinforcement increases wider area of contact is created between
the soil and the jute material, thus attributing to the higher lateral restraintment of the soil
particles. Figure 4.16 shows that increase in width of the of geojute reinforcement increases
the beaaring capacity and reduces the settlements. Since, deformations are arrested by the
tensile property of the jute material and frictional restraintment due to soil-reinforcement
interaction. It is seen that If is equal to 2 for width to footing plate ratio (b/D) equal to 2
whereas If is as high as four times if width to footing plate ratio is equal to 4. It is also seen
that even though the material is a from the waste packaged jute bags performance is
considerable.
Page 68
54
0 40 80 120 160 200
No. of Cycles
0
20
40
60
80
Cu
mu
lati
ve
Pla
stic
Def
orm
ati
on
(C
PD
), %
Series-DA6
D1
D2
B3
Figure 4.16 CPD v/s No. of cycles (Series-D)
It is noticed from Figure 4.17 that TBR increased as high as 70 for 4 times the width of
reinforcement. Whereas, TBR of 15 is noticed for 2 times the width of reinforcement. A
remarkable performance with the width of reinforcement is observed, as this can be
attrebuted to higher lateral restrainment causes the performance improvement in the
homogeneous reinforced sand beds. It is also noticed that (see Figure 4.18) percentage
reduction in footing settlements for b/D=4 were twice as high as b/D=2 which depicts that
to eliminate impact of settlement on a reinforced bed, wide width geojute reinforcement has
to be provided. From Figure 4.19 surface settlements are within 2% of the plate settlement.
For b/D=3 surface settlements are almost zero tending to little heave.
Page 69
55
0 4 8 12 16 20
Settlement Ratio, s/D (%)
0
20
40
60
80
TB
RD1
D2
B3
Figure 4.17 TBR v/s settlement ratio (Series-D)
Page 70
56
1 2 3 4 5
Width of Reinforcement Layer
0
20
40
60
Per
cen
tage
Red
uct
ion
in
Foo
tin
g S
ettl
emen
ts,
PR
S (
%)
No. of Cyclesn=10
n=100
n=250
n=500
For,N=3, u/D=0.1, RD=70%
Figure 4.18 PRS v/s width of reinforcement layers (Series-D)
Page 71
57
0 1000 2000 3000
No. of Cycles
0
2
4
Su
rface
Set
tlem
ent,
mm
D1
D2
B3
Figure 4.19 Surface settlements v/s number of cycles (Series-D)
4.3.2.5 Effect of Relative Density of Soil on Reinforced Sand Beds
The placement density has an impact on the behavior of reinforced sand under repetitive
loading. Series-E as shown in Figure 4.20 depicts that with increse in placement density,
plastic deformations are reduced thereby increasing overall bearing capacity of the bed.
With increase in the relative density of sand, the lateral frictional resistance increases,
between the soil and the jute material, with in the reinforcement layers, thereby increasing
the resistance to the horizontal movement of the sand. Hence higher load carrying capacity
and stiffer subgrade is achieved. Test B3 shows appreciable performance improvement due
to dense subgrade (RD=70%) reducing deformations almost to half compared to the of
weaker subgrade (RD=30%). Even though first few cycles (cycles < 10) show major
deformations, but further deformations are arrested if placement density is higher. Thus,
relative density is an important factor while carrying out a construction on a reinforced sand
bed. Whereas, Percentage reduction in footing settlement (see Figure 4.21) shows a
marginal difference in the relative density variation from 50% to 70% since, beyond
RD=50% beds tend to become stiffer showing negligible effect on the performance.
Page 72
58
0 40 80 120 160 200
No. of Cycles
0
10
20
30
40
Cu
mu
lati
ve
Pla
stic
Def
orm
ati
on
(C
PD
), %
Series-EE1
D2
B3
Figure 4.20 CPD v/s No. of cycles (Series-E)
Page 73
59
48 52 56 60 64 68 72
Relative Density
30
40
50
60
Per
cen
tage
Red
uct
ion
in
Footi
ng
Set
tlem
ents
, P
RS
(%
)No. of Cycles
n=10
n=100
n=250
n=500
For,b/D=4, u/D=0.1, N=3
Figure 4.21 Variation of PRS with relative density (Series-E)
4.4 Concluding Remarks
Improvement factor obtained from the study is calculated in terms of equivalent single axle
wheel loads (ESALs) at particular settlements. Also modulus of subgrade reactions and
elastic moduli are calculated from the slope of slow cyclic tests discussed in previous
section 3.5.4. Results obtained from the tests are tabularized and presented in Table 4.2.
Table 4.2 ESAL and Modulus values
Nomenclature No. of Load Cycles Modulus of
Subgrade
Reaction
(MPa)
Modulus of
Elasticity
(MPa) @ s/D =
10%
No. of Load
Cycles
Applied
@ s/D =
20%
No. of Load
Cycles
Applied
A1 1 1 20.3 53.01
A2 1 2 22.72 59.08
Page 74
60
A3 5 49 21.57 56.1
A4 8 63 23.33 60.66
A5 14 134 24.66 64.13
A6 15 137 21.19 55.09
B1 31 137 22.99 59.78
B2 150 2401 28.67 74.54
B3 179 3657 28.32 73.64
B4 152 4845 28.75 74.75
B5 111 2353 28.28 74.2
C1 18 411 22.72 59.08
C2 38 886 21.57 56.1
C3 41 1292 23.33 60.66
C4 39 1358 24.66 64.13
D1 42 767 18.84 48.99
D2 87 1735 19.05 48.99
E1 33 906 20.3 53.01
Based on the results obtained from the present study on geojute reinforced sand beds,
following conclusions are drawn.
With inclusion of geojute reinforcement, there is an appreciably high performance
improvement both in terms of load carrying capacity and settlement reduction
Better performance of footing can be obtained in terms of load carrying capacity if
3 number of geojute reinforcement are provided.
It has been ascertained beneficial to have a dense infill material to get better benefit
out of reinforcement. Thus, placement of density increases the bearing capacity
and reduces plastic deformation.
Surface settlements observed from the reinforced sand are very minimal.
Modulus of elasticity obtained from the model tests for loose-stiff sand are within
the range (35-80 MPa). With maximum modulus of elasticity reaching ~ 75MPa.
Page 75
61
Optimum width of geojute mattress was found to be four times the width of footing.
Benefit improvement due to width of geojute mattress is almost reaching TBR
value equal to 70.
TBRs and CPDs show an appreciable improvement with number of loading cycle.
PRSs show that the reduction in settlement is higher for 3 layers of reinforcement
and b/D=4 reaching as high as 50%.
Page 76
62
Chapter 5
Behavior of Jute-Geocell Reinforced
Sand/ Aggregate Beds
5.1 Introduction
In this chapter a detailed discussion is done on the jutegeocell reinforced sand subgrades
subjected to the traffic loading. The influence of various parameters such as width and,
height of the geocell reinforcement and provision of an additional base layer is studied to
understand the efficacy of jutegeocell mattress to achieve maximum performance benefits.
In addition, the behavior of jute geocell was verified with different infill materials.
Performance improvement is estimated in terms of non-dimensional parameters like Traffic
Benefit Ratio (TBR), Cumulative Plastic Deformation (CPD) and Percentage Reduction in
Settlements (PRS) due to cellular form of reinforcement.
5.2 Experimental Programme
Figure 5.1 shows the schematic of the experimental setup of jute-geocell reinforced sand
subgrades. Table 5.1 presents the series of experiments conducted on jute-geocells. The
variable parameters including b/D, h/D are depicted briefly in each series. Within each
series, one particular parameter was varied, while the other parameters were kept at
constant, to understand the effect of the particular parameter on the overall behavior of the
reinforced bed. The details of nomenclature corresponding to each test scheme are discussed
in Section 4.2. In series F, cyclic load tests were conducted on jute-geocell reinforced sand
beds with varying height of jutegeocell mattress and keeping other parameters at constant
(b/D, u/D). In series G, repeated load tests are conducted on reinforced sand beds varying
width of geocell mattress. Influence study of additional planar reinforcement at the base of
geocell is done in Series-H. In addition to above series, a test is also done on sand with
aggregate infill material and discussed in Series-I. Thus, Series-I discuss the influence of
aggregate as infill material in geocell reinforced beds.
Page 77
63
Table 5.1 Scheme of Experiments conducted on Jute-Geocell Reinforced Sand Beds
Test
Series
Type of
Reinforcement
Details of Test
Parameters
Nomenclature Testing Scheme
(Subscript replicates
Series)
G
Jute Geocell
Reinforced
Sand
Constant
Parameters:
h/D=1.33,
u/D=0.1, D=150mm,
RD=70%+30%.
F1
F2
1. b/D=2
2. b/D=4
F
Jute Geocell
Reinforced
Sand
Constant
Parameters:
b/D=4,
u/D=0.1, D=150mm,
RD=70%+30%.
G1
G2
G3
1. h/D=0.67
2. h/D=1
3. h/D=1.33
H
Jute Geocell
Reinforced
Sand with
Planar Geojute
Base Layer
Constant
Parameters:
h/D=1.33,
u/D=0.1,
D=150mm,
RD=70%+30%.
H1
H2
H3
1. b/D=2
2. b/D=4
3. b/D=4, with
additional base planar
reinforcement.
I
Jute Geocell
Reinforced
Aggregate
Constant
Parameters:
h/D=1.33,
u/D=0.1, D=150mm,
RD=70%+30%.
I1
I2
I3
I4
1. b/D=2
2. b/D=4
3. b/D=4, with
additional base planar
reinforcement.
4. b/D=4, with
additional base planar
reinforcement and
aggregate infill
material.
Page 78
64
Figure 5.1 Experimental setup of jutegeocell reinforced sand subgrade
5.3 Model Tests
5.3.1 General
In this chapter, cyclic load tests conducted on jute geocell reinforced sand beds are
presented. The jute geocell is hand-stitched from waste packaged jute bags threaded with a
waste cloth at the borders. Figure 5.2 shows a typical hand stitched jute-geocell used in this
study. The data obtained from the dynamic actuator on the sand beds are presented in terms
of settlement ratio which is defined as the ratio of settlement to the plate width expressed in
percentage. Typical settlement ratio v/s number of cycles is shown in Figure 5.3. The
markers represent the settlement corresponding to the upper (7kN) and lower (0.7kN) limit
of a haversine loading pattern that has been applied on the test bed. From Figure 5.3, it is
noticed that settlement ratio increases with number of loading cycles. Gradually, the
settlement ratio will almost become asymptotic to the x-axis with number of cycles. This
represents that of a constant permanent deformations occur in the test bed.
Page 79
65
Figure 5.2 Hand-made jute-geocell used in the study
Figure 5.3 Typical settlement ratio v/s number of cycles
Page 80
66
5.3.2 Pressure-Settlement and Surface Deformation Responses
Pressure-settlement and surface deformation responses were monitored during the cyclic
load tests in order to verify the influence of placement density of the soil on overall
behavior of sand beds in terms of reduction in footing settlements. The pressure settlement
responses observed from series I4, shown in Figure 5.4, depicts that initially at low number
of loading cycles (n < 10), the total settlement ratios are higher for a given cycle and the
settlements get moderated with increase in the number of loading cycles. This is more
predominant in case of unreinforced case where one can expect more plastic deformations
than elastic rebound. If the sand is replaced with construction aggregate as infill material, as
high as 10,000 loading cycles were required to reach a settlement ratio of 12.5%.
10
8
6
4
2
0
Set
tlem
ent
Rati
o, (s
/D),
%
0 100 200 300 400
Pressure, kN
Figure 5.4 Typical pressure v/s settlement ratio curve (Series-I4)
Typical surface deflection profiles along with plate settlements are shown in Figure 5.5. The
plate deformations measured in typical test beds show that the deformations obtained from
inline LVDT placed in the actuator in accordance with the externally measured plate
settlements. This observation concludes that the loading plat has settled uniformly into the
test beds without any tilt or inclination. Figure 5.5 also presents the surface deformation
patterns with loading cycles. It is to be noted that the positive values show the settlement
Page 81
67
and the negative values represent heave of the fill surface. It is interesting to note that the
unreinforced beds have shown heave of the fill surface, representing that the failure planes
have reached the surface resulting the heave of the fill surface. Similar observations were
observed by Chummar [70] in sand beds and also found that the heave is significant at a
distance of 1 to 1.5 times the width of the loading plate (D) from center line of the plate. In
this study, Dg-1 is placed at a distance of 1D and Dg4 was placed at 1.5D from the center
line on either side of the plate. Both the dial gauges show a heave pattern of the surface
confirming that the unreinforced beds have undergone general shear failure. In contrary, the
jute geocell reinforced beds have arrested these shear planes to reach the surface owing to
their three dimensional structure. Figure 5.6 shows the location of dial gauges on the fill
surface and the loading plate after the failure of the test bed.
Figure 5.5 Variation of surface settlements with number of cycles (Series G2)
Page 82
68
Figure 5.6 Plate and Surface deformations after the test
5.3.2.1 Unreinforced Beds
The tests in Series-A are conducted on unreinforced test beds with stiff sand layers
overlaying weak sand layers. The test data in terms of CPDs and No. of cycle under
repetitive loading are preseted in 5.7. It is interesting to note from Figure 5.7 that in case of
unreinforced aggregate overlying weaker sand beds show a significant improvement in
reduction of CPDs with number of cycles. Besides, aggregate overlying sand beds have
sustained as high as 2500 load cycles for 20% of footing settlement. The upper aggregate
layer behaves as a reinforcement layer for weaker sand subgrade and hence improves the
settlement behavior of the sand subgrades. Besides, the interlocking property of aggregates
with high angle of shearing resistance would increse the structural support to the cyclic
loading.
Page 83
69
0 40 80 120 160 200
No. of Cycles
0
40
80
120
Cu
mu
lati
ve
Pla
stic
Def
orm
ati
on
(C
PD
), %
Series-AA1
A2
A3
A4
A5
A6
A7
Figure 5.7 CPD v/s No. of cycles (Series-A)
5.3.2.2 Effect of Width of Jute-Geocell mattress
In Series-F, variation of width of a geocell mattress on stiffer beds overlying weaker sand
beds are studied. It is seen in Figure 5.8 that when width of jutegeocell mattress increases
from b/D=2 to b/D=4, an improvement is noticed in terms of percentage reduction in
footing settlements. With increase in plan area, the geocell mattress redistributes the footing
pressure over a wider area of stable soil mass leading to increased performance. The
performance of unreinforced beds (A5) is noticed to be high in terms of controling
permanent deformations on the test bed than the jute geocell reinforced sand beds initially.
These high permanent deformations in geocell reinforced beds are attributed to the lowe
stiffness of the jute geocell walls under the applied loading. After certain cycles, the geocell
reinfroced beds tend to show uniform deformations with increase in load cycles, but on
unreinforced test beds, the permanent deformations continue to increase with number of
load cycles. The initial lower performance of jute geocell could be avoided by compacting
the infill material to a higher degree.
Page 84
70
0 40 80 120 160 200
Number of Cycles
0
20
40
60
Cu
mu
lati
ve
Pla
stic
Def
orm
ati
on
, (
p/D
), %
)Series-F
A5
F1
F2
Figure 5.8 CPD v/s No. of cycles (Series-F)
5.3.2.3 Effect of Height of Jute-Geocell mattress
Figure 5.9 shows the effect of different heights of jute-geocell reinforced sand overlying
weak sand subgrades on cumulative percentage deformations. It is seen that with increse in
height of geocell, initial permanent settlements are higher; this could be due to the lower
flexural stiffness of the jute mattress. The jute material is strong in tension and can impart
higher membrane support while used as planar layer. Thus, it is noted that for height of
geocell mattress equal to width of the footing plate the improvement is appreciable. It is
brought to the notice that further increase in geocell height does not contribute to the
performance in terms of benefit ratio and surprisingly a failure in the jute material at the
seam was noticed in Series-G3 (see Figure 5.10). The seam failures may be expected at
higher loading cycles due to lower flexural strength.
Page 85
71
0 40 80 120 160 200
Number of Cycles
0
20
40
60
80
Cu
mu
lati
ve
Pla
stic
Def
orm
ati
on
, (
p/D
), %
Series-G
G1
G3
G2
Figure 5.9 CPD v/s No. of cycles (Series-G)
Figure 5.10 Weld Failure in Jutegeocell (Series-G3)
Page 86
72
5.3.2.4 Effect of Additional Planar Geojute Reinforcement
An additional base layer beneath the jute-geocell mattress shows an improvement by
reducing the vertical settlements. This is due to additional membrane support offerd by the
planar geojute layer beneath the geocell mattress, which will arrest the movement of infill
material into the weak subgrade soil. From Figure 5.11 it is seen that additional base layer
helps in achieving higher stiffness in reinforced sand beds. Due to footing settlement, sand
in the jutegeocell directly below the footing tends to move down. At higher settlement of the
footing, this sand overcomes the frictional resistance on jutegeocell wall and punches down
the sand subgrade. Thus, with provision of additional layer the vertical movements are
arrested.
0 40 80 120 160 200
Number of Cycles
0
20
40
60
Cu
mu
lati
ve
Pla
stic
Def
orm
ati
on
, (
p/D
), %
Series-HA5
H1
H2
H3
Figure 5.11 CPD v/s No. of Cycles (Series-H)
5.3.2.5 Comparative Study on Geojute and Jute-Geocell Reinformcement Forms
An attempt has been made to understand the effect of reinforcement form (in terms of planar
layers and geocell) on the overall performnace of the test bed. To compare different forms
of jute reinforcement, the optimum amount, in terms of total area, of reinfrocement used in
Page 87
73
planar layers which would give highest perfromance is used to prepare the geocell mattress.
A total of 4 layers of reinforcement in case of geojute (area ~ 1.44m2) and jute-geocell of
h/D=1 (area ~ 1.5m2) was compared in this study. It is noticed from the Figure 5.12 that
planar geojute shows almost 1.3 times better performance compared to the jute-geocell.
Percentage reduction in footing settlement was observed as 52.5% for jute-geocell whereas
it is noticed as high as 62.5% for four layers of geojute reinforcement (representing same
area). The traffic benefit ratios showed an appreciable performance improvement as well.
Refered from Figure 5.13, TBR was noticed as 4 for jute-geocell reinforced bed while, it
was as high as 20 for geojute reinforcement for the same area of reinforcement. Hence, it
can be concluded that the performance of geojute (planar) is higher than the jute-geocell
when made out of flexible jute materials.
0 40 80 120 160 200
Number of Cycles
0
20
40
60
Cu
mu
lati
ve
Pla
stic
Def
orm
ati
on
, (P
/D),
%)
For h1/D=1.07, h2/D=4.93
Unrein.
Planar Geojute
Jute-Geocell
CPD v/s No. of Cycles
RD= 70%
DFooting Plate
RD= 30%b
h1=16cm
h2=74cm
h
Figure 5.12 Variation of CPD v/s No. of Cycles for same area of reinforcement
Page 88
74
0 4 8 12 16 20
Settlement Ratio, s/D (%)
0
10
20
30
TB
RJute-Geocell
Geojute
Figure 5.13 Variation of TBR v/s settlement ratio for same area of reinforcement
5.3.2.6 Effect of Aggregate In-fill Material
The partical size of an infill material has an impact on the behavior of reinforced sand under
repetitive loading. Figure 5.14 presents the variation of CPDs with number of loading cycles
for the test Series I. Figure 5.14 shows that with increaseing the particle size of the infill
material, plastic deformations are reduced thereby increasing overall bearing capacity of the
bed. With the provision of aggregate infill material, the interlocking behavior improves the
frictional resistance between particles and jute-geocell walls, therey increasing the
resistance to the vertical movement of material within the cell pockets. Hence higher load
carrying capacity and stiffness is achieved. Figure 5.15 shows an aggregate overlying weak
sand subgrade, which was compacted with a rammer of weight 35N falling from a height of
0.436m for five times imparting a compaction energy of 763N-m. Whereas Figure 5.16
shows the bed after testing. A very less deformations were noted even after applying a large
number of load cycles (2500). With inclusion of jute-geocell mattress within the aggregate
fill, the test bed withstood as high as 10,000 cycles for about 12.5% settlement ratio.
Page 89
75
0 40 80 120 160 200
Number of Cycles
0
10
20
30
40
50
Cu
mu
lati
ve
Pla
stic
Def
orm
ati
on
, (
p/D
), %
Series-IA5
A7
I1
I2
I3
I4
Figure 5.14 CPD v/s No. of cycles (Series-I)
Figure 5.15 Reinforced bed prior testing (Series-I4)
Page 90
76
Figure 5.16 Reinforced bed after test (Series-I4)
5.4 Concluding Remarks
Improvement factor obtained from the study is calculated in terms of ESALs at a particular
settlement. Also, the modulus of subgrade reaction is calculated from the slope of the slow
cyclic load tests as discussed in section 3.5.4. Results obtained from the tests are tabularized
in Table 5.2.
Table 5.2 Results from the test series
Nomenclature No. of Load Cycles Modulus of
Subgrade
Reaction
(MPa)
Modulus of
Elasticity
(MPa) @ s/D =
10%
No. of Load
Cycles
Applied
@ s/D =
20%
No. of Load
Cycles
Applied
F1 1 8 13.08 34.01
F2 8 263 15.41 40.08
F3 4 42 13.93 36.24
G1 1 34 14.02 36.46
G2 3 42 13.93 36.24
H3 3 62 17.34 45.09
I4
2178 10000
(12.63%)
29.38 78.39
Page 91
77
Based on the results obtained from the present study on jutegeocell reinforced beds,
following conclusions are drawn.
With inclusion of jute-geocell reinforcement, expected performance was NOT noticed
owing to lower flexural stiffness of the flexible jute material
Height of geocell has an impact on the performance. Better performance of footing can
be obtained in terms of load carrying capacity and CPDs for h/D=1.
Provision of an additional reinforcement layer beneath the geocell mattress helps in
improvement of load bearing capacity. It helps in restraining the vertical deformation of
the infill material.
From the comparative study on the form of reinforcement, the performance due to
geojute reinforcement is appreciable as compared to jute-geocell. Since, least flexural
stiffness of jute-geocell mattress cause higher initial plastic deformations. Whereas,
tensile property of geojute and membrane effects attributed to the lower plastic
deformations on planar geojute reinforced sand beds.
Surface settlements observed from the reinforced sand are negligible indicating that the
jute geocell mattress arrested the potential failure planes.
It has been ascertained that it is beneficial to have a dense infill material to get better
benefit out of reinforcement.
Modulus of elasticity obtained from the model tests for weak (RD = 30%) to stiffer (RD
= 70%) sand beds are within the range of 35-80MPa. Aggregate infill shows an
improvement as high as 79 MPa.
Optimum width of jutegeocell mattress was found to be four times the width of footing.
CPDs show an appreciable improvement with number of loading cycle when aggregate
infill is used against sand infill.
Page 92
78
Chapter 6
Summary and Conclusions
6.1 Summary
In this research, a series of large scale dynamic model tests are conduct in a controlled
laboratory environment. A total 50 experiments were carried out in a test tank of dimension
1m x 1m x 1m. Sand subgrades were prepared in the test tank using pluviation technic at 70
and 30% relative densities at different test schemes. In few series of tests, a homogeneous
sand subgrades were prepared at 70% relative density to first understand the behavior of the
sand beds under repeated loading, then, a weaker sand subgrades were prepared overlain by
stiffer sand layers at 70% relative density. A single axle wheel load of 40 kN (per tire) was
applied through a sophisticated double acting linear dynamic hydraulic actuator which is
attached to a 3.5 m high reaction frame. A series of experiments were designed to improve
the structural support of the weak sand subgrades by introducing waste geo-jute (planar) and
jute-geocell reinforcement in the upper layers of the subgrade. In the last series of
experiments, the sand infill in the geocell pockets was replaced with aggregate (± 20mm
size) to see the efficacy between the fill materials on the performance of the bed. Tests are
conducted on sand subgrades and granular infill beds with and without geo-jute
reinforcement configurations. The number of loading cycle, the number of reinforcement
layers and the width of planar jute layers on the performance of geo-jute reinforcement was
also investigated. The influence of each variable is studied by keeping the other variables at
a constant value.
In the jute-geocell series, the influences of height, width of the geocell on the overall
performance of the bed are investigated. In addition, the geocell mattress with a base layer
of geojute was also investigated. The infill material type was also investigated.
In all the tests, load-deflection profiles along with bed surface deformations are measured
through instrumentation including LVDTs and load cells. The data is presented in the form
of cumulative permanent deformations (CPDs) and Traffic Benefit Ratios (TBRs) and
Percentage Reduction in Settlements (PSRs).
Page 93
79
6.2 Conclusions
6.2.1 Geojute Reinforced Beds
Test results have shown that, with the provision of geojute reinforcement, there is an
appreciable high performance improvement in terms of reduction in footing settlement and
increase in bearing capacity of the reinforced bed. Better performance of the footing is
obtained in terms of number of repetitive load cycles if geojute layers are placed at a
distance of 0.1D and consecutive distance between two layers kept at 0.33D. With inclusion
of geojute reinforcement, there is an appreciably high performance improvement in terms of
reduction in permanent deformations and increased number of load cycles on the test bed.
Better performance of footing is noticed when 3 number of geojute reinforcement layers are
provided. The optimum width of geojute layer was found to be four times the width of the
footing. It has also been ascertained that dense granular blanket encompassing the
reinforcement layers resulted in higher benefit ratios in terms of CPD and TBRs. Surface
settlements observed from the reinforced sand are very minimal. Non-dimensional factors
such as TBR was achieved as high as 70 while, 50% reduction in footing settlements were
noticed for 3 number of geojute layers. Modulus of elasticity obtained from the model tests
was higher for stiffer homogeneous geojute reinforced beds. For weaker beds moduli values
were found to be as low as 48 MPa.
6.2.2 Jute-Geocell Reinforced Beds
It is understood that with the inclusion of jute-geocell reinforcement, an appreciable
performance is noted in terms of load carrying capacity and settlement reduction in a series
of static tests. A series of slow cyclic tests were also conducted to determine the shear
modulus and elastic modulus of the test beds with different configurations. In repeated load
tests, the height of geocell has an impact on the performance of the reinforced bed. Since,
walls of the geocell generate hoop stresses to avoid lateral spreading of soil and also restrain
vertical movement due to friction between soil particle and wall. From results it is seen that
better performance of footing can be obtained in terms of plastic deformations (rut depth)
for h/D=1, further increase in height of the geocell decreased the performance owing to its
lower flexural rigidity. In addition, it is observed that larger width of geocell mattress helps
in spreading load over wider area, thus; improving the benefit ratios. Investigation shows
that better performance is achieved for geocell mattress having width about four times that
of footing plate. If additional base layer is provided below the geocell mattress, performance
improvement is enhanced further. This improved performance is attributed to the membrane
support provided by the additional base layer. Due to load distribution over wider area
Page 94
80
through geocells, the surface settlements observed from the reinforced beds are found to be
marginal. But, negative value of settlement (as heaving) is noticed for unreinforced sand bed
depicting that general shear failure occurred in unreinforced beds. In these beds, the failure
planes were noticed reaching fill surface showing heave. It has been ascertained to have a
dense infill material to get better benefit out of reinforcement. Modulus of elasticity
obtained from the model tests for weak to stiff sand beds are within the range of 35-80 MPa.
Aggregate infill shows an improvement in the modulus as high as 79 MPa. CPDs show an
appreciable improvement with number of loading cycle.
However, the performance of the jute geocell reinforced sand beds is inferior to the planar
geojute reinforcement system. This is mainly attributed to the density of the infill material
within the cell pockets. It was anticipated that as the geocell height increases, the density in
each cell pocket was reduced due to the interference of the cell walls during sand pluviation.
This will result in lower placement density within the pockets leads to weak interaction
between the cell walls and the infill material. Hence the performance of the jute geocell was
less than that of planar geojute reinforcement system. However, if the jute geocell mattress
is compacted with aggregate infill, the performance was improved drastically and the
benefits were observed to be higher.
Some of excerpt from the conclusion are listed below:
Provision of three layers of geojute reinforcement in sand beds performs better in
achieving the maximum performance.
Dense beds showed better performance improvement in terms of benefit ratio. Thus,
Benefit ratio increases with increase in placement density.
Optimum width of reinforcement was noticed four times that of footing plate in both the
forms of reinforcement.
In terms of Jute-Geocell expected performance was not noticed, this is due to lower
flexural stiffness of the material in terms of mattress. But, potential failure planes were
arrested due to confining effect of jute-geocell mattress, resulting negligible surface
settlements.
Width and height of jute-geocell showed an impact in enhancing performance. On
investigation an optimum width and height of jute-geocell was noticed as h/D=1 and
b/D=4.
Provision of an additional base layer and granular infill material improves bearing
capacity of sand bed further by large extend. This is attributed to interlocking property
Page 95
81
of aggregate and geocell wall arresting vertical movement of particles within cell
pockets.
Non dimensional parameters viz. TBR, CPD, PRS and If showed appreciable benefit in
improving performance of reinforced beds. Highest benefit achieved for reinforced beds
with aggregate infill against sand infill.
6.3 Future Scope of the Work
The present study has given emphasis on geojute reinforced sand beds. An attempt has been
made to understand the behavior of jute material as a cellular reinforcement. Following are
the recommendations for scope of future work.
1. Further studies can be carried out to completely understand the longevity of the jute
material in pavement sub layers.
2. Further studies shall be carried out to understand the optimal benefits from critical jute-
geocell geometry while aggregate infill is used.
3. Model tests may be extended for aggregate infill overlying clay beds.
4. Studies can be carried out on various natural reinforcing materials.
More studies can be done for various opening sizes of geocell for pavement subgrades.
Page 96
82
References
[1] Sireesh S. and Umashankar B. Towards green pavements in India, 1st US-India
Workshop on Global Geoenvironmental Engineering Challenges, New Delhi, India,
November, (2010).
[2] Rural Roads, “Working Group on Rural Roads in the 12th Five Year Plan”,
Planning commission, Ministry of Rural Development, Government of India, Final
Report, January (2012), pp. 96.
[3] Giroud J.P. and Noiray L. Geotextile- reinforced unpaved road design, Journal of
the Geotechnical Engineering Division, 107 (GT9), (1981), 1233-1254.
[4] Girish M.S. and Ramanatha Ayyar T.S. Improvement of durability of coir
geotextiles, Proc., Indian Geotextiles Conf., Vol. 1, Bombay, India, (2000), 309–
310.
[5] Rao G.V. and Balan K. Reinforcing sand with coir fiber, Geosynthetic Asia 97,
Oxford and IBH Publishing Company Pvt. Ltd., Bangalore, India, (1997).
[6] Sreerama Rao. A. Jute geotextile application in Kakinada port area, Proc. National
Seminar on Jute Geotextile & Innovative jute products, New Delhi, (2003).
[7] Haas R., Wall J. and Carroll R.G. Geogrid reinforcement of granular bases in
flexible pavements, In Transportation Research Record 1188, TRB, National
Research Council, Washington, DC, USA, (1988), pp. 19-27.
[8] Barker W.R. Open-graded bases for airfield pavements, Technical Report GL-87-
16, USAE Waterways Experiment Station, Vicksburg, MS, USA, (1987).
[9] Barksdale R.D., Brown S.F. and Chan F. Potential benefits of geosynthetics in
flexible pavement systems, National Cooperative Highway Research Program
Report No. 315, Transportation Research Board, National Research Council,
Washington, DC (1989).
[10] Chia-Nan L., Zornberg J.G., Chen T.-C., Ho Y.-S. and Lin B.-H. Behavior of
geogrid-sand interface in direct shear mode, Journal of Geotechnical and
Geoenvironmental Engineering, (2009), Vol. 135, No. 12
[11] Cancelli A. and Montanelli F. In-ground test for geosynthetic reinforced flexible
paved roads, Proceedings of the Conference Geosynthetics, 99, Boston, MA, USA,
Vol. 2, (1999), pp. 863-878.
Page 97
83
[12] Senthil Kumar P. and Pandiammal Devi S. Effect of needle punched nonwoven coir
and jute geotextiles on CBR strength of soft subgrade, ARPN Jl. of Engineering and
Applied Sciences, Vol. 6, No. 11, (2011), pp. 114-116.
[13] Abdullah A. B. M. Jute Geotextiles and their Applications, Technical Report
submitted to Jute Diversification and Promotion Centre (JDPC), Dhaka,
Bangladesh, (2008), P. 29.
[14] Binquet J. and Lee K.L. Bearing capacity tests on reinforced earth slabs, Journal of
Geotechnical Engineering Division, ASCE, Vol. 101, No. GT12, December
(1975a), pp. 1241-1255.
[15] Binquet J. and Lee K.L. Bearing capacity tests on reinforced earth slabs, Journal of
Geotechnical Engineering Division, ASCE, Vol. 101, No. GT12, December
(1975b), pp. 1241-1255.
[16] Guido V.A., Biesiadecki G.L and Sullivan M.J. Bearing capacity of a geotextile-
reinforced foundation, Proceedings of the Eleventh International Conference on Soil
Mechanics and Foundation Engineering, Vol. 3, ISSMFE, (1985), pp. 1777-1780.
[17] Omar M.T., Das B.M., Puri V.K. and Yen S.C. Ultimate bearing capacity of
shallow foundations on sand with geogrid reinforcement, Canadian Geotechnical
Journal, 30 (1993a), 545-549.
[18] Omar M.T., Das B.M., Yen S.C., Puri V.K. and Cook E.E. Ultimate bearing
capacity of shallow foundations on sand with geogrid reinforcement, Canadian
Geotechnical Journal, ASTM, 16 (1993b), 246-252.
[19] Michael T.A. and Collin J.G. Large model spread footing load tests on geosynthetic
reinforced soil foundations, Journal of Geotechnical and Geoenvironmental
Engineering, ASCE, 123(1), (1997), 66-72.
[20] Michalowski R.L. Limit loads on reinforced foundation soils, Journal of
Geotechnical and Geoenvironmental Engineering, ASCE, 130(4), (2004), 381-390.
[21] Busudhar P.K., Saha S. and Deb K. Circular footing resting on geotextile-reinforced
sand bed, Geotextiles and Geomembranes, 25 (2007), 377-384.
[22] Busudhar P.K., Dixit P.M., Gharpure A. and Deb K. Finite element analysis of
geotextile reinforced sand bed subjected to strip loading, Geotextiles and
Geomembranes, 26 (2008), 91-99.
[23] Sadoglu E., Cure E., Moroglu B. and Uzuner B.A. Ultimate loads for eccentrically
loaded mode shallow strip footings on geotextile-reinforced sand, Geotextiles and
Geomembranes, 27 (2009), 176-182.
Page 98
84
[24] Vinod P., Bhaskar A.B. and Sreehari S. Behavior of square model footing on loose
sand reinforced with braided coir rope, Geotextiles and Geomembranes, 27 (2009),
464-474.
[25] Puri V.K., Kumar S., Das B.M., Prakash S. and Yeo B. Settlement of reinforced
subgrades under dynamic loading, 17th ICSMGE, Alexandria, No. 306, (2009).
[26] Lovisa J., Shukla S.K. and Sivakugan N. Behavior of prestressed geotextile-
reinforced sand bed supporting a loaded circular footing, Geotextiles and
Geomembranes, 28 (2010), 23-32.
[27] Bhandari A. and Han J. Investigation of geotextile-soil interaction under a cyclic
vertical load using the discrete element method, Geotextiles and Geomembranes 28
(2010), 33-43.
[28] Farsakh M.A., Chen Q. and Sharma R. An experimental evaluation of the behavior
of footings on geosynthetic-reinforced sand, Soils and Foundations, Vol. 53, Issue
2, April, (2013), 335-348.
[29] Rea C. and Mitchell J.K. Sand reinforcement using paper grid cells, ASCE Spring
Convention and Exhibit, Preprint 3130, Pittsburgh, PA, April, (1978), 24- 28.
[30] Mitchell J.K., Kao T.C. and Kavazanjiam Jr. E. Analysis of grid cell reinforced
pavement bases, Technical Report No. GL-79-8, U.S. Army Waterways Experiment
Station, July, (1979).
[31] De Garidel R. and Morel, G. New strengthening technique by textile elements for
low volume roads, Proc. of 3rd International Conference on Geotextiles, Vienna,
(1986), 1027-1032.
[32] Khay M., Morel G. and Perrier H. Use of geotextiles in construction of low cost
highways: an experiment, Proc. of 3rd International Conference on Geotextiles,
Vienna, (1986), 957-961.
[33] Kazerani B. and Jamnejad G.H. Polymer grid reinforcement in construction of
pavement structure. Proc., Geosynthetics, 1, (1987), 58-68.
[34] Koerner R.M. Designing with geosynthetics, Prentice Hall, Englewood Cliffs,
(1990), New Jersey.
[35] Mandal J.N. Geocells in ground improvement work, Proc. of Indo-US Workshop
on Ground Improvement using Geosynthetics, New Delhi, India, March, (1997),
26-28.
[36] Dash S.K. Rajagopal K. and Krishnaswamy N.R. Strip footing on geocell reinforced
sand beds with additional planar reinforcement, Geotextiles and Geomembranes,
19, (2001), 529-538.
Page 99
85
[37] Dash S.K., Sireesh S. and Sitharam T.G. Behavior of geocell reinforced sand beds
under circular loading, Ground Improvement, 7, No. 3, (2003), 111-115.
[38] Dash S.K. Rajagopal K. and Krishnaswamy N.R. Performance of different
geosynthetic reinforcement materials in sand foundations, Geosynthetics
International, 11, No.1, (2004), 35-42.
[39] Tafreshi Moghaddas S.N. and Dawson A.R. A comparison of static and cyclic
loading responses of foundations on geocell-reinforced sand, Geotextiles and
Geomembranes, 32, (2012), 55-68.
[40] Yang X., Han J., Pokharel S.K., Manandhar C., Parsons R.L., Leshchinsky D. and
Halahmi I. Accelerated pavement testing of unpaved roads with geocell reinforced
sand bases, Geotextiles and Geomembranes, 32, (2012), 95-103.
[41] Chen R.-H., Huang Y.-W. and Huang F.-C. Confinement effect of geocells on sand
samples under triaxial compression, Geotextiles and Geomembranes, 37, (2013),
35-44.
[42] Yamauchi H. and Kitamori L. Improvement of soft ground bearing capacity using
synthetic meshes, Geotextiles and Geomembranes, 2, (1985), 3-22.
[43] Oikawa H., Sasaki S. and Fuji N. A case history of the construction of a reinforced
high embankment on an extra soft ground, Proc. of International Symposium on
Earth Reinforcement, Fukuoka/Kyushu, Japan, November, (1996), 261-266.
[44] Hirao K., Yasuhara K. and Tanabashi Y. Effect of bending stiffness of geotextiles
on bearing capacity improvement of soft clay, Proc. of International Symposium on
Earth Reinforcement, Fukuoka/Kyushu, Japan, November, (1996), 591-596.
[45] Palmeira E.M., Pareira Jose H.F and Da Silva Antonio R.L. Back analysis of
geosynthetic reinforced embankments on soft soils, Geotextiles and
Geomembranes, 16 (1998), 273-292.
[46] Unnikrishnan N., Rajagopal K. and Krishnaswamy N.R. Behavior of reinforced clay
under monotonic and cyclic loading, Geotextiles and Geomembranes, 20 (2002),
117-133.
[47] Moustafa A.K., Chandra S. and Kumar P. Behavior of subgrade soil reinforced with
geogrid, International Journal of Pavement Engineering, 5:4, (2004), 201-209.
[48] Hufenus R., Rueegger R., Banjac R., Mayor P., Springman S.M. and Bronnimann
R. Full-scale field tests on geosynthetic reinforced unpaved roads on soft subgrade,
Geotextiles and Geomembranes, 24, (2006), 21-37.
Page 100
86
[49] Tang X., Chehab G.R. and Polomino A. Evaluation of geogrids for stabilizing weak
pavement subgrade, International Journal of Pavement Engineering, Vol. 9, No. 6,
December, (2008), 413-429.
[50] Jadhav S.P. and Damgir R.M. Use of jute geo textile for strengthening of subgrade
of road work, Journal of Innovative Systems Design and Engineering, Vol. 2, No. 4,
(2011), 40-47.
[51] Choudhury P.K., Goswami D.N. and Sanyal T. Application of jute geotextile in
rural road construction under PMGSY- A case study in West Bengal, (2011).
[52] Noorzad R. and Manavirad E. Bearing capacity of two close strip footings on soft
clay reinforced with geotextiles, Arabian Journal of Geoscience, November, (2012).
[53] Cowland J.W. and Wong S.C.K. Performance of a road embankment on soft clay
supported on a geocell mattress foundation, Geotextiles and Geomembranes, Vol.
12, Issue 8, (1993), 687-705.
[54] Mandal J.N. and Gupta P. Stability of geocell reinforced soil, Construction and
Building Materials, Vol. 8, Issue 1, (1994), 55-62.
[55] Mhaiskar S.Y. and Mandal J.N. Investigation of soft clay subgrade strengthening
using geocells, Construction and Building Materials, Vol. 10, Issue 4, June, (1996),
281-286.
[56] Sireesh S. Sitharam T.G. and Dash S.K. Bearing Capacity of circular footing on
geocell-sand mattress overlying clay bed with void, Geotextiles and
Geomembranes, Vol. 27, Issue 2, (2009), 89-98.
[57] Love J.P., Burd H.J., Milligan G.W.E. and Houlsby G.T. Analytical and model
studies of reinforcement of a layer of granular fill on soft clay subgrade, Canadian
Geotechnical Journal, Vol. 24, (1987), 611-622.
[58] Ochiai H., Watari Y. and Tsukamoto Y. Soil reinforcement practice for fills over
soft ground in Japan, Geosynthetics International, Vol. 3, No. 1, (1996), 31-48.
[59] Ravi Shankar A.U. and Subba N.S. Strength behavior of geogrid reinforced shedi
soil subgrade and aggregate system, Road Materials and Pavement Design, 7:3,
(2006), 313-330.
[60] Sarsby R.W. Use of limited life geotextiles (LLGs) for basal reinforcement on
embankments built on soft clay, Geotextiles and Geomembranes, 25, (2007), 302-
310.
[61] Krystyna K.-F. Influence of geosynthetic reinforcement on the load-settlement
settlement characteristics of two layer subgrade, Geotextiles and Geomembranes,
25, (2007), 366-376.
Page 101
87
[62] Subaida E.A, Chandrakaran S. and Sankar S. Laboratory performance of unpaved
roads reinforced with woven coir geotextiles, Geotextiles and Geomembranes, 27,
(2009), 204-210.
[63] Al-Qadi Imad L. Dessouky S., Tutumluer E. and Kwon J. Geogrid mechanism in
low volume flexible pavements: accelerated testing of full scale heavily
instrumented pavement sections, International Journal of Pavement Engineering,
Vol. 12, No. 2, (2011), 121-135.
[64] Bush D.I., Jenner C.G. and Besset R.H. The design and construction of geocell
foundation mattress supporting over soft grounds, Geotextiles and Geomembranes,
Vol. 9, (1990), 83-98.
[65] Dash S.K., Sireesh S. and Sitharam T.G. Bearing capacity of circular footing on
geocell reinforced sand underlain by soft clay, Geotextiles and Geomembranes, Vol.
21, (2003), 693-703.
[66] Pokharel S.K., Han J. Manandhar C., Yang X., Leshchinsky D., Halalmi I., and
Parsons R.L. Accelerated pavement testing of geocell reinforced unpaved roads
over weak subgrade, Transportation Research Record, 2204, 67-75.
[67] Kumar K.V.S.P, Rao V.K., Kolluru S.K. Bearing capacity of square footing on
geocell mattress overlying clay bed, International Journal of Emerging trends in
Engineering and Development, Vol. 5, Issue 2, (2012), 563-573
[68] Edil T.B., Kim W.H., Benson C.H. and Burak F.T. Contribution of geosynthetic
reinforcement to granular layer stiffness, Geo-Denver, (2007).
[69] Saride Sireesh Behavior of geocell reinforced foundation beds, PhD Thesis, Indian
Institute of Sciences, India, (2006).
[70] Chummar A.V. Bearing capacity theory from experimental results, Journal of the
Geotechnical Engineering Division, ASCE, (1972), 98(12), 1311-1324.
Page 102
88
List of Publications from this Research
CONFERENCES: 1. Suraj Vedpathak, Sireesh S., Vijay Kumar R. and Hari Kishore Kovoori, Behavior of
geojute reinforced sand subgrade under repeated traffic loading, Proc. of Indian
Geotechnical Conference, December 13-15, 2012, Delhi, pp. H-837.
2. Sireesh Saride, Vijay Rayabharapu and Suraj Vedpathak, Resilient behavior of planar
geo-jute reinforced sand subgrades, Proc. of Asiafuge, First Asian Workshop on
Physical Modelling in Geotechnics, IIT Bombay, Mumbai, November 14-16, 2012. pp.
25.
3. Sireesh Saride, Suraj Vedpathak and Vijay Rayabharapu, Elasto-Plastic behavior of
geojute and jute-geocell reinforced sand subgrade, GeoCongress, Atlanta, Georgia,
February 23-26, 2014 (Under Review).