Page 1
Matthew J. Emes
Experimental Investigation of the Wind Loads on Heliostats
Matthew J. Emes, Jeremy S. Yu, Azadeh Jafari, Farzin Ghanadi and Maziar Arjomandi
School of Mechanical Engineering, The University of Adelaide, Adelaide, South Australia
5005, Australia
E-mail: [email protected]
Abstract
Concentrating solar thermal (CST) power tower (PT) is an emerging renewable technology for
large-scale electricity production, however the main limitation is their significantly larger
levelised cost of electricity (LCOE) relative to base load energy systems. One opportunity to
lower the LCOE is to reduce the capital cost of heliostats through optimisation of the maximum
wind loads during operation at different elevation and azimuth angles and during high-wind
conditions when aligned parallel to the ground in the stow position.
Wind tunnel experiments were carried out to measure the forces on thin flat plates of various
sizes at a range of elevation angles, azimuth angles and heights in a simulated part-depth
atmospheric boundary layer (ABL). Peak wind load coefficients on heliostats in operating and
stow positions are significantly dependent on the critical scaling parameters of the heliostat and
the turbulence characteristics approaching them. The largest load coefficients on operating and
stowed heliostats occurred at an azimuth angle 𝛽 = 0° with the heliostat facet aligned with the
incident flow. Peak drag coefficients on operating heliostats increased with increasing elevation
angle of the heliostat mirror (𝛼 > 0°) to a maximum in the normal position (𝛼 = 90°). The
effect of increasing the approaching turbulence intensity 𝐼𝑢 from 2% to 8% was more significant
on the peak drag loads compared to the mean drag loads with increasing 𝛼. The lift force and
hinge moment coefficients on a stowed heliostat (𝛼 = 0°) increased linearly with increasing
turbulence intensity 𝐼𝑢 > 10% and an increasing ratio of integral length scale to heliostat chord
length 𝐿𝑢𝑥/𝑐 in stow position (𝛼 = 0°). Furthermore, the peak wind loads on a stowed heliostat
decreased by up to 40% when the ratio of elevation axis height to chord length of the heliostat
mirror, 𝐻/𝑐, was reduced to less than 0.5. Optimisation of the design wind loads on isolated
heliostats in operation and stow positions to the characteristics of the turbulence approaching
them can lead to reductions in the cost of manufacturing the heliostat components.
Page 2
1. Introduction
Current energy systems, based primarily on the combustion of fossil fuels, are unsustainable in
the long term, so that a transition to an environmentally-sustainable energy system with the
integration of renewable energy sources is necessary (Hernández-Moro and Martínez-Duart
2012). Concentrating solar thermal (CST) is one of the most promising renewable technologies
capable of large scale electricity production (Hinkley et al. 2013). A CST system operates by
focusing direct solar radiation to obtain higher energy densities and thus an improved Carnot
efficiency at higher temperatures. Heat collected in the receiver is typically used to heat a
working fluid to generate supercritical steam that drives a turbine for electricity generation
(IRENA 2015). Parabolic trough systems are the most commercially-deployed CST
technology, however power tower (PT) systems have been identified as an emerging concept
that can operate at higher concentration ratios and higher working fluid temperatures than
parabolic troughs, thus allowing for higher power cycle efficiency (IEA-ETSAP and IRENA
2013). Although the intermittency of solar irradiation is a practical limitation of CST systems,
PT plants can be deployed with thermal energy storage or as a hybrid system with existing fossil
fuel power plants for a base-line power supply (Kolb et al. 2011; Hinkley et al. 2013).
The main limitation of PT systems is their significantly larger levelised cost of electricity
(LCOE), in the range of 0.15-0.19 USD/kWh in 2015 (IRENA 2015), compared to base-load
energy systems such as fossil fuel power plants in the range of 0.06-0.13 USD/kWh in 2011
(IRENA 2013). To reduce the LCOE of PT systems there is a need to lower the capital cost of
a PT plant, of which the largest cost is the heliostat field, with an estimated contribution of
between 40% and 50% (Kolb et al. 2007; Hinkley et al. 2013; Coventry and Pye 2014; IRENA
2015). Government-funded initiatives that support the research and development of CST
systems to make them competitive with base-load energy rates include the SunShot Initiative
by the Department of Energy (DOE) in the USA, with a goal LCOE of 0.06 USD/kWh by 2020
(Kolb et al. 2011), and the Australian Solar Thermal Research Initiative (ASTRI) targeting a
LCOE of 0.12 AUD/kWh by 2020. Currently, the total installed cost of a 150 MW PT plant is
5700 USD/kW (IRENA 2015), and the cost of the heliostat field for high production rates in
2013 was estimated to be US150-200/m2 (Coventry et al. 2013). The LCOE of a conventional
molten-salt receiver PT plant was estimated by NREL (Mehos et al. 2016) to be 0.14 USD/kWh
in 2015, but this could be further reduced to 0.1 USD/kWh with near-term advanced heliostats
at $97/m2 in a 2017 tower configuration (Mehos et al. 2017). The total cost of PT plants is
projected to be reduced by 37% to 3600 USD/kW by 2025, compared with a projected 33%
reduction in parabolic troughs (IRENA 2015). The largest reduction of 24% in the cost of the
heliostat field, to less than USD120/m2, is expected to be achieved through the optimisation of
the structural design of heliostats to wind loading. For example, lowering the design wind speed
for stowing the heliostat from 15 m/s to 10 m/s can reduce the heliostat cost by 34% (Emes et
al. 2015). Furthermore, the stiffness of a concrete pylon is preferred in contemporary heliostat
designs (Pfahl et al. 2017a), however the lowering of the heliostat mirror using a spindle drive
to the ground in stow during high-wind conditions can reduce the wind load requirements and
the cost of a cantilever-sandwich heliostat (Pfahl et al. 2017b). Hence, the aim of this paper is
to investigate the effect of the critical scaling parameters of the heliostat and the turbulence
characteristics in the ABL on the peak wind load coefficients on heliostats in operating and
stow positions.
Page 3
2. Experimental Method
2.1. Wind Tunnel Setup
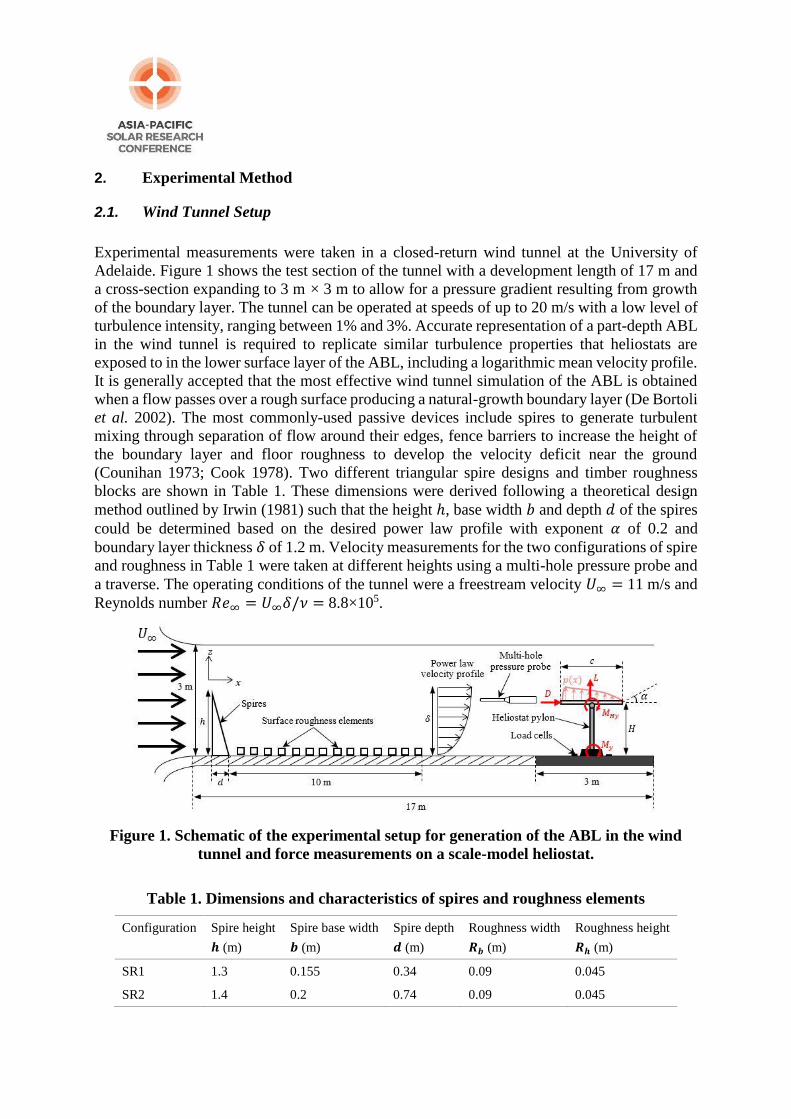
Experimental measurements were taken in a closed-return wind tunnel at the University of
Adelaide. Figure 1 shows the test section of the tunnel with a development length of 17 m and
a cross-section expanding to 3 m × 3 m to allow for a pressure gradient resulting from growth
of the boundary layer. The tunnel can be operated at speeds of up to 20 m/s with a low level of
turbulence intensity, ranging between 1% and 3%. Accurate representation of a part-depth ABL
in the wind tunnel is required to replicate similar turbulence properties that heliostats are
exposed to in the lower surface layer of the ABL, including a logarithmic mean velocity profile.
It is generally accepted that the most effective wind tunnel simulation of the ABL is obtained
when a flow passes over a rough surface producing a natural-growth boundary layer (De Bortoli
et al. 2002). The most commonly-used passive devices include spires to generate turbulent
mixing through separation of flow around their edges, fence barriers to increase the height of
the boundary layer and floor roughness to develop the velocity deficit near the ground
(Counihan 1973; Cook 1978). Two different triangular spire designs and timber roughness
blocks are shown in Table 1. These dimensions were derived following a theoretical design
method outlined by Irwin (1981) such that the height ℎ, base width 𝑏 and depth 𝑑 of the spires
could be determined based on the desired power law profile with exponent 𝛼 of 0.2 and
boundary layer thickness 𝛿 of 1.2 m. Velocity measurements for the two configurations of spire
and roughness in Table 1 were taken at different heights using a multi-hole pressure probe and
a traverse. The operating conditions of the tunnel were a freestream velocity 𝑈∞ = 11 m/s and
Reynolds number 𝑅𝑒∞ = 𝑈∞𝛿/𝜈 = 8.8×10⁵.
Figure 1. Schematic of the experimental setup for generation of the ABL in the wind
tunnel and force measurements on a scale-model heliostat.
Table 1. Dimensions and characteristics of spires and roughness elements
Configuration Spire height
𝒉 (m)
Spire base width
𝒃 (m)
Spire depth
𝒅 (m)
Roughness width
𝑹𝒃 (m)
Roughness height
𝑹𝒉 (m)
SR1 1.3 0.155 0.34 0.09 0.045
SR2 1.4 0.2 0.74 0.09 0.045
Page 4
2.2. Turbulence Characteristics of the Simulated ABL
2.2.1. Velocity and Turbulence Intensity Profiles
Figure 2(a) and (b) show the mean velocity and turbulence intensity profiles, respectively, of
the two spire and roughness configurations in Table 1. The mean velocity profiles generated by
SR1 are within a maximum error of ±5% of power law (𝛼 = 0.12) and log law (𝑧0 = 0.001 m)
velocity profiles at an ABL model scale of 1:150. The turbulence intensities generated by SR1
are within ±2% of Engineering Sciences Data Unit (1985) data for a neutral ABL with a mean
wind speed of 10 m/s at a 10 m height, surface roughness height 𝑧0 = 0.001 m and boundary
layer thickness 𝛿 = 350 m. The mean velocity profile generated by SR2 is close to linear in the
part-depth simulated ABL and the turbulence intensity profile is well approximated by the log
law profile with surface roughness height 𝑧0 = 0.015 m. Hence, the two spire and roughness
configurations, SR1 and SR2, can be used to investigate the effect of turbulence intensity on
the peak wind loads on the heliostat mirror that was stowed at a range of heights (0.3 < 𝑧/𝛿 <
0.5) indicated by the shaded region in Figure 2.
Figure 2. (a) Mean velocity profiles of the two spire configurations compared with the
power law and log law profiles of a low-roughness terrain; (b) Longitudinal turbulence
intensity profiles compared with the ESDU 85020 (1985) profiles of two different terrain
roughness. The shaded area indicates the heights at which the central elevation axis of
the heliostat mirror was positioned.
2.2.2. Power Spectra and Integral Length Scales
Figure 3(a) presents the variation of the longitudinal integral length scale 𝐿𝑢𝑥 = �̅� ∫ 𝑅𝑢(𝜏)
𝜏0
0𝑑𝜏,
calculated to the first-zero crossing 𝜏0 of the autocorrelation function 𝑅𝑢, with non-dimensional
height in the ABL (𝛿 = 1.2 m) for SR1 and SR2 to approximate the sizes of the largest vortices
approaching the model-scale heliostat. The values of 𝐿𝑢𝑥 show considerable scatter at all heights
and are approximately double those measured by Farell and Iyengar (1999) at the same height
(𝑧 = 0.6 m) in an ABL with the same thickness, as shown by the filled data points in Figure
Page 5
3(a). At the shaded range of heights (0.3 < 𝑧/𝛿 < 0.5) where the central elevation axis of the
stowed heliostat mirror is positioned, 𝐿𝑢𝑥 varies from 1.6 m to 2 m for SR1 and from 1.9 m to
2.5 m for SR2. This indicates that the largest vortices approaching the stowed heliostat using
SR2 were on average 21% larger and as much as double the size of those produced using SR1
in the current study. The predicted 𝐿𝑢𝑥 by ESDU 85020 over-estimated 𝐿𝑢
𝑥 by 40% for SR1 and
by 17% for SR2 on average over the range of heights (0.3 < 𝑧/𝛿 < 0.5). Overall, the values of
𝐿𝑢𝑥 calculated for SR1 and SR2 are below the stated ±8% error of the ESDU 85020 correlations,
however this is expected because of the limitation of producing the largest length scales of the
ABL in a wind tunnel. Hence, the values of 𝐿𝑢𝑥 for SR1 and SR2 are considered reasonable for
wind-load analysis within the highlighted range of heights of the stowed heliostat.
Figure 3(b) compares the non-dimensional power spectra in the longitudinal direction 𝑓𝑆𝑢/𝜎𝑢2
as a function of non-dimensional frequency 𝑓𝐿𝑢𝑥/�̅�, at a non-dimensional height 𝑧/𝛿 = 0.5 for
SR1 and SR2 in the current study, with the fitted von Karman spectrum reported by Farell and
Iyengar (1999). The spectral peaks are reflected by integral length scales 𝐿𝑢𝑥 increasing from
0.8 m to 2 m and 2.5 m for SR1 and SR2, respectively, as indicated by the three filled data
points at 𝑧/𝛿 = 0.5 in Figure 3(a). The spectral peaks corresponding to these values of 𝐿𝑢𝑥 are
shifted from 5 Hz to the lower frequencies of 2 Hz and 1 Hz for SR1 and SR2, respectively.
Although the low-frequency region of the full-scale turbulent power spectra cannot be
replicated in boundary layer wind tunnel experiments (Banks 2011; Pfahl et al. 2015), velocity
fluctuations measured at the frequencies corresponding to the peak values of the power spectra
(Figure 3(b)) were considered sufficient for the calculation of longitudinal integral length scales
𝐿𝑢𝑥 to provide a measure of the largest eddies in the flow.
Figure 3. (a) Longitudinal integral length scale profiles of SR1 and SR2 compared with
the Engineering Sciences Data Unit (1985) profile for 𝒛𝟎 = 0.015 m with an assumed
ABL model scale of 1:150 and an experimental study by Farell and Iyengar (1999) at
𝒛/𝜹 = 0.5 for a simulated ABL (𝜹 = 1.2 m). The shaded area indicates the heights at
which the heliostat mirror was stowed. (b) Longitudinal power spectra of turbulence
generated by SR1 and SR2 compared with a von Karman spectrum fitted by Farell and
Iyengar (1999) to the measured turbulence power spectra at 𝒛/𝜹 = 0.5.
Page 6
2.3. Calculation of Wind Load Coefficients
Force measurements on the model heliostat were taken using four three-axis load cells, mounted
on a rotary turntable in Figure 1. Each load cell has a capacity of 500 N with a sampling
frequency of 1 kHz in all three axes and an accuracy of ±0.5% of full scale. The heliostat was
modelled as a thin flat plate in the absence of a support structure. A series of six square
aluminium plates with 3 mm thickness and chord length (𝑐) ranging from 300 mm to 800 mm
were manufactured and mounted on a common pylon with a telescopic design to allow the
heliostat elevation axis height 𝐻 to vary between 0.35 m and 0.6 m. The peak drag and lift
forces on the plate (𝐷 and 𝐿 in Figure 1) were determined using the three-sigma approach from
the difference between the measured forces on the heliostat (plate mounted to pylon) and those
on the heliostat pylon in the absence of a mounted plate. The peak hinge and overturning
moments (𝑀𝐻𝑦 and 𝑀𝑦 in Figure 1) were calculated from the product of the forces on the plate
and the longitudinal and vertical distances from the centre of pressure to the centre of the plate,
respectively. In order to normalise the loads with respect to the heliostat size, the peak wind
load coefficients on the plate were calculated following Peterka and Derickson (1992) as:
𝑐𝐷 =𝐷
1/2𝜌�̅�2𝐴 (1)
𝑐𝐿 =𝐿
1/2𝜌�̅�2𝐴 (2)
𝑐𝑀𝐻𝑦=
𝑀𝐻𝑦
1/2𝜌�̅�2𝐴𝑐 (3)
𝑐𝑀𝑦=
𝑀𝑦
1/2𝜌�̅�2𝐴𝐻 (4)
Here 𝜌 (kg/m3) is the density of air, �̅� (m/s) is the mean wind speed at the heliostat elevation
axis height 𝐻, 𝐴 = 𝑐2 (m2) is the area of the square heliostat mirror of chord length 𝑐.
3. Results and Discussion
3.1. Peak Wind Loads on an Isolated Heliostat in Stow Position
3.1.1. Effect of Heliostat Chord Length and Elevation Axis Height
Figure 4 shows the effect of the heliostat chord length on the peak wind load coefficients on an
isolated heliostat in stow position exposed to SR1 and SR2. The peak lift coefficients for SR2
in Figure 4(a) and the peak hinge moment coefficients in Figure 4(b) are approximately double
those for SR1. Both the peak lift and peak hinge moment coefficients increase by approximately
double as the chord length is halved from 0.8 m to 0.4 m. This indicates that there is an inverse
proportionality between the wind load coefficients and the chord length of the heliostat mirror.
Page 7
Figure 4. Effect of heliostat chord length 𝒄 for SR1 and SR2 on: (a) peak lift coefficient;
(b) peak hinge moment coefficient on an isolated heliostat in stow position.
Figure 5 presents the peak lift coefficient 𝑐𝐿 and peak hinge moment coefficient 𝑐𝑀𝐻𝑦 as a
function of the ratio of elevation axis height to chord length 𝐻/𝑐 at three different heights, non-
dimensionalised with the ABL thickness 𝐻/𝛿 generated by SR2. The effect of increasing the
height at which the heliostat mirror is stowed in the ABL, 𝐻/𝛿, from 0.3 to 0.5 results in a
vertical shift of peak 𝑐𝐿 and peak 𝑐𝑀𝐻𝑦 to larger magnitudes at constant 𝐻/𝑐. Conventional
heliostats are commonly designed for the ratio 𝐻/𝑐 of 0.5 (Téllez et al. 2014), however 𝐻/𝑐 ≈
0.7 for a heliostat with a horizontal primary axis. Reductions of approximately 50% in 𝑐𝐿 and
40% in 𝑐𝑀𝐻𝑦 are possible by lowering 𝐻/𝑐 from 0.7 to 0.5 for a heliostat without a horizontal
primary axis. Hence, the overall mass and strength of the heliostat can be reduced as the length
of the pylon required is shorter. Designing for the smaller 𝐻/𝑐 of 0.5 can therefore lead to
savings in the cost of manufacturing and installation of the heliostat (Emes et al. 2017).
Figure 5. Effect of the ratio of heliostat elevation axis height to chord length 𝑯/𝒄 for
SR2 on: (a) peak lift coefficient; (b) peak hinge moment coefficient on an isolated
heliostat in stow position (Emes et al. 2017).
Page 8
3.1.2. Effect of Approaching Turbulence Characteristics
Figure 6 shows the effect of the ratio of longitudinal integral length scale to heliostat chord
length 𝐿𝑢𝑥/𝑐 at a constant longitudinal turbulence intensity 𝐼𝑢 on the peak wind load coefficients
on a stowed heliostat. At each turbulence intensity, the peak lift coefficient (Figure 6(a)) and
peak hinge moment coefficient (Figure 6(b)) on the heliostat increase linearly with increasing
𝐿𝑢𝑥/𝑐 from 2 to 8. In addition, the pronounced linear increase of the peak wind load coefficients
on stowed heliostats at turbulence intensities larger than 10% in the current study is in
agreement with a similar finding by Peterka et al. (1989) for the peak drag and lift coefficients
on heliostats in operating positions. Hence, the peak wind loads on an isolated heliostat in stow
position can be significantly reduced by lowering the value of 𝐿𝑢𝑥/𝑐. This can be achieved by
lowering the stow height and thus decrease 𝐿𝑢𝑥 approaching a stowed heliostat with constant 𝑐,
such as using a telescopic pylon design. Alternatively, 𝐻/𝑐 could be reduced to less than 0.5
by manufacturing heliostat mirrors with larger 𝑐 at a constant elevation axis height 𝐻 and thus
constant 𝐼𝑢.
Figure 6. Effect of length-scale-to-chord ratio 𝑳𝒖𝒙/𝒄 at constant turbulence intensities 𝑰𝒖
on: (a) peak lift coefficient; (b) peak hinge moment coefficient on a stowed heliostat.
3.2. Peak Wind Loads on an Isolated Heliostat in Operating Positions
3.2.1. Effect of Approaching Turbulence Characteristics
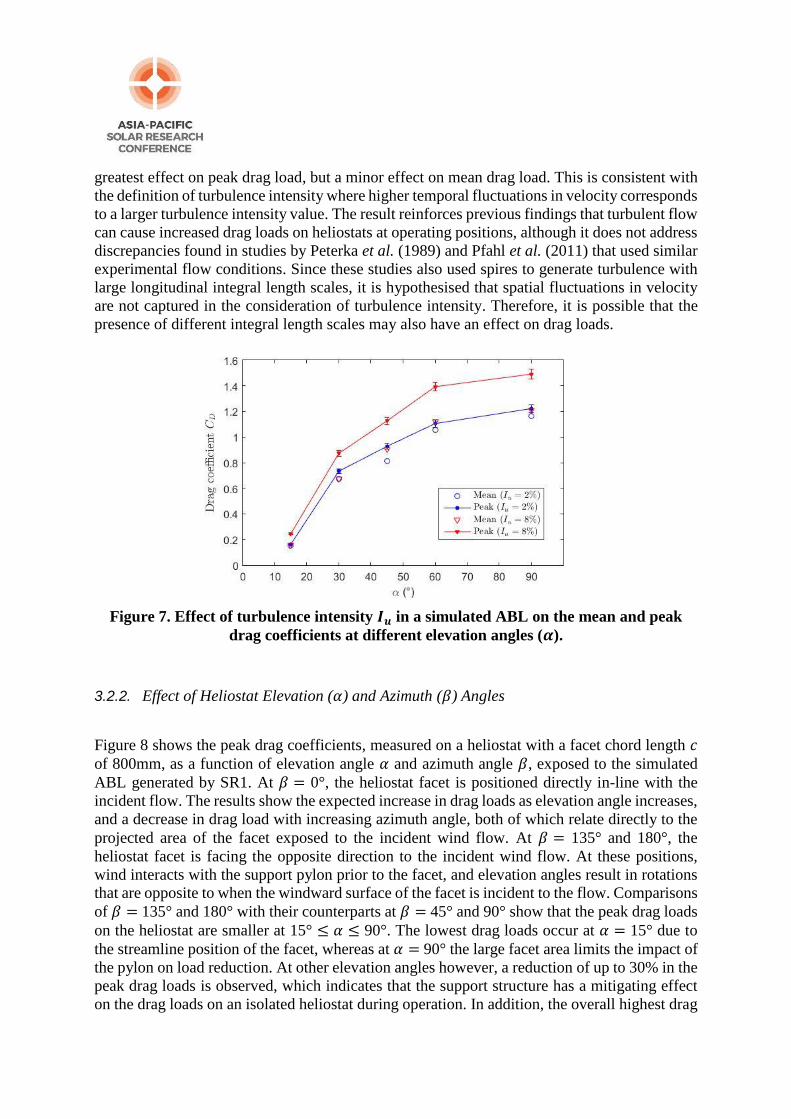
Figure 7 presents the mean and peak drag coefficients for two flow configurations: a uniform,
smooth flow with a turbulence intensity (𝐼𝑢) of 2%, and the ABL generated by SR1 with an
average 𝐼𝑢 of 8% at the mid-point of the heliostat facet in the normal position (𝛼 = 90°).
Comparisons of the effects between the two flow profiles show an increase of up to 1.28 times
in peak drag load at the highest elevation angle when turbulence intensity is increased from 2%
to 8%. The substantial increase in peak drag coefficient is not reflected in the mean drag
coefficient, although it increased by 5% at elevation angles above 45°. The relative differences
between mean and peak loads at each flow condition suggests that turbulence intensity has the
Page 9
greatest effect on peak drag load, but a minor effect on mean drag load. This is consistent with
the definition of turbulence intensity where higher temporal fluctuations in velocity corresponds
to a larger turbulence intensity value. The result reinforces previous findings that turbulent flow
can cause increased drag loads on heliostats at operating positions, although it does not address
discrepancies found in studies by Peterka et al. (1989) and Pfahl et al. (2011) that used similar
experimental flow conditions. Since these studies also used spires to generate turbulence with
large longitudinal integral length scales, it is hypothesised that spatial fluctuations in velocity
are not captured in the consideration of turbulence intensity. Therefore, it is possible that the
presence of different integral length scales may also have an effect on drag loads.
Figure 7. Effect of turbulence intensity 𝑰𝒖 in a simulated ABL on the mean and peak
drag coefficients at different elevation angles (𝜶).
3.2.2. Effect of Heliostat Elevation (𝛼) and Azimuth (𝛽) Angles
Figure 8 shows the peak drag coefficients, measured on a heliostat with a facet chord length 𝑐
of 800mm, as a function of elevation angle 𝛼 and azimuth angle 𝛽, exposed to the simulated
ABL generated by SR1. At 𝛽 = 0°, the heliostat facet is positioned directly in-line with the
incident flow. The results show the expected increase in drag loads as elevation angle increases,
and a decrease in drag load with increasing azimuth angle, both of which relate directly to the
projected area of the facet exposed to the incident wind flow. At 𝛽 = 135° and 180°, the
heliostat facet is facing the opposite direction to the incident wind flow. At these positions,
wind interacts with the support pylon prior to the facet, and elevation angles result in rotations
that are opposite to when the windward surface of the facet is incident to the flow. Comparisons
of 𝛽 = 135° and 180° with their counterparts at 𝛽 = 45° and 90° show that the peak drag loads
on the heliostat are smaller at 15° ≤ 𝛼 ≤ 90°. The lowest drag loads occur at 𝛼 = 15° due to
the streamline position of the facet, whereas at 𝛼 = 90° the large facet area limits the impact of
the pylon on load reduction. At other elevation angles however, a reduction of up to 30% in the
peak drag loads is observed, which indicates that the support structure has a mitigating effect
on the drag loads on an isolated heliostat during operation. In addition, the overall highest drag
Page 10
load at all elevation angles is when 𝛽 = 0𝑜, showing that for an isolated heliostat at operating
positions, the worst-case aerodynamic load occurs when the heliostat is directly in-line with the
incident flow.
Figure 8. The effect of heliostat elevation 𝜶 and azimuth 𝜷 angles on the peak drag
coefficient for a heliostat in operation.
4. Conclusions
Calculated peak wind load coefficients on an isolated heliostat in stow position showed an
inverse proportionality with the chord length of the heliostat mirror, which suggests that the
coefficients could be optimised by increasing the size of the heliostat mirror relative to the sizes
of the relevant eddies approaching the heliostat. The peak lift and hinge moment coefficients
on a stowed heliostat could be reduced by as much as 40% by lowering the ratio of elevation
axis height to chord length of the heliostat mirror, 𝐻/𝑐, to less than 0.5. A significant linear
increase of the peak wind load coefficients occurred at longitudinal turbulence intensities 𝐼𝑢
greater than 10% and with increasing length-scale-to-chord ratio 𝐿𝑢𝑥/𝑐 in the simulated ABL.
Hence, the critical scaling parameters of the heliostat should be carefully considered depending
on the turbulence characteristics of the site. For heliostats in operating positions, a similar
increase in the peak drag coefficients was observed at higher turbulence intensities, although
the effect on mean drag loads were significantly less. Peak wind loads on operating heliostats
exposed to 𝐼𝑢 = 8% at all of the elevation angles tested were highest when the facet was directly
in-line with the incident flow at an azimuth angle 𝛽 of 0°. However, a reduction in the peak
drag coefficient was found at 𝛽 > 90° due to the interference of the support structure when the
wind approaches from the back of the operating heliostat mirror. The results show that the wind
loads on isolated heliostats in stow and operating positions are highly sensitive to the boundary
layer characteristics, including the turbulence intensity and the ratio of the integral length scale
to the heliostat chord length. Optimisation of the heliostat mirror chord length and elevation
axis height to the characteristics of the approaching turbulence can significantly reduce the
design wind loads and thus the cost of manufacturing the heliostat components.
Page 11
References
Banks, D., 2011. 'Measuring peak wind loads on solar power assemblies', in: 13th International
Conference on Wind Engineering, Amsterdam, Netherlands.
Cook, N.J., 1978, 'Determination of the model scale factor in wind-tunnel simulations of the
adiabatic atmospheric boundary layer', Journal of Wind Engineering and Industrial
Aerodynamics, 2, p311-321.
Counihan, J., 1973, 'Simulation of an adiabatic urban boundary layer in a wind tunnel',
Atmospheric Environment, 7, p673-689.
Coventry, J., Campbell, J., Xue, Y.P., Hall, C., Kim, J.-S., Pye, J., Burgess, G., Lewis, D.,
Nathan, G. and Arjomandi, M., 2013, 'Heliostat Cost Down Scoping Study–Final Report',
STG-3261 Rev 01; ANU, Canberra.
Coventry, J. and Pye, J., 2014, 'Heliostat cost reduction–where to now?', Energy Procedia, 49,
p60-70.
De Bortoli, M., Natalini, B., Paluch, M. and Natalini, M., 2002, 'Part-depth wind tunnel
simulations of the atmospheric boundary layer', Journal of Wind Engineering and Industrial
Aerodynamics, 90, p281-291.
Emes, M.J., Arjomandi, M., Ghanadi, F. and Kelso, R.M., 2017, 'Effect of turbulence
characteristics in the atmospheric surface layer on the peak wind loads on heliostats in stow
position', Solar Energy, 157, p284-297.
Emes, M.J., Arjomandi, M. and Nathan, G.J., 2015, 'Effect of heliostat design wind speed on
the levelised cost of electricity from concentrating solar thermal power tower plants', Solar
Energy, 115, p441-451.
ESDU 85020 (1985), Characteristics of atmospheric turbulence near the ground - Part II: single
point data for strong winds (neutral atmosphere), Engineering Sciences Data Unit, London,
UK.
Farell, C. and Iyengar, A.K., 1999, 'Experiments on the wind tunnel simulation of atmospheric
boundary layers', Journal of Wind Engineering and Industrial Aerodynamics, 79, p11-35.
Hernández-Moro, J. and Martínez-Duart, J.M., 2012, 'CSP electricity cost evolution and grid
parities based on the IEA roadmaps', Energy Policy, 41, p184-192.
Hinkley, J.T., Hayward, J.A., Curtin, B., Wonhas, A., Boyd, R., Grima, C., Tadros, A., Hall, R.
and Naicker, K., 2013, 'An analysis of the costs and opportunities for concentrating solar
power in Australia', Renewable Energy, 57, p653-661.
IEA-ETSAP and IRENA (2013), Concentrating Solar Power Technology Brief.
IRENA, 2013, 'Renewable Power Generation Costs in 2012: An Overview', Bonn, Germany.
IRENA, 2015, 'The Power to Change: Solar and Wind Cost Reduction Potential to 2025', Bonn,
Germany.
Irwin, H., 1981, 'The design of spires for wind simulation', Journal of Wind Engineering and
Industrial Aerodynamics, 7, p361-366.
Kolb, G.J., Ho, C.K., Mancini, T.R. and Gary, J.A., 2011, 'Power Tower Technology Roadmap
and Cost Reduction Plan', SAND2011-2419; Sandia National Laboratories, Albuquerque,
USA.
Kolb, G.J., Jones, S.A., Donnelly, M.W., Gorman, D., Thomas, R., Davenport, R. and Lumia,
R., 2007, 'Heliostat Cost Reduction Study', SAND2007-3293; Sandia National
Laboratories, Albuquerque, USA.
Page 12
Mehos, M., Turchi, C., Jorgenson, J., Denholm, P., Ho, C. and Armijo, K., 2016, 'On the Path
to SunShot. Advancing Concentrating Solar Power Technology, Performance, and
Dispatchability', National Renewable Energy Laboratory (NREL), Golden, Colorado, USA.
Mehos, M., Turchi, C., Vidal, J., Wagner, M., Ma, Z., Ho, C., Kolb, W., Andraka, C. and
Kruizenga, A., 2017, 'Concentrating Solar Power Gen3 Demonstration Roadmap', National
Renewable Energy Laboratory (NREL), Golden, Colorado, USA.
Peterka, J.A. and Derickson, R.G., 1992, 'Wind load design methods for ground-based
heliostats and parabolic dish collectors', SAND92-7009; Sandia National Laboratories,
Albuquerque, USA.
Peterka, J.A., Tan, Z., Cermak, J.E. and Bienkiewicz, B., 1989, 'Mean and peak wind loads on
heliostats', Journal of solar energy engineering, 111, p158-164.
Pfahl, A., Buselmeier, M. and Zaschke, M., 2011, 'Wind loads on heliostats and photovoltaic
trackers of various aspect ratios', Solar Energy, 85, p2185-2201.
Pfahl, A., Coventry, J., Röger, M., Wolfertstetter, F., Vásquez-Arango, J.F., Gross, F.,
Arjomandi, M., Schwarzbözl, P., Geiger, M. and Liedke, P., 2017a, 'Progress in heliostat
development', Solar Energy, 152, p3-37.
Pfahl, A., Gross, F., Liedke, P., Hertel, J., Rheinländer, J., Mehta, S., Vásquez-Arango, J.F.,
Giuliano, S. and Buck, R., 2017b, 'Reduced to Minimum Cost: Lay-Down Heliostat with
Monolithic Mirror-Panel and Closed Loop Control'. In: Proc., SolarPACES 2017, Santiago,
Chile.
Pfahl, A., Randt, M., Meier, F., Zaschke, M., Geurts, C. and Buselmeier, M., 2015, 'A holistic
approach for low cost heliostat fields', Energy Procedia, 69, p178-187.
Téllez, F., Burisch, M., Villasente, Sánchez, M., Sansom, C., Kirby, P., Turner, P., Caliot, C.,
Ferriere, A., Bonanos, C.A., Papanicolas, C., Montenon, A., Monterreal, R. and Fernández,
J., 2014, 'State of the Art in Heliostats and Definition of Specifications', 609837; STAGE-
STE Project, Madrid, Spain.
Acknowledgements
Support for the work has been provided by the Australian Government Research Training
Program Scholarship and by the Australian Solar Thermal Research Initiative (ASTRI) through
funding provided by the Australian Renewable Energy Agency (ARENA).