applied sciences Article Experimental Investigation on Contaminated Friction of Hydraulic Spool Valve Shuai Fan 1,2 , Rui Xu 1,2 , Hong Ji 1,2, *, Shengqing Yang 1,2 and Qingyun Yuan 1,2 1 Energy and Power Engineering College, Lanzhou University of Technology, Lanzhou 730050, China; [email protected] (S.F.); [email protected] (R.X.); [email protected] (S.Y.); [email protected] (Q.Y.) 2 Gansu Province Research Center of Hydraulics and Pneumatics Engineering Technology, Lanzhou 730050, China * Correspondence: [email protected]; Tel.: +86-13893225310 Received: 11 November 2019; Accepted: 26 November 2019; Published: 1 December 2019 Featured Application: A real-time measuring device for contaminated friction of hydraulic spool valve is designed and applied in this paper, which is innovative and practical in the machinery field. Abstract: This paper focuses on the contaminated friction of fit clearance between the spool and valve body to explore the influence principles of clamping stagnation phenomenon. From the perspective of surface morphology and size of particulates in the clearance, designing and manufacturing the valve body, rough spool, conical spool, and standard morphology spool, the test bench was built up and the curves of real-time contaminated friction in the movement of spools were obtained through experiments. The curves show that the contaminated frictions have a feature of pulsation; meanwhile, the stagnation-sensitive size of particulates is between 0.7 and 0.9 times that of clearance. Compared to the ideal morphology spool within the range of sensitive size, the contaminated fiction of rough spool is increased, whereas the lower limit of stagnation-sensitive size range of particulates on conical spool is decreased. The contaminated friction is gradually increased on cis-conical spool but increased first and then decreased on invert cone spool. Keywords: hydraulic spool; solid particulates; contaminated friction; stagnation-sensitive size 1. Introduction Hydraulic spool is one of the basic structural forms of hydraulic control valve. There is a circular clearance in micron level between spool and body, which plays a part in guiding and lubricating the spool movement. Solid particulates whose size nearly fit clearance probably enter into the clearance with fluid in hydraulic system and have impacts on spools movement, and furthermore cause stagnation of the spool. The size of solid particulates and morphology of fit clearance are the main factors of stagnation in spool valve. Therefore, research on contaminated friction in different size of particulates and morphology of fitting clearance will have important theoretical and practical values regarding enhancement of spool contamination resistibility. Domestic and international researches have been carrying out wide and deep research into the mechanism of spool contaminated stagnation. Factors thought to influence stagnation have been explored, and the optimal size and profile error of fit clearance that provides a reference for stagnation of hydraulic valve caused by machining quality has been obtained (Wang 2005) [1]. Surveys such as that conducted by Wang Anlin et al. [2] have shown a robust designing method to solve stagnation of spool caused by viscous heating. Several attempts have been made to research the influence of Appl. Sci. 2019, 9, 5230; doi:10.3390/app9235230 www.mdpi.com/journal/applsci
Transcript
applied sciences
Article
Experimental Investigation on Contaminated Frictionof Hydraulic Spool Valve
Shuai Fan 1,2, Rui Xu 1,2, Hong Ji 1,2,*, Shengqing Yang 1,2 and Qingyun Yuan 1,2
Received: 11 November 2019; Accepted: 26 November 2019; Published: 1 December 2019 �����������������
Featured Application: A real-time measuring device for contaminated friction of hydraulic spoolvalve is designed and applied in this paper, which is innovative and practical in the machineryfield.
Abstract: This paper focuses on the contaminated friction of fit clearance between the spool and valvebody to explore the influence principles of clamping stagnation phenomenon. From the perspectiveof surface morphology and size of particulates in the clearance, designing and manufacturing thevalve body, rough spool, conical spool, and standard morphology spool, the test bench was built upand the curves of real-time contaminated friction in the movement of spools were obtained throughexperiments. The curves show that the contaminated frictions have a feature of pulsation; meanwhile,the stagnation-sensitive size of particulates is between 0.7 and 0.9 times that of clearance. Comparedto the ideal morphology spool within the range of sensitive size, the contaminated fiction of roughspool is increased, whereas the lower limit of stagnation-sensitive size range of particulates on conicalspool is decreased. The contaminated friction is gradually increased on cis-conical spool but increasedfirst and then decreased on invert cone spool.
Hydraulic spool is one of the basic structural forms of hydraulic control valve. There is a circularclearance in micron level between spool and body, which plays a part in guiding and lubricating thespool movement. Solid particulates whose size nearly fit clearance probably enter into the clearancewith fluid in hydraulic system and have impacts on spools movement, and furthermore cause stagnationof the spool. The size of solid particulates and morphology of fit clearance are the main factors ofstagnation in spool valve. Therefore, research on contaminated friction in different size of particulatesand morphology of fitting clearance will have important theoretical and practical values regardingenhancement of spool contamination resistibility.
Domestic and international researches have been carrying out wide and deep research into themechanism of spool contaminated stagnation. Factors thought to influence stagnation have beenexplored, and the optimal size and profile error of fit clearance that provides a reference for stagnationof hydraulic valve caused by machining quality has been obtained (Wang 2005) [1]. Surveys such asthat conducted by Wang Anlin et al. [2] have shown a robust designing method to solve stagnationof spool caused by viscous heating. Several attempts have been made to research the influence of
micrometer and relative roughness on the clearance, finding that roughness can cause greater flowresistance, which is a basis for improving the morphology of kinematic pair (Kandlikar et al., 2005;Yin et al., 2017; Terrell et al., 2007; Dharaiya et al., 2013; Qu et al., 2000) [3–7]. Numerous studies havebeen attempted to design the valve contaminated friction test device and have obtained the frictionfrom static to motion under the different conditions, like the size of clearance, surface roughness,eccentricity, and static time, but up to now these researches have been at the initiating stage of thespool and do not measure during the whole movement in real-time (Zheng et al., 2014; Ge et al., 2014;Mittal et al., 2001; Feng et al., 2016; Inoue et al., 1980; Jiang et al., 2011; Feng et al., 2009) [8–14]. Much ofthe literature on particulates pays particular attention to the movement characteristics in the clearance(Mittal et al., 2005, Heltai et al., 2012, Feng et al., 1994, Cundall et al., 1979; Khandaker et al., 1993;Kwon et al., 2000; Edmonds et al., 2000; Qianpeng C et al., 2018) [15–22]; model simulation calculationand visualization experiments were carried out, which found that rotation phenomenon of particulatesduring the movement increased contacts with the clearance surface, which plays an important role instagnation of spool
It is the contact of solid particulates with the spool valve and body that is the main resistance ofmovement on spool. The aim of paper is to analyze the influencing factors of spool valve contaminatedstagnation in a novel way based on the point of view of friction, and an experimental test benchfor real-time measuring contaminated friction of spool valve was designed and built. According toequilibrium condition of forces, the contaminated friction is measured in real-time with the movementof spool. Analysis of the mechanism of morphological factors that affects spool movement, such ascis-conical, inverted cone, and roughness of fit clearance, and the stagnation-sensitive size of solidparticulates were explored quantitatively.
2. The Real-Time Experimental System of Contaminated Friction Measurement
2.1. The Experimental Model of Spool
The main structure type of this experimental model is circular ring fit clearance. Aiming at thesurface roughness, cylindricity, and other morphology characteristics of general spool within themachining tolerance range, the clearance size of experimental model is enlarged (30 times) and themodels of standard morphology spool, rough spool, conical spool, and valve body were designed andmanufactured. The experimental model is shown in Figure 1, and spools that have been processed areshown in Figure 2. The structural parameters of spools and body are shown in Table 1, where m ismass of spool.
Appl. Sci. 2019, 9, x 2 of 14
et al., 2005; Yin et al., 2017; Terrell et al., 2007; Dharaiya et al., 2013; Qu et al., 2000) [3–7]. Numerous studies have been attempted to design the valve contaminated friction test device and have obtained the friction from static to motion under the different conditions, like the size of clearance, surface roughness, eccentricity, and static time, but up to now these researches have been at the initiating stage of the spool and do not measure during the whole movement in real-time (Zheng et al., 2014; Ge et al., 2014; Mittal et al., 2001; Feng et al., 2016; Inoue et al., 1980; Jiang et al., 2011; Feng et al., 2009) [8–14]. Much of the literature on particulates pays particular attention to the movement characteristics in the clearance (Mittal et al., 2005, Heltai et al., 2012, Feng et al., 1994, Cundall et al., 1979; Khandaker et al., 1993; Kwon et al., 2000; Edmonds et al., 2000; Qianpeng C et al., 2018) [15–22]; model simulation calculation and visualization experiments were carried out, which found that rotation phenomenon of particulates during the movement increased contacts with the clearance surface, which plays an important role in stagnation of spool
It is the contact of solid particulates with the spool valve and body that is the main resistance of movement on spool. The aim of paper is to analyze the influencing factors of spool valve contaminated stagnation in a novel way based on the point of view of friction, and an experimental test bench for real-time measuring contaminated friction of spool valve was designed and built. According to equilibrium condition of forces, the contaminated friction is measured in real-time with the movement of spool. Analysis of the mechanism of morphological factors that affects spool movement, such as cis-conical, inverted cone, and roughness of fit clearance, and the stagnation-sensitive size of solid particulates were explored quantitatively.
2. The Real-Time Experimental System of Contaminated Friction Measurement
2.1. The Experimental Model of Spool
The main structure type of this experimental model is circular ring fit clearance. Aiming at the surface roughness, cylindricity, and other morphology characteristics of general spool within the machining tolerance range, the clearance size of experimental model is enlarged (30 times) and the models of standard morphology spool, rough spool, conical spool, and valve body were designed and manufactured. The experimental model is shown in Figure 1, and spools that have been processed are shown in Figure 2. The structural parameters of spools and body are shown in Table 1, where m is mass of spool.
(a) (b)
Figure 1. Experimental model of spool: (a) Experimental model of valve body and (b) experimental model of spool.
Figure 1. Experimental model of spool: (a) Experimental model of valve body and (b) experimentalmodel of spool.
Appl. Sci. 2019, 9, 5230 3 of 14
Appl. Sci. 2019, 9, x 3 of 14
Figure 2. The spools have been processed: (a) standard morphology spool, (b) conical spool, and (c) rough spool.
The oil of the suspended solid particulates is composed of hydraulic fluid and solid particulates at certain size. No. 46 anti-wear hydraulic oil is selected as the working medium, and its specifications are shown in Table 2.
To reach the measuring universality in solid particulates and fit clearance, the solid particulates were selected as 0.1, 0.2, 0.3, 0.4, 0.5, 0.6, 0.7, 0.8, 0.9, and 1 times the size of clearance between spool with standard morphology and valve body. Ten oil samples were made with a volume fraction of 2% under different particulates size.
Recent evidence (Singh et al., 2012; Zhang et al., 2011; Murali et al., 2009) [23–25] suggests that metal particulate pollutants account for ~75% of total pollutants in the working medium of the hydraulic system. Therefore, the solid particulates used in the test should be metallic, light in mass, and have good following performance. By comparing the physical and chemical properties of different commonly used metals, we found that pure aluminum can meet the testing requirement with good following, chemical stability, and fire resistance in air, and, with the help of the metal powder separation sieve (as shown in Figure 3), the particulates are separated into 10 samples, including 60 μm, 120 μm, 180 μm, 240 μm, 300 μm, 360 μm, 420 μm, 480 μm, 540 μm, and 600 μm, and images of the particulates are shown in Figure 4, taken by optical microscope (as shown in Figure 5).
a b c
Figure 2. The spools have been processed: (a) standard morphology spool, (b) conical spool,and (c) rough spool.
The oil of the suspended solid particulates is composed of hydraulic fluid and solid particulatesat certain size. No. 46 anti-wear hydraulic oil is selected as the working medium, and its specificationsare shown in Table 2.
To reach the measuring universality in solid particulates and fit clearance, the solid particulateswere selected as 0.1, 0.2, 0.3, 0.4, 0.5, 0.6, 0.7, 0.8, 0.9, and 1 times the size of clearance between spoolwith standard morphology and valve body. Ten oil samples were made with a volume fraction of 2%under different particulates size.
Recent evidence (Singh et al., 2012; Zhang et al., 2011; Murali et al., 2009) [23–25] suggeststhat metal particulate pollutants account for ~75% of total pollutants in the working medium of thehydraulic system. Therefore, the solid particulates used in the test should be metallic, light in mass,and have good following performance. By comparing the physical and chemical properties of differentcommonly used metals, we found that pure aluminum can meet the testing requirement with goodfollowing, chemical stability, and fire resistance in air, and, with the help of the metal powder separationsieve (as shown in Figure 3), the particulates are separated into 10 samples, including 60 µm, 120 µm,180 µm, 240 µm, 300 µm, 360 µm, 420 µm, 480 µm, 540 µm, and 600 µm, and images of the particulatesare shown in Figure 4, taken by optical microscope (as shown in Figure 5).
Appl. Sci. 2019, 9, 5230 4 of 14
Appl. Sci. 2019, 9, x 4 of 14
Figure 3. The metal powder separation sieve.
60 μm 120 μm 180 μm 240 μm 300 μm
360 μm 420 μm 480 μm 540 μm 600 μm
Figure 4. The microscopic view of particulates (figure below) and partial enlarges.
Figure 5. The optical microscope.
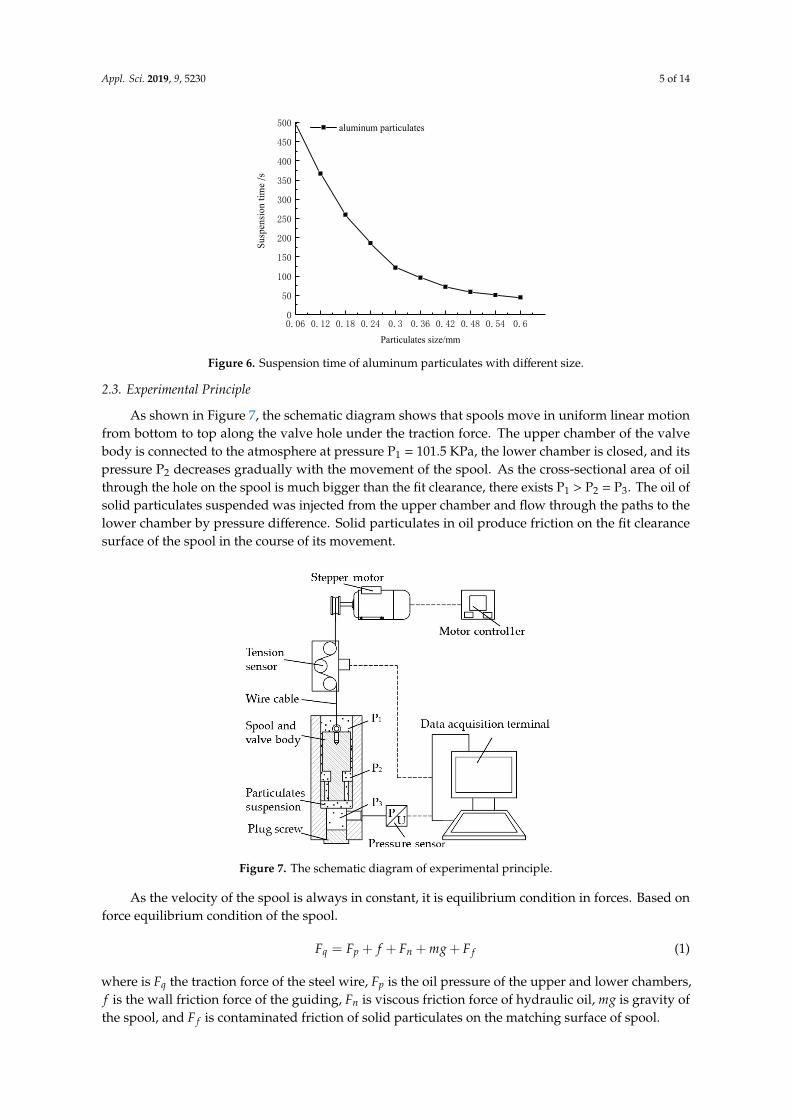
The suspension time of aluminum particulates in oil was further measured. One-hundred milliliter samples of the oil of aluminum particulates were suspended with a volume fraction of 2% at each size. Particulate suspension time was measured, and the variation curve of the time under different particulates size was drawn, as shown in Figure 6. It is apparent from Figure 6 that the suspension time of aluminum particulates at each size is greater than 45 s. The aluminum particulates are in a uniform distribution in the oil during experiments at the single experimental time of 45 s.
Figure 3. The metal powder separation sieve.
Appl. Sci. 2019, 9, x 4 of 14
Figure 3. The metal powder separation sieve.
60 μm 120 μm 180 μm 240 μm 300 μm
360 μm 420 μm 480 μm 540 μm 600 μm
Figure 4. The microscopic view of particulates (figure below) and partial enlarges.
Figure 5. The optical microscope.
The suspension time of aluminum particulates in oil was further measured. One-hundred milliliter samples of the oil of aluminum particulates were suspended with a volume fraction of 2% at each size. Particulate suspension time was measured, and the variation curve of the time under different particulates size was drawn, as shown in Figure 6. It is apparent from Figure 6 that the suspension time of aluminum particulates at each size is greater than 45 s. The aluminum particulates are in a uniform distribution in the oil during experiments at the single experimental time of 45 s.
Figure 4. The microscopic view of particulates (figure below) and partial enlarges.
Appl. Sci. 2019, 9, x 4 of 14
Figure 3. The metal powder separation sieve.
60 μm 120 μm 180 μm 240 μm 300 μm
360 μm 420 μm 480 μm 540 μm 600 μm
Figure 4. The microscopic view of particulates (figure below) and partial enlarges.
Figure 5. The optical microscope.
The suspension time of aluminum particulates in oil was further measured. One-hundred milliliter samples of the oil of aluminum particulates were suspended with a volume fraction of 2% at each size. Particulate suspension time was measured, and the variation curve of the time under different particulates size was drawn, as shown in Figure 6. It is apparent from Figure 6 that the suspension time of aluminum particulates at each size is greater than 45 s. The aluminum particulates are in a uniform distribution in the oil during experiments at the single experimental time of 45 s.
Figure 5. The optical microscope.
The suspension time of aluminum particulates in oil was further measured. One-hundred millilitersamples of the oil of aluminum particulates were suspended with a volume fraction of 2% at eachsize. Particulate suspension time was measured, and the variation curve of the time under differentparticulates size was drawn, as shown in Figure 6. It is apparent from Figure 6 that the suspensiontime of aluminum particulates at each size is greater than 45 s. The aluminum particulates are in auniform distribution in the oil during experiments at the single experimental time of 45 s.
Appl. Sci. 2019, 9, 5230 5 of 14Appl. Sci. 2019, 9, x 5 of 14
0.06 0.12 0.18 0.24 0.3 0.36 0.42 0.48 0.54 0.60
50
100
150
200
250
300
350
400
450
500
Susp
ensio
n tim
e /s
Particulates size/mm
aluminum particulates
Figure 6. Suspension time of aluminum particulates with different size.
2.3. Experimental Principle
As shown in Figure 7, the schematic diagram shows that spools move in uniform linear motion from bottom to top along the valve hole under the traction force. The upper chamber of the valve body is connected to the atmosphere at pressure P1 = 101.5 KPa, the lower chamber is closed, and its pressure P2 decreases gradually with the movement of the spool. As the cross-sectional area of oil through the hole on the spool is much bigger than the fit clearance, there exists P1 > P2 = P3. The oil of solid particulates suspended was injected from the upper chamber and flow through the paths to the lower chamber by pressure difference. Solid particulates in oil produce friction on the fit clearance surface of the spool in the course of its movement.
Figure 7. The schematic diagram of experimental principle.
As the velocity of the spool is always in constant, it is equilibrium condition in forces. Based on force equilibrium condition of the spool.
fnpq FmgFfFF ++++= (1)
where is qF the traction force of the steel wire, pF is the oil pressure of the upper and lower
chambers, f is the wall friction force of the guiding, nF is viscous friction force of hydraulic oil,
Figure 6. Suspension time of aluminum particulates with different size.
2.3. Experimental Principle
As shown in Figure 7, the schematic diagram shows that spools move in uniform linear motionfrom bottom to top along the valve hole under the traction force. The upper chamber of the valvebody is connected to the atmosphere at pressure P1 = 101.5 KPa, the lower chamber is closed, and itspressure P2 decreases gradually with the movement of the spool. As the cross-sectional area of oilthrough the hole on the spool is much bigger than the fit clearance, there exists P1 > P2 = P3. The oil ofsolid particulates suspended was injected from the upper chamber and flow through the paths to thelower chamber by pressure difference. Solid particulates in oil produce friction on the fit clearancesurface of the spool in the course of its movement.
Appl. Sci. 2019, 9, x 5 of 14
0.06 0.12 0.18 0.24 0.3 0.36 0.42 0.48 0.54 0.60
50
100
150
200
250
300
350
400
450
500
Susp
ensio
n tim
e /s
Particulates size/mm
aluminum particulates
Figure 6. Suspension time of aluminum particulates with different size.
2.3. Experimental Principle
As shown in Figure 7, the schematic diagram shows that spools move in uniform linear motion from bottom to top along the valve hole under the traction force. The upper chamber of the valve body is connected to the atmosphere at pressure P1 = 101.5 KPa, the lower chamber is closed, and its pressure P2 decreases gradually with the movement of the spool. As the cross-sectional area of oil through the hole on the spool is much bigger than the fit clearance, there exists P1 > P2 = P3. The oil of solid particulates suspended was injected from the upper chamber and flow through the paths to the lower chamber by pressure difference. Solid particulates in oil produce friction on the fit clearance surface of the spool in the course of its movement.
Figure 7. The schematic diagram of experimental principle.
As the velocity of the spool is always in constant, it is equilibrium condition in forces. Based on force equilibrium condition of the spool.
fnpq FmgFfFF ++++= (1)
where is qF the traction force of the steel wire, pF is the oil pressure of the upper and lower
chambers, f is the wall friction force of the guiding, nF is viscous friction force of hydraulic oil,
Figure 7. The schematic diagram of experimental principle.
As the velocity of the spool is always in constant, it is equilibrium condition in forces. Based onforce equilibrium condition of the spool.
Fq = Fp + f + Fn + mg + F f (1)
where is Fq the traction force of the steel wire, Fp is the oil pressure of the upper and lower chambers,f is the wall friction force of the guiding, Fn is viscous friction force of hydraulic oil, mg is gravity ofthe spool, and F f is contaminated friction of solid particulates on the matching surface of spool.
Appl. Sci. 2019, 9, 5230 6 of 14
Neglect the cross-sectional area of the wire line and obtain the oil pressure,
Fp = P1 ·14πd1 − P2 ·
14πd2 (2)
where d1 is the spool diameter of the upper-end face and d2 is the spool diameter of the lower-end face.It is assumed that the wall friction, f , of the guiding spool and the viscous friction of the hydraulic
oil are both constant values whose addition are the natural friction C of the spool. When the workingmedium is clean oil, the contaminated friction is (Fn = 0), and we can obtain the relationship
f + Fn = C = Fq − Fp −mg (3)
The calculation equation of real-time contaminated friction is
F f = Fq − Fp −C−mg (4)
2.4. The Real-Time Experimental Test Bench for Measuring Contaminated Friction of Spool
Aiming at principle of real-time measurement of spool contaminated friction, the experimentaltest bench for real-time measuring was built, as shown in Figure 8.
Appl. Sci. 2019, 9, x 6 of 14
mg is gravity of the spool, and fF is contaminated friction of solid particulates on the matching
surface of spool. Neglect the cross-sectional area of the wire line and obtain the oil pressure,
2211 41
41 dPdPFp ππ ⋅−⋅= (2)
where 1d is the spool diameter of the upper-end face and 2d is the spool diameter of the lower-end face.
It is assumed that the wall friction, f , of the guiding spool and the viscous friction of the hydraulic oil are both constant values whose addition are the natural friction C of the spool. When
the working medium is clean oil, the contaminated friction is ( 0nF = ), and we can obtain the relationship
mgFFCFf pqn −−==+ (3)
The calculation equation of real-time contaminated friction is
mgCFFF pqf −−−= (4)
2.4. The Real-Time Experimental Test Bench for Measuring Contaminated Friction of Spool
Aiming at principle of real-time measurement of spool contaminated friction, the experimental test bench for real-time measuring was built, as shown in Figure 8.
Figure 8. The real-time experimental test bench for measuring contaminated friction of spool.
The experimental system is mainly composed of power source: stepper motor; traction measurement module: tension sensor; oil pressure measurement module: pressure sensor; and experimental model: spool model, etc. The parameters of components are shown in Table 3.
Table 3. Experimental system element parameters.
Components Type Parameters
Stepper motor 57BYG250H-8 pulse frequency 600 Hz rotational speed 2.12 r/min
Figure 8. The real-time experimental test bench for measuring contaminated friction of spool.
The experimental system is mainly composed of power source: stepper motor; tractionmeasurement module: tension sensor; oil pressure measurement module: pressure sensor; andexperimental model: spool model, etc. The parameters of components are shown in Table 3.
Table 3. Experimental system element parameters.
Components Type Parameters
Stepper motor 57BYG250H-8 pulse frequency 600 Hzrotational speed 2.12 r/min
Tension sensor JZHL-T1 range100Nprecision 0.5%
Pressure sensor CYYZ11 range-50 KPaprecision 0.5%
Basis on rotational speed value of stepper motor in Table 3, the velocity of the spool can becalculated as 3.33 mm/s, the single experimental time is 30 s, and g = 9.81 m/s2.
The experiment procedures are as follows.
Appl. Sci. 2019, 9, 5230 7 of 14
(1) Place the spools to the bottom of valve hole and injecting oil with particulates suspended of eachsize into the experimental model.
(2) Start stepper motor and pull spools along the valve hole in a constant velocity.(3) The real-time traction force and oil pressure values are collected after the movement is stable.(4) The experimental data were substituted into Equations (2) and (4) for post-treatment. The
real-time contaminated friction of spool with various morphologies in oil with particulatessuspended of each size was obtained after processing.
2.5. Comprehensive Measuring Accuracy of the Experimental System
The temperature of experimental system is room temperature. The working medium is clean oil.The curve of traction force of standard morphology spool over time is shown in Figure 9, and the curveof relative pressure of oil in the lower chamber over time is shown in Figure 10.
Appl. Sci. 2019, 9, x 7 of 14
Basis on rotational speed value of stepper motor in Table 3, the velocity of the spool can be calculated as 3.33 mm/s, the single experimental time is 30 s, and g = 9.81 m/s .
The experiment procedures are as follows.
(1) Place the spools to the bottom of valve hole and injecting oil with particulates suspended of each size into the experimental model.
(2) Start stepper motor and pull spools along the valve hole in a constant velocity. (3) The real-time traction force and oil pressure values are collected after the movement is stable. (4) The experimental data were substituted into Equations (2) and (4) for post-treatment. The real-
time contaminated friction of spool with various morphologies in oil with particulates suspended of each size was obtained after processing.
2.5. Comprehensive Measuring Accuracy of the Experimental System
The temperature of experimental system is room temperature. The working medium is clean oil. The curve of traction force of standard morphology spool over time is shown in Figure 9, and the curve of relative pressure of oil in the lower chamber over time is shown in Figure 10.
0 5 10 15 20 25 300
1
2
3
4
5
6
7
8
9
10
Trac
tion
forc
e/N
Time/s
The standard valve core
Figure 9. The curve of traction force.
0 5 10 15 20 25 30-6000
-5000
-4000
-3000
-2000
-1000
0
Rela
tivel
y ne
gativ
e pr
essu
re/N
Time/s
The standard valve core
Figure 10. The curve of relative pressure in lower chamber.
The measured traction force and oil pressure are substituted into Equations (2) and (4) to calculate the natural friction force of spool with standard morphology, as shown in Figure 11.
Figure 9. The curve of traction force.
Appl. Sci. 2019, 9, x 7 of 14
Basis on rotational speed value of stepper motor in Table 3, the velocity of the spool can be calculated as 3.33 mm/s, the single experimental time is 30 s, and g = 9.81 m/s .
The experiment procedures are as follows.
(1) Place the spools to the bottom of valve hole and injecting oil with particulates suspended of each size into the experimental model.
(2) Start stepper motor and pull spools along the valve hole in a constant velocity. (3) The real-time traction force and oil pressure values are collected after the movement is stable. (4) The experimental data were substituted into Equations (2) and (4) for post-treatment. The real-
time contaminated friction of spool with various morphologies in oil with particulates suspended of each size was obtained after processing.
2.5. Comprehensive Measuring Accuracy of the Experimental System
The temperature of experimental system is room temperature. The working medium is clean oil. The curve of traction force of standard morphology spool over time is shown in Figure 9, and the curve of relative pressure of oil in the lower chamber over time is shown in Figure 10.
0 5 10 15 20 25 300
1
2
3
4
5
6
7
8
9
10
Trac
tion
forc
e/N
Time/s
The standard valve core
Figure 9. The curve of traction force.
0 5 10 15 20 25 30-6000
-5000
-4000
-3000
-2000
-1000
0
Rela
tivel
y ne
gativ
e pr
essu
re/N
Time/s
The standard valve core
Figure 10. The curve of relative pressure in lower chamber.
The measured traction force and oil pressure are substituted into Equations (2) and (4) to calculate the natural friction force of spool with standard morphology, as shown in Figure 11.
Figure 10. The curve of relative pressure in lower chamber.
The measured traction force and oil pressure are substituted into Equations (2) and (4) to calculatethe natural friction force of spool with standard morphology, as shown in Figure 11.
Appl. Sci. 2019, 9, 5230 8 of 14Appl. Sci. 2019, 9, x 8 of 14
0 5 10 15 20 25 30-1.0
-0.8
-0.6
-0.4
-0.2
0.0
0.2
0.4
0.6
0.8
1.0
1.2
Nat
ural
fric
tion/
N
Time/s
The standard valve core
Figure 11. The natural friction curve of the spool.
It can be seen in Figure 11 that the natural friction of spool variation is −0.6–1.0 N, and taking the mean value 0.2 N as reference, the comprehensive measuring accuracy of the experimental system is 0.8 N.
3. Contaminated Friction Experimental Analysis of the Spool with Standard Morphology
3.1. The Contaminated Friction Curve of the Spool
The real-time contaminated friction along the movement of spools with standard morphology was measured, which in the different oil of particulates suspended under 0.1, 0.2, 0.3, 0.4, 0.5, 0.6, 0.7, 0.8, 0.9, and 1 times the size of clearance, obtained the curves of the clamping stagnation with time, as shown in Figure 12.
In the process of the experiment, under the particulates is 1 times the size of clearance. During the experiment there existed complete stagnation, showing that the spool and stepper motor stopped. Therefore, the curve is only showing before the time of 7 s, as shown in Figure 12j.
0 5 10 15 20 25 300.1
1
10
100
Con
tam
inat
ed fr
ictio
n/N
Time/s
0.06mm
0.6
0 5 10 15 20 25 30
0.1
1
10
100
Cont
amin
ated
fric
tion/
N
Time/s
0.12mm
(a) (b)
Figure 11. The natural friction curve of the spool.
It can be seen in Figure 11 that the natural friction of spool variation is −0.6–1.0 N, and taking themean value 0.2 N as reference, the comprehensive measuring accuracy of the experimental system is0.8 N.
3. Contaminated Friction Experimental Analysis of the Spool with Standard Morphology
3.1. The Contaminated Friction Curve of the Spool
The real-time contaminated friction along the movement of spools with standard morphologywas measured, which in the different oil of particulates suspended under 0.1, 0.2, 0.3, 0.4, 0.5, 0.6, 0.7,0.8, 0.9, and 1 times the size of clearance, obtained the curves of the clamping stagnation with time,as shown in Figure 12.
In the process of the experiment, under the particulates is 1 times the size of clearance. Duringthe experiment there existed complete stagnation, showing that the spool and stepper motor stopped.Therefore, the curve is only showing before the time of 7 s, as shown in Figure 12j.
Appl. Sci. 2019, 9, x 8 of 14
0 5 10 15 20 25 30-1.0
-0.8
-0.6
-0.4
-0.2
0.0
0.2
0.4
0.6
0.8
1.0
1.2
Nat
ural
fric
tion/
N
Time/s
The standard valve core
Figure 11. The natural friction curve of the spool.
It can be seen in Figure 11 that the natural friction of spool variation is −0.6–1.0 N, and taking the mean value 0.2 N as reference, the comprehensive measuring accuracy of the experimental system is 0.8 N.
3. Contaminated Friction Experimental Analysis of the Spool with Standard Morphology
3.1. The Contaminated Friction Curve of the Spool
The real-time contaminated friction along the movement of spools with standard morphology was measured, which in the different oil of particulates suspended under 0.1, 0.2, 0.3, 0.4, 0.5, 0.6, 0.7, 0.8, 0.9, and 1 times the size of clearance, obtained the curves of the clamping stagnation with time, as shown in Figure 12.
In the process of the experiment, under the particulates is 1 times the size of clearance. During the experiment there existed complete stagnation, showing that the spool and stepper motor stopped. Therefore, the curve is only showing before the time of 7 s, as shown in Figure 12j.
0 5 10 15 20 25 300.1
1
10
100
Con
tam
inat
ed fr
ictio
n/N
Time/s
0.06mm
0.6
0 5 10 15 20 25 30
0.1
1
10
100
Cont
amin
ated
fric
tion/
N
Time/s
0.12mm
(a) (b)
Figure 12. Cont.
Appl. Sci. 2019, 9, 5230 9 of 14Appl. Sci. 2019, 9, x 9 of 14
0 5 10 15 20 25 300.1
1
10
100
Con
tam
inat
ed fr
ictio
n/N
Time/s
0.18mm
0 5 10 15 20 25 30
0.1
1
10
100
Cont
amin
ated
fric
tion/
N
Time/s
0.24mm
(c) (d)
0 5 10 15 20 25 300.1
1
10
100
Cont
amin
ated
fric
tion/
N
Time/s
0.30mm
0 5 10 15 20 25 30
0.1
1
10
100
Cont
amin
ated
fric
tion/
N
Time/s
0.36mm
(e) (f)
0 5 10 15 20 25 300.1
1
10
100
Cont
amin
ated
fric
tion/
N
Time/s
0.42mm
2.6
0 5 10 15 20 25 30
0.1
1
10
100
Cont
amin
ated
fric
tion/
N
Time/s
0.48mm
14
(g) (h)
0 5 10 15 20 25 300.1
1
10
100
Cont
amin
ated
fric
tion/
N
Time/s
0.54mm56
0 5 10 15 20 25 300.1
1
10
100
Cont
amin
ated
fric
tion/
N
Time/s
0.6mm
(i) (j)
Figure 12. The real-time curve of contaminated friction. (a) The size of particulates is 0.06 mm. (b) Thesize of particulates is 0.12 mm. (c) The size of particulates is 0.18 mm. (d) The size of particulates is0.24 mm. (e) The size of particulates is 0.30 mm. (f) The size of particulates is 0.36 mm. (g) The size ofparticulates is 0.42 mm. (h) The size of particulates is 0.48 mm. (i) The size of particulates is 0.54 mm.(j) The size of particulates is 0.6 mm.
Appl. Sci. 2019, 9, 5230 10 of 14
Figure 12 reveals that contaminated friction along the path has the characteristics of pulsationand fluctuates in a certain range, which indicates that contaminated friction caused by the spoolintermittently appears with the movement of particulates. When there is a contact between the outercontour of solid particulates and the surface of fit clearance, the peak of contaminated friction appears,the contact separates, and the friction return to the troughs.
From Figure 12f–j, it can be seen that the fluctuation frequency of the real-time curves decreaseswith increase of particulates size; it is opposite for the maximum value friction. This occurs becausethe small size of solid particulates move easily in the clearance flow field and the tri-contacts of theexternal contour surface and two surfaces of fit clearance are very short at the same time. However,the movement of large-sized solid particulates is restricted and the tri-contacts occur over a longerperiod of time, so the friction amplitude is higher and relatively stable.
3.2. Stagnation-Sensitive Size
The maximum values in the curves were selected as the result of experimental friction. Becauseone times the size of clearance causes complete stagnation and there is no way to measure the friction,the frictions caused by 0.1 to 0.9 times the size of clearance are shown in Figure 13.
Appl. Sci. 2019, 9, x 10 of 14
Figure 12. The real-time curve of contaminated friction. (a) The size of particulates is 0.06mm. (b) The size of particulates is 0.12mm. (c) The size of particulates is 0.18mm. (d) The size of particulates is 0.24mm. (e) The size of particulates is 0.30mm. (f) The size of particulates is 0.36mm. (g) The size of particulates is 0.42mm. (h) The size of particulates is 0.48mm. (i) The size of particulates is 0.54mm. (j) The size of particulates is 0.6mm.
Figure 12 reveals that contaminated friction along the path has the characteristics of pulsation and fluctuates in a certain range, which indicates that contaminated friction caused by the spool intermittently appears with the movement of particulates. When there is a contact between the outer contour of solid particulates and the surface of fit clearance, the peak of contaminated friction appears, the contact separates, and the friction return to the troughs.
From Figure 12f–j, it can be seen that the fluctuation frequency of the real-time curves decreases with increase of particulates size; it is opposite for the maximum value friction. This occurs because the small size of solid particulates move easily in the clearance flow field and the tri-contacts of the external contour surface and two surfaces of fit clearance are very short at the same time. However, the movement of large-sized solid particulates is restricted and the tri-contacts occur over a longer period of time, so the friction amplitude is higher and relatively stable.
3.2. Stagnation-Sensitive Size
The maximum values in the curves were selected as the result of experimental friction. Because one times the size of clearance causes complete stagnation and there is no way to measure the friction, the frictions caused by 0.1 to 0.9 times the size of clearance are shown in Figure 13.
0.0 0.1 0.2 0.3 0.4 0.5 0.60
10
20
30
40
50
60
Con
tam
inat
ed fr
ictio
n/N
Particulates size/mm
Standard morphology valve core
Figure 13. The curve of contaminated friction with different particulates size.
According to Figure 13, when the solid particulates occupy less than 0.7 times the size of clearance, the spool contaminated friction is relative small. When the size is greater than or equal to 0.7 times the size of clearance, the spool contaminated friction begins to rise and grow exponentially with the increase in particulate size. Therefore, the stagnation-sensitive size of solid particulates is 0.7 to 0.9 times the size of clearance.
3.3. Contaminated Stagnation Model
By analyzing the iron spectrum photos of solid particulate contaminants in a hydraulic system, we found that the outer contour of the particulates is not an ideal circle in the two-dimensional plane from the literature (Yang et al., 2008) [26]: most are rectangles with oblong shape or quadrilateral shape with edges. Thus, simplify the outer profile of solid particulates into square shape, and the profile of fit clearance is rectangular. The contaminated clamping stagnation model is established, as shown in Figure 14.
Figure 13. The curve of contaminated friction with different particulates size.
According to Figure 13, when the solid particulates occupy less than 0.7 times the size of clearance,the spool contaminated friction is relative small. When the size is greater than or equal to 0.7 timesthe size of clearance, the spool contaminated friction begins to rise and grow exponentially with theincrease in particulate size. Therefore, the stagnation-sensitive size of solid particulates is 0.7 to 0.9times the size of clearance.
3.3. Contaminated Stagnation Model
By analyzing the iron spectrum photos of solid particulate contaminants in a hydraulic system,we found that the outer contour of the particulates is not an ideal circle in the two-dimensional planefrom the literature (Yang et al., 2008) [26]: most are rectangles with oblong shape or quadrilateral shapewith edges. Thus, simplify the outer profile of solid particulates into square shape, and the profile of fitclearance is rectangular. The contaminated clamping stagnation model is established, as shown inFigure 14.
Appl. Sci. 2019, 9, 5230 11 of 14Appl. Sci. 2019, 9, x 11 of 14
Figure 14. The spool model of contaminated stagnation.
As can be seen from Figure 14, it is clear that when the minimum size of the nonspherical solid particulates is smaller than the clearance, they can enter the fit clearance. It is assumed that the sizes of the three square solid particulates entering the clearance are a, b, and c, respectively, and the size of the clearance is H. The outer profile of particulate 1 cannot contact with two surfaces of the clearance at the same time. The two opposite angles of particulate 2 can exactly contact the two surfaces simultaneously. Particulate 3 cannot rotate completely in the clearance. Therefore, the stagnation-sensitive particulate in the spool clearance is particulate 2.
The geometry of a square:
707.02
==bb
Hb
(5)
From Equation (5), when the solid particulates is 0.7 times the size of clearance, the spool begins to produce contaminated friction, which corresponds to the test results.
4. The Experimental Analysis on Contaminated Friction of Spool with Different Morphologies
4.1. The Experimental Analysis on Contaminated Friction of the Rough Spool
The comparison on the contaminated friction between the rough spool and standard morphology spool, as shown in Figure 15.
0.0 0.1 0.2 0.3 0.4 0.5 0.60
5
10
15
20
25
30
35
40
45
50
55
60
65
Cont
amin
ated
fric
tion/
N
Particulates size/mm
Standard morphology valve core Rough valve core
Figure 15. The curve of rough spool on contaminated friction with different particulates size.
As can be seen from Figure 15, there are a number of similarities in the variation of the contaminated friction between the rough spool and the spool with standard morphology, that is, when the particulates are bigger than 0.7 times the size of clearance, the contaminated friction increases significantly, and for the rough spool, the sensitive size also is 0.7 to 0.9 times the size of clearance. By comparing the curves of two spools, it can be seen that the effects of particulates out of the sensitive size are smaller. Within sensitive size of stagnation, the frictions of rough spool are all higher than the spool with standard morphology. The surface roughness of spools reduces the flow
Figure 14. The spool model of contaminated stagnation.
As can be seen from Figure 14, it is clear that when the minimum size of the nonspherical solidparticulates is smaller than the clearance, they can enter the fit clearance. It is assumed that the sizes ofthe three square solid particulates entering the clearance are a, b, and c, respectively, and the size of theclearance is H. The outer profile of particulate 1 cannot contact with two surfaces of the clearance at thesame time. The two opposite angles of particulate 2 can exactly contact the two surfaces simultaneously.Particulate 3 cannot rotate completely in the clearance. Therefore, the stagnation-sensitive particulatein the spool clearance is particulate 2.
The geometry of a square:bH
=b√
2b= 0.707 (5)
From Equation (5), when the solid particulates is 0.7 times the size of clearance, the spool beginsto produce contaminated friction, which corresponds to the test results.
4. The Experimental Analysis on Contaminated Friction of Spool with Different Morphologies
4.1. The Experimental Analysis on Contaminated Friction of the Rough Spool
The comparison on the contaminated friction between the rough spool and standard morphologyspool, as shown in Figure 15.
Appl. Sci. 2019, 9, x 11 of 14
Figure 14. The spool model of contaminated stagnation.
As can be seen from Figure 14, it is clear that when the minimum size of the nonspherical solid particulates is smaller than the clearance, they can enter the fit clearance. It is assumed that the sizes of the three square solid particulates entering the clearance are a, b, and c, respectively, and the size of the clearance is H. The outer profile of particulate 1 cannot contact with two surfaces of the clearance at the same time. The two opposite angles of particulate 2 can exactly contact the two surfaces simultaneously. Particulate 3 cannot rotate completely in the clearance. Therefore, the stagnation-sensitive particulate in the spool clearance is particulate 2.
The geometry of a square:
707.02
==bb
Hb
(5)
From Equation (5), when the solid particulates is 0.7 times the size of clearance, the spool begins to produce contaminated friction, which corresponds to the test results.
4. The Experimental Analysis on Contaminated Friction of Spool with Different Morphologies
4.1. The Experimental Analysis on Contaminated Friction of the Rough Spool
The comparison on the contaminated friction between the rough spool and standard morphology spool, as shown in Figure 15.
0.0 0.1 0.2 0.3 0.4 0.5 0.60
5
10
15
20
25
30
35
40
45
50
55
60
65
Cont
amin
ated
fric
tion/
N
Particulates size/mm
Standard morphology valve core Rough valve core
Figure 15. The curve of rough spool on contaminated friction with different particulates size.
As can be seen from Figure 15, there are a number of similarities in the variation of the contaminated friction between the rough spool and the spool with standard morphology, that is, when the particulates are bigger than 0.7 times the size of clearance, the contaminated friction increases significantly, and for the rough spool, the sensitive size also is 0.7 to 0.9 times the size of clearance. By comparing the curves of two spools, it can be seen that the effects of particulates out of the sensitive size are smaller. Within sensitive size of stagnation, the frictions of rough spool are all higher than the spool with standard morphology. The surface roughness of spools reduces the flow
Figure 15. The curve of rough spool on contaminated friction with different particulates size.
As can be seen from Figure 15, there are a number of similarities in the variation of the contaminatedfriction between the rough spool and the spool with standard morphology, that is, when the particulatesare bigger than 0.7 times the size of clearance, the contaminated friction increases significantly, and forthe rough spool, the sensitive size also is 0.7 to 0.9 times the size of clearance. By comparing the curvesof two spools, it can be seen that the effects of particulates out of the sensitive size are smaller. Withinsensitive size of stagnation, the frictions of rough spool are all higher than the spool with standard
Appl. Sci. 2019, 9, 5230 12 of 14
morphology. The surface roughness of spools reduces the flow rate of boundary layer and increasesthe time of tri-contact with solid particulates, results in the increase of friction. Therefore, the surfaceroughness of spool can give aggravation to the clamping stagnation in spool movement.
4.2. The Experimental Analysis on Contaminated Friction of the Conical Spool
Compared with the standard morphology and rough spool, the topological structure of theflow field in the conical spool fit clearance changes greatly. As seen in Table 1, the inlet clearanceof cis-conical spool is large and the outlet is small, whereas the inverted cone spool is the opposite.To maintain the consistency of the fit clearance size of the standard morphology spool, the medianvalues of fit clearance size are selected as the reference size of the clearance.
The friction curves of cis-conical and inverted cone spools with the size of solid particulates arecompared with the standard morphology spool respectively are highlighted in Figure 16.
Appl. Sci. 2019, 9, x 12 of 14
rate of boundary layer and increases the time of tri-contact with solid particulates, results in the increase of friction. Therefore, the surface roughness of spool can give aggravation to the clamping stagnation in spool movement.
4.2. The Experimental Analysis on Contaminated Friction of the Conical Spool
Compared with the standard morphology and rough spool, the topological structure of the flow field in the conical spool fit clearance changes greatly. As seen in Table 1, the inlet clearance of cis-conical spool is large and the outlet is small, whereas the inverted cone spool is the opposite. To maintain the consistency of the fit clearance size of the standard morphology spool, the median values of fit clearance size are selected as the reference size of the clearance.
The friction curves of cis-conical and inverted cone spools with the size of solid particulates are compared with the standard morphology spool respectively are highlighted in Figure 16.
0.0 0.1 0.2 0.3 0.4 0.5 0.60
5
10
15
20
25
30
35
40
45
50
55
60
65
Cont
amin
ated
fric
tion/
N
Particulates size/mm
Standard morphology spool Cis-conical spool Inverted cone spool
Figure 16. The curve of conical spool on contaminated friction with different particulates size.
The size of the cis-conical spool with particulates is similar to other spools; the small size particulates are not obvious in spool stagnation, but particulates in the sensitive size range have significant impact on spool movement. Comparing with the curve of the spool with standard morphology, for the cis-conical spool, the lower limit of stagnation-sensitive size range is reduced, and the contaminated friction increased within the range of sensitive size. Regarding the inverted cone spool, the value of friction showed a trend of increasing first and then decreasing with increasing size of solid particulates, the lower limit of stagnation-sensitive size ranges is reduced, and the contaminated friction is less than standard morphology spool under the condition of the solid particulates is 0.9 times the size of clearance.
Compared with the fit clearance of standard morphology spool, the cis-conical spool fit clearance has a larger inlet and smaller outlet. For the cis-conical spool, on the one hand, the smaller clearance outlet gives small size particulates greater opportunity to occur the tri-contact and generate friction, which reduces the lower limit of stagnation-sensitive size range compared to the standard morphology spool. On the other hand, the sensitive size particulates in the working medium are easier to enter into clearance of cis-conical spool and cause the amount of particulates rising that increase the friction directly. The reasons for the lower limit reducing in stagnation-sensitive size of invert cone spool are the same as cis-conical spool: the 0.9 times the size of clearance can be regarded as an inverted cone spool inlet and the small particulates in the sensitive size do not easily enter the clearance thus the friction is smaller.
It is found that the conical spools increase the contact between small size solid particulates and the clearance matching surface, increasing the friction of spools in the sensitive size range compared to the standard spool; therefore, the conical spool has been an important factor in aggravating the clamping stagnation of spool movement.
5. Conclusions
Figure 16. The curve of conical spool on contaminated friction with different particulates size.
The size of the cis-conical spool with particulates is similar to other spools; the small sizeparticulates are not obvious in spool stagnation, but particulates in the sensitive size range havesignificant impact on spool movement. Comparing with the curve of the spool with standardmorphology, for the cis-conical spool, the lower limit of stagnation-sensitive size range is reduced,and the contaminated friction increased within the range of sensitive size. Regarding the inverted conespool, the value of friction showed a trend of increasing first and then decreasing with increasing size ofsolid particulates, the lower limit of stagnation-sensitive size ranges is reduced, and the contaminatedfriction is less than standard morphology spool under the condition of the solid particulates is 0.9 timesthe size of clearance.
Compared with the fit clearance of standard morphology spool, the cis-conical spool fit clearancehas a larger inlet and smaller outlet. For the cis-conical spool, on the one hand, the smaller clearanceoutlet gives small size particulates greater opportunity to occur the tri-contact and generate friction,which reduces the lower limit of stagnation-sensitive size range compared to the standard morphologyspool. On the other hand, the sensitive size particulates in the working medium are easier to enterinto clearance of cis-conical spool and cause the amount of particulates rising that increase the frictiondirectly. The reasons for the lower limit reducing in stagnation-sensitive size of invert cone spool arethe same as cis-conical spool: the 0.9 times the size of clearance can be regarded as an inverted conespool inlet and the small particulates in the sensitive size do not easily enter the clearance thus thefriction is smaller.
It is found that the conical spools increase the contact between small size solid particulates andthe clearance matching surface, increasing the friction of spools in the sensitive size range comparedto the standard spool; therefore, the conical spool has been an important factor in aggravating theclamping stagnation of spool movement.
Appl. Sci. 2019, 9, 5230 13 of 14
5. Conclusions
(1) The contaminated friction of spool has the characteristics of pulsation.(2) The sensitive size range for stagnation of solid particulates is 0.7 to 0.9 times the size of clearance.(3) Compared with the standard morphology of spool, the contaminated friction of rough spool has
the same trend with particulates size, but the contaminated friction increases within the sensitivesize range.
(4) Compared with the standard morphology of spool, the lower limit of sensitive size range in theconical spools decreases, and the contaminated friction of cis-conical spool shows an increasingtrend, whereas the contaminated friction of inverted cone spool shows a trend of increasing firstand then decreasing
Author Contributions: H.J. conceived the research; S.F. achieved the principle design and completed model tests;S.F. and R.X. wrote the paper together; S.Y. and Q.Y. performed the arrangement and analysis; H.J. criticallyrevised the paper and provided many valuable and constructive suggestions.
Funding: This research is funded by the National Natural Science Foundation of China (Grant No. 51575254).
Conflicts of Interest: The authors declare no conflicts of interest.
References
1. Wang, Z.L. Research and Analysis on Valve Element Clutch of Hydraulic Diverter Valve. Master’s Thesis,Jilin University, Changchun, China, 2005.
2. Wang, A.L.; Dong, Y.N.; Zhou, P.J.; Wu, X.-F.; Zhou, C.-L. Robust design method for the seizure problem ofhydraulic slide valve. J. Shanghai Jiaotong Univ. 2011, 45, 1637–1642.
3. Kandlikar, S.G.; Schmitt, D.; Carrano, A.L.; Taylor, J.B. Characterization of surface roughness effects onpressure drop in single-phase flow in minichannels. Phys. Fluids 2005, 17, 100606. [CrossRef]
4. Yaobao, Y.; Jiayang, Y.; Shengrong, G. Numerical study of solid particle erosion in hydraulic spools. Wear2017, 392, 174–189. [CrossRef]
5. Terrell, E.J.; Higgs, C.F., III. A modeling approach for predicting the abrasive particle motion during chemicalmechanical polishing. J. Tribol. 2007, 129, 933–941. [CrossRef]
6. Dharaiya, V.V.; Kandlikar, S.G. A numerical study on the effects of 2d structured sinusoidal elements on fluidflow and heat transfer at microscale. Int. J. Heat Mass Transf. 2013, 57, 190–201. [CrossRef]
7. Weilin, Q.; Mala, G.M.; Dongqing, L. Pressure-driven water flows in trapezoidal silicon microchannels. Int. J.Heat Mass Transf. 2000, 43, 353–364. [CrossRef]
8. Zheng, C.S.; Ge, P.F.; Li, Y.H. Contaminant Lock Force and Filter Cake Forming Mechanism of HydraulicSpools Valves. Lubr. Eng. 2014, 39, 14–19.
9. Ge, P.F.; Zheng, C.S.; Ma, B. Study on the Contamination Wear Failure of Hydraulic Valve and the InfluencingFactors. Acta Armament. 2014, 35, 298–304.
10. Xi, H.; Xu, H.Q.; Tang, R.M. Experimental study of the flow in the gap of needle valve. J. Tsinghua Univ. Sci.Tech. 2001, 41, 68–70.
11. Feng, Y.B.; Sun, F.; Wang, H. Research on Particle Distribution in Valve Chamber and Clearance of ServoSpool. Lubr. Eng. 2016, 41, 60–64.
12. Inoue, R. Contaminant Lock in Spool Type Directional Control Valves-Theory and Experimental Verification.BFPR J. 1980, 13, 167–171.
13. Jiang, G.J.; Yin, C.B.; Jia, W.H. Study on the Effect of Spool’s Microscopic Surface on Micro-flow in Valve gap.Lubr. Eng. 2011, 36, 68–71.
14. Feng, Z.-G.; Michaelides, E.E. Heat transfer in particulate flows with direct numerical simulation (DNS).Int. J. Heat Mass Transf. 2009, 52, 777–786. [CrossRef]
15. Mittal, R.; Iaccarino, G. Immersed boundary methods. Annu. Rev. Fluid Mech. 2005, 37, 239–261. [CrossRef]16. Heltai, L.; Costanzo, F. Variational implementation of immersed finite element methods. Comput. Methods
Appl. Mech. Eng. 2012, 229–232, 110–127. [CrossRef]17. Feng, Z.G.; Huh, H.; Joseph, D.D. Direct simulation of initial value problems for the motion of solid bodies
in a Newtonian fluid Part 1. Sedimentation. J. Fluid Mech. 1994, 261, 95–134. [CrossRef]
18. Cundall, P.A.; Strack, O.D.L. A discrete numerical model for granular assemblies. Geotechnique 1979, 29,47–65. [CrossRef]
19. Khandaker, I.; Glavas, E.; Jones, G.R. A fibre-optic oil condition monitor based on chromatic modulation.Meas. Sci. Technol. 1993, 4, 608. [CrossRef]
20. Kwon, K.O.; Kong, S.H.; Han, H.G.; Yoon, E.-S.; Myshkin, N.K.; Markova, L.V.; Semeniouk, M.S. On-LineMeasurement of Contaminant Level in Lubricating Oil. U.S. Patent 6,151,108[P], 21 November 2000.
21. Edmonds, J.; Resner, M.S.; Shkarlet, K. Detection of Precursor Wear Debris in Lubrication Systems.In Proceedings of the 2000 IEEE Aerospace Conference Proceedings (Cat No 00TH8484), Big Sky, MT,USA, 25 March 2000; IEEE: Anchorage, AK, USA, 2000; pp. 73–77.
22. Chen, Q.; Ji, H.; Zhu, Y.; Yang, X. Proposal for optimization of spool valve flow force based on theMATLAB-AMESim-FLUENT joint simulation method. IEEE Access 2018, 6, 33148–33158.
23. Singh, M.; Lathkar, G.S.; Basu, S.K. Failure Prevention of Hydraulic System Based on Oil Contamination.J. Inst. Eng. India Ser. C 2012, 93, 269–274. [CrossRef]
24. Zhang, H.P.; Huang, W.; Zhang, Y.D.; Shen, Y.; Li, D.Q. Design of the Microfluidic Chip of Oil Detection.Appl. Mech. Mater. 2011, 117–119, 517–520. [CrossRef]
25. Murali, S.; Xia, X.; Jagtiani, A.V.; Carletta, J.; Zhe, J. Capacitive Coulter Counting: Detection of Metal WearParticles in Lubricant Using a Microfluidic Device. Smart Mater. Struct. 2009, 18, 037001. [CrossRef]
26. Yang, X.J. Theoretical and Experimental Equipment Research on the Influence of Solid Particle Impurities onPiston Ring-Cylinder Liner Lubrication and Wear. Ph.D. Thesis, Zhejiang University, Hangzhou, China,2005; pp. 21–50.


![Experimental study of friction in aluminium bolted joints Experimental study of friction in aluminium bolted joints D . Croccolo 1,a, M . De Agostinis 1, N . ... Motosh [7] and VDI2230](https://static.documents.pub/doc/80x56/5b9967e509d3f29c338c3f23/experimental-study-of-friction-in-aluminium-bolted-joints-experimental-study-of.jpg)


