Experimental micro-mechanics of granular media studied by x-ray tomography: recent results and challenges E. ANDO ` *, G. VIGGIANI*, S. A. HALL { and J. DESRUES* Combining x-ray tomography and three-dimensional (3D) image analysis has finally opened the way for experimental micro-(geo)mechanics, allowing access to different scales of interest. When these correspond to a scale that has been imaged at high spatial resolution, high-quality measurements can be obtained (e.g. 3D displacements and rotations of individual grains of sand sample under load). However, there are issues when the scale of interest is smaller, for example the characterisation of grain-to-grain contacts (their orientations and evolution) or production of fines by grain breakage. This paper presents a short selection of new grain-scale measurements obtained using existing techniques. The challenges associated with smaller scale measurements on the same images are also discussed through a few examples from ongoing work. KEYWORDS: laboratory tests; sands; strain localisation ICE Publishing: all rights reserved INTRODUCTION When modelling grain-scale phenomena such as shear banding, standard continuum approaches are well known to have difficulties. Discrete element models are a valid alternative and have allowed insights to be gained into grain-scale behaviour of particulate matter, through simulations with simple interaction laws between the particles. However, fundamentally, these remain simula- tions and consequently require experimental observations at the grain scale for validation. X-ray tomography has been successfully used to image small specimens of sand, subjected to triaxial compression, in various different states of loading (e.g. Alshibli & Alramahi, 2006; Matsushima et al., 2010; Ando ` et al., 2012a, 2012b). When imaging a given assembly of particles with a fixed-resolution detector, a trade-off must be made between the detail with which the particles are imaged and the number of particles imaged. Mechanical representivity demands a sufficiently large number of particles, whereas a precise three-dimensional (3D) description of each grain requires a small specimen. The specimens in this work were composed of around 50 000 grains (with a D 50 of around 400 mm), which allows individual grains to be imaged (with around 5000 voxels per grain) and therefore successfully tracked throughout a test. However, there are related issues where imaging is ideally desired at a smaller scale – such as the characterisa- tion of grain-to-grain contacts (orientations and evolution) or the production of fines by grain breakage. In this paper, new observations of grain-scale kinematics are briefly presented and the considerable challenges associated with smaller scale measurements (mentioned above) on the same images are discussed using a few examples from ongoing work. The philosophy adopted in this paper is that of making mechanically representative measurements rather than a high-detail characterisation of single occurrences of small-scale mechanisms; the long-term objectives are not to characterise breakage or contact orientations on a few grains, but rather to make quantitative measurements of breakage on a meaningful number of grains in order to statistically relate this quantity to macro-behaviour. The objective of this letter is therefore not to present major findings, but to discuss a general point. In doing so, some challenges and possible solutions are discussed that might make a significant impact on current understanding of the behaviour of granular materials. EXISTING TECHNIQUES AND RESULTS Triaxial compression tests on dense specimens of dry sand performed inside the x-ray scanner in Laboratoire 3SR (Fig. 1) allow specimens to be scanned at key points during the test. Since the objective of this work is to image each individual grain, the specimen size is considerably less than standard (22 mm height, 11 mm diameter). Further details on the experimental apparatus and procedures are reported by Ando ` (2013). A 3D image of x-ray attenuation in the scanned domain is obtained each time the specimen is scanned. A variety of image analysis techniques have been developed to identify and measure individual grains in these 3D images. Very simply, these methods require the reliable identification of the inside of each grain by a marker, and the markers are then expanded to occupy all the grain volume by the watershed algorithm implemented in Noesis’ Visilog 6.910, based on the work of Beucher (1991). When these procedures are applied to several different images from a test, ID-Track (see Ando ` et al., 2012a) is used to follow the grains. This paves the way for measurements of the 3D displacement (by following each grain’s centre of mass). The measurement of each grain’s 3D rotation presents more of a challenge, which has been met by developing a hybrid ID-Track and digital image correlation (Ando ` et al., 2012b). These grain-based measurement tools are extremely powerful in that they allow micro-scale explanations of macro-scale responses. As an example, Fig. 2 shows the micro-mechanisms at play in the macroscopic residual Manuscript received 28 March 2013; first decision 13 May 2013; accepted 4 August 2013. Published online at www.geotechniqueletters.com on 4 September 2013. *Grenoble-INP/UJF-Grenoble 1/CNRS UMR 5521, Laboratoire 3SR, Grenoble, France {Division of Solid Mechanics, Lund University, Lund, Sweden; European Spallation Source AB, Lund, Sweden Ando ` , E. et al. (2013) Ge ´ otechnique Letters 3, 142–146 http://dx.doi.org/10.1680/geolett.13.00036 142
Transcript
Experimental micro-mechanics of granular media studied by x-raytomography: recent results and challenges
E. ANDO*, G. VIGGIANI*, S. A. HALL{ and J. DESRUES*
Combining x-ray tomography and three-dimensional (3D) image analysis has finally opened the wayfor experimental micro-(geo)mechanics, allowing access to different scales of interest. When thesecorrespond to a scale that has been imaged at high spatial resolution, high-quality measurementscan be obtained (e.g. 3D displacements and rotations of individual grains of sand sample under load).However, there are issues when the scale of interest is smaller, for example the characterisation ofgrain-to-grain contacts (their orientations and evolution) or production of fines by grain breakage.This paper presents a short selection of new grain-scale measurements obtained using existingtechniques. The challenges associated with smaller scale measurements on the same images arealso discussed through a few examples from ongoing work.
INTRODUCTIONWhen modelling grain-scale phenomena such as shearbanding, standard continuum approaches are well knownto have difficulties. Discrete element models are a validalternative and have allowed insights to be gained intograin-scale behaviour of particulate matter, throughsimulations with simple interaction laws between theparticles. However, fundamentally, these remain simula-tions and consequently require experimental observationsat the grain scale for validation. X-ray tomography hasbeen successfully used to image small specimens of sand,subjected to triaxial compression, in various different statesof loading (e.g. Alshibli & Alramahi, 2006; Matsushimaet al., 2010; Ando et al., 2012a, 2012b). When imaging agiven assembly of particles with a fixed-resolution detector,a trade-off must be made between the detail with which theparticles are imaged and the number of particles imaged.Mechanical representivity demands a sufficiently largenumber of particles, whereas a precise three-dimensional(3D) description of each grain requires a small specimen.
The specimens in this work were composed of around50 000 grains (with a D50 of around 400 mm), which allowsindividual grains to be imaged (with around 5000 voxelsper grain) and therefore successfully tracked throughout atest. However, there are related issues where imaging isideally desired at a smaller scale – such as the characterisa-tion of grain-to-grain contacts (orientations and evolution)or the production of fines by grain breakage. In this paper,new observations of grain-scale kinematics are brieflypresented and the considerable challenges associated withsmaller scale measurements (mentioned above) on the sameimages are discussed using a few examples from ongoingwork. The philosophy adopted in this paper is that ofmaking mechanically representative measurements rather
than a high-detail characterisation of single occurrences ofsmall-scale mechanisms; the long-term objectives are not tocharacterise breakage or contact orientations on a fewgrains, but rather to make quantitative measurements ofbreakage on a meaningful number of grains in order tostatistically relate this quantity to macro-behaviour. Theobjective of this letter is therefore not to present majorfindings, but to discuss a general point. In doing so, somechallenges and possible solutions are discussed that mightmake a significant impact on current understanding of thebehaviour of granular materials.
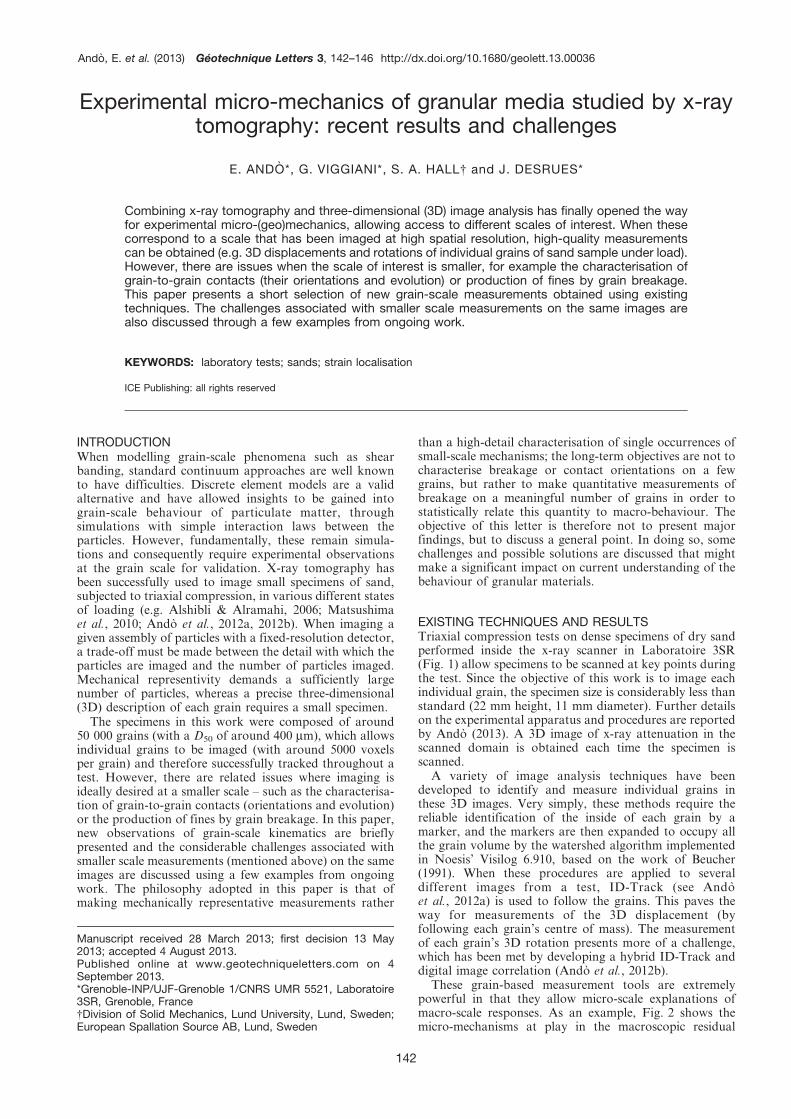
EXISTING TECHNIQUES AND RESULTSTriaxial compression tests on dense specimens of dry sandperformed inside the x-ray scanner in Laboratoire 3SR(Fig. 1) allow specimens to be scanned at key points duringthe test. Since the objective of this work is to image eachindividual grain, the specimen size is considerably less thanstandard (22 mm height, 11 mm diameter). Further detailson the experimental apparatus and procedures are reportedby Ando (2013). A 3D image of x-ray attenuation in thescanned domain is obtained each time the specimen isscanned.
A variety of image analysis techniques have beendeveloped to identify and measure individual grains inthese 3D images. Very simply, these methods require thereliable identification of the inside of each grain by amarker, and the markers are then expanded to occupy allthe grain volume by the watershed algorithm implementedin Noesis’ Visilog 6.910, based on the work of Beucher(1991). When these procedures are applied to severaldifferent images from a test, ID-Track (see Andoet al., 2012a) is used to follow the grains. This paves theway for measurements of the 3D displacement (byfollowing each grain’s centre of mass). The measurementof each grain’s 3D rotation presents more of a challenge,which has been met by developing a hybrid ID-Track anddigital image correlation (Ando et al., 2012b).
These grain-based measurement tools are extremelypowerful in that they allow micro-scale explanations ofmacro-scale responses. As an example, Fig. 2 shows themicro-mechanisms at play in the macroscopic residual
Manuscript received 28 March 2013; first decision 13 May2013; accepted 4 August 2013.Published online at www.geotechniqueletters.com on 4September 2013.*Grenoble-INP/UJF-Grenoble 1/CNRS UMR 5521, Laboratoire3SR, Grenoble, France{Division of Solid Mechanics, Lund University, Lund, Sweden;European Spallation Source AB, Lund, Sweden
Ando, E. et al. (2013) Geotechnique Letters 3, 142–146 http://dx.doi.org/10.1680/geolett.13.00036
142
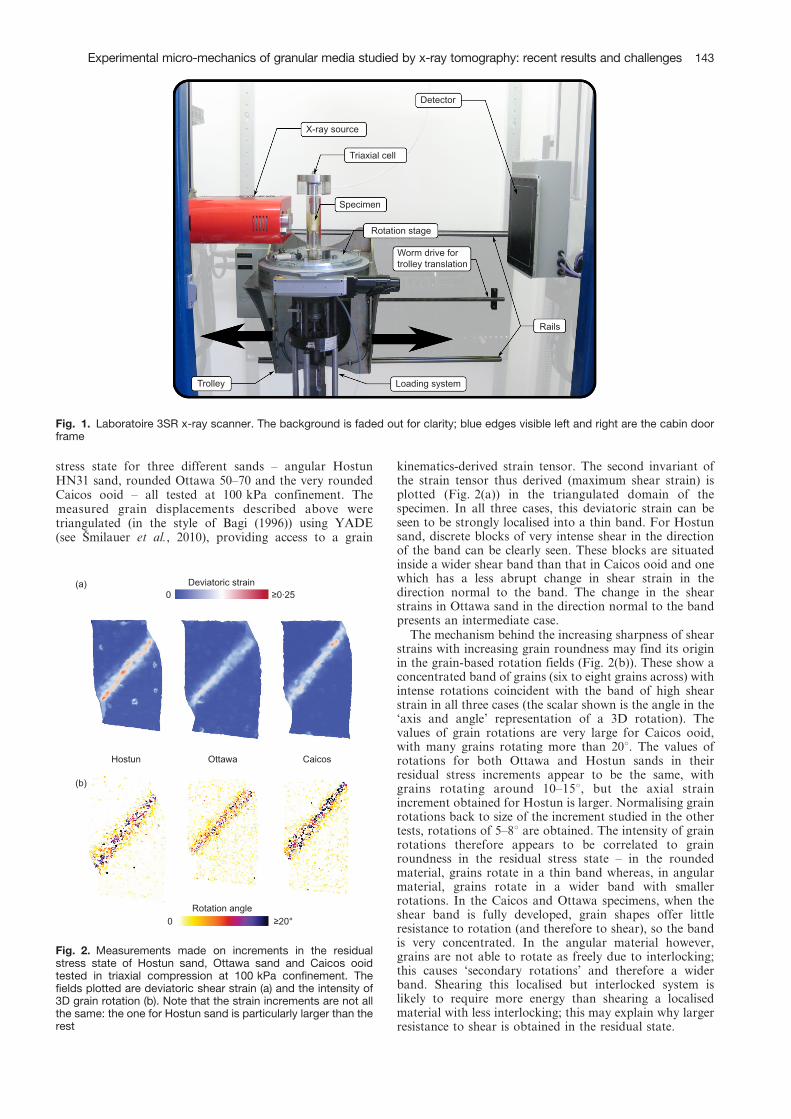
stress state for three different sands – angular HostunHN31 sand, rounded Ottawa 50–70 and the very roundedCaicos ooid – all tested at 100 kPa confinement. Themeasured grain displacements described above weretriangulated (in the style of Bagi (1996)) using YADE(see Smilauer et al., 2010), providing access to a grain
kinematics-derived strain tensor. The second invariant ofthe strain tensor thus derived (maximum shear strain) isplotted (Fig. 2(a)) in the triangulated domain of thespecimen. In all three cases, this deviatoric strain can beseen to be strongly localised into a thin band. For Hostunsand, discrete blocks of very intense shear in the directionof the band can be clearly seen. These blocks are situatedinside a wider shear band than that in Caicos ooid and onewhich has a less abrupt change in shear strain in thedirection normal to the band. The change in the shearstrains in Ottawa sand in the direction normal to the bandpresents an intermediate case.
The mechanism behind the increasing sharpness of shearstrains with increasing grain roundness may find its originin the grain-based rotation fields (Fig. 2(b)). These show aconcentrated band of grains (six to eight grains across) withintense rotations coincident with the band of high shearstrain in all three cases (the scalar shown is the angle in the‘axis and angle’ representation of a 3D rotation). Thevalues of grain rotations are very large for Caicos ooid,with many grains rotating more than 20u. The values ofrotations for both Ottawa and Hostun sands in theirresidual stress increments appear to be the same, withgrains rotating around 10–15u, but the axial strainincrement obtained for Hostun is larger. Normalising grainrotations back to size of the increment studied in the othertests, rotations of 5–8u are obtained. The intensity of grainrotations therefore appears to be correlated to grainroundness in the residual stress state – in the roundedmaterial, grains rotate in a thin band whereas, in angularmaterial, grains rotate in a wider band with smallerrotations. In the Caicos and Ottawa specimens, when theshear band is fully developed, grain shapes offer littleresistance to rotation (and therefore to shear), so the bandis very concentrated. In the angular material however,grains are not able to rotate as freely due to interlocking;this causes ‘secondary rotations’ and therefore a widerband. Shearing this localised but interlocked system islikely to require more energy than shearing a localisedmaterial with less interlocking; this may explain why largerresistance to shear is obtained in the residual state.
X-ray source
Triaxial cell
Detector
Specimen
Rotation stage
Worm drive fortrolley translation
Rails
Loading systemTrolley
Fig. 1. Laboratoire 3SR x-ray scanner. The background is faded out for clarity; blue edges visible left and right are the cabin doorframe
Deviatoric strain
Rotation angle
Hostun Ottawa Caicos
0(a)
(b)
0
≥0.25
≥20°
Fig. 2. Measurements made on increments in the residualstress state of Hostun sand, Ottawa sand and Caicos ooidtested in triaxial compression at 100 kPa confinement. Thefields plotted are deviatoric shear strain (a) and the intensity of3D grain rotation (b). Note that the strain increments are not allthe same: the one for Hostun sand is particularly larger than therest
Experimental micro-mechanics of granular media studied by x-ray tomography: recent results and challenges 143
It should be noted that the free-end platen at the bottomof all specimens in Fig. 2 tilts visibly with increasingdeformation (this is even more striking in Fig. 5).Obviously, the specimen’s overall response depends onthese boundary conditions: not allowing rotation of thebottom platen (which is the alternative conventionalboundary condition) would give a different specimenresponse; however, this is a completely different conceptto that of material response and would only be a source ofconcern in the absence of the full-field informationpresented (i.e. in conventional testing).
CHALLENGESContact characterisationA full micro-mechanical description of the kinematicsoccurring at the grain scale needs to go beyond grainkinematics (i.e. the rotations and displacements of grainsshown in the previous section). In particular, it requires thecharacterisation of contact kinematics (the gain or loss ofcontacts and the orientation of those contacts) duringdeformation. In the work described thus far, the materialwas imaged at a resolution sufficient to resolve individualgrains but not the details of the surface of each grain –these are visible in Fig. 3(b), which shows a voxelatedimage of a single Caicos ooid. When contacts between suchvoxelated objects are characterised using relatively stan-dard image processing tools, the lack of detail at eachcontact surface will inevitably result in extremely biasedmeasurements (see Ando et al. (2012b)). Figures 3(a) and3(c) illustrate this challenge for 3D images of glass ballotiniand Hostun sand, respectively.
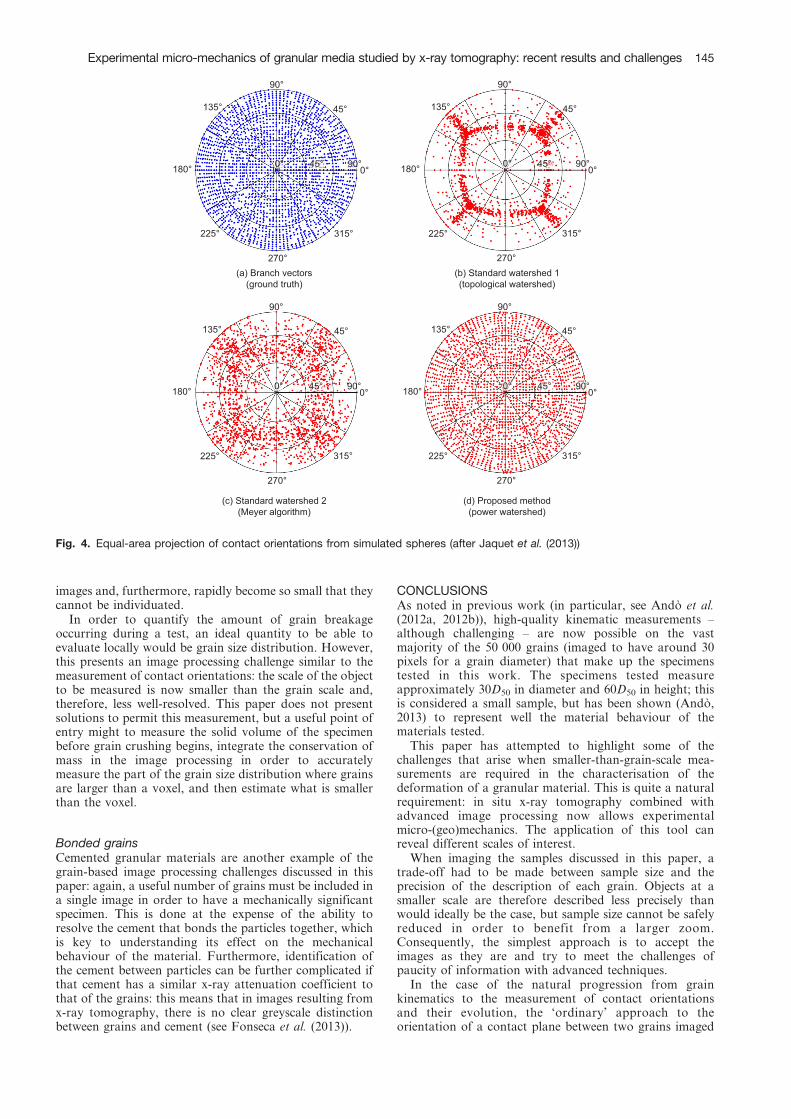
When the solid phase of a 3D image is to be split intoindividual grains, a separation surface between each grainmust be defined in some way in order to isolate individualgrains – this is currently obtained using a classicalwatershed algorithm (using a Euclidean distance map). Itis tempting to consider the voxels defining the separationsurfaces directly as a volumetric representation (of unitthickness) of a contact. However, Fig. 3(a) and Fig. 3(c)underline how small the contact areas can be in theseimages (i.e. how few voxels are used in the definition of theseparation surface). The orientations of these separationsurfaces are highly dependent on the particular watershedimplementation used (and, furthermore, are highly biased)and therefore cannot be considered accurate. This is clearlyvisible in Fig. 4, where the contacts between a series of
automatically generated touching spheres are analysed.Figure 4(a) shows the orientation of the contacts asobtained from the branch vectors (i.e. the vectors connect-ing the centres of the two spheres in contact – this is the‘exact’ distribution since, in the special case of spheres,contact orientation and branch vector coincide). It is clearthat the ‘measured’ orientation distributions coming fromclassical watershed approaches (Fig. 4(b) and Fig. 4(c)) areboth highly biased and substantially different from eachother (reproducing an error already noted by Ando et al.(2012b)). More importantly, they are both a long way fromthe known distribution of orientations (Fig. 4(a)).
When a mechanically representative set of grains isimaged at a given resolution, this appears to cause seriousproblems with measurements of features at a smaller scale –in this case the local surface of the grains, which shouldyield the critically important information of contactorientation. Given the importance of this measurement,considerable efforts have been made in this direction.Recent work has involved the deployment of much moreadvanced techniques, whose results are shown in Fig. 4(d)for the case studied above. The technique is currentlyimplemented on a ‘per contact’ basis (i.e. treating one pairof grains at a time). Starting from markers well inside thegrains, it assigns – for each voxel of the solid phase – theprobability of belonging to either marker using a powerwatershed. The contact plane is then estimated with sub-voxel precision by estimating the equal-probability isosur-face between the two grains. Despite the considerablecomputational cost of this approach, it gives high-qualityresults that are extremely encouraging; Jaquet et al. (2013)present further details of the implementation.
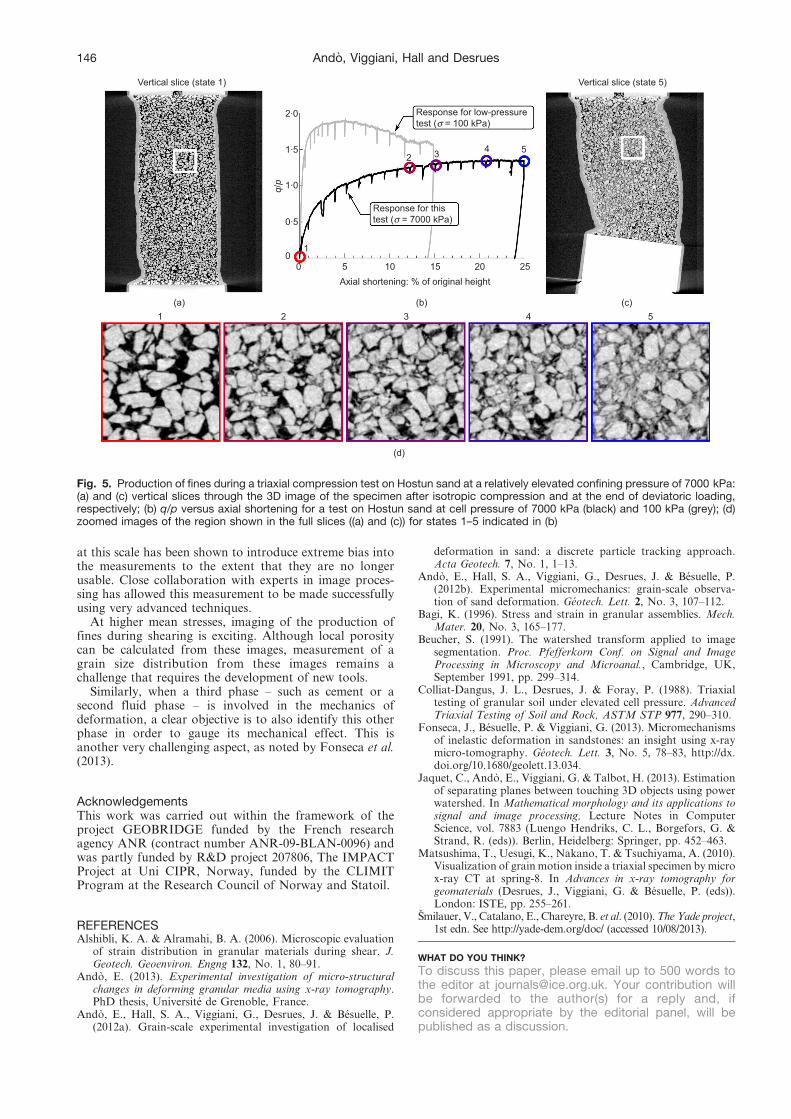
Grain breakageGrain breakage is another grain-scale phenomenon, and isresponsible for the difference between the low- and high-pressure behaviour of sands. Several triaxial compressiontests (up to the maximum cell pressure of 7000 kPa) wererecently performed on Hostun HN31 sand with in situ x-ray scanning. The axial stress response of the specimentested at 7000 kPa cell pressure (shown as a plot of q/pagainst axial shortening of the specimen in Fig. 5(b)) isconsiderably different from the response of the samematerial at 100 kPa cell pressure (the other test onHostun sand discussed above, and also shown inFig. 5(b)). The qualitative change in the axial stressresponse between 100 and 7000 kPa is confirmed by thehigh-pressure triaxial tests performed on the same materialby Colliat-Dangus et al. (1988).
Figure 5 shows the micro-mechanisms occurring at highpressure, which go a long way to explaining the differencein the behaviour of this material at a higher mean stress:grain breakage can be seen to occur on a very large scale asthe specimen is sheared. Figure 5(d)) follows a grain and itsneighbours through five different states in the high-pressure test. These pictures show the grain in the centreof the image first cracking in two (with a vertical crack,images 2 and 3) and then being progressively broken intosmaller pieces (images 4 and 5). These images suggest theprogressive evolution of the specimen’s grain size distribu-tion (the production of fines during shearing): the clearlybinary (i.e. grain and pore) image of state 1 develops intoan image where pores are filled with an intermediate colourgreyscale value representing a porous material – a newmaterial whose grains are smaller than the voxel size. Toolssuch as ID-Track are clearly no longer relevant in this casesince the grains are no longer persistent objects in the
Contacting grains 2D Single 3D grain
(a) (b) (c)
Contacting grains 3D
Contacting grains 2D
Contacting grains 3D
Fig. 3. (a) Two-dimensional (2D) and 3D views of two glassballotini in contact (these particles are close to spheres). (b) 3Dview of a single Caicos ooid, with its jagged, voxelised natureunderlined (courtesy of J. Andrade). (c) 2D and 3D views of twoHostun sand grains in contact
144 Ando, Viggiani, Hall and Desrues
images and, furthermore, rapidly become so small that theycannot be individuated.
In order to quantify the amount of grain breakageoccurring during a test, an ideal quantity to be able toevaluate locally would be grain size distribution. However,this presents an image processing challenge similar to themeasurement of contact orientations: the scale of the objectto be measured is now smaller than the grain scale and,therefore, less well-resolved. This paper does not presentsolutions to permit this measurement, but a useful point ofentry might to measure the solid volume of the specimenbefore grain crushing begins, integrate the conservation ofmass in the image processing in order to accuratelymeasure the part of the grain size distribution where grainsare larger than a voxel, and then estimate what is smallerthan the voxel.
Bonded grainsCemented granular materials are another example of thegrain-based image processing challenges discussed in thispaper: again, a useful number of grains must be included ina single image in order to have a mechanically significantspecimen. This is done at the expense of the ability toresolve the cement that bonds the particles together, whichis key to understanding its effect on the mechanicalbehaviour of the material. Furthermore, identification ofthe cement between particles can be further complicated ifthat cement has a similar x-ray attenuation coefficient tothat of the grains: this means that in images resulting fromx-ray tomography, there is no clear greyscale distinctionbetween grains and cement (see Fonseca et al. (2013)).
CONCLUSIONSAs noted in previous work (in particular, see Ando et al.(2012a, 2012b)), high-quality kinematic measurements –although challenging – are now possible on the vastmajority of the 50 000 grains (imaged to have around 30pixels for a grain diameter) that make up the specimenstested in this work. The specimens tested measureapproximately 30D50 in diameter and 60D50 in height; thisis considered a small sample, but has been shown (Ando,2013) to represent well the material behaviour of thematerials tested.
This paper has attempted to highlight some of thechallenges that arise when smaller-than-grain-scale mea-surements are required in the characterisation of thedeformation of a granular material. This is quite a naturalrequirement: in situ x-ray tomography combined withadvanced image processing now allows experimentalmicro-(geo)mechanics. The application of this tool canreveal different scales of interest.
When imaging the samples discussed in this paper, atrade-off had to be made between sample size and theprecision of the description of each grain. Objects at asmaller scale are therefore described less precisely thanwould ideally be the case, but sample size cannot be safelyreduced in order to benefit from a larger zoom.Consequently, the simplest approach is to accept theimages as they are and try to meet the challenges ofpaucity of information with advanced techniques.
In the case of the natural progression from grainkinematics to the measurement of contact orientationsand their evolution, the ‘ordinary’ approach to theorientation of a contact plane between two grains imaged
135°
90°
45°
90°45°0°
0°
315°
270°(a) Branch vectors
(ground truth)
(c) Standard watershed 2(Meyer algorithm)
(d) Proposed method(power watershed)
(b) Standard watershed 1(topological watershed)
180°
225°
225° 225°
135°
90°
90°45°
45°
0°0°
315°
270°
180°
135°
90°
90°45°
45°
0°0°
315°
270°
180°
225°
135°
90°
90°45°
45°
0°0°
315°
270°
180°
Fig. 4. Equal-area projection of contact orientations from simulated spheres (after Jaquet et al. (2013))
Experimental micro-mechanics of granular media studied by x-ray tomography: recent results and challenges 145
at this scale has been shown to introduce extreme bias intothe measurements to the extent that they are no longerusable. Close collaboration with experts in image proces-sing has allowed this measurement to be made successfullyusing very advanced techniques.
At higher mean stresses, imaging of the production offines during shearing is exciting. Although local porositycan be calculated from these images, measurement of agrain size distribution from these images remains achallenge that requires the development of new tools.
Similarly, when a third phase – such as cement or asecond fluid phase – is involved in the mechanics ofdeformation, a clear objective is to also identify this otherphase in order to gauge its mechanical effect. This isanother very challenging aspect, as noted by Fonseca et al.(2013).
AcknowledgementsThis work was carried out within the framework of theproject GEOBRIDGE funded by the French researchagency ANR (contract number ANR-09-BLAN-0096) andwas partly funded by R&D project 207806, The IMPACTProject at Uni CIPR, Norway, funded by the CLIMITProgram at the Research Council of Norway and Statoil.
REFERENCESAlshibli, K. A. & Alramahi, B. A. (2006). Microscopic evaluation
of strain distribution in granular materials during shear. J.Geotech. Geoenviron. Engng 132, No. 1, 80–91.
Ando, E. (2013). Experimental investigation of micro-structuralchanges in deforming granular media using x-ray tomography.PhD thesis, Universite de Grenoble, France.
Ando, E., Hall, S. A., Viggiani, G., Desrues, J. & Besuelle, P.(2012a). Grain-scale experimental investigation of localised
deformation in sand: a discrete particle tracking approach.Acta Geotech. 7, No. 1, 1–13.
Ando, E., Hall, S. A., Viggiani, G., Desrues, J. & Besuelle, P.(2012b). Experimental micromechanics: grain-scale observa-tion of sand deformation. Geotech. Lett. 2, No. 3, 107–112.
Bagi, K. (1996). Stress and strain in granular assemblies. Mech.Mater. 20, No. 3, 165–177.
Beucher, S. (1991). The watershed transform applied to imagesegmentation. Proc. Pfefferkorn Conf. on Signal and ImageProcessing in Microscopy and Microanal., Cambridge, UK,September 1991, pp. 299–314.
Colliat-Dangus, J. L., Desrues, J. & Foray, P. (1988). Triaxialtesting of granular soil under elevated cell pressure. AdvancedTriaxial Testing of Soil and Rock, ASTM STP 977, 290–310.
Fonseca, J., Besuelle, P. & Viggiani, G. (2013). Micromechanismsof inelastic deformation in sandstones: an insight using x-raymicro-tomography. Geotech. Lett. 3, No. 5, 78–83, http://dx.doi.org/10.1680/geolett.13.034.
Jaquet, C., Ando, E., Viggiani, G. & Talbot, H. (2013). Estimationof separating planes between touching 3D objects using powerwatershed. In Mathematical morphology and its applications tosignal and image processing, Lecture Notes in ComputerScience, vol. 7883 (Luengo Hendriks, C. L., Borgefors, G. &Strand, R. (eds)). Berlin, Heidelberg: Springer, pp. 452–463.
Matsushima, T., Uesugi, K., Nakano, T. & Tsuchiyama, A. (2010).Visualization of grain motion inside a triaxial specimen by microx-ray CT at spring-8. In Advances in x-ray tomography forgeomaterials (Desrues, J., Viggiani, G. & Besuelle, P. (eds)).London: ISTE, pp. 255–261.
Smilauer, V., Catalano, E., Chareyre, B. et al. (2010). The Yade project,1st edn. See http://yade-dem.org/doc/ (accessed 10/08/2013).
WHAT DO YOU THINK?
To discuss this paper, please email up to 500 words tothe editor at [email protected]. Your contribution willbe forwarded to the author(s) for a reply and, ifconsidered appropriate by the editorial panel, will bepublished as a discussion.
(b) (a)
Vertical slice (state 1)
2.0
1.5
q/p 1.0
0.5
01
1 2 3 4 5
2 3 4 5
0 5 10
Response for thistest (σ = 7000 kPa)
Response for low-pressuretest (σ = 100 kPa)
Axial shortening: % of original height15 20 25
Vertical slice (state 5)
(c)
(d)
Fig. 5. Production of fines during a triaxial compression test on Hostun sand at a relatively elevated confining pressure of 7000 kPa:(a) and (c) vertical slices through the 3D image of the specimen after isotropic compression and at the end of deviatoric loading,respectively; (b) q/p versus axial shortening for a test on Hostun sand at cell pressure of 7000 kPa (black) and 100 kPa (grey); (d)zoomed images of the region shown in the full slices ((a) and (c)) for states 1–5 indicated in (b)


![Insights into granular mechanics through neutron scattering · series investigation of the development of stress within a granular system over a loading cycle [9], measurement of](https://static.documents.pub/doc/80x56/5f2da616c4f06242854bee60/insights-into-granular-mechanics-through-neutron-scattering-series-investigation.jpg)


![Kinematic model for quasi static granular displacements … · International Journal of Rock Mechanics & Mining Sciences ] (]]]]) ]]]–]]] Kinematic model for quasi static granular](https://static.documents.pub/doc/80x56/5ba61e9b09d3f22c448b7cff/kinematic-model-for-quasi-static-granular-displacements-international-journal.jpg)


