Page 1
Experimental Observations of Detonation in
Ammonium-Nitrate-Fuel-Oil (ANFO)
Surrounded by a High-Sound-Speed,
Shockless, Aluminum Confiner
Scott I. Jackson, Charles B. Kiyanda, and Mark Short
Shock and Detonation Physics Group, Dynamic and Energetic Materials Division
Los Alamos National Laboratory, Los Alamos, NM 87545 USA
Abstract
Detonations in explosive mixtures of ammonium-nitrate-fuel-oil (ANFO) confined
by aluminum allow for transport of detonation energy ahead of the detonation front
due to the aluminum sound speed exceeding the detonation velocity. The net effect
of this energy transport on the detonation is unclear. It could enhance the detona-
tion by precompressing the explosive near the wall. Alternatively, it could decrease
the explosive performance by crushing porosity required for initiation by shock
compression or destroying confinement ahead of the detonation. At present, these
phenomena are not well understood. But with slowly detonating, non-ideal high ex-
plosive (NIHE) systems becoming increasing prevalent, proper understanding and
prediction of the performance of these metal-confined NIHE systems is desirable.
Experiments are discussed that measured the effect of ANFO detonation energy
transported upstream of the front by a 76-mm-inner-diameter aluminum confin-
ing tube. Detonation velocity, detonation-front shape, and aluminum response are
recorded as a function of confiner wall thickness and length. Detonation shape pro-
1
Preprint of http://dx.doi.org/10.1016/j.proci.2010.07.084
Page 2
files display little curvature near the confining surface, which is attributed to energy
transported upstream modifying the flow. Average detonation velocities were seen
to increase with increasing confiner thickness, while wavefront curvature decreased
due to the stiffer, subsonic confinement. Significant radial sidewall tube motion
was observed immediately ahead of the detonation. Axial motion was also detected,
which interfered with the front shape measurements in some cases. It was concluded
that the confiner was able to transport energy ahead of the detonation and that
this transport has a definite effect on the detonation by modifying its characteristic
shape.
Key words: detonation, non-ideal explosive, homemade explosive, precursor,
confiner
Topic:
Detonations, Explosions, and Supersonic Combustion
1 Introduction
Accurate prediction of non-ideal high explosive (NIHE) detonation has become a topic of significant
interest in recent years. Non-ideal explosives differ from conventional explosives in that they are
usually high-porosity, low-density materials where the fuel and oxidizer are not mixed on a molecular
level. As a result, NIHEs typically exhibit low detonation velocities. They also have much larger
detonation reaction zones that can be centimeters long, rather than the 100’s of microns associated
with more ideal explosives.
The detonation velocities observed for many NIHEs are typically below the sound speeds of stiff
confining materials, including common metals. This is in contrast to ideal high explosives (HEs),
where the detonation velocity exceeds the sound speed of most confiners. In these ideal HE systems,
the detonation drives a shock into the inert confiner and no information propagation in the confiner
exceeds the detonation velocity. The confiner is only able to influence the detonation by acting on
the reaction zone behind the detonation shock and ahead of the sonic surface. Since the confiner is
shocked and ideal HEs have small reaction zones, this implies that increasing the confiner thickness
2
Preprint of http://dx.doi.org/10.1016/j.proci.2010.07.084
Page 3
above a few reaction zone lengths has no effect on the detonation velocity.
In low-detonation-velocity, stiffly confined systems, no inert shock typically exists in the confinement
since the confiner sound speed exceeds the detonation velocity. This allows the confiner to actually
transport energy from behind the detonation shock upstream to the unreacted explosive. The energy
transmission can both enhance and hinder the detonation by modifying the amount of confinement
it experiences. In some cases, this “precursor energy” will drive the confiner surface into the NIHE,
compressing it. The precompression can densify the NIHE, increasing its detonation velocity [1, 2],
or even igniting it. However, precompression can also crush porosity out of the NIHE, desensitizing
it and leading to detonation failure. The precursor energy can also cause loss of confinement ahead
of the detonation, which can also result in detonation failure [3]. Finally, the large reaction zone
lengths of NIHEs coupled with the subsonic confinement allow for a much greater dependence of
confiner thickness on detonation velocity [4].
These types of wall-explosive phenomena are not typically present in most HE configurations. Our
current level of physical understanding of this interaction prevents accurate modeling of confined
NIHE systems. We seek calibration data for the Detonation Shock Dynamics (DSD) code to resolve
this limitation. DSD is able to model detonation propagation when supplied with two parameters:
the detonation velocity variation versus detonation surface curvature and the detonation edge angle
at the explosive-confiner interface. The velocity-curvature relationship is derived from experimental
rate-stick data. For ideal HEs, the edge angle is found from shock polar analysis [5, 6]. However,
since the confiner flow is shockless and subsonic in NIHEs when the confiner sound speed exceeds
the detonation velocity, alternate methods must be implemented. Experimental measurements are
required for the development of these new techniques.
In this work, we experimentally characterized the interactions between the detonation front, a
stiff confiner, and the unreacted explosive. Ammonium-nitrate-fuel-oil (ANFO) was selected as the
NIHE and aluminum tubes were used as confiners. Experimentally observed ANFO detonation
velocities range from 1.5–4.0 mm/µs depending on the explosive properties, charge size and degree
of confinement [7], while the longitudinal sound speed of aluminum is in excess of 5.0 mm/µs.
Varied parameters included the confiner wall thickness and detonation run length. We measured
3
Preprint of http://dx.doi.org/10.1016/j.proci.2010.07.084
Page 4
the detonation wave speed as well as the velocity and relative strength of the elastic stress wave
that was driven in the metal ahead of the detonation. Detonation front profiles were also recorded
at the end of the tube. Our intent was to identify regimes where the detonation was dramatically
affected by this interaction.
2 Experiment
Three separate experimental configurations were fielded. Our methodology was first to determine
the required booster strength to detonate aluminum-confined ANFO; secondly, to obtain front-shape
and velocity data; and finally, to measure the motion of the confiner during the experiment. All tests
used 76-mm-inner-diameter tubes filled with ANFO mixtures consisting of 94% ammonium nitrate
prills by weight mixed with 6% No. 2 diesel fuel by weight. Porous, industrial-grade ammonium
nitrate was used from Dyno Nobel with a typical bulk density of 0.80 g/cc with the average prill
diameter ranging from 1.4–2.0 mm. Mixing was accomplished by combining the prills and diesel
fuel in a cement mixer and mixing for a minimum of 15 minutes. ANFO was then poured into each
tube in 200-g increments. Each incremental fill was hand-tamped to prevent significant clumping
or void formation. This methodology was sufficient to achieve an ANFO density of 0.86–0.90 g/cc.
2.1 Booster-Strength Evaluation
A series of tests were performed to determine the appropriate strength booster for use in the alu-
minum experiments. Due to the short aspect ratio of the aluminum-confined experiments, which had
length-to-inner-diameter (L/ID) ratios of 4 and 12, it was essential to promptly initiate detonation
without significant overdrive. Little data was available to assist in booster selection. Primasheet
1000, a flexible rubberized explosive composed of 63% PETN, 8% nitrocellulose, and 27% plasti-
cizer, was chosen as the booster explosive. Shocks driven by detonating Primasheet into ANFO were
of sufficient strength to induce chemical reactions; in question was the booster thickness necessary
to support the shock long enough for these reactions to complete and support detonation.
As a conservative measure, PVC tubing was used as the confining material for these scoping ex-
4
Preprint of http://dx.doi.org/10.1016/j.proci.2010.07.084
Page 5
periments since a booster sufficient to initiate PVC-confined ANFO would also initiate ANFO
surrounded by a stiffer aluminum tube. Each PVC tube had a 305-mm length, a 76-mm ID, and a
6.35-mm-thick wall. After filling with ANFO, the downstream end of each tube was sealed with a
6061-aluminum witness plate. The plate deformation provided a rapid and inexpensive diagnostic to
evaluate the relative strength of the detonation. The upstream end contained the 76-mm-diameter
booster backed by 12.7-mm of polycarbonate. Booster thicknesses and the resulting witness plate
data are given in Tab. 1.
2.2 Pin Data and Front-Shape Records
Aluminum tubes were used to confine the ANFO during the front-shape measurements. Each tube
was 76.2 mm in ID. Wall thickness ranged from 6.35–25.4 mm and the tube lengths were 305 or
914 mm (Tab. 2). All were 6061 alloy and T6 temper, except for the 25.4-mm-thick tubing, which
was T6511. The downstream end of each tube was sealed with a 6.35-mm-ID PMMA window with
an outer diameter matching that of the tube (Fig. 1). A centerline on the inner window surface was
covered with PETN paint backed by 80-µm-thick copper tape (Fig. 2). Arrival of the detonation
shock at this location initiated the PETN with a bright flash that was recorded by a streak camera,
yielding the front-shape record.
Each aluminum tube also contained three types of diagnostic pins to detect the transit of various
waves. These pins were mounted in the wall to be flush with the tube ID. Dynasen ionization
(CA-1040) and shorting pins (CA-1038) pins were used to measure the ion and shock arrival, while
tightly fitted piezoelectric pins (CA-1136) recorded both compression of the tube wall, to detect the
precursor stress wave in the aluminum, as well as the arrival of the detonation. Pins were located
83.1-mm axially apart and were spaced apart 45◦ deg radially (Fig. 3). A piezoelectric pin was
also located in the end window against the downstream tube surface. Detonation initiation was
accomplished with 12.7-mm-thick Primasheet 1000 booster and an RP-1 detonator, tamped from
behind by 12.7-mm of polycarbonate. All pins were sampled at 1.25 GHz. This sample rate coupled
with the pin spacing provided velocity uncertainties of 1% for the ionization and shorting pins, and
3% for the piezoelectric pins.
5
Preprint of http://dx.doi.org/10.1016/j.proci.2010.07.084
Page 6
2.3 PDV-instrumented Test
Photonic-Doppler Velocimetry (PDV), a light-based interferometry technique [8], was used to obtain
the tube wall velocity during test 12-914. Four focused probes (PDV1–PDV4) were mounted along
the sidewall of the tube and four collimated probes (PDV5–PDV8) were stationed in a radial line
along the end window (Fig. 3). All probes were both orthogonal to and spaced 50 mm from the
imaging surface. End-wall probes imaged the inner surface of the window, which was sanded with
100-grit sandpaper and then covered with copper tape to ensure optimum reflectance.
3 Results and Discussion
3.1 Booster-Strength Analysis
The results of the booster-strength tests are shown in Tab. 1. The dent depth measurement is the
maximum depression located at the center of the witness plate, relative to the plate edges that were
not exposed to the explosive. The prill imprint measurement is the diameter of the region on the
witness plate that was dimpled by the detonation shock driving the prills into the metal surface of
the witness plate.
Both of these values continuously increased with increasing booster thickness. Of particular concern
was the variation in prill imprint diameter, which was below the 76-mm tube ID for all boosters
except the 6-mm case. This indicated that the detonation initiated by the 76-mm diameter booster
was decaying due to expansion effects at the wall and that an annular region of the outer diameter
was not detonating. Only with the thickest booster tested (6 mm) did the prill imprint diameter
match that of the initial booster diameter, indicating no wave decay. The dent depth of 8.5 mm for
this test also demonstrated a dramatic increase over previous values of 2.0–3.5 mm recording the
arrival of a much more robust detonation at the witness plate.
Based on these measurements, it was inferred that a stable (or very slowly decaying) detonation was
initiated in the 76-mm-diameter PVC tubing with the 6-mm booster. To account for the possibility
that steady state was not reached in the short length tested (L/ID = 4), a booster thickness of 12.7
6
Preprint of http://dx.doi.org/10.1016/j.proci.2010.07.084
Page 7
mm was selected for aluminum-confined tests. It was assumed that this increase in booster thickness,
coupled with the increased confinement of the aluminum wall, would initiate a stable detonation
with minimal overdrive. Pin measurements confirmed this assumption, as discussed below.
3.2 Pin and Front-Shape Data
An example of the pin data from test 12-305 is shown in Fig. 4. Early in time, at approximately
24 µs, the arrival of the precursor stress wave is detected by the piezoelectric pin, as denoted by
an oscillating waveform of increasing strength. As the detonation front arrives at the pin station
near 35 µs, the pin records substantially increased compression, followed by a rapid release that
was likely due to pin failure. During the period of increased compression, both the ionization and
shorting pins trigger within 100 ns of each other. In every test, all pins at each station triggered
within 1 µs of each other. A pin was considered to have triggered when the signal rose above the
bit noise associated with the data acquisition system. Additionally, there is a trigger delay inherent
in the mechanical design of the shorting pin that requires the shock pressure to move a brass cap
across a 64-µm gap, while no such delay exists for either the piezoelectric or ionization pins. This
may explain why the shorting pin triggers last.
Pin arrival times were recorded from each test and complied to form position-time plots of the
wave motion in the experiment. An example of one such plot is shown in Fig. 5 for test 12-914.
The progression of the detonation can be seen from the closely matched ionization, shorting and
piezoelectric shock pin trigger times. The propagation of the elastic stress wave in the metal is also
seen ahead of the detonation front. The data from each pin fit well to a line using a least squares
fit, the slope of which yields the average wave velocity in the experiment.
These average wave velocity data are reported in Tab. 2. The velocity of the elastic precursor
ranges from 5.1–6.5 mm/µs, which is consistent with the speed of sound in aluminum. Detonation
velocities range from 2.7–3.6 mm/µs, increasing with wall thickness up to the maximum 25.4-mm
wall thickness tested. As mentioned, this trend was expected due to the extended length of the
ANFO reaction zone and the subsonic confinement condition. No inert shocks were present to limit
the entire confiner thickness from acting on the reaction zone [4].
7
Preprint of http://dx.doi.org/10.1016/j.proci.2010.07.084
Page 8
Overall, we find the agreement of the linear velocity fit to the elastic precursor wave data to be good,
with squared correlation coefficients above 0.987. The fit to the detonation pin data is excellent,
with all squared correlation coefficients above 0.996. The lower fit correlation for the elastic stress
wave is attributed to multiple issues: The Primasheet booster overdrives the precursor wall wave
initially, as evidenced by the higher elastic wave speeds in the shorter length tubes. Additionally,
detection of the elastic precursor signal can be difficult due to its low amplitude, which can be
exacerbated by a poorly fit pin not sensing early compression due to insufficient sidewall contact.
The detonation, however, does not exhibit any overdrive associated with the initiation process.
In fact, comparison tests of identical wall thicknesses find average velocities that are consistently
3–10% lower for the short tubes, relative to the longer lengths tested, indicating that the wave is
slightly underdriven from the booster.
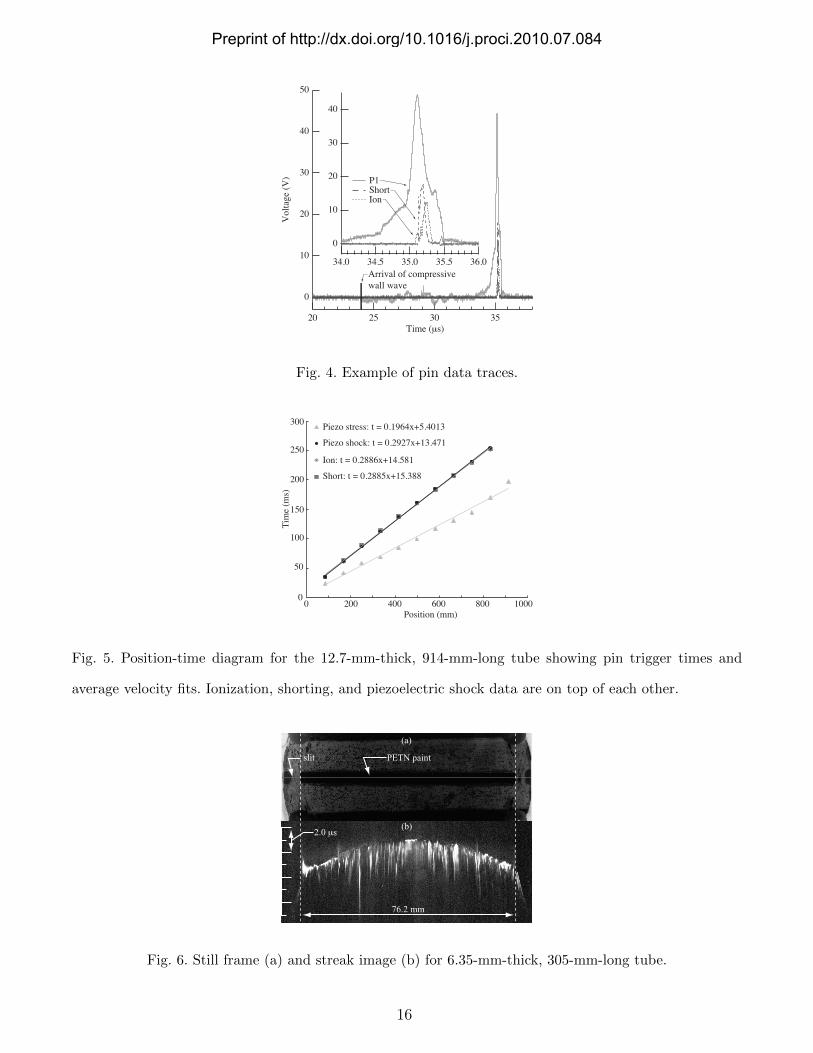
Figure 6 shows the front-shape data for test 6-305. The upper image is a still frame showing the
imaging slit of the window in Fig. 2. The lower image is the streak data with time increasing
downwards. The granular nature of the explosive is reflected in the streak and some jetting of
product gas ahead of the main shock is also evident, particularly at the left wall. Such jetting is also
observed in ANFO rate sticks with weaker confinement [7] and is due to a gap at the wall allowing
product gases to rush ahead of the main front. The gap is believed to be due to either the subsonic
wall pulling away from the explosive ahead of the detonation or the absence of a prill near the wall
on the imaging centerline. A more definitive conclusion is not possible in the current study and jets
effects are neglected in the following discussion.
The front-shape profile shows low curvature near the tube center, indicating a locally higher propa-
gation velocity in the region most isolated from wall expansion. Curvature increases with increasing
radius to a maximum between the tube center and the wall, and then decreases near the wall.
Different behavior is observed in more weakly confined systems (Fig. 7), where the detonation
curvature is at a minimum at the center and monotonically increases outwards towards the wall.
Thus, the aluminum confiner is not only providing additional confinement, but also modifying the
characteristic shape of the wavefront.
A compilation of all front-shape measurements to date is shown in Fig. 8. All images are identically
8
Preprint of http://dx.doi.org/10.1016/j.proci.2010.07.084
Page 9
scaled. Similar features as discussed in Fig. 6 are seen in all traces. It is apparent that increasing the
wall thickness not only increases the detonation velocity, but also results in a detonation profile with
less overall curvature. Such behavior agrees well with theory [4]. The velocity-curvature relationship
for these data are presented in a separate study [9]. Jetting aside, all fronts also appear fairly
symmetric.
Comparison of the prominent front in each record (except Fig. 8b, where the fainter leading wave
is used) shows little difference between the short- and long-length tubes for each wall thickness
tested. This indicates that the wave shape approaches its steady state rapidly (within L/ID = 4).
In some cases (b, d, and e in Fig. 8), the streak record shows two-wave structure, with a diffuse
or weaker front arriving before the main front. Since the imaging section is PETN paint backed by
copper tape, this indicates low-level PETN ignition followed by stronger reaction. This phenomenon
is clarified by the PDV diagnostic results in the next section.
3.3 PDV Analysis
The following data was recorded for test 12-914, matching the position-time plot of Fig. 5.
3.3.1 Sidewall probes
An example of the PDV sidewall data for probe PDV3 is shown in Fig. 9. Starting near 150 µs, the
arrival of the precursor wave induces early movement (inset) of up to 4 m/s first radially outwards
then inwards. The arrival of the detonation shock near 250 µs then rapidly increases the wall velocity
up to 1.0 mm/µs as the wall is driven outwards by the expanding detonation products. Sharpe and
Bdzil [4] predicted that the precursor motion would be first inwards, followed by outward motion
due to the detonation arrival. This is similar to the current results but does not recover the initial
outwards motion observed, which may be an initiation transient.
The other sidewall probes exhibit phenomenologically identical behavior and in all cases the pre-
cursor arrival times are consistent with the pin data. The detected radial motion from the precursor
wave appears insufficient to noticeably precompress the ANFO near the wall. Furthermore, large-
scale radial expansion, associated with the arrival of the detonation, commences 2.5 µs before the
9
Preprint of http://dx.doi.org/10.1016/j.proci.2010.07.084
Page 10
Dynasen pins detect the detonation. However, as only outer wall motion is measured, the response
of the ANFO and inner wall to this motion is unknown.
3.3.2 End window probes
Figure 10 contains the PDV window probe data. As shown in the inset, the arrival of the elastic
wave induces early downstream motion of the end window, near 170 µs, almost 100 µs before the
arrival of the detonation. The outer edge of the window starts motion earlier and moves 3.85 mm
prior to that arrival of the detonation, while the center only moves 0.49 mm. The 3.36-mm difference
in motion implies that the inner surface of the window is bending in a concave fashion.
The motion of the window during this 100-µs period is thought to separate the inner window surface
from the ANFO. We deem it unlikely that the axial wall motion also moves the ANFO significantly
downstream because: (1) The prills are not attached to the wall, so axial wall motion would transmit
little shear force to the prills. (2) Any induced prill motion near the wall would be absorbed by the
granular nature of the explosive and would not propagate inwards. Thus, it is likely that an air gap
exists between the prills and the inner window, whose width increases with radius and magnitude
corresponds to the motion shown in the inset of Fig. 10.
A detonation encountering such a low-impedance gap would be transmitted as a shock and would
reflect back and forth between the higher-impedance inner window and detonation products, ef-
fectively “ringing up” the window particle velocity until all materials had identical pressure and
velocity conditions. The PDV data of the shock arrival at the window support this hypothesis. The
center probe (PDV5) measures a sharp shock, consistent with a small gap. Probes PDV6 and PDV7
both exhibit ring-up behavior as indicated by the repeated small shocks that accelerate the window.
The velocity signal from PDV7 rises more gradually than that of PDV6, which has a smaller gap
that allows for shorter shock transit times.
At the PETN-flash, this ring-up behavior appears to manifest itself as two waves: a weak or dif-
fuse ignition followed by a stronger reaction when the pressure driving the PETN reaction rises
sufficiently during the ring-up. This effect is not window ghosting due to total internal reflection
as all waves have curvature. Such double-wave structure is not observed in front-shape records
10
Preprint of http://dx.doi.org/10.1016/j.proci.2010.07.084
Page 11
for the short tubes with 6.35-mm and 12.7-mm walls (Figs. 8a and 8c). It is present in the short
25.4-mm-wall test (Fig. 8e), but the first faint shock is almost on top of the stronger wave. This is
in contrast to the streak records from the longer tubes (Figs. 8b and 8d), which show substantial
separation between the two waves. The separation between the arrival of the precursor wall wave
and the detonation front at the end window is about 50 µs in the short tubes and 100 µs in the
long ones. The increased time for window movement in the longer tubes supports the larger wave
separation. Increasing the wall thickness also seems to increase the strength of the leading wave.
Besides imposing a second diffuse wave on the streak images, the presence of such a variable-width
gap also artificially induces additional curvature on the front profile due to the time required for
the air shock and detonation products to traverse the gap. In order to mitigate this effect, future
tests will need to decouple the window from the tube wall motion in order to maintain contact
at the explosive-window interface. A redesigned test is being implemented to accommodate this
requirement. The redesigned measurement surface will also be positioned away from the downstream
tube end to record the detonation shape prior to the arrival of the reflected elastic precursor at the
measurement location.
4 Conclusions
Detonation waves were propagated in aluminum tubes filled with the non-ideal high explosive
ANFO. Tube wall thickness varied from 6.35 to 25.4 mm while lengths of 305 and 914 mm were
used. This configuration was of interest because the sound speed of the aluminum confiner exceeded
the detonation velocity, preventing a shock from forming in the tube wall and allowing the aluminum
to transport energy from behind the detonation front to the undisturbed explosive upstream. Pre-
liminary boosting tests were also conducted to determine the wave strength required to initiate
stable ANFO detonation without significant overdrive.
Front-shape records showed maximum curvature away from the wall, with different characteristic
wave shapes than observed in weakly confined ANFO. Detonation and aluminum stress wave veloc-
ities were recorded with shorting, ionization, and piezoelectric pins embedded in the tube wall. In
all cases, increasing the tube wall thickness led to higher detonation velocities and less wavefront
11
Preprint of http://dx.doi.org/10.1016/j.proci.2010.07.084
Page 12
curvature, as predicted by prior work [4]. Double-shock structure was also observed in some tests
and attributed to separation of the imaging window from the explosive.
Tube wall motion was recorded with PDV for the test of the 12.7-mm-thick, 914-mm-long tube.
Energy transported ahead of the detonation resulted in weak (4 m/s) outward, then inward radial
motion of the tube wall until a few microseconds before arrival of the detonation, at which point the
tube rapidly expanded outwards, reaching velocities of 1 mm/µs. Axial motion of the downstream
tube end prior to the arrival of the detonation was sufficient to arc the attached imaging window.
This motion separated the window-explosive interface, creating a variable-width gap. The detonation
transmitted across this gap as an air shock, partially igniting the PETN-flash. Increasing pressure
due to subsequent shock ring-up eventually caused the window to fully flash. Such behavior is
believed responsible for double-wave structure observed in some streak records and will need to be
accounted for in the streak records. Longer periods of window motion and thicker tube walls allowed
for increased energy transport ahead of the detonation and were seen to increase the double-wave
spacing.
The velocity, front-shape, and PDV data collected are essential to understand and accurately model
the behavior of low-detonation-velocity explosives in higher-sound-speed confiners. The booster
strength and velocity data are also of interest to future experimental efforts involving ANFO, as
little data are available for aluminum-confined ANFO at the longer lengths tested. Future tests
will further explore the discussed phenomena in larger-diameter, longer-length tubes to verify the
steady-state propagation behavior and obtain higher-fidelity front-shape measurements that are
unaffected by the early wall motion.
Acknowledgements
The authors are grateful to Robert Mier, John Morris, and Larry Vaughan for their assistance
fielding these experiments and to Matt Briggs, Steve Hare, and Mike Shinas for their expertise with
the PDV system. This work was managed by Jim Koster and David Robbins and supported by the
U.S. Department of Energy.
12
Preprint of http://dx.doi.org/10.1016/j.proci.2010.07.084
Page 13
References
[1] G. Eden, R. Belcher, in: Proceedings of the 9th International Symposium on Detonation, Office
of Naval Research, 1989, pp. 831–841.
[2] C. Tarver, E. McGuire, in: Proceedings of the 12th International Symposium on Detonation,
Office of Naval Research, 2002, pp. 641–649.
[3] H. Arai, Y. Ogata, Y. Wada, A. Miyake, W. Jung, J. Nakamura, T. Ogawa, Sci. Technol.
Energetic Mat. 65 (2004) 201–205.
[4] G. Sharpe, J. Bdzil, Journal of Engineering Mathematics 54 (2006) 273–298.
[5] T. Aslam, J. Bdzil, in: Proceedings of the 13th International Symposium on Detonation, Office
of Naval Research, 2006, pp. 761–769.
[6] T. Aslam, J. Bdzil, in: Proceedings of the 12th International Symposium on Detonation, Office
of Naval Research, 2002, pp. 483–488.
[7] J. Bdzil, T. Aslam, R. Catanach, L. Hill, M. Short, in: Proceedings of the 12th International
Symposium on Detonation, Office of Naval Research, 2002, pp. 409–417.
[8] B. Jensen, D. Holtkamp, P. Rigg, Journal of Applied Physics 101 (2007) 013523.
[9] S. Jackson, C. Kiyanda, M. Short, in: Proceedings of the 14th International Symposium on
Detonation, Office of Naval Research, 2010. In press.
13
Preprint of http://dx.doi.org/10.1016/j.proci.2010.07.084
Page 14
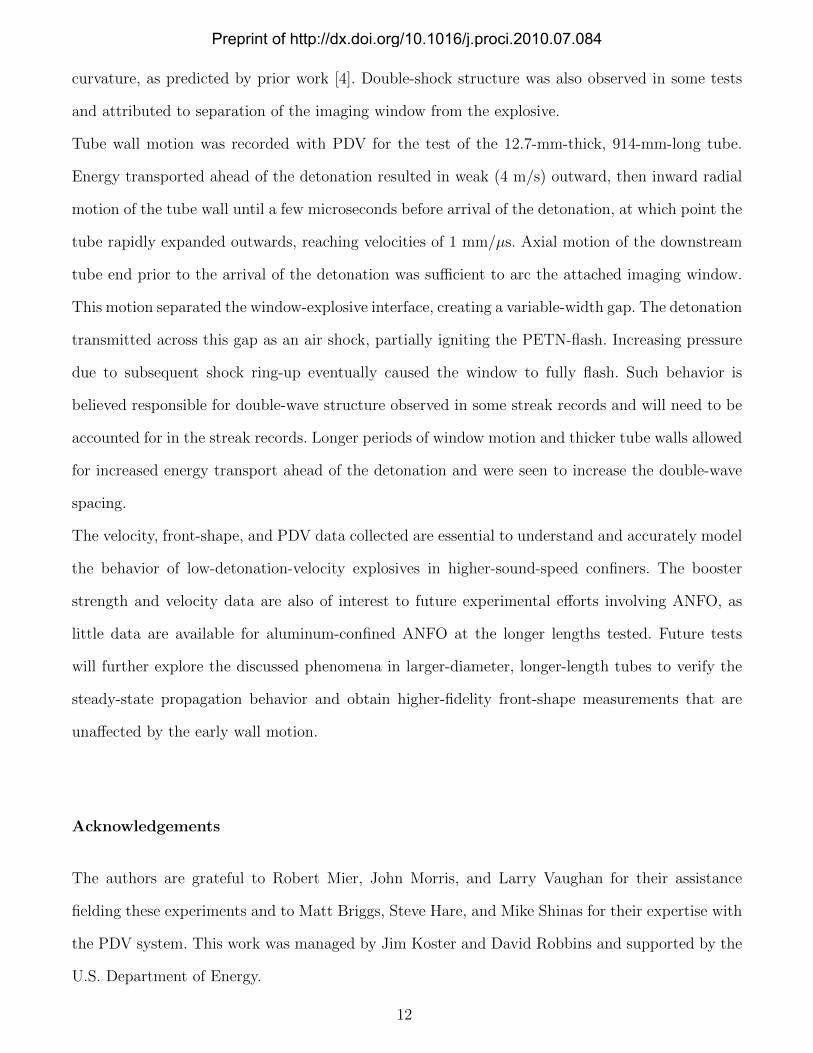
Tables
Table 1
Booster information and results.
Primasheet Dent Imprint
Thickness Depth Diameter
(mm) (mm) (mm)
3 2.0 39.4
4 2.8 46.7
5 3.5 50.8
6 8.5 76.2
Table 2
Dimensional and average velocity data. Asterisk (∗) denotes the T6511 temper tube, all others were T6.
Test Wall Tube Short Pin Ion Pin Piezo Pin Piezo Stress
Name Thickess Length Shock U Shock U Shock U Wave U
(mm) (mm) (mm/µs) (mm/µs) (mm/µs) (mm/µs)
6-305 6.35 305 2.772 2.690 2.814 5.721
6-914 6.35 914 2.838 2.797 2.904 5.453
12-305 12.70 305 3.125 3.193 3.092 5.615
12-914 12.70 914 3.466 3.465 3.416 5.092
25-305 25.40 305 3.383 3.588 3.377 6.480∗
14
Preprint of http://dx.doi.org/10.1016/j.proci.2010.07.084
Page 15
Figures
Ionization pin
Piezoelectric pin
Shorting pin
Booster and tamper
Aluminum tube
Imaging window
Fig. 1. The tube from test 6-305.
Copper tape PETN paint
Piezoelectric pin
Fig. 2. The downstream end window of the 6.35-mm-thick, 305-mm-long tube filled with ANFO.
Detonation
Ion Axis
Shorting Axis
Piezo Axis
PDV1 PDV2 PDV3PDV4
45o45o
12.7 mm
6.35 mm
PDV5
PDV6
PDV7
PDV8
83.1 mmTUBE SIDE:
END WINDOW:
Fig. 3. A schematic of the pin and probe locations on the 6.35-mm-thick, 914-mm-long tube.
15
Preprint of http://dx.doi.org/10.1016/j.proci.2010.07.084
Page 16
50
40
30
20
10
0
Volt
age
(V)
35302520
Time (μs)
40
30
20
10
0
36.035.535.034.534.0
P1
Ion Short
Arrival of compressive
wall wave
Fig. 4. Example of pin data traces.
Tim
e (
ms)
Position (mm)
400200 800600 1000
50
100
150
200
250
300
00
Ion: t = 0.2886x+14.581
Piezo shock: t = 0.2927x+13.471
Short: t = 0.2885x+15.388
Piezo stress: t = 0.1964x+5.4013
Fig. 5. Position-time diagram for the 12.7-mm-thick, 914-mm-long tube showing pin trigger times and
average velocity fits. Ionization, shorting, and piezoelectric shock data are on top of each other.
slit PETN paint
76.2 mm
2.0 μs
(a)
(b)
Fig. 6. Still frame (a) and streak image (b) for 6.35-mm-thick, 305-mm-long tube.
16
Preprint of http://dx.doi.org/10.1016/j.proci.2010.07.084
Page 17
Fig. 7. A streak record for ANFO confined by cardboard from Ref. 7.
(a) Wall thickness: 6.35 mm, tube length: 305 mm
(b) Wall thickness: 6.35 mm, tube length: 914 mm
(c) Wall thickness: 12.7 mm, tube length: 305 mm
(d) Wall thickness: 12.7 mm, tube length: 914 mm
(e) Wall thickness: 25.4 mm, tube length: 305 mm
Fig. 8. Streak records.
1000
800
600
400
200
0
Vel
oci
ty (
m/s
)
300280260240220200180160
Time (μs)
4
2
0
-2
240220200180160
Fig. 9. Sidewall velocity data from probe PDV3.
17
Preprint of http://dx.doi.org/10.1016/j.proci.2010.07.084
Page 18
2
1
0
Vel
oci
ty (
mm
/μs)
300295290285280275
Time (μs)
2
1
2
1
2
1
4
3
2
1
0
Mo
vem
ent
(mm
)
280240200160
PDV5 PDV6 PDV7 PDV8
PDV8 - tube wall
PDV7
PDV6
PDV5 - center
Fig. 10. Endwall PDV data.
18
Preprint of http://dx.doi.org/10.1016/j.proci.2010.07.084
Page 19
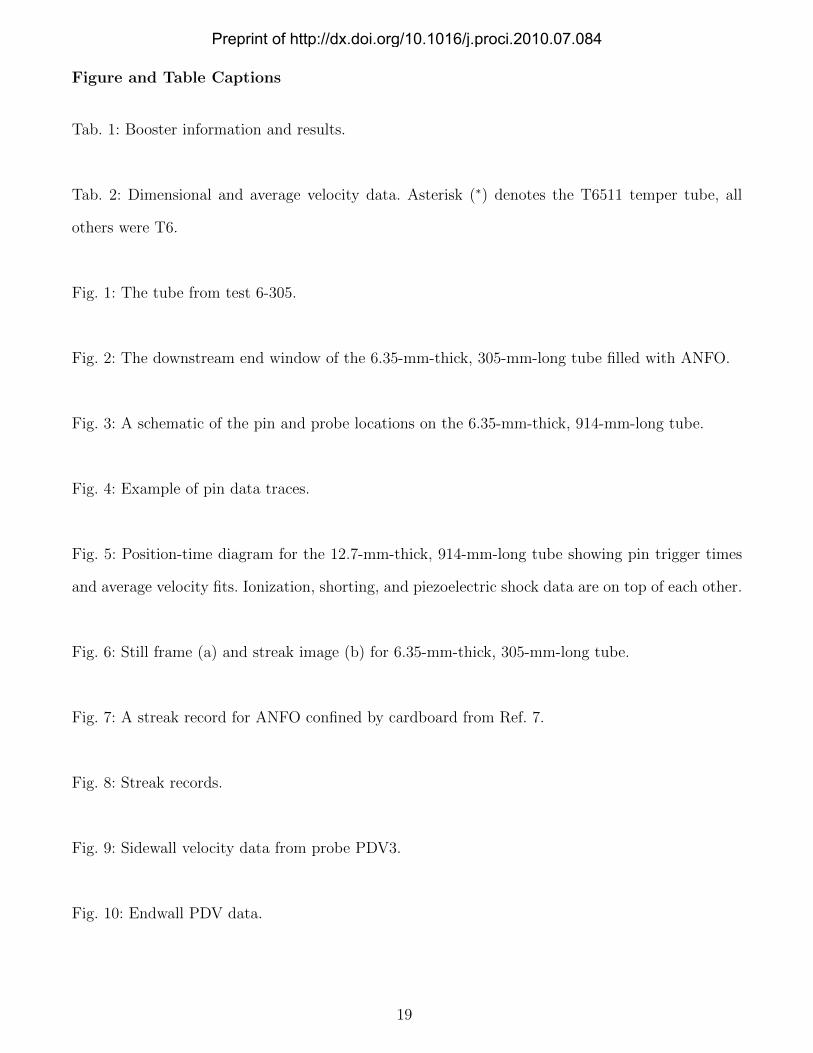
Figure and Table Captions
Tab. 1: Booster information and results.
Tab. 2: Dimensional and average velocity data. Asterisk (∗) denotes the T6511 temper tube, all
others were T6.
Fig. 1: The tube from test 6-305.
Fig. 2: The downstream end window of the 6.35-mm-thick, 305-mm-long tube filled with ANFO.
Fig. 3: A schematic of the pin and probe locations on the 6.35-mm-thick, 914-mm-long tube.
Fig. 4: Example of pin data traces.
Fig. 5: Position-time diagram for the 12.7-mm-thick, 914-mm-long tube showing pin trigger times
and average velocity fits. Ionization, shorting, and piezoelectric shock data are on top of each other.
Fig. 6: Still frame (a) and streak image (b) for 6.35-mm-thick, 305-mm-long tube.
Fig. 7: A streak record for ANFO confined by cardboard from Ref. 7.
Fig. 8: Streak records.
Fig. 9: Sidewall velocity data from probe PDV3.
Fig. 10: Endwall PDV data.
19
Preprint of http://dx.doi.org/10.1016/j.proci.2010.07.084