1 Experimental Reexamination of Transverse Tensile Strength for IM7/8552 Tape-Laminate Composites Caitlin M. Arndt 1 , Nelson V. De Carvalho 2 , Michael W. Czabaj 1* 1 Department of Mechanical Engineering, University of Utah, Salt Lake City, UT 84112. 2 National Institute of Aerospace, Hampton, VA 23681. *Corresponding Author: [email protected]ABSTRACT Due to the observed dependence of transverse-tensile strength, Y T , on test geometry and specimen size, there is no consensus regarding a test method that can uniquely measure Y T . This study reexamines characterization of Y T by comparing results from established flexure tests with results from a new tensile test that exhibits consistent failure in the gage region. Additionally, the effects of surface preparation and direction of transverse fracture are investigated. Results show that Y T is inversely proportional to specimen volume and surface roughness, and is insensitive to direction of transverse fracture. The relationship between specimen volume and Y T is adequately captured by Weibull strength-scaling theory, except at the tails of the Y T distributions. However, specimens exhibited microcracking prior to failure, which violates the “weak-link” assumptions of the Weibull theory. These findings highlight the challenges of using deterministic Y T values in progressive damage analysis. 1. INTRODUCTION Transverse tensile fracture is one of the most frequently observed failure modes in tape- laminate polymer-matrix composites (PMCs). The propensity for this failure mode in PMCs is due to low tensile strength of the polymer matrix relative to tensile strength of the reinforcing fibers. In itself, transverse tensile fracture can lead to some degradation of laminate in-plane elastic properties, which is rarely critical. However, this failure mode can also act as a precursor to other, more severe, forms of damage including delamination, fiber tensile failure, and/or
Transcript
1
Experimental Reexamination of Transverse Tensile Strength for IM7/8552 Tape-Laminate Composites
Caitlin M. Arndt1, Nelson V. De Carvalho2, Michael W. Czabaj1* 1Department of Mechanical Engineering, University of Utah, Salt Lake City, UT 84112.
2National Institute of Aerospace, Hampton, VA 23681. *Corresponding Author: [email protected]
ABSTRACT
Due to the observed dependence of transverse-tensile strength, YT, on test geometry and
specimen size, there is no consensus regarding a test method that can uniquely measure YT. This
study reexamines characterization of YT by comparing results from established flexure tests with
results from a new tensile test that exhibits consistent failure in the gage region. Additionally, the
effects of surface preparation and direction of transverse fracture are investigated. Results show
that YT is inversely proportional to specimen volume and surface roughness, and is insensitive to
direction of transverse fracture. The relationship between specimen volume and YT is adequately
captured by Weibull strength-scaling theory, except at the tails of the YT distributions. However,
specimens exhibited microcracking prior to failure, which violates the “weak-link” assumptions
of the Weibull theory. These findings highlight the challenges of using deterministic YT values in
progressive damage analysis.
1. INTRODUCTION
Transverse tensile fracture is one of the most frequently observed failure modes in tape-
laminate polymer-matrix composites (PMCs). The propensity for this failure mode in PMCs is
due to low tensile strength of the polymer matrix relative to tensile strength of the reinforcing
fibers. In itself, transverse tensile fracture can lead to some degradation of laminate in-plane
elastic properties, which is rarely critical. However, this failure mode can also act as a precursor
to other, more severe, forms of damage including delamination, fiber tensile failure, and/or
compressive fiber kinking. As a result, characterization and accurate prediction of transverse
tensile fracture is of great importance to ensure safe and reliable deployment of PMCs in primary
structural applications.
One of the most common ways of predicting transverse tensile fracture is based on
experimental characterization of transverse tensile strength, YT. In rudimentary laminate analyses
(vis. first-ply failure or ply-discount models) YT is used directly to determine ply failure for a
given state of transverse tensile stress. In more advanced, finite element (FE)-based Progressive
Damage Analysis (PDA), YT is used to determine when individual elements begin to fail. For
example, in continuum damage mechanics models, YT can be used in conjunction with a
preferred composites failure theory (e.g. LaRC04 [1]) to determine when an element has reached
a critical stress level that initiates gradual degradation of its stiffness [2]. In numerical
approaches which model cracks discretely, YT has been used to determine the onset of the release
process of pre-defined [3,4], or automatically inserted, zero-thickness cohesive elements [5-8] or
zones [9]. Both continuum and discrete approaches typically use a combination of YT, along with
mode-I fracture toughness, GIc, to define a traction-separation law that governs onset and
subsequent material degradation [10-11]. The simulation of crack propagation using traction-
separation laws leads to the development of a process zone, within which the material has
initiated its degradation, but traction-free crack faces have not yet formed. Variations in the
process zone length have been demonstrated to affect the solution, particularly in the first stages
of growth as the process zone is formed [12]. For the same assumed GIc and traction law shape, a
higher/lower YT results in a smaller/larger process zone. Hence, the choice of YT can affect the
solution beyond the onset and into the initial stages of crack growth. Furthermore, from a
practical perspective, the adequate representation of the process zone imposes restrictions on the
3
maximum element size that can be used [13], with smaller process zones (higher YT) requiring
finer discretizations. With a few exceptions (e.g. [14]), nearly all analysis approaches assume a
single deterministic value for YT. Despite widespread use of YT for prediction of intra-laminar
fracture in tape-laminate PMCs mentioned above, a number of studies have demonstrated that
obtaining this parameter is not straightforward.
Currently there is no consensus in the literature regarding which test method should be used
to measure YT, and how to deal with dependence of this property on the specimen size and
geometry. To date, the most widely accepted method for characterization of YT, described in the
ASTM standard D3039, involves uniaxial loading of unidirectional transverse specimens [15].
According to D3039, test specimens require a constant rectangular cross-section, which must be
gripped using tabs to prevent splitting at the points of load introduction. Although this test is
relatively easy to perform, several studies have observed that specimens often fail near or at the
loading tabs, and that size of specimen cross-section has an effect on the magnitude of the
measured YT [16-18]. For example, in a study by O’Brien and Salpekar, a series of carbon/epoxy
specimens with varying widths and thicknesses were tested according to ASTM D3039. In this
study, nearly 22% of tested specimens broke at or near the loading tabs, and the coefficient of
variation for YT was as large as 19%. Despite the scatter in the data, YT appeared to decrease with
the increasing gage region thickness, but changes in width did not have an effect on YT [16].
The second most common way of measuring YT involves flexure loading of unidirectional
transverse beams. Relative to ASTM D3039, fabrication and testing of flexure specimens is
simpler since no additional tabbing is required, provided that large enough loading rollers are
used. Typically, flexure testing is performed using 3-point bend (3PB) or 4-point bend (4PB)
fixture configurations, and data reduction is based on the beam theory. A study by O’Brien et al.
4
examined the difference between 3PB and 4PB configurations using glass/epoxy and
carbon/epoxy specimens [19]. For both material systems and test types, YT decreased with
increasing specimen width, thickness, and support span; however, the observed trends were
somewhat obscured by the specimen-to-specimen and batch-to-batch (i.e. panel-to-panel)
variability. Despite the observed scatter, YT values obtained from 4PB tests were lower than
those obtained from 3PB tests by as much as 15%. The difference between YT obtained from
tensile and flexure testing has been investigated by Adams et al. using carbon/epoxy specimens
[20]. This study observed that YT measured using 3PB tests was nearly twice the value obtained
from tensile testing. The large difference between strengths derived from flexural and tensile
tests has been observed for other PMCs systems [21-23], as well as other brittle materials like
cement [24], rock [25], and ceramics [26].
The observed trend of YT changing with specimen size or loading type (e.g. tension versus
flexure) has been related to the volume of the material subjected to tensile stresses prior to
failure. This trend, known as the “size effect”, is a well-documented phenomenon observed in
brittle and quasi-brittle materials [27-31]. For PMCs, the size effect has been described in two
comprehensive review articles by Bažant and Wisnom [32,33]. With existence of the size effect,
the most common approach for relating (i.e. scaling) YT between different specimen volumes is
the Weibull scaling law, which is based on the so-called “weakest link” theory [34,35]. The
weakest link theory analogizes a brittle material to a chain composed of links in series, in which
the entire chain is only as strong as its weakest link. The underlying assumption of this theory is
that the strength of individual links is governed by presence of critical flaws and
inhomogeneities, and thus increasing the number of links (i.e. volume of the material) increases
the probability of failure.
5
The discussion in the literature on the applicability of the Weibull scaling law to PMCs is
somewhat conflicting [36,33]. In some cases, the Weibull law provides a reasonable scaling
between strengths [21,37,38], while in other cases the Weibull law fails to account for the
volumetric effects. In a study by O’Brien and Salpekar [16] the Weibull scaling law was applied
to compare YT values to those previously obtained by Crews [39] using a flexure test on 90°
specimens. It was found that the analytical solution for the effective stressed volume did a poor
job of scaling the characteristic YT, but approximating a larger effective volume of the entire
width, length, and half of the beam depth gave reasonable strength predictions. While this
approach may have given better results than using the calculated effective volume, it is not
consistent with the statistical theory. In another study, O’Brien et al. applied Weibull theory to
scale strength between 3PB and 4PB specimens [19]. They found that the Weibull scaling law
over-predicted the change in YT, both when scaling between similar testing configurations (e.g.
3PB tests with varying spans), and when scaling between different test configurations (e.g. 3PB
versus 4PB). They concluded that Weibull scaling did not adequately capture the size effects for
PMCs.
The above discussion raises several interesting considerations related to experimental
characterization and the use of YT. First, based on current literature, it is unclear which test
should be used to measure YT. For instance, tensile testing using D3039 results in low, and thus
conservative, values of YT; however, the frequent failure near the loading tabs casts doubt on the
validity and repeatability of this test. Conversely, existing flexure tests appear to be very
repeatable, yet they produce unusually high values of YT, which must be scaled down to represent
behavior of the bulk material. Second, the difficulty of measuring YT has resulted in a lack of
consensus on whether the existing volumetric scaling laws (e.g. Weibull) can be used to
6
effectively scale YT. Without this consensus, it is currently unclear how to best use YT in existing
failure prediction models.
In view of these considerations, the main goal of this study is to reexamine experimental
characterization of YT for tape-laminated composites. Consequently, the presented work has two
main objectives: (1) re-characterization of YT for a common carbon/epoxy (viz. IM7/8552)
system using both flexure and tensile tests, and (2) observation of microscale fracture that leads
to ultimate transverse tensile failure in YT tests. Re-characterization of YT is performed using
specimens with different effective volumes to enable investigation of the volumetric scaling
effects. Flexure testing is performed using existing 3PB and 4PB tests adopted from [19]. Tensile
testing is performed using a new non-prismatic specimen adopted from [40], modified to ensure
consistent failure in the gage region. In addition, the 3PB specimens are also used to examine the
effect of specimen surface preparation (i.e. extent of surface flaws in unpolished vs. polished
samples), and specimen orientation (i.e. out-of-plane versus in-plane transverse failure) on YT.
The microscopic observations of fracture are performed by conducing in-situ and ex-situ imaging
of the flexure specimens using optical microscopy. These observations are performed with aim
of discovering the microscale failure mechanisms (e.g. microcracking) that contribute to
macroscopic transverse tensile failure of specimens, and which may provide insight into validity
of the existing scaling laws.
In what follows, Section 2 presents the test methods, details regarding specimen fabrication
and preparation, and a summary of the tests performed. Section 3 provides an overview of two-
parameter Weibull scaling and its application to the geometries tested. Section 4 presents and
discusses the experimental results, and is followed by concluding remarks in Section 5.
7
2. METHODS
The characterization of YT was performed using 3PB, 4PB, and tensile test configurations.
The data obtained from all three tests are used to investigate the relationship between the
effective volume (i.e. volume subjected to tensile stresses) and YT. Similarly, data from these
tests are used to assess the suitability of the two-parameter Weibull theory to model and scale the
stochastic distribution of YT. In addition, 3PB and 4PB tests were used to investigate the
microscale fracture processes occurring before reaching the critical failure load used to calculate
YT. Finally, 3PB tests were used to investigate the effects of surface preparation and specimen
orientation on YT.
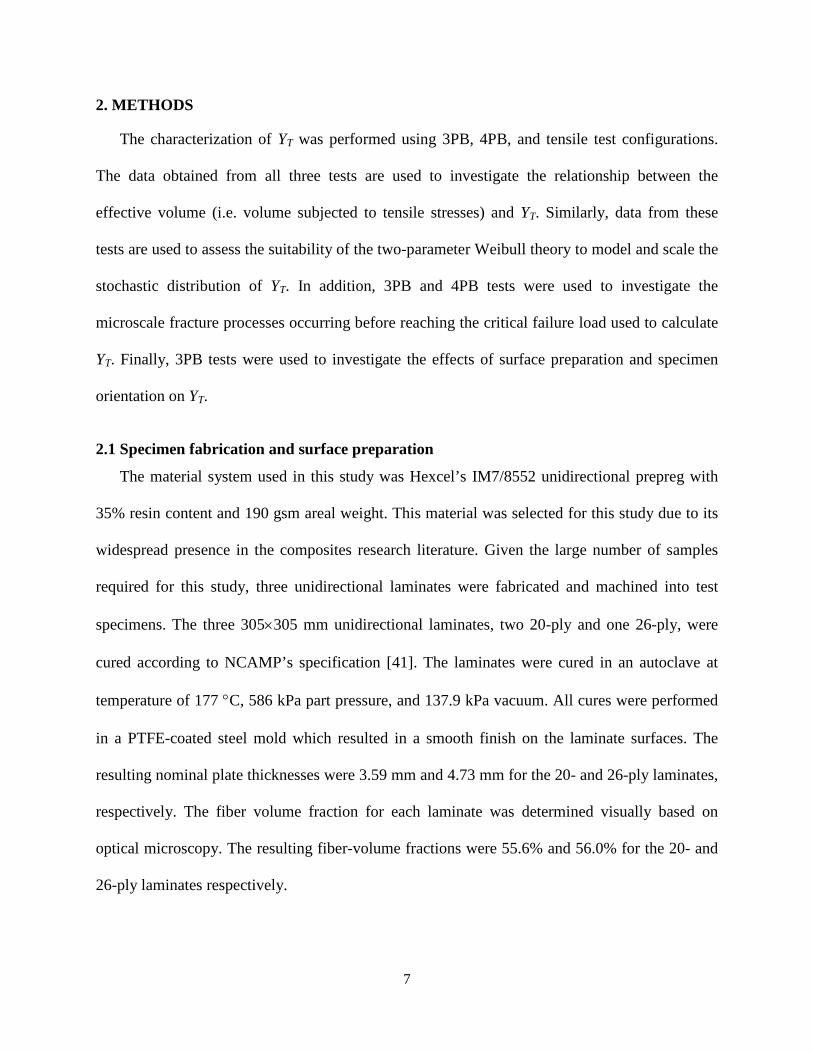
2.1 Specimen fabrication and surface preparation
The material system used in this study was Hexcel’s IM7/8552 unidirectional prepreg with
35% resin content and 190 gsm areal weight. This material was selected for this study due to its
widespread presence in the composites research literature. Given the large number of samples
required for this study, three unidirectional laminates were fabricated and machined into test
specimens. The three 305×305 mm unidirectional laminates, two 20-ply and one 26-ply, were
cured according to NCAMP’s specification [41]. The laminates were cured in an autoclave at
temperature of 177 °C, 586 kPa part pressure, and 137.9 kPa vacuum. All cures were performed
in a PTFE-coated steel mold which resulted in a smooth finish on the laminate surfaces. The
resulting nominal plate thicknesses were 3.59 mm and 4.73 mm for the 20- and 26-ply laminates,
respectively. The fiber volume fraction for each laminate was determined visually based on
optical microscopy. The resulting fiber-volume fractions were 55.6% and 56.0% for the 20- and
26-ply laminates respectively.
8
After cure, all 20-ply laminate specimens were water-jetted, while all 26-ply specimens were
cut using a 1.3-mm-thick diamond blade. After initial machining, all flexural and tensile
specimens were lightly sanded using 800-grit silicon carbide sandpaper to remove surface
scratches and fiber-blowout from machining. As detailed in the next section, a portion of flexure
specimens were subsequently sanded using a 1200-grit silicon carbide sandpaper, and polished
using a lapping cloth coated with a mixture of 0.05 micron alumina powder, water, and dish
soap. After polishing, all samples were examined using a Keyence VHX-5000 optical
microscope. An example view of the polished 2-3 (out-of-plane) and 1-2 (in-plane) surfaces
imaged at ~0.1μm/pixel resolution are shown in Fig. 1.
(a) (b)
Figure 1. Example of final polish surfaces on (a) the 2-3 and (b) 1-2 planes imaged with Keyence VHX-5000 optical microscope. Red regions indicate direction of transverse fracture in configuration A and B specimens.
2.1.1 Flexure tests
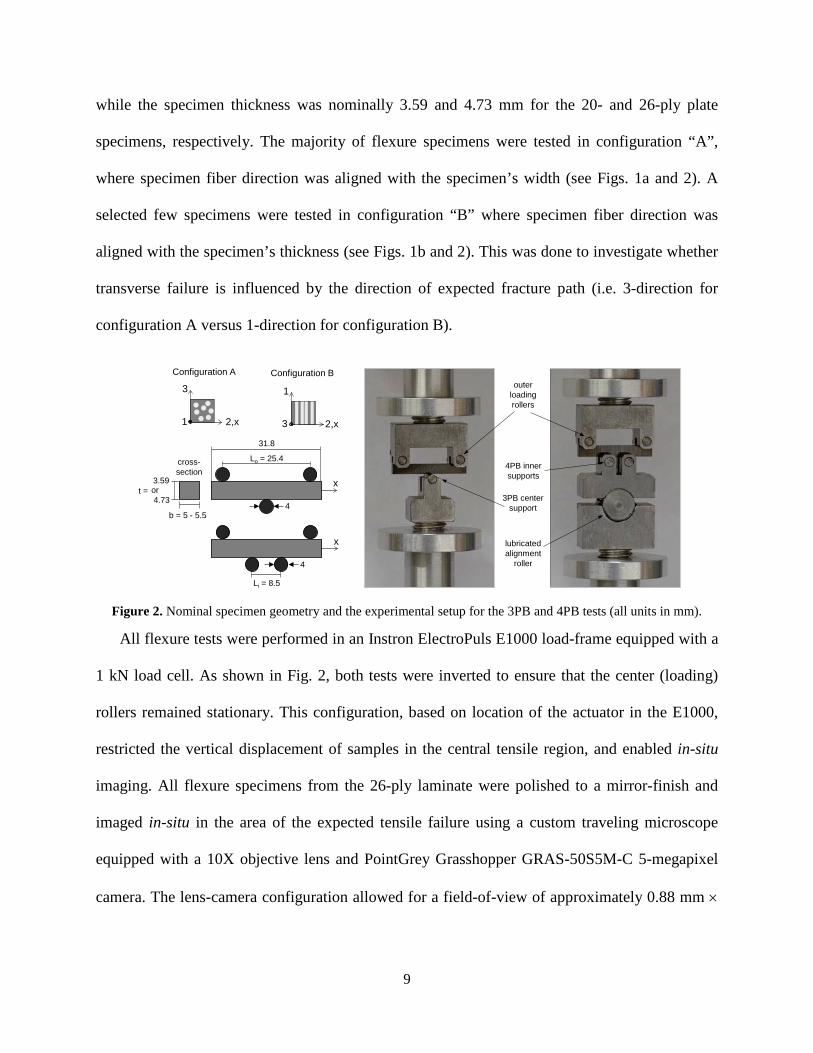
The specimen geometry and the experimental setup for the 3PB and 4PB tests are shown in
Fig. 2. As shown this figure, the outer span for both tests was 25.4 mm, the inner span for the
4PB test was 8.5 mm, and all rollers were 4 mm in diameter. All specimens were nominally 31.8
mm long. Prior to sanding and polishing, the width of all specimens was nominally 5.0-5.5 mm,
20 μm 20 μm
Configuration A Configuration B
2,x
3
1 2,x
1
3
2,x
31
Direction of tensile stresses
9
while the specimen thickness was nominally 3.59 and 4.73 mm for the 20- and 26-ply plate
specimens, respectively. The majority of flexure specimens were tested in configuration “A”,
where specimen fiber direction was aligned with the specimen’s width (see Figs. 1a and 2). A
selected few specimens were tested in configuration “B” where specimen fiber direction was
aligned with the specimen’s thickness (see Figs. 1b and 2). This was done to investigate whether
transverse failure is influenced by the direction of expected fracture path (i.e. 3-direction for
configuration A versus 1-direction for configuration B).
Figure 2. Nominal specimen geometry and the experimental setup for the 3PB and 4PB tests (all units in mm).
All flexure tests were performed in an Instron ElectroPuls E1000 load-frame equipped with a
1 kN load cell. As shown in Fig. 2, both tests were inverted to ensure that the center (loading)
rollers remained stationary. This configuration, based on location of the actuator in the E1000,
restricted the vertical displacement of samples in the central tensile region, and enabled in-situ
imaging. All flexure specimens from the 26-ply laminate were polished to a mirror-finish and
imaged in-situ in the area of the expected tensile failure using a custom traveling microscope
equipped with a 10X objective lens and PointGrey Grasshopper GRAS-50S5M-C 5-megapixel
camera. The lens-camera configuration allowed for a field-of-view of approximately 0.88 mm ×
4
Li = 8.5
outer loading rollers
4PB inner supports
3PB center support
lubricated alignment
roller
b = 5 - 5.54
Configuration A Configuration B
31.8
Lo = 25.4
2,x
3
1 2,x
1
3
t =
cross-section
x
x
or4.73
3.59
10
0.75 mm, which made individual fiber cross-sections easily distinguishable (~0.36 μm/pixel
resolution). All specimens were loaded in displacement control at a rate of 0.15 mm/min.
Two different methods were used to acquire images during in-situ flexure testing of the 26-
ply polished specimens. The first method involved acquiring and overlapping images across the
specimen tensile side, approximately 9 images in either direction. Following testing, these
images were stitched together to create a 10.75 mm × 0.75 mm mosaic that provided high-
resolution macroscale view of the specimen. Because of the labor-intensive nature of this
process, only a few samples were imaged this way. The second method involved acquiring a
single image in the center of each specimen on the tensile side. For both methods, reference
images were taken at 13 N, and subsequent microscale imaging started at 133 N, and repeated
every 44.5 N until failure. Following in-situ imaging, for each sample, the microscale images
obtained at different loads were combined into an image stack in an image-processing program
ImageJ [42], and aligned using a template-matching algorithm [43]. Alignment of images
enabled visual detection of pre-existing and newly formed microscale cracks.
In addition to making in-situ surface observations mentioned above, a special 3PB fixture
was developed to investigate formation of internal microscale cracking across the specimen’s
width. This fixture, shown in Fig. 3, was designed to hold the specimen flexed at approximately
80% of average failure load using aluminum picture-frame and a quick-curing Buehler’s
SamplKwick two-part acrylic resin. After curing the acrylic resin at load, the specimen and the
picture-frame were subsequently removed from the load-frame, and serial-sectioned in the width
direction using 0.1 mm increments. The imaging was done on the tensile side using Keyence
VHX-5000 optical microscope at ~0.1μm/pixel resolution.
11
Figure 3. Test setup used to investigate formation of internal microscale cracking across specimen’s
width
2.1.2 Tensile tests The specimen geometry and the experimental setup for the tensile tests are shown in Fig. 4.
As shown this figure, the tensile specimens were nominally 53 mm long and 16 mm wide at the
widest. The central gage region was 35 mm long and contained a 97 mm constant-radius fillet on
both sides. This resulted in a 2.0 mm nominal width at the narrowest point. The filleted gage
region ensured localized failure in the center of the gage region and away from the grip
interfaces. The nominal specimen thickness prior to polishing was 3.59mm. The specimens were
loaded using open-face steel grips with 45° tapered faces which ensured specimen alignment
[40]. All tensile tests were performed in displacement control at a rate of 0.15 mm/mm using
Instron ElectroPuls E1000 load-frame equipped with a 1 kN load cell.
Figure 4. Specimen geometry and the experimental setup for the tensile tests (all units in mm)
loading rollerresin supply holes
encased specimen outer supports
applied load
cured resin
3.0
16.0
45°
Lg = 35.0
wmin= 2.0
rf = 97.0
tapered grips
1
2,x
3
tensile specimen
53.0
w(x)
12
2.2 Test matrix
A summary of the entire test matrix is presented in Table 1. In this table, the plate name
indicates the number of plies used in each laminate. For the 20-ply geometry, two laminates were
fabricated and these are additionally indicated with “-1” or “-2”. The 20- and 26-ply laminates
are treated as separate due to different lots (i.e. rolls) of prepreg used to manufacture each plate
type. Finally, all polished samples are marked with a “*”, while specimens used to examine the
difference in the out-of-plane or the in-plane YT are indicated with superscripts “A” and “B”,
respectively.
Table 1. The test matrix 3PB 4PB Tension
Study/plate name 20-1/-2 26 20-1/-2 26 20-1/-2 Volumetric effects and Weibull scaling 36 – 37 – 39
Micromechanical observations – 25* – 25* –
Effect of surface preparation 6*, 36 – – – – Effect of specimen orientation – 36*, 10B* – – –
*indicates polished. All flexure specimens are configuration A unless otherwise noted.
3. TWO-PARAMETER WEIBULL SCALING MODELS
In this study, the experimentally measured YT data was used to assess the suitability of
Weibull statistical strength theory [34] to predict the apparent strength of different specimen
geometries. Other cumulative functions have been proposed in the literature and applied to
strength scaling in composites, e.g. [44]. In the present work, the two parameter cumulative
function was selected due to its widespread use in the composites community and relative
simplicity. In view of the fact that this theory has been described extensivly in the open literature
[36,45-47], only a few key equations are presented here for brevity.
Following [34], the probablity of failure P as a function of applied stress σ is assumed to be
described by a general two-parameter Weibull cumulative distribution function
13
( )
−∫
−=V
m
dV
eP 01σσ
σ , (1)
where V is the specimen’s volume, σ0 is the scale parameter and m is the shape parameter or
“Weibull modulus” which describes dispersion of the strength data. For a given specimen, Eq. 1
is typically written as
( )
−
−=
m
cePσσ
σ 1 , (2)
where σc, the characteristic strength of the specimen, and m can be estimated based on least-
squares regression or maximum likelihood estimation [48]. It follows from Eq. 1 that the
characteristic strength of two specimens under uniform loading, made from the same material,
but with different volumes, V1 and V2, can be related according to the following scaling law
m
cc VV
1
1
22,1,
= σσ . (3)
For specimens loaded with a non-uniform stress field, Eq. 1 can be used to determine an
effective volume that, if loaded with a uniform stress field, would result in the same scaling in
characteristic strength as obtained in the specimen loaded with a non-uniform stress field.
Assuming that only tensile loads can cause failure, the effective volumes of the 3PB and 4PB
configurations are given by
( )233 121+
=− mVV PBPBeff , (4)
( )20
44 12
1
+
+=− m
mLL
VV
i
PBPBeff , (5)
14
where Li is the distance between the two inner rollers in the 4PB test, L0 is the distance between
the outer rollers, and V3PB and V4PB are the specimen volumes between outer rollers for the 3PB
and 4PB specimens, respectively. The reader is directed to references [45,46] for a detailed
derivation of these expressions.
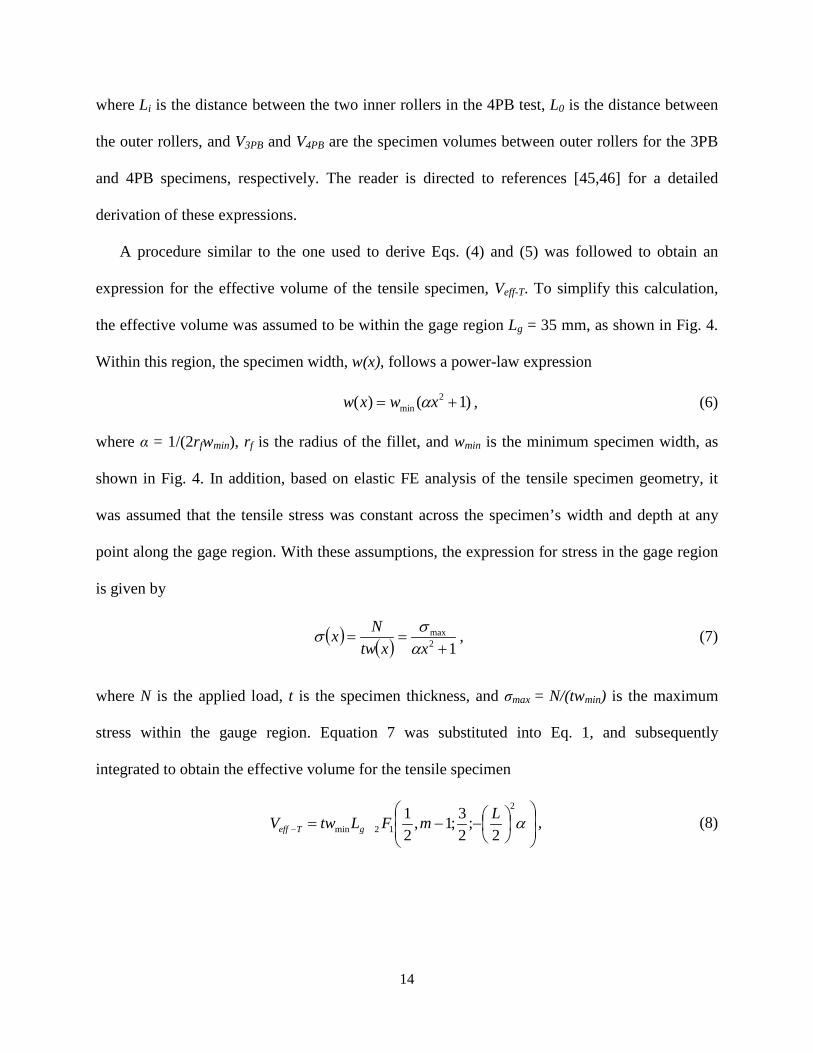
A procedure similar to the one used to derive Eqs. (4) and (5) was followed to obtain an
expression for the effective volume of the tensile specimen, Veff-T. To simplify this calculation,
the effective volume was assumed to be within the gage region Lg = 35 mm, as shown in Fig. 4.
Within this region, the specimen width, w(x), follows a power-law expression
)1()( 2min += xwxw α , (6)
where α = 1/(2rfwmin), rf is the radius of the fillet, and wmin is the minimum specimen width, as
shown in Fig. 4. In addition, based on elastic FE analysis of the tensile specimen geometry, it
was assumed that the tensile stress was constant across the specimen’s width and depth at any
point along the gage region. With these assumptions, the expression for stress in the gage region
is given by
( ) ( ) 12max
+==
xxtwNx
ασσ , (7)
where N is the applied load, t is the specimen thickness, and σmax = N/(twmin) is the maximum
stress within the gauge region. Equation 7 was substituted into Eq. 1, and subsequently
integrated to obtain the effective volume for the tensile specimen
−−=− α
2
12min 2;
23;1,
21 LmFLtwV gTeff , (8)
15
where 2F1 is the hypergeometric function [49]. The equations for effective volumes Veff-3PB, Veff-
4PB, and Veff-T can be used directly in Eq. 3 to scale between the characteristic strengths of the
three specimen geometries considered.
4. RESULTS AND DISCUSSION
4.1 Transverse tensile strength
For the 3PB and 4PB tests, YT was calculated using the following beam theory expressions
203
23
btLNY crPB
T = , (9)
204
btLNY crPB
T = , (10)
where Ncr is the critical force at the onset of macroscopic specimen failure, b is the specimen
width, and t is the specimen thickness. A discussion on the applicability of these equations for
calculation of YT can be found in the work by O’Brien and Krueger [50]. For the tensile test, YT
was calculated in the narrowest part of the specimen using
tw
NY crtensileT
min
= . (11)
Figure 5 shows stress-displacement curves obtained from flexure and tensile testing of all
unpolished 20-ply specimens. As seen in this figure, the macroscopic failure was defined by a
large drop in the stress. In all specimens, including those from tensile tests, failure always
occurred in the gage region (i.e. region of magnified tensile stress). For the 3PB specimens,
failure sites were within 0.7±0.6 mm from the central roller. For 4PB specimens, failure sites
were uniformly distributed between the two inner rollers, with a few specimens breaking within
0.8 mm outside the inner rollers. The location of failure sites for both flexure specimens was
similar to that observed in Ref. [19]. For tensile tests, average failure site was within ± 2.3 mm
16
from the narrowest part of the gage region. Detailed in-situ microscopic observations showed
some amount of microcracking prior to catastrophic failure in nearly all specimens observed (see
Section 4.3); however, no measurable change in specimen compliance was detected. The initial
nonlinearity observed during tensile tests (Fig. 5c) was related to specimen settling within the
tapered grips.
(a) 3PB flexure (b) 4PB flexure (c) tension
Figure 5. Force-displacement data from flexure and tensile testing of 20-ply unpolished specimens.
Table 2 and Fig. 6 summarize the transverse tensile strength test results. In Table 2, columns
1-5 present the type and number of tests performed, as well as the as-measured average
dimensions of the unpolished specimens. Columns 6 and 7 present the mean and scatter of YT
calculated based on Eqs. 9-11. Columns 8 and 9 give σc and m obtained by performing a 2-
parameter-Weibull fit to the measured YT values using Matlab’s ‘wblfit’ function [51]. Finally,
column 10 presents the average effective volume for each configuration calculated based on Eqs.
4, 5 and 8. Figure 6a shows the characteristic strength, σc, with the error bars corresponding to
the maximum and minimum values of YT; while Fig. 6b shows the YT data on a Weibull plot. In
Fig. 6b each symbol corresponds to a YT value obtained from an individual specimen, while the
straight lines indicate the Weibull fit with the Weibull modulus, m, as shown on the bottom of
each curve.
0
20
40
60
80
100
120
140
0 0.2 0.4 0.6 0.8
Stre
ss (M
Pa)
Displacement (mm)
0
20
40
60
80
100
120
140
0 0.2 0.4 0.6 0.8
Stre
ss (M
Pa)
Displacement (mm)
0
20
40
60
80
100
120
140
0 0.2 0.4 0.6 0.8
Stre
ss (M
Pa)
Displacement (mm)
17
Table 2. Summary of transverse tensile strength from 3PB, 4PB, and tensile tests.
Figure 6. Transverse tensile strength test results showing (a) characteristic strength σc with error bars corresponding to maximum and minimum values of YT, and (b) best fit of a 2-parameter-Weibull cumulative distribution function.
Examining Table 2, the average values and scatter of YT are within the bounds of what was
previously reported for this material system [19,52]. Examining Table 2, there is a very clear
trend of decreasing YT with increasing effective specimen volume, especially between flexure
and tensile tests. In Fig. 6b, the effect of increasing volume is indicated by the leftward shift of
the individual data sets. Examining Fig. 6b, the two-parameter Weibull model does a relatively
good job of predicting intermediate values of YT, but it provides a rather poor fit at the tails of
each distribution. Additionally, the Weibull slopes are different for each test geometry, which
seems to contradict the notion that this parameter is a material constant. Overall, the Weibull
slopes obtained from the flexure tests were slightly less than those reported in [19] for the same
material type. Note that the poor fit of the low strength values presented in Fig. 6b (i.e. left tail
end) can be improved by using a three-parameter Weibull model [53], however, additional
testing would be required to improve estimation of the location parameter.
3PB4PBtensileWeibull fit
m = 14.68 m = 11.89 m = 12.80
0.9990.990.960.90
0.75
0.50
0.25
0.10
0.05
0.02
0.01
40 60 80 100 120 140Pr
obab
ility
of fa
ilure
YT (MPa)
0
20
40
60
80
100
120
140
3PB 4PB tensile
Cha
ract
eris
tic s
treng
th, σ
c(M
Pa)
18
After initial data analysis, Equation 3 was used to scale the characteristic strength values
between the three different specimen configurations. In other words, for each test geometry, the
corresponding characteristic strength (i.e. σctest) and Weibull modulus (i.e. mtest) were used to
predict the characteristic strength for the remaining two test geometries. The results of this
scaling are summarized in Table 3 and Fig. 7.
Table 3. Weibull scaling of the characteristic strength between the three test geometries
Figure 7. Weibull scaling of the characteristic strength between the three test geometries
In general, when scaling between the two flexure configurations, the percentage difference is
relatively low and around 5%. The scaling under-predicts σc4PB based on the 3PB configuration,
and over-predicts σc3PB based on the 4PB configuration, which is the same relationship observed
by O’Brien et al. [19]. In general, the flexure tests data over-predict σctensile by 0.9-4.3%, while
the tensile test data under-predicts the flexure test data by 4.8-7.5%. Based on these results, one
can conclude that the two-parameter Weibull law does a relatively good job of scaling the
characteristic strength between the three geometries tested in this study. However, as mentioned
before, this model does a poor job of predicting, and therefore scaling, tail ends of YT
0
20
40
60
80
100
120
140
3PB 4PB tensile
σ c(M
Pa)
Actual Predicted
0
20
40
60
80
100
120
140
4PB 3PB tensile
σ c(M
Pa)
Actual Predicted
0
20
40
60
80
100
120
140
tensile 3PB 4PB
σ c(M
Pa)
Actual Predicted
19
distributions, which may result in relatively conservative predictions of transverse failure
initiation.
4.2 Effect of polishing and specimen orientation The effects of surface preparation and specimen orientation on YT are summarized in Figure
8. As seen in Fig. 8a, YT increases by approximately 36.5% when the specimens are polished to a
mirror finish. Although a limited number of 3PB specimens were used to reach this conclusion
(see Table 1), a p-value hypothesis test indicated this difference is statistically significant.
Assuming that polishing affects YT, an interesting consideration arises regarding which surface
preparation is more representative of a typical laminate. One can speculate that the type and
frequency of flaws in the subsurface plies is much different relative to the surface plies; and
therefore, selection of YT (i.e. either from unpolished or polished specimens) in PDA must be
done judiciously depending on the expected damage location.
(a) (b)
Figure 8. Effects of surface preparation and specimen orientation on YTave. Error bars correspond to maximum and
minimum values of YT.
Examining Fig. 8b, there appears to be little difference between YT obtained from
configuration A and B specimens. As seen in this figure, configuration B specimens appear to be
slightly stronger on average; however, this difference can be partly attributed to a 6.5% larger
volume of the configuration A specimens. The similarity between the two configuration types is
0
20
40
60
80
100
120
140
160
180
Mea
n st
reng
th, Y
Tave(M
Pa)
Mea
n st
reng
th, Y
Tave(M
Pa)
Configuration A
0
20
40
60
80
100
120
140
160
180
Configuration B
2,x
3
12,x
1
3
Polished Unpolished
20
not unexpected, and has been observed previously for other matrix-dominated properties in
IM7/8552 [54].
The values shown in Fig. 8 provide insight into the effects of specimen polishing and
orientation on YT; nevertheless, a larger set of tests would be valuable to strengthen further the
statistical significance of these findings. In particular, a larger data set may provide additional
information on the tail ends of YT distributions, however this was beyond the scope of this work.
4.3 Microscale observations
All microscale in-situ observations were performed using flexure specimens in the A-
configuration (i.e. fibers aligned with the specimen width). Tensile specimens were not imaged
due to difficulty in polishing the filleted 2-3 surface prior to testing. During testing, a majority of
flexure specimens were imaged using a “single-image” method, while a selected few specimens
were imaged over a larger area using the “multi-image” approach (see Sec. 2.1.1). The single-
image observations, performed over a central 0.88 mm × 0.75 mm region, revealed that nearly
65% of all specimens exhibited microscale cracking prior to reaching the critical load used to
calculate YT. In general, 21% of these microcracks were pre-existing, 79% formed during
loading, and all cracks had to be at least 5-10 μm long to be observed and thus recorded with
high confidence. The spatial extent and evolution of the observed microcracking is illustrated in
Figure 9 using images collected using the multi-image method applied to a 3PB specimen. The
four images in Figure 9, each collected at a different load level, show the evolution of
microcracks (symbols) overlaid on top of the underlying microstructure (background grayscale
images). The height of each image is approximately 4-plies or 0.75 mm, and the width is
approximately 10 mm. Each image is centered at the loading roller, as indicated by the solid
white lines. The location of ultimate specimen failure was ~0.5 mm left from the center, as is
21
indicated by a solid red line in the bottom-most image. This specimen was imaged at seven
loading intervals, but only four are shown here for brevity. At 178 N (45% of Ncr), 18
microcracks, marked with red squares, were observed within the imaged area. As the load was
increased to 267 N and 356 N (67% and 89% of Ncr), the number of cracks increased to 29 and
40, respectively. Out of all observed cracks, 86% were seen to grow larger than their size at
initiation. At each load, nearly half of the observed cracks occurred in pairs, indicating some
extent of interaction. Interestingly, nearly 85% of cracks were observed to initiate in regions of
low fiber-volume fraction. These regions, which appear as dark gray in Fig. 9, were likely
formed during tow spreading in the preimpregnation process. The remaining 15% of cracks
initiated near the specimen’s top edge, and these were likely influenced by presence microscopic
machining flaws and/or surface irregularities. The ultimate failure of this, and all other
specimens, was caused by rapid and unstable growth of a single dominant crack. In some cases,
as evident from post-mortem surface analysis, the single dominant crack was triggered by
interaction and coalescence of multiple smaller cracks. Finally, none of the observed
macroscopic failure sites initiated from the observed surface microcracks, suggesting that final
failure was always triggered on the specimens’ interior.
Figure 9. In-situ optical microscope observations of transverse microcracking during 3PB flexure testing (dimensions in mm)
-5 -3 -1 1 3 5-4 -2 0 2 4
45% Ncr
89% Ncr
67% Ncr
3% Ncr
ultimate failure site
0.75
cracks observed by 178 N cracks observed by 267 N cracks observed by 356 N
22
The single and multi-image analysis described above was performed in similar detail for
specimens that exhibited very low and high YT. These specimens, which represented the tail ends
of YT distributions, were analyzed to determine whether the microstructure had any influence
over the extreme values of YT. In general, no correlation was found between values of YT and any
of the observable microstructural features. These features include frequency and location of
microscale cracking, fiber clustering, presence of resin rich regions, and surface flaws. These
observations suggest that extreme values of YT are controlled by combined effect of the
microstructure, local mechanical fields, and local variability in the material properties (e.g.
strength of the resin and resin-fiber interface).
The formation of internal microcracks, and depth of the surface microcracks, was
investigated using the serial-sectioning method described in Sec. 2.2.1. An example of this
investigation is presented in Figure 10, which shows subsequent sections of the same
microstructural area imaged 0.2 mm below the top tensile edge, and 0.23 mm to the left of the
center roller. The four shaded fibers in each image are used as fiducial markers indicating that
the same area is being viewed.
(a) (b) (c) (d)
Figure 10. Results of serial sectioning of the 3PB specimen Examination of images in Fig. 10, and other similar regions, suggests that individual surface
cracks do not propagate deep into the center of the specimen. In the example shown, the surface
cracks (A and B) are visible 60 μm below the surface (Fig. 10b), but disappear in the next section
at 150 μm (Fig. 10c). Similarly, cracks C and D appear, respectively, at 60 and 150 μm below the
surface (Fig. 10b-c), but disappear in subsequent sections shown in Fig. 10c-d. Examination of
similar regions suggests that on average, at 80% of critical load, the microcracks were
approximately 100 μm in length and 5-50 μm in width.
The microscale observations performed in this study, including those presented in Figs. 9 and
10, are used to hypothesize a sequence of likely microscale events that lead to macroscopic
failure of the flexure specimens used to measure YT. This sequence, which is shown pictorially in
Fig. 11, begins with formation of short transverse cracks that initiate at loads as low as 40% of
Ncr. In general, these cracks appear to form in the region of high tensile stresses, which extends
several millimeters away from the specimen’s center in each direction. As the load is increased,
additional cracks initiate within the highly stressed area and the existing cracks extend in length.
Finally, when the load approaches Ncr, a single dominant crack, or a coalescence of multiple
microcracks, becomes unstable, triggering macroscopic failure of the entire specimen. This
sequence of events, if correct, may create a challenge in interpreting the meaning of YT. Given
the clear evidence of microscale crack formation well before macroscopic failure, one can argue
that YT represents a “structural” response of a given characterization specimen to accumulation
and unstable growth of microscale damage. It remains to be seen whether this “apparent”
material property can be used, with high confidence, to predict initiation of transverse failure in
tape laminates. The microstructural observations presented in this study suggest that, at the very
least, prediction of microscale transverse failure/fracture (i.e. at the scale of individual fibers)
should be performed using a different material property measured at the microscale. The
microscale fracture phenomenon, and in particular transverse microcrack coalescence, clearly
requires further attention. Additional studies (e.g. utilizing X-ray computed tomography or
24
micromechanical modeling) are needed to fully understand the processes of microscale crack
coalescence which may govern the statistical distribution of YT.
Figure 11. Proposed sequence of microscale events that leads to macroscopic failure of the 3PB flexure specimens
5. CONCLUSION
The aim of this study was to reexamine the way in which transverse tensile strength, YT, is
characterized for tape-laminate polymer-matrix composites. To this end, YT was measured using
3-point bend (3PB), 4-point bend (4PB), and tensile specimens fabricated using IM7/8552
carbon/epoxy. Given the well-documented issues with existing transverse tensile tests, a new
tensile dogbone specimen was developed to ensure consistent failure in the gage region. The
three distinct specimen geometries were intentionally selected to investigate the relationship
between specimens’ effective volume (i.e. volume subjected to tensile stresses) and the
magnitude and scatter of YT. In addition to YT characterization, a number of 3PB and 4PB
specimens were polished on the transverse (2-3) planes, and monitored in-situ during strength
testing. The in-situ observations were performed using a high-magnification optical traveling
microscope capable of resolving cracks at the length scale of individual fibers. These
observations, which were coupled with additional ex situ post-mortem imaging, were used to
develop a possible explanation of why existing strength-scaling theories (vis. Weibull theory)
Stre
ss
Displacement
YT
25
fail to properly model and scale the stochastic distribution of YT. Finally, additional 3PB
specimens were used to examine the effect of specimen surface preparation (i.e. unpolished vs.
polished), and specimen orientation (i.e. out-of-plane versus in-plane transverse failure) on YT.
The key findings resulting from this investigation include:
• The new tensile dogbone specimen configuration proposed in this study resulted in tensile
failure that occurred consistently within the gage region. This specimen geometry provides a
signification improvement over the current use of ASTM D3039 test method for
characterization of YT in uniaxial tension.
• In all, a large number of specimens were tested using the 3PB, 4PB, and tensile test
configurations, which offers a comprehensive survey of YT for IM7/8552. These tests
confirmed that YT depends on the specimen volume and surface finish; however, YT seems to
be insensitive to the direction of transverse failure. This latter observation is consistent with
those made for other inter- versus intra-laminar mode I fracture toughness.
• The magnitude of YT was found to be inversely proportional to increasing effective volume,
which is consistent with the Weibull statistical strength theory. Moreover, the 2-parameter
Weibull theory was found to be an adequate model for scaling the characteristic value of YT
among the three configurations considered. This notwithstanding, the 2-parameter Weibull
theory provided a rather poor fit at the tails of YT distributions, which may result in overly
conservative predictions of failure in numerical analysis.
• Detailed in-situ microscopic observations were performed on the tensile side of 3PB and 4PB
specimens during testing. These observations revealed that nearly all specimens exhibited
some amount of microcracking prior to catastrophic failure without measurable change in
specimen compliance. Post mortem examination of tested specimens revealed microcrack
26
formation across the entire specimen width. These observations, and the proposed sequence
of events leading to specimen failure, seem to violate the “weak-link” assumptions of the
Weibull strength scaling theory.
• The currently accepted approach for using single deterministic values of YT in PDA analyses
raises the question of which values (e.g. polished vs. unpolished, flexure vs. tension) should
be used moving forward? As such, this question challenges the predictive capability of
models where use of YT extends beyond prediction of damage onset (e.g. models that use
traction-separation laws).
6. ACKNOWLEDGMENTS
The authors would like to thank Dr. T. Kevin O’Brien from NASA Langley, and Dr. Jacob
Hochhalter from the Department of Mechanical Engineering at the University of Utah for their
technical support. This work was supported by the NASA Advanced Composites Project [grant
number NNX15AJ92A] with Dr. James Ratcliffe as the grant monitor.
REFERENCES
[1] S.T. Pinho, C.G. Dávila, P.P. Camanho, L. Iannucci, P. Robinson. 2005. “Failure Models and Criteria for FRP Under In-Plane or Three-Dimensional Stress States Including Shear Non-linearity.” NASA/TM-2005-213530.
[2] C.A. Rose, C.G. Dávila, F.A. Leone. 2013. “Analysis methods for progressive damage of composite structures.” NASA/TM-2013-218024.
[3] S.R., Hallett, M.R. Wisnom. 2006. “Numerical investigation of progressive damage and the effect of layup in notched tensile tests.” Journal of Composite Materials, 40(14):1229-1245.
[4] C. Bouvet, B. Castanié, M. Bizeul, J.J. Barrau. 2009. “Low velocity impact modelling in laminate composite panels with discrete interface elements.” International Journal of Solids and Structures, 46(14-15):2809-2821.
[5] N. Moës, J. Dolbow, T. Belytschko. 1999. “A finite element method for crack growth without remeshing.” Int. J. Numer. Methods Eng. 46(1999):131-150.
27
[6] T. Belytschko, T. Black. 1999. “Elastic crack growth in finite elements with minimal remeshing.” Int. J. Numer. Methods Eng. 45(1999):601-620.
[7] F.P. Van der Meer, L.J. Sluys. 2009. “A phantom node formulation with mixed mode cohesive law for splitting in laminates.” International Journal of Fracture, 158(2):107.
[8] N. De Carvalho, B. Chen, S. Pinho, P. Baiz, J. Ratcliffe, T. Tay. 2013. “Floating Node Method and Virtual Crack Closure Technique for Modeling Matrix Cracking-Delamination Interaction.” NASA/CR-2013-218022.
[9] E.V. Iarve, M.R. Gurvich, D.H. Mollenhauer, C.A. Rose, C.G. Dávila. 2011. “Mesh‐independent matrix cracking and delamination modeling in laminated composites.” International Journal for Numerical Methods in Engineering, 88(8):749-773.
[10] D.S. Dugdale. 1960. “Yielding of steel sheets containing slits.” J. Mech. Phys. Solids. 8 (1960):100-104.
[11] G.I. Barenblatt. 1962. “The Mathematical Theory of Equilibrium Cracks in Brittle Fracture.” Adv. Appl. Mech. 7(1962):55–129.
[12] A. Turon, P.P. Camanho, J. Costa, and J. Renart. 2010. "Accurate simulation of delamination growth under mixed-mode loading using cohesive elements: definition of interlaminar strengths and elastic stiffness." Composite Structures 92(8):1857-1864.
[13] A. Turon, P.P. Camanho, J. Costa, C.G. Davila. 2006. “A damage model for the simulation of delamination in advanced composites under variable-mode loading.” Mech. Mater. 38:1072–1089.
[14] K.H. Hoos, E.V. Iarve. 2018. "Discrete Damage Modeling of Matrix Dominated Failure Including Random Spatial Variation of Strength." In Proceedings of the American Society for Composites – 33rd Technical Conference on Composite Materials.
[15] ASTM Standard Test Method for Tensile Properties of Polymer Matrix Composite Materials, D3039/D3039M, 2008.
[16] T.K. O’Brien, S.A. Salpekar. 1993. “Scale effects on the transverse tensile strength of graphite/epoxy composites.” In Eleventh Volume: Composite Materials—Testing and Design. ASTM International.
[17] J.M.F. de Paiva, S. Mayer, M.C. Rezende. 2006. “Comparison of tensile strength of different carbon fabric reinforced epoxy composites.” Mater. Res. 9(1):83–90.
[18] I. De Baere, W. Van Paepegem, M. Quaresimin, J. Degrieck. 2011. “On the tension-tension fatigue behaviour of a carbon reinforced thermoplastic part I: Limitations of the ASTM D3039/D3479 standard.” Polym. Test. 30:625–632.
28
[19] T.K. O’Brien, A.D. Chawan, K. DeMarco, I. Paris. 2003. “Influence of specimen configuration and size on composite transverse tensile strength and scatter measured through flexure testing.” J Compos Tech Res, 25(1):3-2.
[20] D.F. Adams, T.R. King, D.M. Blackketter. 1990. “Evaluation of the transverse flexure test method for composite materials.” Compos. Sci. Technol. 39:341–353.
[21] R.E. Bullock. 1974. “Strength ratios of composite materials in flexure and in tension.” J. Compos. Mater. 8:200–206.
[22] J.M. Whitney, M. Knight. 1980. “The relationship between tensile strength and flexure strength in fiber-reinforced composites.” Exp. Mech. 20:211–216.
[23] M.S. Madhukar, L.T. Drzal. 1991. “Fiber-Matrix Adhesion and Its Effect on Composite Mechanical Properties: Tensile and Flexure Behavior of Graphite/Epoxy Composites.” J. Compos. Mater. 25:958–991.
[24] M. Maalej, V.C. Li. 1994. “Flexural/Tensile‐Strength Ratio in Engineered Cementitious Composites.” J. Mater. Civ. Eng. 6:513–528.
[25] L. Biolzi, S. Cattaneo, G. Rosati. 2001. “Flexural/Tensile Strength Ratio in Rock-like Materials.” Rock Mech. Rock Eng. 34:217–233.
[26] K.M. Prewo. 1986. “Tension and flexural strength of silicon carbide fibre-reinforced glass ceramics.” J. Mater. Sci. 21:3590–3600.
[27] M.P. Hardy, J.A. Hudson, C. Fairhurst. 1973. “The failure of rock beams: Part I—Theoretical studies.” Int. J. Rock Mech. Min. Sci., 10:53-67.
[28] G. Swan. 1980. “Fracture stress scale effects for rocks in bending.” Int. J. Rock Mech. Min. Sci. 17:317-324.
[29] Z.P. Bažant. 1984. “Size effect in blunt fracture: concrete, rock, metal.” J. Eng. Mech. 110:518-535.
[30] G.D. Quinn, R. Morrell. 1991. “Design Data for Engineering Ceramics: A Review of the Flexure Test.” J. Am. Ceram. Soc. 74:2037–2066.
[31] S. Nohut, A. Usbeck, H. Özcoban, D. Krause, G.A. Schneider. 2010. “Determination of the multiaxial failure criteria for alumina ceramics under tension–torsion test.” Journal of the European Ceramic Society, 30(16):pp.3339-3349.
[32] Z. P. Bazant. 2000. “Size effect.” Int. J. Solids Struct. 37:69-80.
[33] M.R. Wisnom. 1999. “Size effects in the testing of fibre-composite materials.” Compos. Sci. Technol. 59:1937–1957
29
[34] W. Weibull. 1939. “A statistical theory of the strength of materials.” Ingeniors Vetenskaps Akad. 151:1–4.
[35] J.L. Le, Z.P. Bažant, M.Z. Bazant. 2011. “Unified nano-mechanics based probabilistic theory of quasibrittle and brittle structures: I. Strength, static crack growth, lifetime and scaling.” J. Mech. Phys. Solids. 59:1322–1337.
[36] L.S. Sutherland, R.A. Shenoi, S.M. Lewis. 1999. “Size and scale effects in composites: I. Literature review.” Compos. Sci. Technol. 59:209–220.
[37] M.R. Wisnom, M.I. Jones. 1996. “Size Effects in Interlaminar Tensile and Shear Strength of Unidirectional Glass Fibre/Epoxy.” J. Reinf. Plast. Compos. 15:2–15.
[38] M.R. Wisnom, B. Khan, S.R. Hallett. 2007. “Size effects in unnotched tensile strength of unidirectional and quasi-isotropic carbon/epoxy composites.” Compos. Struct. 84:21–28.
[39] J. H. Crews, R. A. Naik. 1993. “Measurement of multiaxial ply strength by an off-axis flexure test.” In Eleventh Volume: Composite Materials—Testing and Design. ASTM International.
[40] B.C. Salzbrenner, J.M. Rodelas, J.D. Madison, B.H. Jared, L.P. Swiler, Y. Shen, B.L. Boyce. 2017. “High-throughput stochastic tensile performance of additively manufactured stainless steel.” J. Mater. Process. Technol. 241:1–12.
[41] Y. Ng, J. Tomblin. 2011. “NCAMP Process Specification” NPS 81228, Revision B.
[42] J. Schindelin, et al. 2012. “Fiji: an open-source platform for biological-image analysis.” Nature Methods 9:676-682.
[44] M.R. Gurvich, A.T. DiBenedetto, S.V. Ranade. 1997. “A new Statistical distribution for characterizing the random strength of brittle materials." J. Mater. Sci. 32(10):2559–2564.
[45] “ASTM Standard Practice for Size Scaling of Tensile Strengths Using Weibull Statistics for Advanced Ceramics.” C1683, 2015.
[46] R. Jain. 2008. “Effective area and effective volume calculations for ceramic test specimens.” M.S. Thesis, Cleveland State University.
[47] F.W. Zok. 2016. “On weakest link theory and Weibull statistics.” J. Am. Ceram. Soc. 1265-1268.
[48] F.N. Nwobi, C. Anderson Ugomma. 2014. “A Comparison of Methods for the Estimation of Weibull Distribution Parameters.” Metod. Zv. 11:65–78.
30
[49] G.E. Andrews, R. Askey, R. Roy. 2000. “Special functions.” Cambridge University Press, Vol. 71.
[50] T.K. O’Brien, R. Krueger. 2001. “Analysis of Ninety Degree Flexure Tests for Characterization of Composite Transverse Tensile Strength.” NASA/TM-2001-211227.
[51] MATLAB Release 2014a, The MathWorks, Inc., Natick, Massachusetts, United States.
[52] “Hexcel 8552 IM7 Unidirectional Prepreg 190 gsm & 35%RC Qualification Material Property Data Report,” NCAMP Test Report Number: CAM-RP-2009-015 Rev A, April 22, 2011.
[53] B.L. Boyce. 2010. “A Sequential Tensile Method for Rapid Characterization of Extreme-value Behavior in Microfabricated Materials.” Exp. Mech. 50:993–997.
[54] M.W. Czabaj, J,G. Ratcliffe. 2014. "Comparison of intralaminar and interlaminar mode I fracture toughnesses of a unidirectional IM7/8552 carbon/epoxy composite." Composites Science and Technology 89: 15-23.


![INTER PARTES REEXAMINATION · INTER PARTES REEXAMINATION MATTHEW A. SMITH Edition 1E Current through October, 2008. Cite as: MATTHEW A SMITH, Inter Partes Reexamination, Ed. 1E, [pages]](https://static.documents.pub/doc/80x56/5ecb37b9cdee0f38d742abe1/inter-partes-reexamination-inter-partes-reexamination-matthew-a-smith-edition-1e.jpg)


