+ All Categories
Home > Documents > Experimental research into interlaminar tensile strength ...

Experimental research into interlaminar tensile strength ...

Date post: 23-Mar-2022
Category:
Upload: others
View: 5 times
Download: 0 times
Share this document with a friend
16
Accepted Manuscript Experimental research into interlaminar tensile strength of carbon/epoxy lami- nated curved beams David Ranz, Jesús Cuartero, Antonio Miravete, Ramón Miralbes PII: S0263-8223(16)31348-4 DOI: http://dx.doi.org/10.1016/j.compstruct.2016.12.010 Reference: COST 8065 To appear in: Composite Structures Received Date: 27 July 2016 Revised Date: 22 October 2016 Accepted Date: 5 December 2016 Please cite this article as: Ranz, D., Cuartero, J., Miravete, A., Miralbes, R., Experimental research into interlaminar tensile strength of carbon/epoxy laminated curved beams, Composite Structures (2016), doi: http://dx.doi.org/ 10.1016/j.compstruct.2016.12.010 This is a PDF file of an unedited manuscript that has been accepted for publication. As a service to our customers we are providing this early version of the manuscript. The manuscript will undergo copyediting, typesetting, and review of the resulting proof before it is published in its final form. Please note that during the production process errors may be discovered which could affect the content, and all legal disclaimers that apply to the journal pertain.
Transcript

Accepted Manuscript

Experimental research into interlaminar tensile strength of carbon/epoxy lami-nated curved beams

David Ranz, Jesús Cuartero, Antonio Miravete, Ramón Miralbes

PII: S0263-8223(16)31348-4DOI: http://dx.doi.org/10.1016/j.compstruct.2016.12.010Reference: COST 8065

To appear in: Composite Structures

Received Date: 27 July 2016Revised Date: 22 October 2016Accepted Date: 5 December 2016

Please cite this article as: Ranz, D., Cuartero, J., Miravete, A., Miralbes, R., Experimental research into interlaminartensile strength of carbon/epoxy laminated curved beams, Composite Structures (2016), doi: http://dx.doi.org/10.1016/j.compstruct.2016.12.010

This is a PDF file of an unedited manuscript that has been accepted for publication. As a service to our customerswe are providing this early version of the manuscript. The manuscript will undergo copyediting, typesetting, andreview of the resulting proof before it is published in its final form. Please note that during the production processerrors may be discovered which could affect the content, and all legal disclaimers that apply to the journal pertain.

1

Experimental research into interlaminar tensile strength of

carbon/epoxy laminated curved beams

David Ranza,*

, Jesús Cuarterob, Antonio Miravete

c, Ramón Miralbes

a

a.Departamento de Diseño y Fabricación, Universidad de Zaragoza, Zaragoza, Spain

b.Departamento de Ingeniería Mecánica, Universidad de Zaragoza, Zaragoza, Spain

c.ICMA, Zaragoza, Spain

Abstract

The interlaminar tensile strength of carbon/epoxy laminated curved beams with variable

thicknesses is experimentally studied by means of a four-point-bending test. Firstly, the

relationships between the used formulae and the results obtained are analyzed on the curved

beams with different thicknesses and tested in compliance with ASTM D6415 standard.

Secondly, both the interlaminar tensile stresses and the post-failure behavior are determined.

Finally, the critical area, where delamination begins, is reinforced through-the-thickness by

means of tufting technology with different densities. The influence on the maximum interlaminar

tensile stress as well as delamination evolution of the carbon/epoxy laminated curved beams

are analyzed. These results play an important role in the prediction of interlaminar tensile

strength and post failure behaviour of laminated curved beams.

Keywords

Interlaminar tensile strength, Delamination, Four-point-bending, Laminated curved beam,

Tufting

1. Introduction.

Composite materials whose geometry includes important bending radii are commonly found in

engineering structures, in a wide range of fields such as aeronautics, maritime industry, energy

or civil construction [1]. These components´ failure mainly occurs due to interlaminar tensile

strength, leading to interlayer delamination [2, 3]. It is crucial therefore to determine interlaminar

tensile strength (ILTS) if an efficient design is to be achieved. There are several experimental

methodologies available to determine ILTS. Some direct load methods can be found in ASTM

C297 [4] and ASTM D7291 [5], while indirect methods are described by Ko [6], Martin [7], Roos

[8] and Makeev [9]. Detailed discussions about pros and cons of both methods are presented by

Hara [10] and Vänttinen [11]. Also, numerical methodologies to predict ILTS are proposed in

several studies, such as those carried out by Avalon [12], Raju [2] and Ross [8] . In this study an

indirect load methodology – a four point bending test in accordance with ASTM D6415 is used

[13]. In this test a couple of bending moments in the test coupon arms are generated, with the

ensuing pure bending of the section studied. This methodology has various advantages over

other indirect methods: stress is irrespective of angular position, the bending moment in the

tested section is constant, with an ensuing simplification for ILTS calculation and self-alignment

of the coupon. [14]. In addition, it is a more realistic approach to determining interlaminar tensile

strength for many applications with a curved geometry, and authors such as Cui [3] or Jackson

[14] in their research validate the use of curved beams under four point bending so as to obtain

interlaminar tensile strength values.

���������������������������������������� ��������������� �* Corresponding author. E-mail address: [email protected]

2

This study seeks to experimentally assess how Interlaminar Tensile Strength (ILTS) is affected

varying laminated thicknesses. To that aim, unidirectional 4,8,12 carbon/epoxy layered

laminated curved test coupons are made.

On the same type of specimen, the effect on ILTS of stitching through the thickness by means

of glass fibre threads for different stitching densities is studied. To carry out this reinforcement,

the tufting technique is used, which allows to dry reinforce textile preforms solely through one

sided access.

2. Experimental procedure

The testing methodology used is the one under ASTM D6415 standard, which determines the

curved beam strength of a composite material reinforced by means of a continuous fibre,

through the use of a curved beam specimen (Figure 1). CBS is defined as the bending moment

per width unit needed to be applied on the tested curved section in order to cause an abrupt

drop of the load applied. The curved beam comprises two perpendicular straight legs connected

by a 90º curve with an interior radius inferior to 6.4mm [13].

When the load is applied at a constant velocity of 0.5 mm/min, we find an out-of-plane tensile

stress (through the thickness) on the test coupon´s curved region. This test method has the

limitation of being exclusively used with those composites consisting of fabric layers or

unidirectional fibre layers.

ASTM D6415 standard sets up a standardized procedure to determine ILTS in composite

material´s test coupons. It is specifically defined for interlaminar tensile strength calculation in

unidirectional fibre layered reinforced materials.

The curved beam is loaded on four points in order to apply a constant bending moment through

the curved section to be tested. The tensile state on the coupon´s curved area undergoing a

four-point bending is complex. Circumferential tensile stresses (on the specimen plane) take

place along the inner surface, and circumferential compression stresses take place on the outer

surface. The radial tensile stresses (out-of-plane) range from zero on the inner and outer

surfaces to a maximum peak of a third of the inner surface thickness [13]. Consequently, failure

must be carefully observed in order to ensure that delamination takes places through the

thickness before failure data can be regarded as valid.

Since there are non-uniform stresses and the critical stress state happens in a small region, the

localization of a coupon´s architectural characteristics (e.g. fabric interweaving, threat

intersection) may impact on curve beam strength. Failure in non-unidirectional coupons can be

initiated from cracks on the matrix or tensions on the free edge. Consequently, interlaminar

strength calculated from non-unidirectional specimens may be erroneous.

Figure 1. ASTM D6415 Test: [13] Diagram (left.); actual test coupon placement (right).

3

Coupons are set on the 4 point bending test fixture so that a load may be applied, as shown in

Figure 1 and Figure 3.The cylindrical loading bars have a diameter (D) of 10 mm and they are

mounted on roller bearings. A distance of 100 mm (lb) between bottom loading bars and 75 mm

(lt) between top loading bars on the four-point-bending fixture is applied. This fixture has been

manufactured in high strength carbon steel. An Universal testing machine INSTRON, model

8032 has been used, velocity is set to 0.5 mm/min, maximum capacity is up to 100 kN.

To determine CBS from the force applied on the first brusque drop in the load, corresponding to

initial delamination, it is only necessary to know the actuating moment, as the 4 point bending

test submits the specimen to a pure bending moment in its curved area. The moment applied to

the curved section in the specimen is the product of the force exerted by one of the cylindrical

bars, Pb,, and the distance lo between two bars along one leg (1). The strength of the bar is

calculated by means of the total force in the first drop, and the distance is determined through

the load tooling and test coupon´s geometry (1).

��� � ���� � � �� ������� �� ����� � �� � ���������(1)

CBS is obtained from the preceding equation, where φ stands for the angle in degrees of the

loading arm from the horizontal plane, dx stands for the horizontal distance between the centres

of the adjacent upper and lower rollers (lb-lt)/2, D stands for the diameter of the loading rollers, t

stands for the thickness and w stands for the test coupon´s width.

Given the fact that φ may significantly vary during the loading process, the value of φ at the

moment of failure may be considered in order to obtain a more precise value of the applied

moment. In order to calculate φ during the loading, it is necessary to calculate the vertical

distance between the loading rollers, dy, by deducting the vertical displacement, ∆, applied by

the test fixture, from the initial value of dy.

�� � ��������� � � � � ������ �

(2)

The initial value of dy is calculated from the initial angle, φi, and from the geometry setup. The

initial angle, φi, is half the global angle between the specimen´s arms before the test. By means

of trigonometric functions, a value of φ can be worked out for a given value of dy.

� � �!�"# $����� � �� � ��%��& � ��& � �& ���� � �&��& � ��& ' (3)

The rest of the equation parameters (3) remain unchanged during the whole loading process.

To calculate the stresses on a curved beam with cylindrical anisotropy under a pure bending

moment, equations (4) and (8) were developed by Lekhnitskii [15] and adopted by many other

authors [14, 3, 1].

() �����*�&+ ,- � - � ./0#- � .&/ �*1*� �/"# � -� ./"#- � .&/ ./0# �*�*1�

/0#2 (4)

(3 �����*�&+ ,- � - � ./0#- � .&/ 4 �*1*� �/"# � -� ./"#- � .&/ 4./"# �*�*1�

/0#2

4

(5) 5)3 � 0

(6)

Where:

+ � - � .&� � 44 � -�- � ./0#�&- � .&/ � 4.&4 � -�- � ./"#�&- � .&/

4 � 7838)

. � *�*� (7)

*1 � ,�- � ./"#��4 � -��.*��/0#�- � ./0#��4 � -�*�"�/"#� 2#&/

(8)

Maximum radial stress, or out-of-plane stress, is worked out by using equation (4) and CBS

obtained from the equation (1). Moduli in the radial direction, Er, and circumferential direction,

Eθ, are equivalent to transversal moduli, E3, and longitudinal moduli, E1, respectively, of a

laminated plane. ILTS is defined as the maximum radial stress or the ordinary interlaminar

stress in the moment of failure, or when delamination begins.

When ratio Eθ/Er is lower than 20, an approximation can be made in order to simplify the

equation (4), with a margin of error lower than 2% as when compared to a conventional

solution. This approximation is shown in equation (9). Its precision decreases whenever the

Eθ/Er ratio increases on when the ratio ri/ro (ρ) decreases [16].

()19� � 3 ∙ �����%*�*�

(9)

3. Manufacturing of test coupons

The curved specimens were made from unidirectional carbon fabric (866 gr/m2) and an epoxy

resin system, by applying a liquid resin infusion processing technique (LRI). Three different

thickness were obtained by stacking 4, 8 and 12 layers; to that aim, unidirectional carbon was

oriented towards the test coupon´s legs and along the curved area. Since this test method is

highly sensitive to manufacturing process, with potential large dispersions, special attention was

paid to fibre-alignment and to subsequent test-piece mechanization.

Figure 2. Resin infusion curved plate manufacturing.

5

Figure 3. Curved Specimens: Dimensions ASTM D6415 (left); 4, 8 and 12 layered test coupons

(right).

4. Test Results on UD test coupons

Figure 4 shows the graphs associating the applied load with the loading head displacement for

six specimens with 4, 8 and 12 unidirectional carbon layers, with an average thickness of 3.8,

6.7 and 9.9 mm respectively. In these graphs it can be seen that the specimens basically

deform elastically as far as they reach a maximum load depending on the test coupon´s

thickness, with an ensuing abrupt drop in the load, a point when delamination begins, generally

localized at 1/3 thickness from the inner radius. As a consequence there is a pronounced drop

of the load, occasionally that would undergo a subsequent recovery to reach loading values

nearing the load where initial failure happens. The delamination of other interfaces will

subsequently begin.

Layers

Average

Thickness

(mm)

Maximum

Load (kN)

Initial

Delamination

Location

4 3.8 1-1.2 2-3

8 6.7 1.6-1.8 3-4

12 9.9 2.3-2.7 4-5

Figure 4. Load displacement graph showing for curved specimens

6

5. Determination of Properties and result of analysis

While CBS is being determined, equation (1), it is essential to bear in mind the variation in the

angle φ that happens throughout the test, between the test coupon´s legs and the horizontal

plane (see Figure 1), by using equations (2) and (3). This is even more relevant in the case of

those coupons with fewer layers, since, due to their higher flexibility, the variation in the angle

has a much higher impact on the moment of bending upon failure. For 4 layered coupons we

find that there is a variation of about 5º in the initial angle φi, with an ensuing CBS reduction of

19.9%.

As for 8 layered and 12 layered coupons, with a higher stiffness, there is, respectively, a

variation of 2.3º and 1.8º from the initial angle. This means a CBS reduction of 9.9% and 7.7%.

The effect of the correction on the angle φ for the CBS curve weighed up against the

displacements for different thicknesses´ stacking can be seen in Figure 5.

Table 1.CBS results as shown by φ or φi.

CBS with no

correction φ

(N·mm/mm)

Angular

Deflection

φi

CBS

(N·mm/mm)

CBS Variation

Coefficient

(%)

4 layers 1252 5.2 1002 -19.9%

8 layers 2158 2.3 1945 -9.9%

12 layers 3431 1.8 3167 -7.7%

Figure 5. CBS vs. displacement with or without φ correction

Conversely, when ILTS calculation is made, ASTM D6415 standard suggests a simplified

formulation in order to speed up the determination of this property when the Eθ/Er ratio is under

20. Special attention must be paid to this requirement, as the use of this simplified formula can

lead to significant deviations from those obtained by means of the traditional formula by

Lekhnitskii [15].

The standard indicates that the simplified formulation (4) can be used in order to facilitate ILTS

calculation. For the analysed laminates, ratio Eθ/Er presents a value of 13.71, adopting the

7

properties obtained from the material mechanical characterization: Eθ = E1 = 122 GPa y Er = E2=

8.9 GPa. In Table 2, we observe that for each case ILTS value is lower when Lekhnitskii´s

formulation is used. In addition, the deviation occurring when using the simplified formula is

significant enough so as to require the ruling out of the simplified equation´s use. It can be

observed that when the specimens are of a higher thickness, that is, when the ratio ri/ro (ρ)

decreases, the precision from the simplified solution is significantly lower, with deviations of up

to 7.4% for the 12 layer coupons.

Table 2. Deviation of the Simplified Equation from Lekhnitskii´s formulation [15].

Simplified Formulation Lekhnitskii´s Formulation Deviation (%)

ILTS s (MPa) CV (%) ILTS (MPa) CV (%)

4 layers 52.89 9.23 51.76 11.44 2.14

8 layers 46.65 5.85 43.83 9.95 6.04

12 layers 46.68 10.28 43.23 9.64 7.39

When compared to ILTS values obtained through Lekhnitskii´s formulation, considered as the

valid ones for the purposes of this study, it can be observed that the average values for 4, 8 and

12 layers were 51.76, 43.83 and 43.23 MPa, respectively. A diminution in ILTS value can be

noticed when specimen´s thickness increases, due to the volumetric effects that can be

incurred, that is, a presence of a higher number of defects, such as gaps or resin accumulation

and higher residual stresses, which may induce delamination. This phenomenon has already

been reported by other authors [3, 17, 1] in their studies on ILTS.

6. Carbon laminates reinforced through the thickness by means of tufting

It is obvious that carbon laminates have excellent in-plane properties, but their interlaminar

properties are much lower. Their performance when subject to out-of-the-plane requirements is

their weak point for specific applications. It would be interesting, therefore, to make

improvements in their out-of-the-plane properties. One possible strategy is the through-the-

thickness reinforcement. This study has opted for the use of the so-called tufting technique. Its

implementation in textile reinforcements is relatively simple, as only one-sided access to the

preform is required. However, it is important to minimize the amount of reinforcement through-

the- thickness in order to prevent a significant degradation of its in-plane properties. Tufting is a

breakthrough technique with a variation in the stitching technique. It consists of inserting just

one needle, taking the thread through the thickness of the reinforcing layered preform, and

returning it via the same route, leaving the fibre behind within the structure thanks to the existing

friction between the fabrics and the thread [18, 19]. This technique stitches the preform without

any knots amongst the threads, thus preventing those problems on the surface layers caused

by stitching and the ensuing degradation of its mechanical properties.

8

Figure 6. Tufting: Stitching Robot (left.); stitching head (centre) and process scheme (right).

The presence of external ribbons or loops is typical of this process and makes it easily

recognizable (see Figure 6).This methodology can be regarded as a technical improvement on

low-stress stitching technique. Despite these advantages, those textile preforms made by

applying this technique demand higher precautions when manipulated, as the thread´s loose-

end can be easily pulled out, particularly from its ends [20].

As for the effect of tufting on laminate properties, authors such as M. Colin de Verdiere [21]

compared laminate behaviour and performance under traction, compression, shear and

delamination in mode I and II, against non-stitched laminates. Tufting reduces the modulus and

strength in the laminate plane under tensile loads, owing to misalignment and damage from the

needle. This influence is even more remarkable under compression efforts. As for resistance to

delamination, a significant increase could be observed when tufting was used G. Dell´Anno [22]

studied tufting influence on a fibre carbon laminate subjected to Compression After Impact

(CAI). An approximate 26% increase in resistance to compression after impact was obtained.

Likewise, in that study, an analytical model for prediction on stitched laminates was developed.

Other studies, such as the one by Smith [23] on fracture resistance, demonstrate that resistance

to fracture in mode I (GIC) and mode II (GIIC) shows a significant improvement, with a 100 %

improvement for mode I and a 50% improvement for mode II when compared to UD

preimpregnated composites performance.

Reinforcement through-the-thickness stitching is carried out by means of a continuous glass

fibre thread with the commercial name EC9 68x3 S260 properties are shown in Table 3. For

each configuration two stitching densities are used in order to study their influence on the test

coupons´ behaviour and their ILTS. The densities used are designated as D1 and D2. In the

first case, glass fibre threads separated in both directions every 10 mm are introduced, whereas

in the second the separation is 5 mm (see Figure 7).

Table 3. Glass Fibre thread properties used for tufting stitching.

Property Value

Density 2.6 kg/dm3

Linear Density 1200 tex

Strands amount 204 (3x68)

Strand diameter 9 µm

Maximum Load (non-impregnated) 93 N

Tensile Modulus 73 GPa

9

Figure 7. Tufting density 5 mm (left). Density stitching scheme (right).

Figure 8 shows graphs associating the load being applied with load head displacement, for 4, 8

or 12 layered unidirectional carbon specimens, reinforced with 10 or 5 mm stitching densities.

As for those 10 mm density stitched specimens, the existence of a high dispersion in the results

can be observed, as there are major differences for the loads and the displacement reached at

the moment of failure. There is also a difference in post-failure behaviour, since, for some test

coupons there is a sharp drop in load whereas for the others the drop observed is much more

limited. As it will be shown later on, these results from the fact that since we are dealing with a

low reinforcement density, the stitching position for these specimens will highly influence the

specimen´s behaviour.

When compared to 5 mm density specimens (density 2), it can be observed that specimens

deform, basically, in an elastic way until they reach a maximum load. There is an ensuing small

drop in the load, coinciding with the beginning of delamination. This drop is rapidly checked,

initializing the recovery in the coupon´s loading capacity with near initial gradients, with small

punctual losses in the loading capacity coinciding with the progression of the delamination

process. A recuperation in the specimens´ load bearing capacity can be appreciated, but not so

pronounced in the case of the 12 layered coupons.

� D1 o D2

D1 o D2

10

Figure 8. Load- displacement graph for curved test coupons: left) D1, right) D2.

As with non-stitched laminates, Lekhnitskii´s complete formulation is used in order to prevent

major ILTS value distortions. As can be seen in Figure 9, deviations when using the simplified

formula can be excessive in the case of stitched coupons. This deviation increases when the

specimens´ thickness is higher. For instance, the most unfavourable case takes place in

specimens with density 1 and 12 layers in their thickness, where 21% deviation is found.

Figure 9. Comparative graphs for simplified equation vs Lekhnitskii´s (density 1 and 2).

When analysing results for tufting reinforced test coupons, it can be seen that, as happens in

those non-stitched test coupons, ILTS values decrease in as much as their thickness increases,

due to volumetric effects [3, 17, 1]

When tufting specimens with density 1 are compared, it can be noticed that they present a

higher deviation in their results both for the specimen´s stiffness and final load reached.

Furthermore, density 1 stitching produces a negative effect on ILTS value, with the result that

11

the higher the number of layers, the more damaging the effect. An ILTS worsening of 4%, 14%

and 16% can be observed for 4, 8 and 12 layered test coupons, respectively. However, for

density 2 reinforcement, with bidirectional 5 mm stitches, a substantial improvement in ILTS

values can be noticed. And the lower the number of layers in the specimen, the sharper the

improvement found. Table 4 shows ILTS improvements of 39%, 34% and 11% for 4, 8 and 12

layered specimens, respectively.

Table 4. Tufting influence on ILTS for different densities.

Non-stitched Density 1 Density 2

ILTS (MPa) ILTS (MPa) Variation ILTS (MPa) Variation

4 layers 51.76 49.61 -4.1% 72.14 39.4%

8 layers 43.83 37.57 -14.3% 58.84 34.2%

12 layers 43.23 35.95 -16.8% 48.25 11.6%

Figure 10. Graph comparison for tufting influence on ILTS.

This phenomenon finds its justification in the fact that density 1 (10 mm) is very low, that the

specimen´s reinforcement threads are very spaced out when considering the specimen 25 mm

width used for testing. For this density, the 2 or 3 reinforcement stitches in the width (see Figure

11) do not provide sufficient reinforcement to cancel out those negative effects from stitching,

such as carbon fibre misalignments and breakage or the generation of resin rich areas around it

[24, 25]. As a result we find worse ILTS results when compared to non-stitching configuration,

and in general, a higher divergence in results, particularly in terms of stiffness (see Figure 8). In

addition, owing to this low density, stitches are far from the central bending area (see Figure 12)

where the beginning of delamination has been observed.

Conversely, for density 2 (5 mm) test coupons, there are always 4 or 5 stitches in the width of

the specimen (see Figure 11) and the presence of some thread close to the central bending

area is guaranteed (see Figure 12). This leads to higher ILTS values and lower spread in

results. Therefore, a 5 mm gap between reinforcement stitches is the most suitable density in

order to improve interlaminar properties and ILTS in particular. Since higher densities lead to a

significative in plane properties reduction [21].

Density 1 (10 mm) Density 2 (5 mm)

12

Centred Displaced Centred Displaced

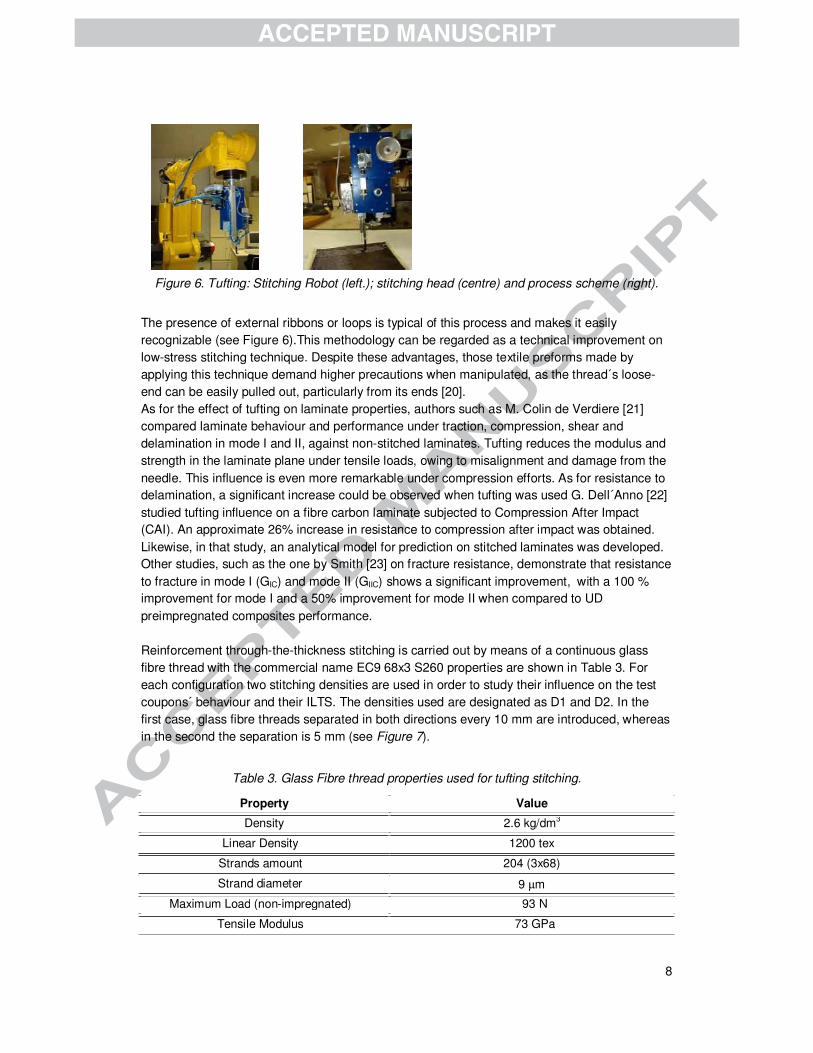
Figure 11. Distortion caused by tufting on the test coupon (25mm) standard width.

Density 1 (10 mm)

Density2 (5 mm)

Figure 12. Stitching thread presence in the curved area according to density

Figure 13 shows graphs for non-stitching test and for those with two variable stitching densities

for 4, 8 and 12 layered test coupons. In them we can observe the loading differences reached in

the moment of failure and a high similarity in coupon, stiffness regardless of the presence or

absence of stitching. As for test coupons’ post-failure behaviour, it can be noticed that for those

non-stitched specimens, there is no load capacity recovery, whereas for those test coupons with

stitching, the capability of increasing their load level remains, this effect being higher in the case

of test coupons with a higher stitching density (density 2). This capacity for the test coupon to

maintain its structural strength results from the stitching threads acting as an anchor between

the different layers, therefore preventing progression in delamination.

13

Figure 13. Load-displacement graphs for non-

stitched test coupons´, density 1 and density 2

for 4, 8 and 12 layers.

7. Conclusions

Three main conclusions have been obtained from this study.

A decrease in ILTS when laminate thickness increases can be observed.

The update in the angle of the specimen´s leg with respect to the horizontal plane at the

moment of test coupon´s failure cannot be dismissed: for CBS calculation; also for ILTS value

calculation, the use of the complete formulation as opposed to the simplified one, as there are

significant deviations in the results obtained.

In the search for an improvement in ILTS two different stitching densities were used, in order to

determine a suitable tufting density for ILTS improvement. With a 5x5 mm density,

improvements of up to 40% are obtained for 4 layered coupons and of up to 12% for 12 layered

coupons; this technique resulting most effective, with the thinner the specimen. When higher

stitching densities are used, better out-of-plane properties are achieved; nevertheless, this

would have a negative impact on in-the-plane properties, with fibres damaged by stitching.

Furthermore, with reinforcement by means of tufting technique, a higher residual capacity to

load bearing is achieved once delamination has occurred.

References

[1] W. Hao, D. Ge, Y. Ma, X. Yao y Y. Shi, «Experimental investigation on deformation and strength of carbon/epoxy laminated curved beams,» Polymer Testing, vol. 31, nº 4, p. 520–526, 2012.

[2] D. Raju, «Delamination damage analysis of curved composites subjected to compressive load using cohesive zone modelling,» QuEST Global, 2014.

[3] W. Cui, L. Jianxin y R. Ruo, «Interlaminar tensile strength (ILTS) measurement of woven glass/polyester laminates using four-point curved beam specimen,» Composites Part A, vol. 27A, pp. 1097-1105 , 1996.

[4] «ASTM C 297-04 - Flatwise Tensile Strength of Sandwich Constructions,» W. Conshohocken, Pa., 1954.

[5] «ASTM D 7291-07 - Through-Thickness ‘Flatwise’ Tensile Strength and Elastic Modulus of a Fiber-Reinforced Polymer Matrix Composite Material,» West Conshohocken, PA, 2007.

[6] W. Ko, «Delamination stresses in semicircular laminated composite bars,» Nasa Report, 1988.

[7] R. Martin, «Delamination failure in an unidirectional curved composite laminate,» National Aeroespatial and Space Administration, Langley Research Center, 1990.

14

[8] R. Roos, G. Kress, M. Barbezat y P. Ermanni, «Enhanced model for interlaminar normal stress in singly curved laminates,» Composite Structures, vol. 80, p. 327–333, 2007.

[9] A. Makeev, P. Carpentier y B. Shonkwiler, «Methods to measure interlaminar tensile modulus of composites,» Composites: Part A, vol. 56, p. 256–261, 2014.

[10] E. Hara, T. Yokozeki y H. Hatta, «Comparison of out-of-plane tensile strengths of aligned CFRP obtained by 3-point bending and direct loading tests,» Composites: Part A, nº 43 , p. 1828–1836, 2012.

[11] A. Vänttinen, «Strength Prediction of Composite Rib Foot Corner,» Master's Thesis, Helsinki University of Technology, 2008.

[12] S. Avalon y S. Donaldson, «Strength of composite angle brackets with multiple geometries and nanofiber-enhanced resins,» Journal of Composite Materials, 2010.

[13] «ASTM D6415/D6415M-06a − Standard Test Method for Measuring the Curved Beam Strength of a Fiber-Reinforced Polymer-Matrix Composite,» West Conshohocken, PA, 1999.

[14] W. Jackson y P. Ifju, «Through the thickness tensile stress of textile composites,» NASA. Langley Research Center, 1994.

[15] S. Lekhnitskii, S. Tsai y T. Cheron, «Anisotropic Plates,» Gordon Breach SciencePublishers, 1968.

[16] K. Kedward y R. Wilson, «Flexure of simply curved composite shapes,» Composites, vol. 20, pp. 527-536, 1989.

[17] W. Jackson y R. Martin, «An interlaminar tensile strength specimen,» Composite Materials: Testing and Design, vol. 11, pp. 333-354, 1993.

[18] C. Sickinger y A. Herrmann, «Structural Stitching as a Method to design High-,» DLR. Institute of Structural Mechanics. German Aerospace Center, Brunswick.

[19] P. Potluri y otros, «Novel stitch-bonded sandwich composite structures.,» Composite Structures, vol. 59, p. 251–259, 2003.

[20] C. Scarponi y otros, «Advanced TTT composite materials for aeronautical purposes: Compression after impact (CAI) behavior.,» Composites: Part B, vol. 38, p. 258–264, 2007.

[21] M. Colin de Verdiere, «Effect of Tufting on the Response of Non Crimp Fabrics Composites,» de ECCOMAS Thematic Conference on Mechanical Response of Composites, Porto, Portugal, 2007.

[22] G. Dell’Anno y otros, «Exploring mechanical property balance in tufted carbonfabric/epoxy composites,» Composites: Part A, vol. 38, p. 2366–2373, 2007.

[23] P. Smith, «Carbon Fibre Reinforced Plastics-Properties.,» de Comprehensive composite materials., 2000, pp. Vol. 2.04. 107-150.

[24] C. Roth y H. Norbert, «Theoretical and experimental investigation on the effect of stitching on the in-plane stiffness of CFRP,» de ECCM 10, Brugge (Belgium), 2002.

[25] S. Lomov, E. Belov, T. Bischoff y S. Ghosh, «Carbon composites based on multi-axial multi-ply stitched performs. Part 1: Geometry of the perform. , 2002. 33: p.,» Composite A, vol. 33, pp. 1171-1183, 2002.

[26] G. Dell’Anno, J. Treiber y I. Partridge, «Manufacturing ofcompositepartsreinforcedthrough-thickness by tufting,» Robotics and Computer-Integrated Manufacturing, 2015.

[27] A. Miravete y otros, Materiales Compuestos, Ed. Antonio Miravete, 2000.

[28] R. Esquej, L. Castejón, M. Lizaranzu, M. Carrera, A. Miravete y R. Miralbes, «A new finite element approach applied to the free edge effect on composite materials,» Composite Structures, vol. 98, pp. 121-129, 2013.

[29] R. Miller y P. McIntire, «Acoustic emission testing. American Society for Nondestructive Testing,» Nondestructive testing handbook, vol. 5, nº 2, p. 603, 1987.

[30] C. Ageorges, K. Friedrich, T. Schuller y B. Lauke, «Single-fibre Broutman test: fibre-matrix interface transverse debonding.,» Composites: Part A, vol. 30, p. 1423–1434, 1999.

[31] S. Huguet, N. Godin, R. Gaertner, L. Salmon y D. Villard, «Use of acoustic emission to identify damage modes in glass fibre reinforced polyester,» Composite Science and

15

Technology, vol. 62, p. 1433–1444, 2002.

[32] P. Liu, J. Chu, Y. Liu y J. Zheng, «A study on the failure mechanisms of carbon fiber/epoxy composite laminates using acoustic emission,» Materials and Design, vol. 37, p. 228–235, 2012.


Recommended