In a previous work (Salinas-Luna1), we presentedsome simulated results on piston detection by usingthe classical Ronchi test. We showed that a pistonerror in a segmented surface induces a change in thetransversal aberration in the segment with piston thatproduces a variation of the frequency of the Ronchifringes. We can then compare the frequency of thefringes in each segment mutually.2,3 The term involvedto correct the piston term is the defocusing (Bai4), anonlineal term. However, it can be used to measure thepiston only under two conditions. First, the defocusingterm must be of the order of wavelength or fractions ofthat. Second, the defocusing term must have a linealbehavior in the segmented surface and in the imageplane. In other words, the different position of thepoint image for each segment along of the optical axismust be the same in the segmented surface and in theimage plane. Otherwise, we would have a nonlinealbehavior leading to classical defocusing. In this work,we use the theoretical results obtained previously,
(Salinas-Luna1), and we experimentally compare thechange in the fringes frequency in each segment usinga correlation algorithm. We have applied our algo-rithm to real and simulated Ronchigrams for a surfaceof 1200 mm and 200 mm of curvature radius anddiameter, respectively. This paper is organized asfollows. In Section 2, the technique used to comparethe fringes in each segment is described. Next, weshow the experimental setup with the Ronchi testand Shack interferometer as a reference system usedfor cophasing. Afterwards, we compare the experi-mental results with the simulated Ronchigrams withpiston. Finally we discuss some artifice that can arisewhen the Ronchi test is used for piston measurementand conclude.
2. Comparison Technique
In this section, we present one of the bases that sustainthis work. We use a correlation algorithm to comparecurves of the intensity versus position obtained in aline, of pixels in the Ronchigram image for each seg-ment. This correlation algorithm for images has beenwidely studied.5–8 In our case the correlation equa-tion is expressed as �
�xixf L1�x� � L2�x � ��dx � f�x�.
L1�x� and L2�x � �� are the intensity curves obtainedin each segment; � is a constant denoting the dis-placement interval on the mirror, ��xi, xf� is the in-terval where the correlation is realized. In practicethe correlation algorithm was developed for Ronchi-grams, where the intensity curve L2 was shifted �20pixels. This value corresponds to a couple of fringes in
J. Salinas-Luna ([email protected]) is with Centro de Cienciasde la Materia Condensada, UNAM, Ensenada, B.C., Mexico22860. E. Luna, L. Salas, and J. Nunez are with ObservatorioAstronomico Nacional, Observatorio Astronomico Nacional, En-sanada, B.C., Mexico 22860.
Received 24 January 2006; revised 22 May 2006; accepted 25May 2006; posted 26 May 2006 (Doc. ID 67365).
a Ronchigram. The result obtained from the correla-tion is a function f(x) that depends on the position xand of the intensity pattern evaluated. If the segmentunder test has a piston error, the correlation functionhas a maximum. In order to get the position of theextreme, this curve can be approximated by parabolicfunction C�s� � � � ��s � s0�2. In this function, s0 isthe extreme point. Considering the theorem of thesampling, and three points on the curve, �s1, a�, �s2, b�,and �s3, c� around extreme point s0 after algebraand solving an equation system, the position of theextreme
s0 �12
�b � a��s12 � s3
2� � �a � c��s12 � s2
2��b � a��s1 � s3� � �a � c��s1 � s2�
is obtained. In this way, s0 is the difference, in sub-pixels, of the curves L1 and L2. For greater clarity innotation, pix � s0 is the displacement.
In order to obtain the piston error from pix, we usethe result of Salinas-Luna1 that related pix to thesum of all transversal aberration and the piston term.See the demonstration in Appendix A. The equationfor the evaluation of the piston term is given by
f � Rtpix
xN�N � 1�, (1)
where R is the curvature radius of the segmentedsurface under test, t is a parameter of conversionused in the transversal aberration and is measuredfrom an image, pix is the position of the maximumobtained from the correlation, x is a conversion fac-tor for the image size, and N is the number of pixelscompared between the functions L1�x� and L2�x � ��.This value can be changed according to the requiredresolution, that is, when using a Ronchi grid withmore lines.
3. Experimental Device
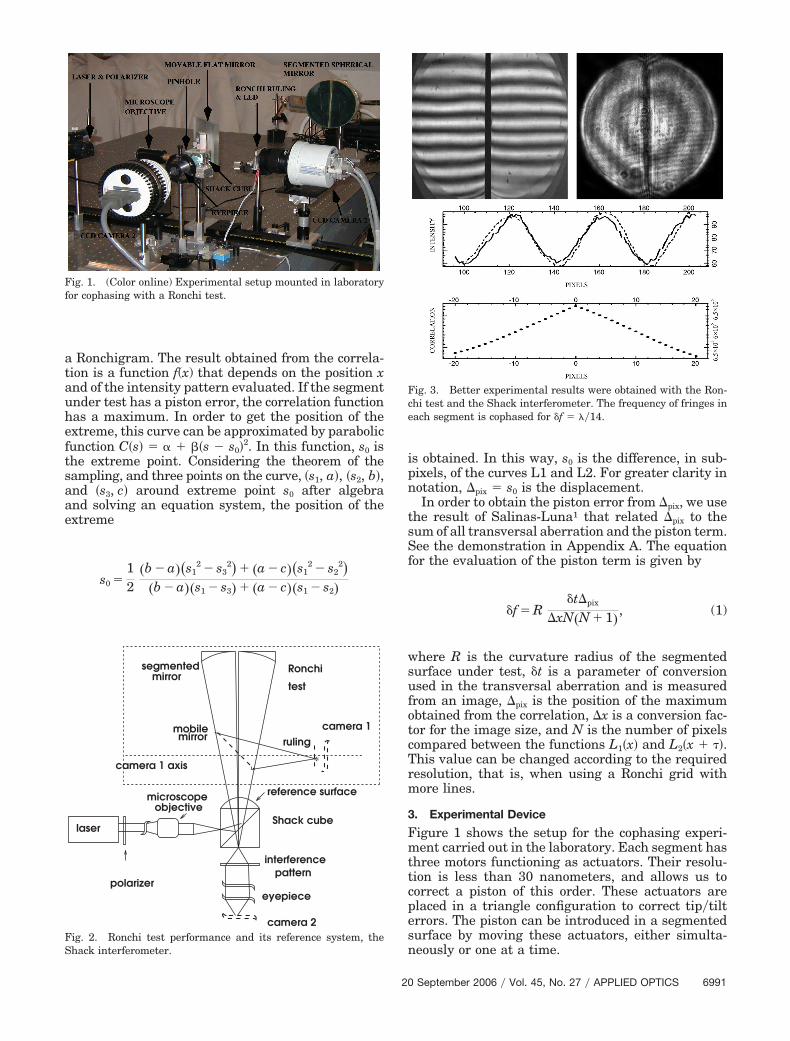
Figure 1 shows the setup for the cophasing experi-ment carried out in the laboratory. Each segment hasthree motors functioning as actuators. Their resolu-tion is less than 30 nanometers, and allows us tocorrect a piston of this order. These actuators areplaced in a triangle configuration to correct tip�tilterrors. The piston can be introduced in a segmentedsurface by moving these actuators, either simulta-neously or one at a time.
Fig. 1. (Color online) Experimental setup mounted in laboratoryfor cophasing with a Ronchi test.
Fig. 2. Ronchi test performance and its reference system, theShack interferometer.
Fig. 3. Better experimental results were obtained with the Ron-chi test and the Shack interferometer. The frequency of fringes ineach segment is cophased for f � ��14.
On the other hand, the Ronchi test cannot detectinclinations in a monolithic surface, since it detectsthe derivative of the surface (Cornejo9). However, fora segmented surface the test is very sensitive to sur-face errors such as piston, including tilts, since theshape of their patterns in a segmented surface can becompared mutually between segments, and anychanges in the fringes frequency can be viewed easily.
In order to ensure only piston detection withouttilts, we use the Ronchi test with a reference test, the
Shack interferometer10–12; see Fig. 2. Thus it is pos-sible to detect some inclination in the segments, andit can be corrected immediately. The methodologyfollowed to evaluate the piston in our experiment isas follows: First, with the Shack interferometer wemade sure that inclination in the surfaces does notexist, by means of the analysis of images acquired bycamera 2. A flat mirror is then introduced to makethe Ronchi test. Ronchigrams are acquired with cam-
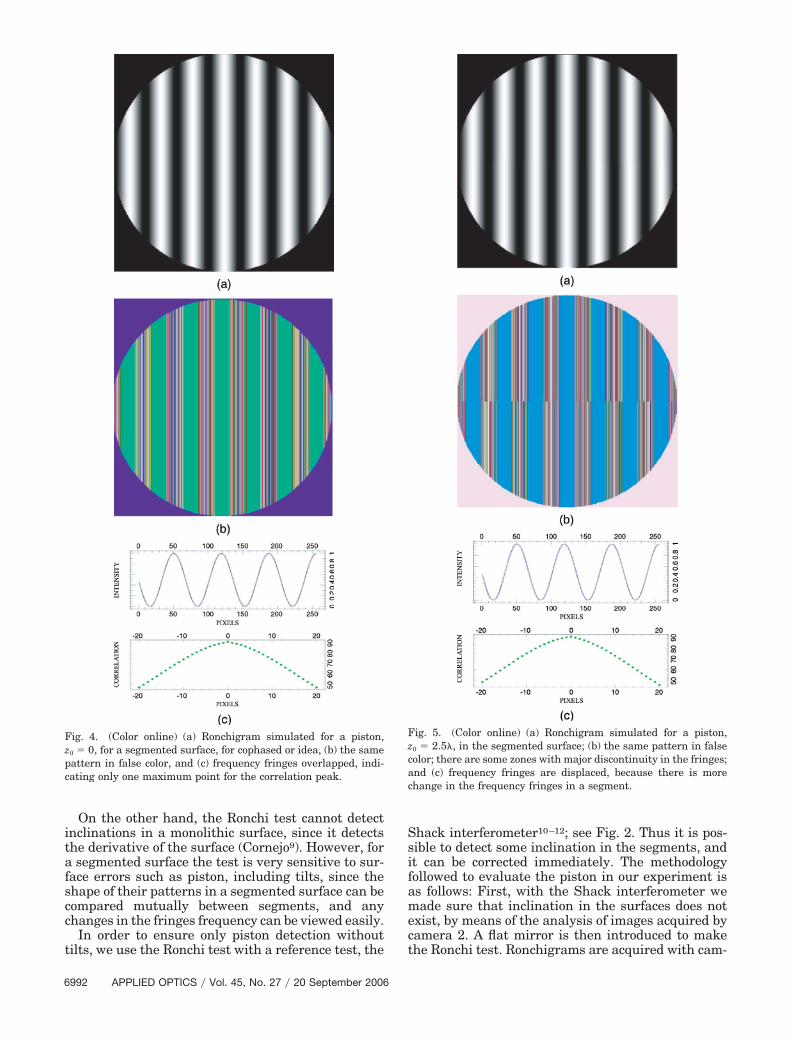
Fig. 4. (Color online) (a) Ronchigram simulated for a piston,z0 � 0, for a segmented surface, for cophased or idea, (b) the samepattern in false color, and (c) frequency fringes overlapped, indi-cating only one maximum point for the correlation peak.
Fig. 5. (Color online) (a) Ronchigram simulated for a piston,z0 � 2.5�, in the segmented surface; (b) the same pattern in falsecolor; there are some zones with major discontinuity in the fringes;and (c) frequency fringes are displaced, because there is morechange in the frequency fringes in a segment.
era 1; see Fig. 2 for greater detail. The Ronchigramsand Shackgrams are iteratively evaluated by corre-lations, until we get cophasing within a tolerance���10.13
4. Results
Before cophasing with the Ronchi test, it is very im-portant to make the Ronchi grid correctly aligned.This can be achieved by aligning Ronchi fringes withthe center of the surface from an image taken withthe camera. This first adjustment of the grids correctspossible errors of inclinations of the device of test and
leaves possible inclinations of the segments to be re-flected in Ronchigrams.
Figure 3 shows the better cophasing case. ThisRonchigram was analyzed with the correlation tech-nique. Figure 3(a) (left) is the Ronchigram, and theright is the Shackgram. Figure 3(b) is a line of pixelsof the reference segment, �L1�, and of the test, L2.Figure 3(c) shows the function generated by the cor-relation. The Ronchi grid used is of 500 lines�in.From the image we obtained a magnitude of piston off � 45 nm. This result was obtained by evaluating100 lines on the half-image Ronchigram in each seg-ment.
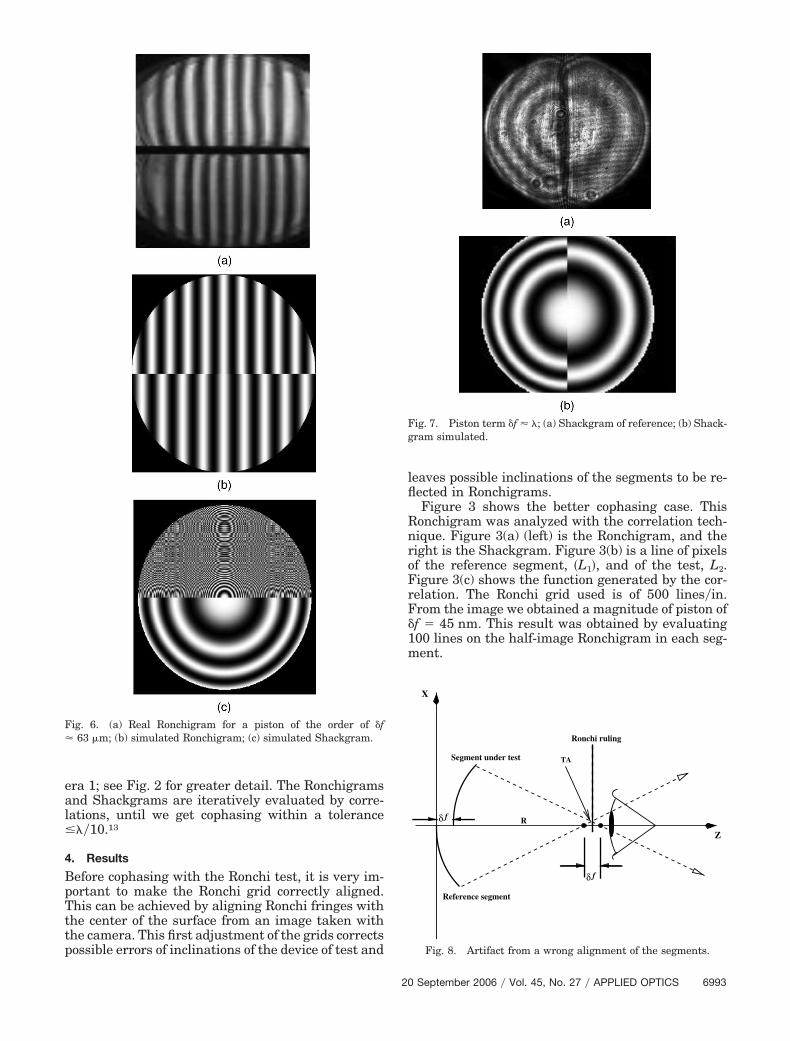
Fig. 6. (a) Real Ronchigram for a piston of the order of f� 63 �m; (b) simulated Ronchigram; (c) simulated Shackgram.
Fig. 7. Piston term f � �; (a) Shackgram of reference; (b) Shack-gram simulated.
Fig. 8. Artifact from a wrong alignment of the segments.
In order to verify the results presented in Fig. 3, wehave simulated Ronchigrams for a segmented surfacewith almost all the same factors present in the Ron-chi test, without diffraction effects, considering theexact ray tracing for the central maximums of theRonchi fringes. The piston error is introduced by add-ing to the sagitta function a constant z0 � 45 nm.Figure 4 shows simulated Ronchigrams where it hasbeen considered that piston does not exist, and in Fig.5 a piston of 45 nm is introduced. These two figures,in false color, show the small differences that we aretruing to evaluate using correlations. Figure 6(a)shows the real image, for a magnitude of the piston ofthe order of 1582 nm � 2.5�. Figure 6(b) is the sim-ulated Ronchigram, where both images have a fre-quency difference in their patterns; and Figure 6(c) isthe simulated Shackgram. In Fig. 7 we present twoimages with the idea to compare real and simulatedpatterns. Figure 7(a) shows a real Shackgram for apiston error of ��. Figure 7(b) shows a simulatedShackgram with the same piston.
5. Discussion on Cophasing with Ronchi Test
Once we have obtained the piston from the Ronchi-gram image of the segmented surface, how does itensure that we have obtained a complete cophasing,and therefore, when do we achieve the piston correc-tion on the segmented surface?
As is well known, in a generated interferogramfrom a segmented surface there can exist uncertain-ties of the piston of the order of wavelength multiplesthat cannot be detected by a conventional interferom-eter, and therefore, it would be impossible to arrive at
the cophasing case. Some authors, to correct this dis-advantage, restrict the cophasing at a narrow inter-val (Chanan13).
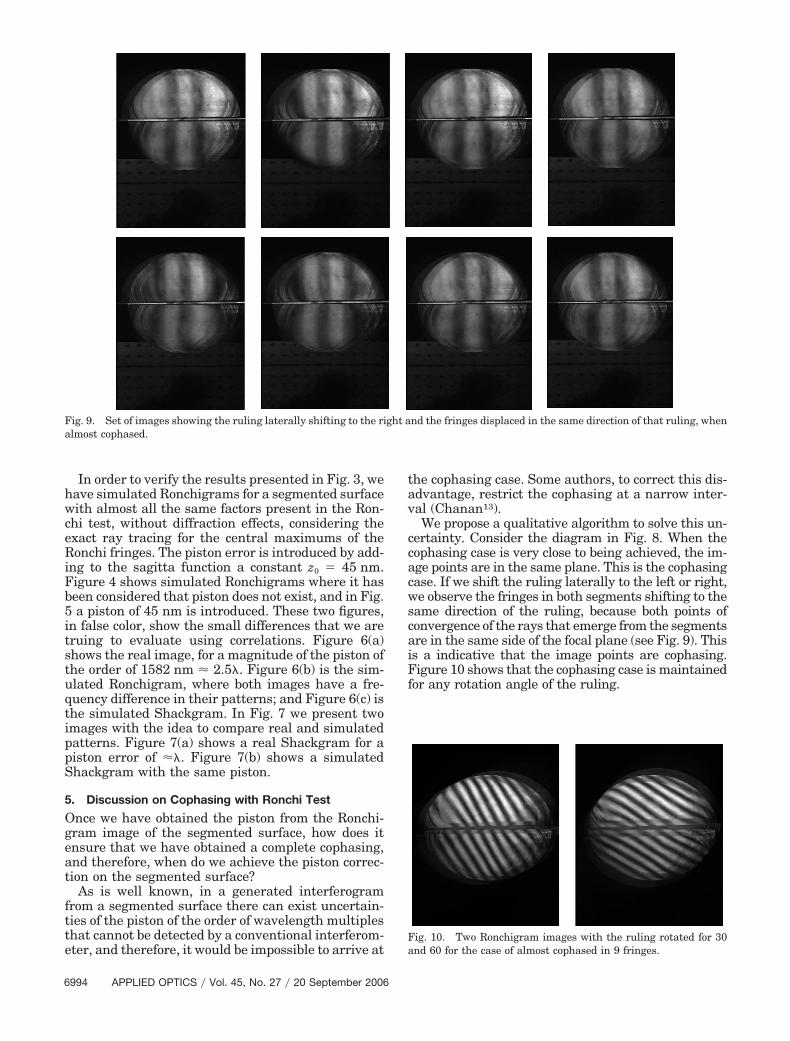
We propose a qualitative algorithm to solve this un-certainty. Consider the diagram in Fig. 8. When thecophasing case is very close to being achieved, the im-age points are in the same plane. This is the cophasingcase. If we shift the ruling laterally to the left or right,we observe the fringes in both segments shifting to thesame direction of the ruling, because both points ofconvergence of the rays that emerge from the segmentsare in the same side of the focal plane (see Fig. 9). Thisis a indicative that the image points are cophasing.Figure 10 shows that the cophasing case is maintainedfor any rotation angle of the ruling.
Fig. 9. Set of images showing the ruling laterally shifting to the right and the fringes displaced in the same direction of that ruling, whenalmost cophased.
Fig. 10. Two Ronchigram images with the ruling rotated for 30and 60 for the case of almost cophased in 9 fringes.
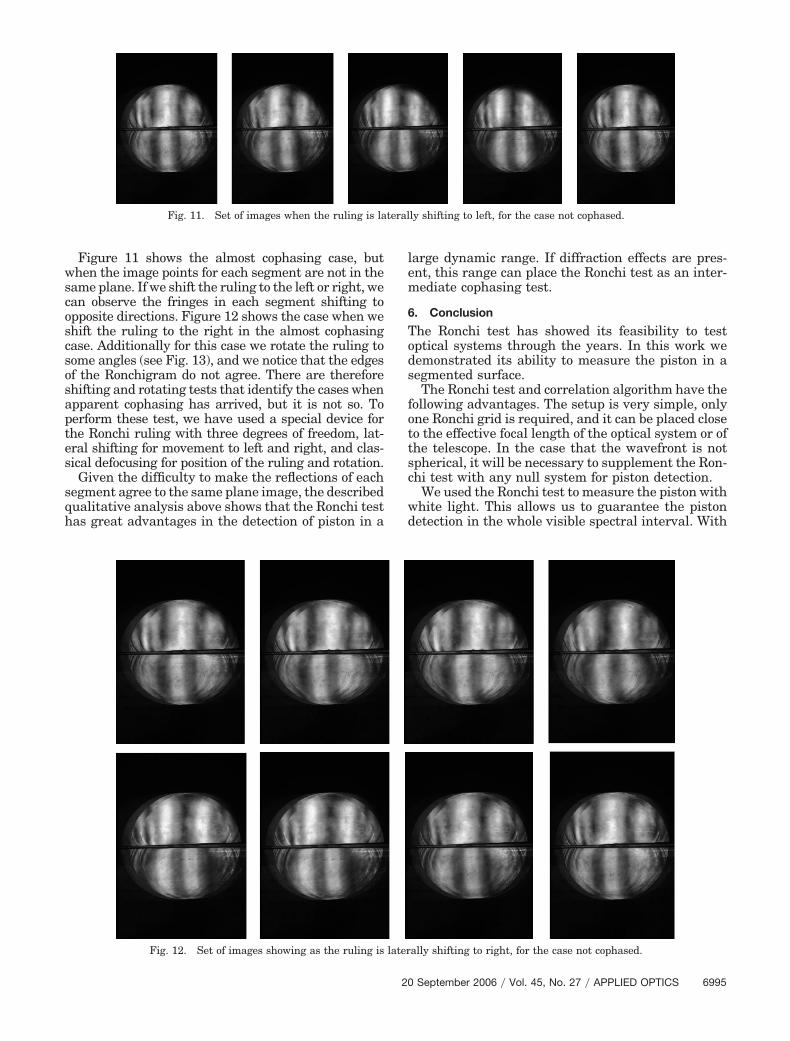
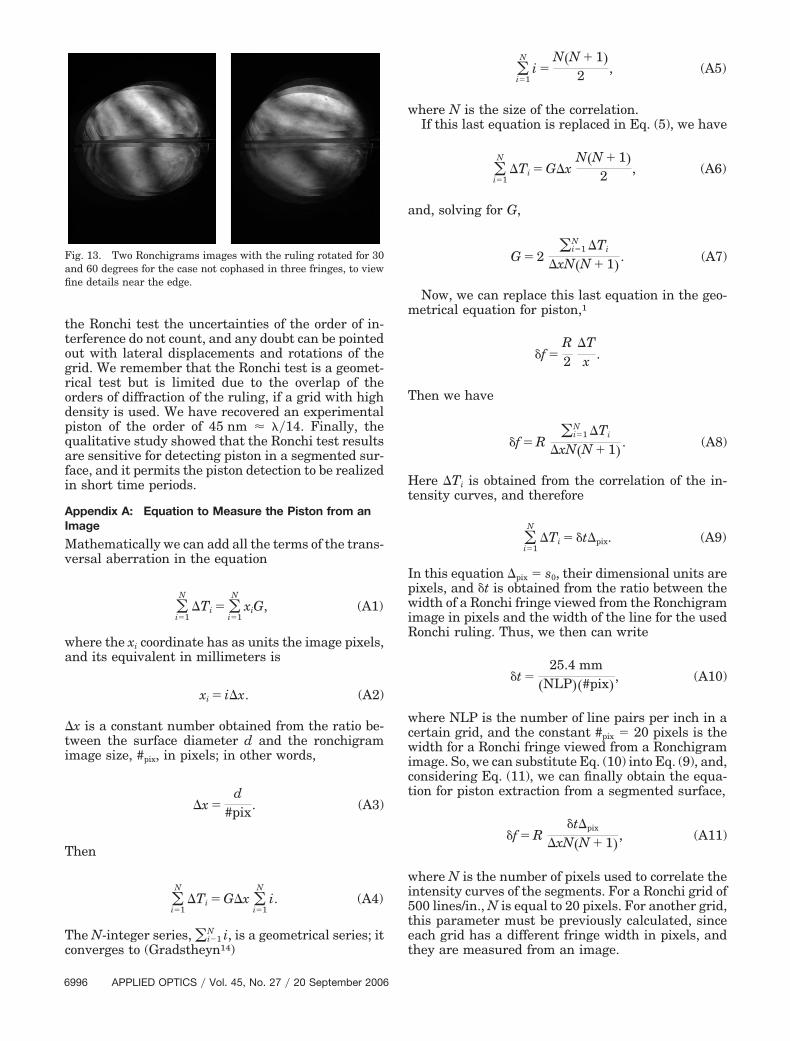
Figure 11 shows the almost cophasing case, butwhen the image points for each segment are not in thesame plane. If we shift the ruling to the left or right, wecan observe the fringes in each segment shifting toopposite directions. Figure 12 shows the case when weshift the ruling to the right in the almost cophasingcase. Additionally for this case we rotate the ruling tosome angles (see Fig. 13), and we notice that the edgesof the Ronchigram do not agree. There are thereforeshifting and rotating tests that identify the cases whenapparent cophasing has arrived, but it is not so. Toperform these test, we have used a special device forthe Ronchi ruling with three degrees of freedom, lat-eral shifting for movement to left and right, and clas-sical defocusing for position of the ruling and rotation.
Given the difficulty to make the reflections of eachsegment agree to the same plane image, the describedqualitative analysis above shows that the Ronchi testhas great advantages in the detection of piston in a
large dynamic range. If diffraction effects are pres-ent, this range can place the Ronchi test as an inter-mediate cophasing test.
6. Conclusion
The Ronchi test has showed its feasibility to testoptical systems through the years. In this work wedemonstrated its ability to measure the piston in asegmented surface.
The Ronchi test and correlation algorithm have thefollowing advantages. The setup is very simple, onlyone Ronchi grid is required, and it can be placed closeto the effective focal length of the optical system or ofthe telescope. In the case that the wavefront is notspherical, it will be necessary to supplement the Ron-chi test with any null system for piston detection.
We used the Ronchi test to measure the piston withwhite light. This allows us to guarantee the pistondetection in the whole visible spectral interval. With
Fig. 11. Set of images when the ruling is laterally shifting to left, for the case not cophased.
Fig. 12. Set of images showing as the ruling is laterally shifting to right, for the case not cophased.
the Ronchi test the uncertainties of the order of in-terference do not count, and any doubt can be pointedout with lateral displacements and rotations of thegrid. We remember that the Ronchi test is a geomet-rical test but is limited due to the overlap of theorders of diffraction of the ruling, if a grid with highdensity is used. We have recovered an experimentalpiston of the order of 45 nm � ��14. Finally, thequalitative study showed that the Ronchi test resultsare sensitive for detecting piston in a segmented sur-face, and it permits the piston detection to be realizedin short time periods.
Appendix A: Equation to Measure the Piston from anImage
Mathematically we can add all the terms of the trans-versal aberration in the equation
�i�1
N
Ti � �i�1
N
xiG, (A1)
where the xi coordinate has as units the image pixels,and its equivalent in millimeters is
xi � ix. (A2)
x is a constant number obtained from the ratio be-tween the surface diameter d and the ronchigramimage size, #pix, in pixels; in other words,
x �d
#pix. (A3)
Then
�i�1
N
Ti � Gx �i�1
N
i. (A4)
The N-integer series, �i�1N i, is a geometrical series; it
converges to (Gradstheyn14)
�i�1
N
i �N�N � 1�
2 , (A5)
where N is the size of the correlation.If this last equation is replaced in Eq. (5), we have
�i�1
N
Ti � GxN�N � 1�
2 , (A6)
and, solving for G,
G � 2�i�1
N Ti
xN�N � 1�. (A7)
Now, we can replace this last equation in the geo-metrical equation for piston,1
f �R2
Tx .
Then we have
f � R�i�1
N Ti
xN�N � 1�. (A8)
Here Ti is obtained from the correlation of the in-tensity curves, and therefore
�i�1
N
Ti � tpix. (A9)
In this equation pix � s0, their dimensional units arepixels, and t is obtained from the ratio between thewidth of a Ronchi fringe viewed from the Ronchigramimage in pixels and the width of the line for the usedRonchi ruling. Thus, we then can write
t �25.4 mm
�NLP��#pix�, (A10)
where NLP is the number of line pairs per inch in acertain grid, and the constant #pix � 20 pixels is thewidth for a Ronchi fringe viewed from a Ronchigramimage. So, we can substitute Eq. (10) into Eq. (9), and,considering Eq. (11), we can finally obtain the equa-tion for piston extraction from a segmented surface,
f � Rtpix
xN�N � 1�, (A11)
where N is the number of pixels used to correlate theintensity curves of the segments. For a Ronchi grid of500 lines/in., N is equal to 20 pixels. For another grid,this parameter must be previously calculated, sinceeach grid has a different fringe width in pixels, andthey are measured from an image.
Fig. 13. Two Ronchigrams images with the ruling rotated for 30and 60 degrees for the case not cophased in three fringes, to viewfine details near the edge.
We express our gratitude to the “proyecto Telesco-pio Infrarrojo Mexicano, TIM,” of the IAUNAM atEnsenada B. C. México. J. Salinas-Luna was alsosupported (Ph.D scholarship 114488�115164) byConsejo Nacional de Ciencia y Tecnología. Our grat-itude for V. García is heartfelt for his unconditionalassistance to develop this work, rest in peace.
References1. J. Salinas-Luna, E. Luna, L. Salas, I. Cruz-González, and A.
Cornejo-Rodríguez, “Ronchi test can detect piston by means thedefocusing term,” Opt. Express 12, 3719–3736 (2004), http://www.opticsexpress.org/abstract.cfm?URI�OPEX-12-16-3719.
2. J. Salinas-Luna, E. Luna, L. Salas, A. Cornejo, I. Cruz, and V.García, “The classical Ronchi test for piston detection,” inLarge Ground, Based Telescopes, J. M. Oschmann and L. M.Stepp, eds., Proc. SPIE 4837, 758–763 (2003).
3. J. Salinas-Luna, “Cofaseo de una superficie segmentada,”Ph.D. thesis (INOAE, Puebla, México, 2002).
4. J. Bai, Shangyi, Cheng, and Guoguang Yang, “Phase align-ment of segmented mirrors using a digital wavefront inter-ferometer,” Opt. Eng. 36, 2355–2357 (1997).
5. L. Gutierrez and C. Dominguez-Tagle, “High-resolution tele-
scope encoder,” in Telescope, Control Systems III, H. Lewis, ed.,Proc. SPIE 3351, 440–447 (1998).
6. B. Jähne, “Displacement vectors,” in Digital Image Processing(Springer-Verlag, 1991), Chap. 15.
7. J. C. Russ, “Processing images in frequency space,” in TheImage Processing Handbook, 2nd ed. (CRC, 1995), Chap. 5.
8. W. K. Pratt, “Image detection and registration,” in DigitalImage Processing (Wiley, 1991), Chap. 20.
9. A. Cornejo-Rodríguez, in Optical Shop Testing, D. Malacara,ed. (Wiley Interscience, 1992), pp. 321–365.
10. D. Malacara, M. Servin, and Z. Malacara, “Review and com-parison of major interferometric systems,” in Analysis for Op-tical Testing, 1st ed. (Marcel Dekker, 1998), Chap. 1.
11. M. V. Mantravadi, “Newton, Fizeau and Haidinger inter-ferometers,” in Optical Shop Testing, 2nd ed., D. Malacara, ed.(Wiley, 1992), Chap. 1.
12. D. Malacara, “Basic interferometers,” in Handbook of OpticalEngineering, 1st ed., D. Malacara, ed. (Marcel Dekker, 2001),Chap. 11.
13. G. Chanan, M. Troy, F. Dekens, S. Michaels, J. Nelson, T.Mast, and D. Kirkman, “Phasing the mirror segments of theKeck telescopes: the broadband phasing algorithm, Appl. Opt.37, 140–155 (1998).
14. I. S. Gradstheyn and I. M. Ryzhik, Table of Integrals, Seriesand Products, Finite Sums (Academic, 1980), Chap. 1.