Louisiana State University LSU Digital Commons LSU Master's eses Graduate School 2008 Experimental study of a foam flow in horizontal pipes: two flow regimes and its implications Miodrag Bogdanovic Louisiana State University and Agricultural and Mechanical College, [email protected]Follow this and additional works at: hps://digitalcommons.lsu.edu/gradschool_theses Part of the Petroleum Engineering Commons is esis is brought to you for free and open access by the Graduate School at LSU Digital Commons. It has been accepted for inclusion in LSU Master's eses by an authorized graduate school editor of LSU Digital Commons. For more information, please contact [email protected]. Recommended Citation Bogdanovic, Miodrag, "Experimental study of a foam flow in horizontal pipes: two flow regimes and its implications" (2008). LSU Master's eses. 3283. hps://digitalcommons.lsu.edu/gradschool_theses/3283
Transcript
Louisiana State UniversityLSU Digital Commons
LSU Master's Theses Graduate School
2008
Experimental study of a foam flow in horizontalpipes: two flow regimes and its implicationsMiodrag BogdanovicLouisiana State University and Agricultural and Mechanical College, [email protected]
Follow this and additional works at: https://digitalcommons.lsu.edu/gradschool_theses
Part of the Petroleum Engineering Commons
This Thesis is brought to you for free and open access by the Graduate School at LSU Digital Commons. It has been accepted for inclusion in LSUMaster's Theses by an authorized graduate school editor of LSU Digital Commons. For more information, please contact [email protected].
Recommended CitationBogdanovic, Miodrag, "Experimental study of a foam flow in horizontal pipes: two flow regimes and its implications" (2008). LSUMaster's Theses. 3283.https://digitalcommons.lsu.edu/gradschool_theses/3283
LIST OF TABLES…………………………………………………………………….……..…....v
LIST OF FIGURES ...………………………………………………...………….….…………....vi
ABSTRACT………………………………………………………………………….…………...xi
1. INTRODUCTION……………………………………………………………..….………….....11.1 Objectives of This Study ……………………………………………….….…………......21.2 Chapter Description ……………………………………………………….…………......3
2. LITERATURE REVIEW……………………………………………………….……………....52.1 Stability of Foam as a Dispersed Phase …..………………………........….….…….….....52.2 Yield Stress of Bulk Foam Flow………………………………………….……………....62.3 Fundamentals of Bulk Foam Rheology in Pipes ……………….……………..…...…......82.4 Two Flow Regimes of Foam in Porous Media………..……………………..…………..13
3. PROCEDURE AND METHODOLOGY……….………………………………..…………...173.1 Experimental Materials and Setup……………..…………………………….…………..173.2 Experimental Procedure and Data Processing……………………………….…………..21
4. RESULTS AND DISCUSSIONS …………...………………………………….….………....274.1 Introduction ………………………………………………………...…….….…………..274.2 Base Case (Case 1)…………………………………………………………..…………..284.3 Effect of Surfactant Concentration (Cases 1,2, and 3)……………...…….….…………..354.4 Effect of Filter Opening Size (Cases 4,5, and 6)……………..………….….…………...394.5 Effect of Surfactant Formulation (Cases 7,8,9 and 10)………………….….…………...444.6 Effect of Pipe Diameter (Cases 11 and 12)…………………...………….….…………..534.7 Flow Experiments at Fixed Foam Quality (Cases 13 and 14)……………....…………..574.8 Discussions ………………………………………………………………….….…….....634.9 Implication of Two Flow Regimes in Field Applications……………………..………...68
5. CONCLUSIONS AND RECOMMENDATIONS…………………………………….……...705.1 Conclusions ……………………………………………………...……………..………..705.2 Recommendations …………………………………………………………………........72
APPENDIX A. EXPERIMENTAL DATA FOR CASES 1 THROUGH 12.............................................80
iv
B. DERIVATION OF REYNOLDS NUMBER AND POWER-LAW EXPONENT..........93
VITA ……………………………………………………………………………………….….. ..97
v
LIST OF TABLES
3.1 A brief summary of all 14 experimental cases conducted in this study……...…….………22
3.2 Different combinations of gas and liquid injection rates in 1 inch ID stainless steel pipe (cf. Cases 11 and 12 as shown in Table 3.1)……………………………...….…….……...22
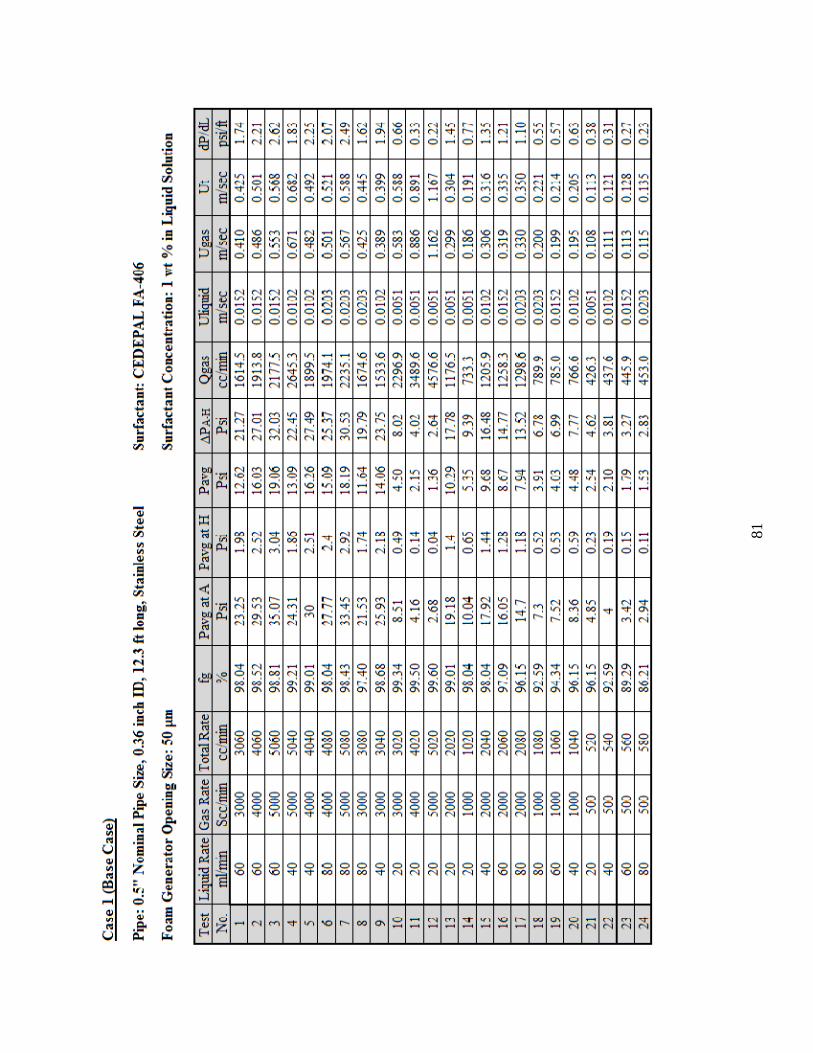
3.3 Different combinations of gas and liquid injection rates in 0.5 inch ID pipes (cf. Cases 1 through 10 as shown in Table 3.1)…………………………………………..…….…….....23
4.1 Flow rates used for Case 13 (cf. Fig. 4.28) at fixed foam quality of 98.4%....................................................................................................................................58
4.2 Flow rates used for Case 14a (cf. Fig. 4.29) at fixed foam quality of 98.4%....................................................................................................................................59
4.3 Flow rates used for Case 14b (cf. Fig. 4.30) at fixed foam quality of 98.4%....................................................................................................................................59
vi
LIST OF FIGURES
2.1 Two dimensional representation of the origin of yield stress in the presence of foams: the interaction between different layers of foams causes a resistance to flow [upper schematic figure from Princen, 1983; lower diagram from Prud’homme, 1981]...………. 7
2.2 Experimental data of yield stress of foam as a function of foam quality [from Blauer et al., 1974 ]: the yield stress increases sharply above a threshold value in which bubble tobubble interaction becomes significant……………………………...........……………..... 7
2.3 The origin of yield stress of foam-solid mixtures: the concept of a representative unit cell in Princen-Prud’hommes model (Fig. 2.1) is still applicable in three-phase foam-solid mixtures [from Kam et al., 2002]
(a) Dimensionless force resisting flow at different values of gas fraction (Fg) (solid fraction (Fs) is fixed at 49.8 %)………………………………………….………..... 9
(b) Dimensionless resisting force as a function of three-phase fractions (gas liquid, andsolids)…………………………………………………………….…………………. 9
2.4 Bingham plastic viscosity of foam as a function of foam quality [from Blauer et al., 1974]: the increase in foam texture causes an increase in plastic viscosity….......……….. 11
2.5 The change in foam viscosity (x axis) as a function of shear stress (y axis) at differenttube diameters: foams behave as shear-thinning [from David and Marsden, 1969].
(a) Foam quality between 81 % and 89 %........................................................................ 13 (b) Foam quality between 90 % and 96 %........................................................................ 13
2.6 Steady-state pressure contours during foam flow in a 2-ft long sandpack [from Osterloh and Jante, 1992]: There exist two different flow regimes in which foam behaves quite distinctly………………………………………………………………............................... 15
2.7 Steady-state pressure-gradient contours during foam flow in 530-md Berea sandstone [from Alvarez et al., 2001]: the presence of two flow regimes are identified in a wide range of experimental conditions……………………………………...………………...... 16
3.1 A schematic of experimental setup for foam flow in pipe used in this study…..………… 17
3.12 A schematic of Newtonian fluid (α=1), shear-thinning (α<1), and shear-thickening fluid (α>1)…………………………..........................…….…………………………………….. 26
3.13 Determination of power-law exponent (α)……………………………............................... 26
4.1 Pressure response as a function of time with a stepwise change in gas and liquidinjection rates (Case 1; also base case): (0.5 inch ID stainless steel pipe, 1 wt%surfactant concentration using Cedepal FA-406, 50 µm filter…………………………..... 30
4.2 Pressure response as a function of time with a stepwise change in gas and liquidinjection rates, continued (Case 1; also base case): (0.5 inch ID stainless steel pipe, 1 wt% surfactant concentration using Cedepal FA-406, 50 µm filter opening size)........... 31
4.3 Pressure response as a function of time with a stepwise change in gas and liquidinjection rates, continued (Case 1; also base case): (0.5 inch ID stainless steel pipe,1 wt% surfactant concentration using Cedepal FA-406, 50 µm filter opening size)…...… 32
4.4 Steady-state pressure drops, in psi, as a function of superficial gas and liquid injectionvelocities (Case 1; also base case): (0.5 inch ID stainless steel pipe, 1 wt% surfactant concentration using Cedepal FA-406, 50 µm filter opening size)……………..………..... 34
4.5 Fig. 4.5. Pressure response as a function of time with a stepwise change in gas and liquid injection rates (Case 2): (0.5 inch ID stainless steel pipe, 5 wt% surfactant concentration using Cedepal FA -406, 50 µm filter opening size)opening size)…………………………………. 36
4.6 Steady-state pressure drops, in psi, as a function of superficial gas and liquid injectionvelocities (Case 3): (0.5 inch ID stainless steel pipe, 5 wt% surfactant concentrationusing Cedepal FA-406, 50 µm filter opening size)……………………..………………… 37
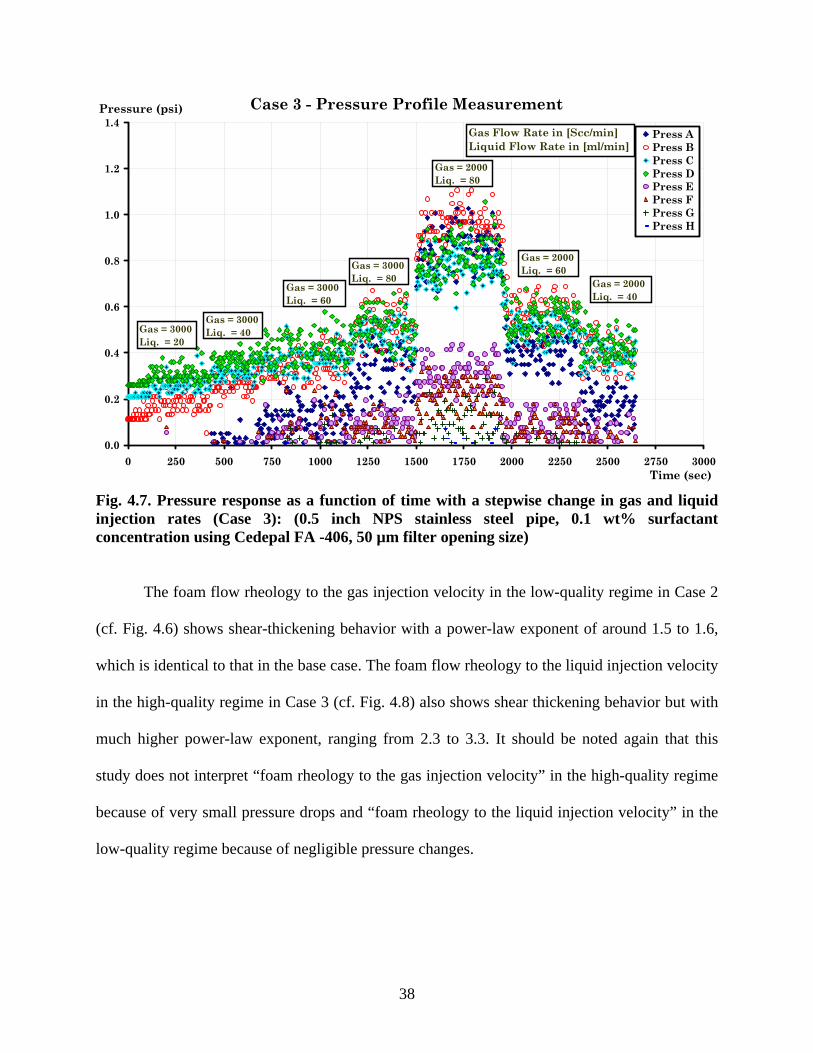
4.7 Pressure response as a function of time with a stepwise change in gas and liquidinjection rates (Case 3): (0.5 inch ID stainless steel pipe, 0.1 wt% surfactant concentration using Cedepal FA -406, 50 µm filter opening size)……………………….. 38
4.8 Steady-state pressure drops, in psi, as a function of superficial gas and liquid injectionvelocities (Case 3): (0.5 inch ID stainless steel pipe, 0.1 wt% surfactant concentration using Cedepal FA-406, 50 µm filter opening size)…………………...…………………... 39
viii
4.9 Pressure response as a function of time with a stepwise change in gas and liquidinjection rates (Case 4): (0.5 inch ID stainless steel pipe, 1 wt% surfactant concentration using Cedepal FA -406, 90 µm filter opening size)……………………………….……… 41
4.10 Steady-state pressure drops, in psi, as a function of superficial gas and liquid injection velocities (Case 4): (0.5 inch ID stainless steel pipe, 1 wt% surfactant concentration using Cedepal FA-406, 90 µm filter opening size)……………...………………………... 42
4.11 Pressure response as a function of time with a stepwise change in gas and liquid injection rates (Case 5): (0.5 inch ID stainless steel pipe, 5 wt% surfactant concentration using Cedepal FA -406, 90 µm filter opening size)…………………………..…………... 43
4.12 Steady-state pressure drops, in psi, as a function of superficial gas and liquid injection velocities (Case 5): (0.5 inch ID stainless steel pipe, 5 wt% surfactant concentration using Cedepal FA-406, 90 µm filter opening size)…………...…………………………... 44
4.13 Steady-state pressure drops, in psi, as a function of superficial gas and liquid injection velocities (Case 6): (0.5 inch ID stainless steel pipe, 0.1 wt% surfactant concentration using Cedepal FA-406, 90 µm filter opening size)……………………...………………... 45
4.14 Pressure response as a function of time with a stepwise change in gas and liquid injection rates (Case 7): (0.5 inch ID stainless steel pipe, 1 wt% surfactant concentration using Petrostep CG-50, 50 µm filter opening size)…………….…............................……. 46
4.15 Steady-state pressure drops, in psi, as a function of superficial gas and liquid injection velocities (Case 7): (0.5 inch ID stainless steel pipe, 1 wt% surfactant concentration using Petrostep CG-50, 50 µm filter opening size)………….…..………………………... 47
4.16 Pressure response as a function of time with a stepwise change in gas and liquid injection rates (Case 8): (0.5 inch ID stainless steel pipe, 1 wt% surfactant concentration using Stepanform 1050, 50 µm filter opening size)………………………….……….…... 48
4.17 Steady-state pressure drops, in psi, as a function of superficial gas and liquid injection velocities (Case 8): (0.5 inch ID stainless steel pipe, 1 wt% surfactant concentration using Stepanform 1050, 50 µm filter opening size)………………...…………………….. 49
4.18 Pressure response as a function of time with a stepwise change in gas and liquid injection rates (Case 9): (0.5 inch ID stainless steel pipe, 1 wt% surfactant concentration using Aquet TD-600, 50 µm filter opening size)……………………………..…………... 50
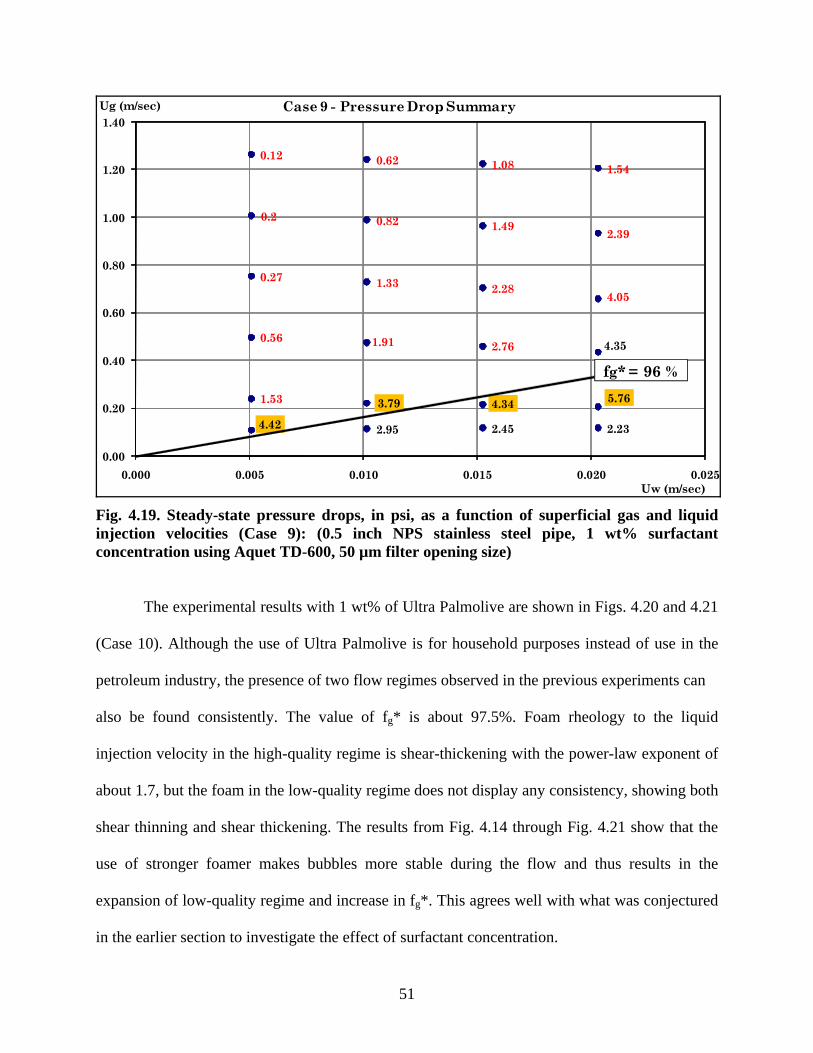
4.19 Steady-state pressure drops, in psi, as a function of superficial gas and liquid injection velocities (Case 9): (0.5 inch ID stainless steel pipe, 1 wt% surfactant concentration using Aquet TD-600, 50 µm filter opening size)……………...………………………….. 51
4.20 Pressure response as a function of time with a stepwise change in gas and liquidinjection rates (Case 10): (0.5 inch ID stainless steel pipe, 1 wt% surfactant concentration using Ultra Palmolive, 50 µm filter opening size)………..……………….. 52
ix
4.21 Steady-state pressure drops, in psi, as a function of superficial gas and liquid injection velocities (Case 10): (0.5 inch ID stainless steel pipe, 1 wt% surfactant concentration using Ultra Palmolive, 50 µm filter opening size)……………………...………………… 53
4.22 Pressure response as a function of time (Case 11): (1 inch ID stainless steel pipe, 1 wt% surfactant concentration using Cedepal FA-406, 50 µm filter opening size)………….........................................................................…………………..………... 54
4.23 Pressure response as a function of time (Case 11), continued……...….......……………... 54
4.24 Steady-state pressure drops, in psi, as a function of superficial gas and liquid injection velocities (Case 11): (1 inch ID stainless steel pipe, 1 wt% surfactant concentration using Cedepal FA-406, 50 µm filter opening size)…………………...…………………... 55
4.25 Pressure response as a function of time (Case 12): (1 inch ID stainless steel pipe, 5 wt% surfactant concentration using Cedepal FA -406, 50 µm filter opening size)……………………………...........................................................................……....... 56
4.26 Pressure response as a function of time (Case 12), continued …........................................ 56
4.27 Steady-state pressure drops, in psi, as a function of superficial gas and liquid injectionvelocities (Case 12): (1 inch ID stainless steel pipe, 5 wt% surfactant concentration using Cedepal FA-406, 50 µm filter opening size)………………...……….…………….. 57
4.28 Pressure response as a function of time with a stepwise change in gas and liquidinjection rates (Case 13): (0.5 inch ID stainless steel pipe, 1 wt% surfactantconcentration using Cedepal FA-406, 50 µm filter opening size)………..………..……... 60
4.29 Pressure response as a function of time with a stepwise change in gas and liquidinjection rates (Case 14a): (0.5 inch ID stainless steel pipe, 1 wt% surfactantconcentration using Cedepal FA-406, 50 µm filter opening size)…………....…………... 61
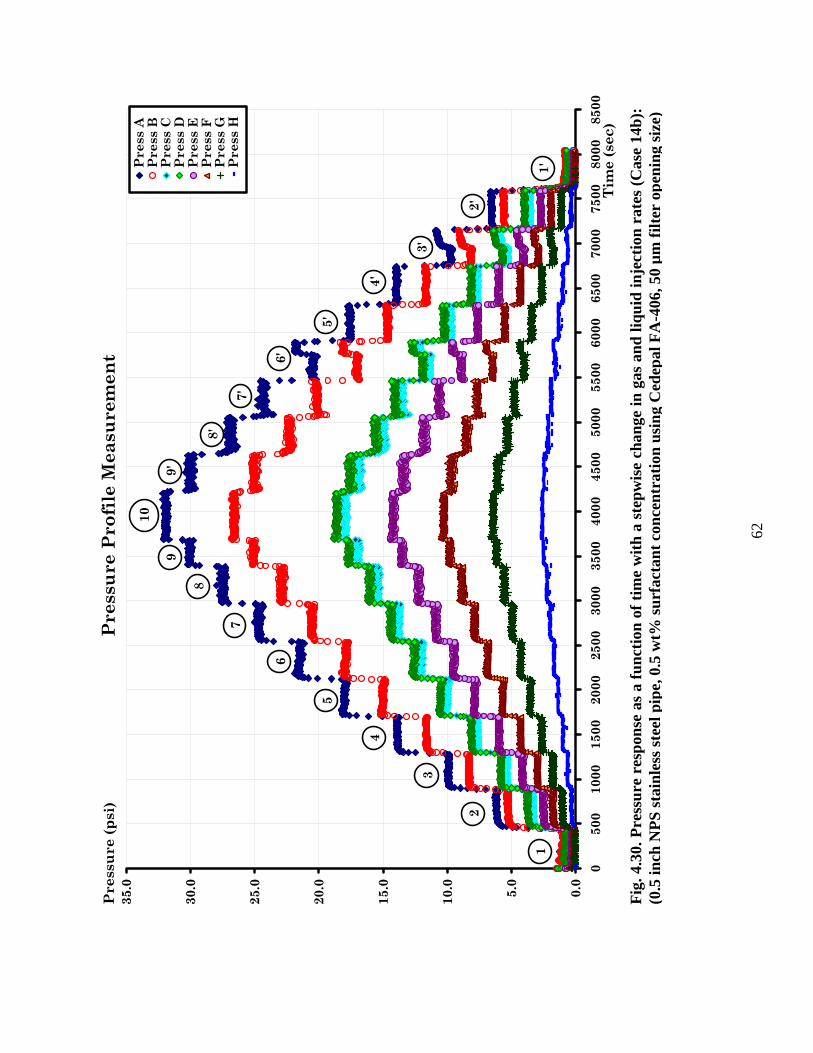
4.30 Pressure response as a function of time with a stepwise change in gas and liquidinjection rates (Case 14b): (0.5 inch ID stainless steel pipe, 0.5 wt% surfactantconcentration using Cedepal FA-406, 50 µm filter opening size)………..…..…………... 62
4.31 Schematic representation of two flow regimes and pressure contours……....…………… 63
4.32 Sequence of photos taken from the 0.5 inch pipe outlet showing repetition of free gas and foam slug within high-quality regime at foam quality above 99%............................... 64
4.33 Sequence of homogeneous foam flow within low-quality regime at 0.5 inch pipe outlet at foam quality below 99%................................................................................................... 65
4.34 Photos taken in the upstream visual cell: left with stable foam in the low-quality and right with unstable foam in the higher foam qualities ...........................................……….. 65
x
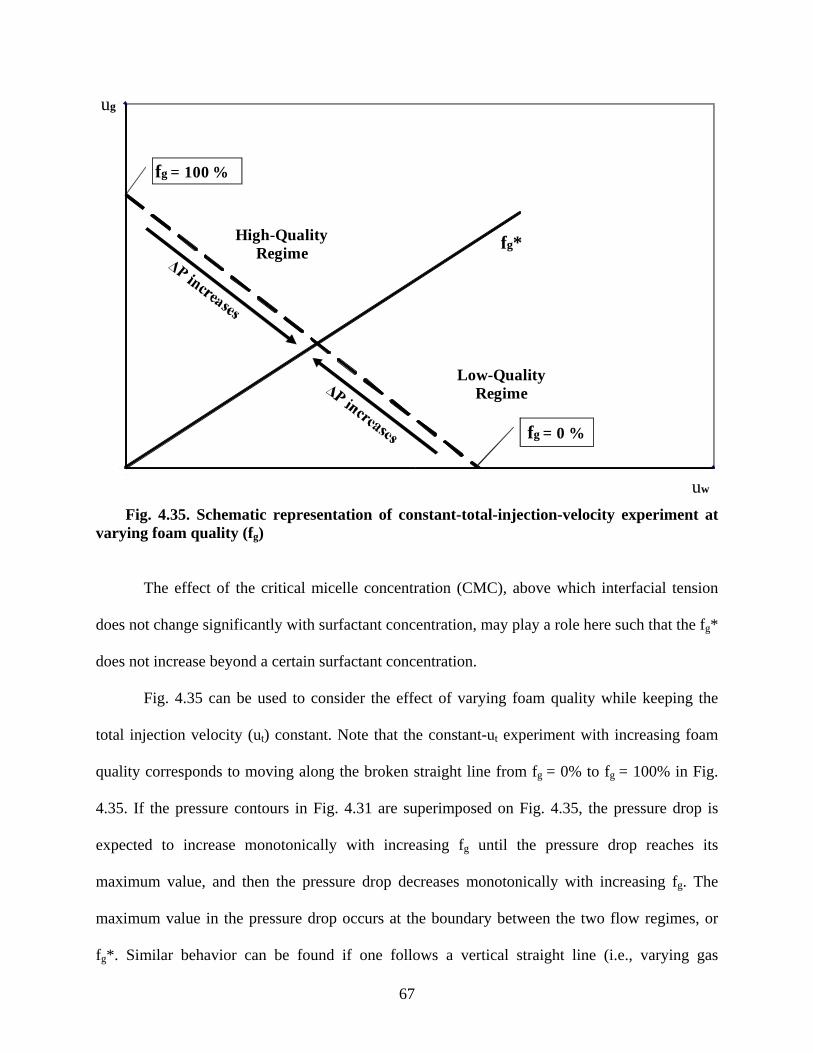
4.35 Schematic representation of constant-total-injection-velocity experiment at varying foam quality (fg)…………………………………………………………..……………………... 67
4.36 Implication of the change in gas fraction (vertical dotted line), in liquid fraction (horizontal dotted line) or in fg* …………………………………...…….……………...... 69
xi
ABSTRACT
Although foam has been widely used in many scientific and engineering applications, the
current understanding of foam rheology in pipes is still very limited because of its complex
nature. This experimental study, for the first time, investigates the flow rheology of foams in
pipes by placing a special emphasis on two distinct foam flow regimes.
A wide range of experimental conditions are examined in this study, which include five
different surfactant formulations (Cedepal FA-406, Petrostep CG-50, Stepanform 1050, Aquet
TD-600, and Ultra-Palmolive), three different surfactant concentrations (0.1, 1, and 5 wt %), two
different pipe diameters (0.5 and 1 inch nominal size stainless steel pipes), and two different
filter opening sizes (50 μm and 90 μm) for upstream foam generation.
The experiments revealed the following characteristics: (1) foam flow in pipes exhibited
two different flow regimes called “high-quality” regime and “low-quality” regime, (2) the high-
quality regime was characterized by unstable and oscillating pressure response which resulted
from repeating free gas and foam slug, whereas the low-quality regime was characterized by
stabilized pressure response which resulted from the flow of uniform and homogeneous foams,
(3) different patterns of pressure contours were observed - the pressure contours were relatively
steep in the high-quality regime but relatively gentle, or even almost horizontal, in the low-
quality regime, (4) foam rheology in the high-quality regime was shear thickening to liquid
injection velocity in all cases, and foam rheology in the low-quality regime was not consistent,
and (5) the value of foam quality (fg*) that splits the two flow regimes was shown to be affected
by experimental conditions such as surfactant formulations and concentrations.
These observations imply that the rheology in the high-quality regime is primarily
governed by dynamic mechanisms of lamella creation and coalescence during the flow, and the
xii
rheology in the low-quality regime is primarily governed by interactions between individual
bubbles and/or interactions between bubbles and pipe wall. Therefore, the high-quality regime is
likely to expand (or, the low-quality regime is likely to contract, equivalently) with a reduction in
surfactant foamability.
Implications of distinct foam behaviors in two flow regimes in practical applications are
also discussed.
1
1. INTRODUCTION
Foam is an agglomeration of bubbles separated by thin liquid films [Bikerman, 1973]
often referred to as “lamella” (in singular) or “lamellae” (in plural). The presence of surface
active agents, called surfactants, reduces the interfacial tension between immiscible phases and
endows the liquid films between dispersed bubbles with great stability [Bikerman, 1973;
Schramm, 1994].
Understanding foam flow in pipes is a challenging and complicated issue. Some of the
major problems can be summarized as follows [Bikerman, 1973; Wilson, 1989; Schramm, 1994;
Prud'homme and Khan, 1996; Briceño and Joseph, 2003]: First, any realistic modeling and
simulation of foam flow should be based on the description of average bubble size and bubble
size distribution which, cannot be measured or estimated reliably in many cases. Second,
complications occur because of dynamic behavior of bubble generation and coalescence when
the foam is in motion. Bubbles are continuously generated near the pipe wall under high shear
stress and merged to form larger bubbles near the center of the flow conduit at which the shear
stress is minimal. These bubbles are rearranged constantly responding to the change in flow
conditions. Third, foam quality (fg), which is defined as the fraction of gas flow to the total flow,
can change significantly during the flow because of gas compressibility, which is indirectly
related to dynamics of bubble generation and coalescence. Phase exchange between internal gas
phase and external liquid phase may add another difficulty in estimating foam quality precisely.
Last, perhaps the biggest challenge in decades of foam research, experimental data accumulated
at particular test conditions cannot scale up or down easily, because the issues of bubble size,
bubble size distribution, bubble creation and coalescence, bubble rearrangements, and the change
in foam texture are nonlinearly commingled one another. There is no doubt that other
2
components relevant to surfactant chemistry such as salt concentration, pH, temperature,
additives, and so on should also be factored in.
A simple approach to model foam is to assume that foam is a homogeneous mixture
following either Newtonian or non-Newtonian fluid (Bingham plastic) behavior in which the
external liquid and internal gas phase travel almost at the same velocity [Wilson, 1989].
Although this simple approach may work reasonably well in some applications, it obviously does
not fully reflect the complexity of foam rheology in a comprehensive manner.
Recent experimental studies on foam rheology in porous media show interesting
behaviors during steady-state foam flow in consolidated porous rocks and unconsolidated sand-
or bead-packs [Osterloh and Jante, 1992, Alvarez et al., 2002, Kam et al., 2007a]. When the
steady-state pressure gradients are plotted as a function of gas and liquid injection velocities in x
and y axes, there exist two distinct flow regimes: a regime with relatively high gas fraction
having pressure-gradient contours almost independent of gas injection velocity; and the other
regime with relatively low gas fraction having pressure-gradient contours almost independent of
liquid injection velocities. The concept of two flow regimes is very helpful in designing foam
applications in improved or enhanced oil recovery processes. No efforts have been made so far
regarding how this two flow regime concept present in porous media can be extended to foam
flow mechanisms in pipes.
1.1. Objectives of This Study
Foam flow in pipe has been regarded as a separate issue from foam flow in porous media
because of the difference in flow mechanisms, especially the role of capillary pressure which is
minimal in the former but is crucial in the latter. But there are some common interests shared by
the two topics: (1) when the gas fraction is relatively high, bubbles become less stable and thus
foam rheology is governed by dynamics of bubble creation and coalescence in a water-deficient
3
environment and (2) when the liquid fraction is relatively high, bubbles become stable and thus
the transport of stable bubbles is the key to foam rheology.
The major objective of this study is to conduct laboratory foam flow experiments at
different test conditions in order to understand the rheological properties of foams in pipes. This
study, for the first time, focuses on the interpretation of foam rheology using the concept of two
flow regimes (i.e., high-quality regime and low-quality regime) as shown in recent foam flow
experiments in porous media. The experimental results are to be analyzed (1) to distinguish two
distinct flow regimes based on the steady-state pressure contours, (2) to identify whether the
flow rheology of each regime can be approximated by near-Newtonian, shear thinning, or shear
thickening behavior, and (3) to investigate the factors that influence the boundary between the
two flow regimes, i.e., the value of foam quality (fg*) that splits the map into two regimes.
The implications of two flow regimes during foam flow in pipe are also discussed.
1.2. Chapter Description
This study consists of five chapters which can be summarized as follows:
Chapter 1 briefly introduces the complexity of foam flow in general and overviews
theoretical background. The scope and objectives of this study are also listed.
Chapter 2 summarizes the fundamentals of foams in terms of foam stability, yield stress,
flow modeling, flow rheology in pipes, and flow rheology in porous media. It also reviews the
concept of two steady-state strong-foam regimes experimentally observed in recent studies of
foam flow in porous media.
Chapter 3 describes the details about experimental instruments, layouts, and procedures
employed in this study in order to measure and analyze foam rheology in pipes. The first half
depicts the materials and different components of experimental system, and the second half
4
outlines how the data obtained from the experiments can be processed and translated into the
format reported in the result section.
Chapter 4 provides the results of foam flow experiments over a broad range of
experimental conditions, i.e., at varying gas and liquid injection velocities under different
surfactant concentrations, surfactant formulations, opening sizes of foam generator, and/or
diameters of stainless steel pipe. The description of experimental results is followed by
discussions of significance and implication of the results in practical field applications.
Chapter 5 covers a summary of this study with conclusions and recommendations for
future work.
5
2. LITERATURE REVIEW
This chapter briefly reviews previous studies on the fundamentals of foams and bubbles,
factors affecting foam characteristics, and flow rheology of foams in pipes and porous media.
2.1. Stability of Foam as a Dispersed Phase
A system has a tendency to reduce its energy level as designed by Mother Nature. Any
dispersed systems such as foams and emulsions are therefore unstable, and eventually break
down and segregate into immiscible phases minimizing its interfacial area and energy level. The
presence of surface active agents, called surfactants, can retard the process of segregation
significantly, however. Anionic surfactants, often used in petroleum reservoir applications, have
negatively charged hydrophilic head groups and hydrophobic tail groups, and the electrostatic
repulsive force between the head groups endows foam films with stability [Schramm, 1994].
Once stable liquid films are formed and present with the help of surfactant molecules at
the interface, Laplace equation defines the pressure difference across the interface, which can be
described as follows:
⎟⎟⎠
⎞⎜⎜⎝
⎛+=−=
21
11RR
PPP liqgasc σ ,………………………...…………………...… (2.1)
where, Pgas and Pliq are gas and liquid pressures, Pc is the pressure drop across the interface
between gas and liquid phases (i.e., capillary pressure), σ is interfacial tension, and R1 and R2 are
two principal radii. Eq. (2.1) indicates that a curved interface between gas and liquid phases in
the presence of foam ends up with non-uniform pressure between gas and liquid. This implies
that gas mass in smaller bubbles can diffuse into larger bubbles because a foam mixture has a
wide range of bubble sizes. This in turn implies that even though the stability of thin liquid films
is guaranteed mechanically, dispersed gas phase can still decay and be segregated from liquid
phase by diffusion process.
6
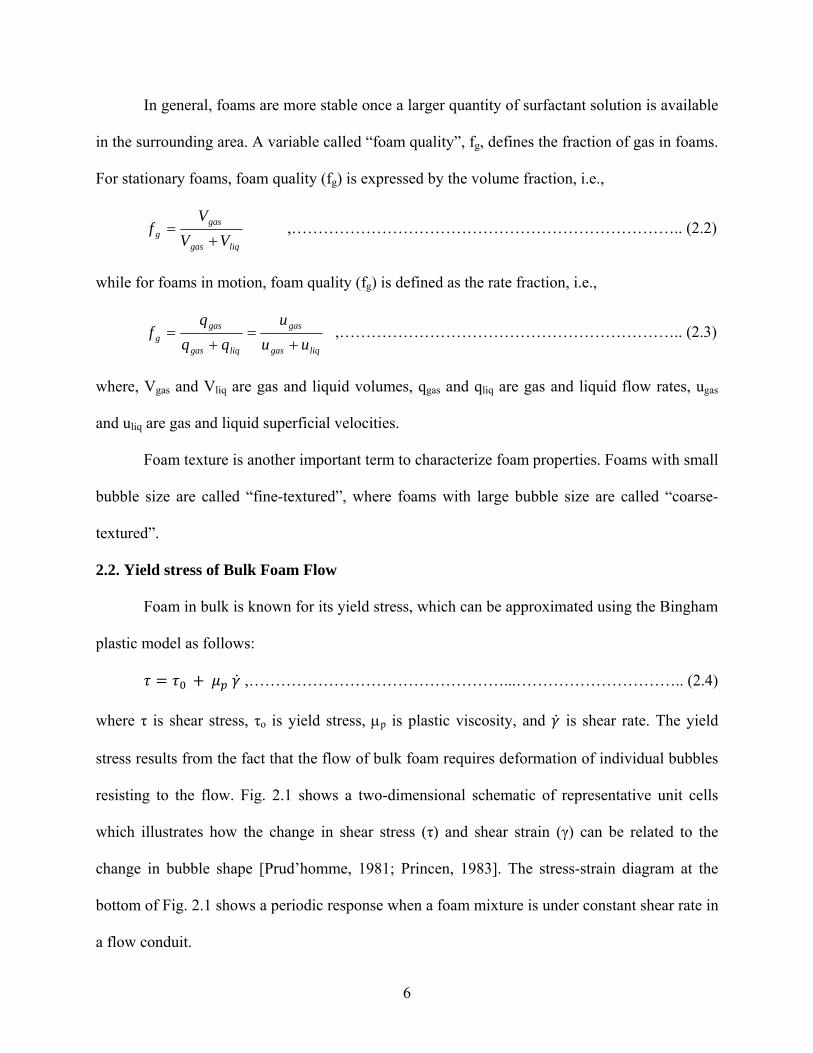
In general, foams are more stable once a larger quantity of surfactant solution is available
in the surrounding area. A variable called “foam quality”, fg, defines the fraction of gas in foams.
For stationary foams, foam quality (fg) is expressed by the volume fraction, i.e.,
liqgas
gasg VV
Vf
+= ,……………………………………………………………….. (2.2)
while for foams in motion, foam quality (fg) is defined as the rate fraction, i.e.,
liqgas
gas
liqgas
gasg uu
uqq
qf
+=
+= ,……………………………………………………….. (2.3)
where, Vgas and Vliq are gas and liquid volumes, qgas and qliq are gas and liquid flow rates, ugas
and uliq are gas and liquid superficial velocities.
Foam texture is another important term to characterize foam properties. Foams with small
bubble size are called “fine-textured”, where foams with large bubble size are called “coarse-
textured”.
2.2. Yield stress of Bulk Foam Flow
Foam in bulk is known for its yield stress, which can be approximated using the Bingham
plastic model as follows:
,…………………………………………...………………………….. (2.4)
where τ is shear stress, τo is yield stress, μp is plastic viscosity, and is shear rate. The yield
stress results from the fact that the flow of bulk foam requires deformation of individual bubbles
resisting to the flow. Fig. 2.1 shows a two-dimensional schematic of representative unit cells
which illustrates how the change in shear stress (τ) and shear strain (γ) can be related to the
change in bubble shape [Prud’homme, 1981; Princen, 1983]. The stress-strain diagram at the
bottom of Fig. 2.1 shows a periodic response when a foam mixture is under constant shear rate in
a flow conduit.
7
Fig. 2.1. Two dimensional representation of the origin of yield stress in the presence of foams: the interaction between different layers of foams causes a resistance to flow [upper schematic figure from Princen 1983; lower diagram from Prud’homme, 1981].
Fig. 2.2. Experimental data of yield stress of foam as a function of foam quality [from Blauer et al., 1974 ]: the yield stress increases sharply above a threshold value in which bubble to bubble interaction becomes significant.
The maximum resistance to the flow, which defines the yield stress, is known to be
sensitive to foam quality as illustrated in Fig. 2.2 [Blauer et al., 1974; Princen, 1983; Kraynik,
1988]: (1) at low foam quality, the yield stress is negligible because dispersed bubbles do not
8
interact each other; (2) at intermediate foam quality, the yield stress increases with increasing
foam quality because bubbles in different shear layers begin to interfere each other and the
degree of interference increases with foam quality, and (3) at high foam quality, there is a sudden
reduction in the magnitude of yield stress due to the coalescence of bubbles (or, instability of
foam mixtures) at dry conditions. The first and second points are well demonstrated
experimentally in the study of [Blauer et al., 1974].
The same concept of periodic unit cells can be used to investigate the origin of the yield
stress of foam-solid mixtures theoretically [Kam et al., 2002; Kam and Rossen 2002]. These
studies also show that although three-phase systems are more complicated, the yield stress of
foam-solid mixtures still primarily depends on the interactions between bubbles. For example,
Fig. 2.3(a) shows that the magnitude of dimensionless resistance force on the y axis changes with
the shear displacement (x axis) and the minimum value of the force, which is proportional to the
yield stress, increases with increasing gas fraction when the solid fraction is fixed at 49.8%. Fig.
2.3(b) shows that the resistance force depends on the fractions of three phases, and also
demonstrates the importance of bubble deformation and bubble-to-bubble and/or bubble-to-solid
interactions to quantify the yield stress. The trend of the yield stress as shown in Fig. 2.3 is
consistence with experimental findings [Harris et al., 1991; Bejuijen et al., 1999].
2.3. Fundamentals of Bulk Foam Rheology in Pipes
Understanding the origin of yield stress provides insights into the rheological properties
of bulk foams. Earlier studies point out that foam can be treated as a single uniform and
homogeneous fluid whose viscosity is significantly greater than either of gas or liquid phases
[Einstein, 1906; Hatschek, 1910; Mitchell, 1969, 1971]. These studies show that when the foam
quality is less than approximately 52%, gas bubbles are mostly spherical and uniformly
dispersed, implying that bubbles do not interfere each other significantly during the flow. For
9
foam qualities less than 52%, the yield stress of foam is also negligible by the same token and
the rheology of foam is similar to that of the external liquid phase. This is why foam is shown to
behave similar to Newtonian fluid at low foam quality.
(a) Dimensionless force resisting flow at different values of gas fraction (Fg) (solid
fraction (Fs) is fixed at 49.8 %)
(b) Dimensionless resisting force as a function of three-phase fractions (gas liquid, and
solids)
Fig. 2.3. The origin of yield stress of foam-solid mixtures: the concept of a representative unit cell in Princen-Prud’hommes model (Fig. 2.1) is still applicable in three-phase foam-solid mixtures [from Kam et al., 2002].
10
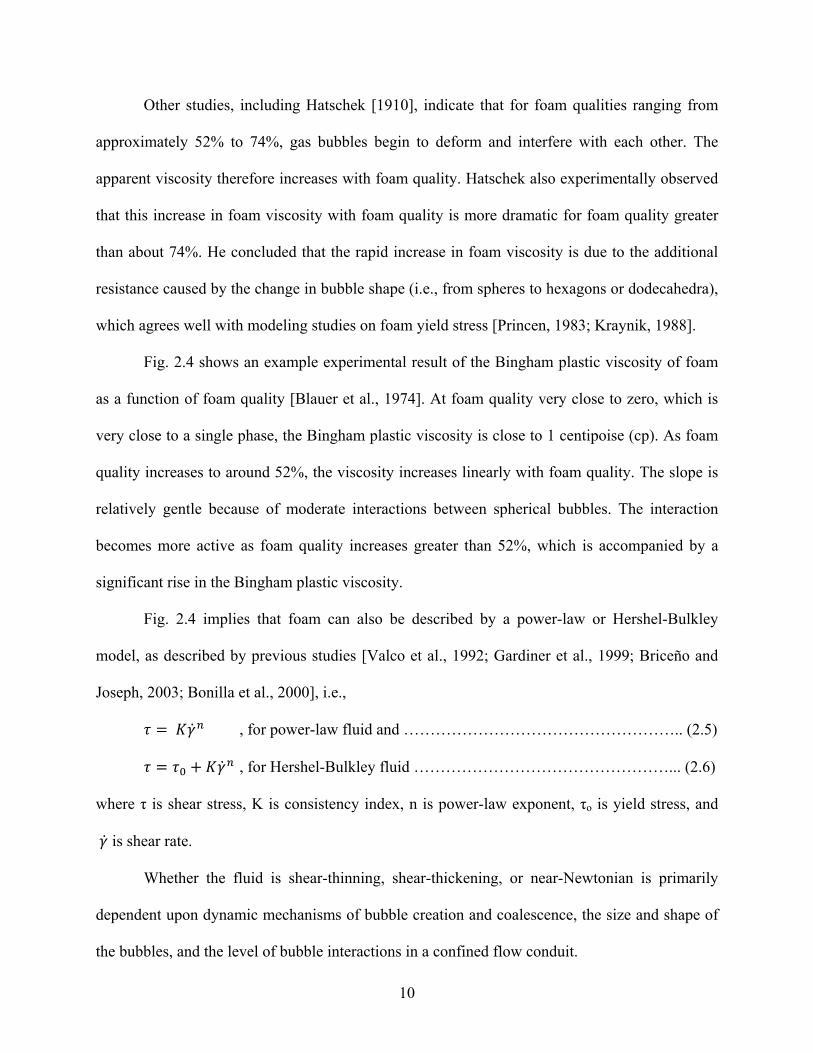
Other studies, including Hatschek [1910], indicate that for foam qualities ranging from
approximately 52% to 74%, gas bubbles begin to deform and interfere with each other. The
apparent viscosity therefore increases with foam quality. Hatschek also experimentally observed
that this increase in foam viscosity with foam quality is more dramatic for foam quality greater
than about 74%. He concluded that the rapid increase in foam viscosity is due to the additional
resistance caused by the change in bubble shape (i.e., from spheres to hexagons or dodecahedra),
which agrees well with modeling studies on foam yield stress [Princen, 1983; Kraynik, 1988].
Fig. 2.4 shows an example experimental result of the Bingham plastic viscosity of foam
as a function of foam quality [Blauer et al., 1974]. At foam quality very close to zero, which is
very close to a single phase, the Bingham plastic viscosity is close to 1 centipoise (cp). As foam
quality increases to around 52%, the viscosity increases linearly with foam quality. The slope is
relatively gentle because of moderate interactions between spherical bubbles. The interaction
becomes more active as foam quality increases greater than 52%, which is accompanied by a
significant rise in the Bingham plastic viscosity.
Fig. 2.4 implies that foam can also be described by a power-law or Hershel-Bulkley
model, as described by previous studies [Valco et al., 1992; Gardiner et al., 1999; Briceño and
Joseph, 2003; Bonilla et al., 2000], i.e.,
, for power-law fluid and …………………………………………….. (2.5)
, for Hershel-Bulkley fluid …………………………………………... (2.6)
where τ is shear stress, K is consistency index, n is power-law exponent, τo is yield stress, and
is shear rate.
Whether the fluid is shear-thinning, shear-thickening, or near-Newtonian is primarily
dependent upon dynamic mechanisms of bubble creation and coalescence, the size and shape of
the bubbles, and the level of bubble interactions in a confined flow conduit.
11
Fig. 2.4. Bingham plastic viscosity of foam as a function of foam quality [from Blauer et al., 1974]: the increase in foam texture causes an increase in plastic viscosity.
Briceño and Joseph’s study [2003] visualizes how foam texture changes depending upon
injection rates and injection velocities: fine-textured foams present at low foam quality (about fg
< 73 %), repetition of foam and gas slug at high foam quality (about fg > 97 %), and coarse-
textured foams present in between. Fig. 2.5 shows such an example resulting from laboratory
experiments in a small tube. In both foam qualities tested (foam qualities from 81 to 89 % and
from 90 to 96 %), apparent foam viscosity decreases with the shear stress because of fine
textured foams created at higher shear rate, meaning that foam is a shear-thinning fluid. It can
also be observed that at the same shear stress, the apparent viscosity of foams increases as tube
diameter increases. This implies that although higher shear stress in a smaller diameter is a
favorable condition to create fine-textured foams, higher capillary pressure has a dominant effect
to keep foam texture coarser in smaller tubes. Some studies found that the effective viscosity of
12
foams in pipes may decrease as the shear rate increases, because of the interplay between shear
stress, shear rate, foam texture, and dynamics of lamella creation and coalescence during foam
flow, which is a typical behavior of pseudo-plastic fluid [Mooney, 1931; Raza and Marsden,
1967; David and Marsden, 1969; Okpobiri and Ikoku, 1986]. This is consistent with previous
understanding that bubble size and bubble size distribution are the key to analyze foam rheology.
When it comes to a comparison between foam flow in relatively large pipe diameters and
foam flow in small tubes or pores, however, caution is needed because there are different
controlling mechanisms. The flow mechanism in small tubes or pores is primarily governed by
capillary phenomenon, while the flow mechanism in pipes is dominated by gravity, shear
stress/strain, and interaction between bubbles in pipes. The characteristics of foam flow in pores
are further explained in the following section.
Just like other fluids, the presence of two different flow patterns such as laminar and
turbulent flows also has a similar impact to foam flow in pipes. Blauer et al.’s study [1974]
shows that Moody’s chart that relates friction factor to Reynolds number at different pipe
roughness [Bird et al., 1960] is applicable to foam flow in pipes and correctly describes the
transition from laminar to turbulent flow at Reynolds numbers between 2000 and 2500.
Constructing a velocity-dependent flow-regime map, which consists of stratified flow, slug flow,
plug flow, and annular-mist flow, is also investigated [Guzman et al., 2005] to find that the
outcome is qualitatively in agreement with the flow regime map reported by Taiter and Dukler
[1976] but the exact location of transition from one regime to another deviates. Laboratory-
measured mean bubble size and bubble size distribution should be monitored during data
interpretation as shown by Raza and Marsden [1967] and Becher [1965].
Fig. 2.5.differentx-axes ar
2.4. Two
O
oil recov
The flow
. The changt tube diamre apparent
o Flow Regim
One use of fo
very applicat
w mechanism
(a) F
(b) F
ge in foam eters: foamt viscosity in
mes of Foam
oams in the
tions in whic
ms in porou
Foam qualit
Foam qualit
viscosity (ms behave as
n cp and y-a
m in Porous
petroleum i
ch bubbles a
us media are
13
ty between 8
ty between 9
(x axis) as s shear-thinnaxes are she
s Media
industry is i
are placed in
e different f
81 % and 8
90 % and 9
a function ning [from
ear stress in
n foam-assi
n a tiny pore
from flow m
89 %
96 %
of shear stDavid and M ATM x 10-5
sted improv
e structure [S
mechanisms
tress (y axiMarsden, 15.
ved and enha
Schramm, 1
in pipes in
is) at 969],
anced
994].
n that
14
capillary pressure plays significant and dominant roles in the way fluids are distributed and the
way different phases interact with each other [Rossen, 1996]. Capillary pressure also influences
flow rheology of foams in porous media by affecting the stability of foam films.
Laboratory flow experiments show that foam has three different states in porous media
[Gauglitz et al., 2002]: fine-textured foams with a significant reduction in gas mobility, coarse-
textured foams with a slight reduction in gas mobility, and foams with a moderate reduction in
gas mobility. They are also referred to as strong foam state, weak foam state, and intermediate
state. Similar to foam rheology in pipes, these three states are characterized by foam texture
resulting from complicated interactions between gas and liquid phases in a complicated pore
network [Kam and Rossen, 2003].
A number of studies put an emphasis on the rheology of strong foams in order to identify
how gas viscosity is affected by a wide range of experimental conditions including surfactant
formulations, surfactant concentrations, porosity and permeability of the medium, wettability of
solids, and so on. Osterloh and Jante’s study [1992] was the first to plot the measured steady-
state pressure drop during strong foam flow in porous media in a form of pressure contours as a
function of gas and liquid injection velocities, as shown in Fig. 2.6.
The experimental data during co-injection of nitrogen gas and surfactant solutions into a
2-ft long sandpack show that the pressure contours are vertical in the upper and left-hand side of
the plot while the pressure contours are horizontal in the lower and right-hand side of the plot.
The presence of two flow regimes of strong foam in porous media was further studied
comprehensively by Alvarez et al. [2001] using a wide range of experimental conditions
including different surfactant formulations, surfactant concentrations, rock types (Berea
sandstone, glass bead pack and sand pack), permeabilities, and backpressures. As shown in Fig.
2.7, their results are very similar to those in Osterloh and Jante’s study [1992]. Many other
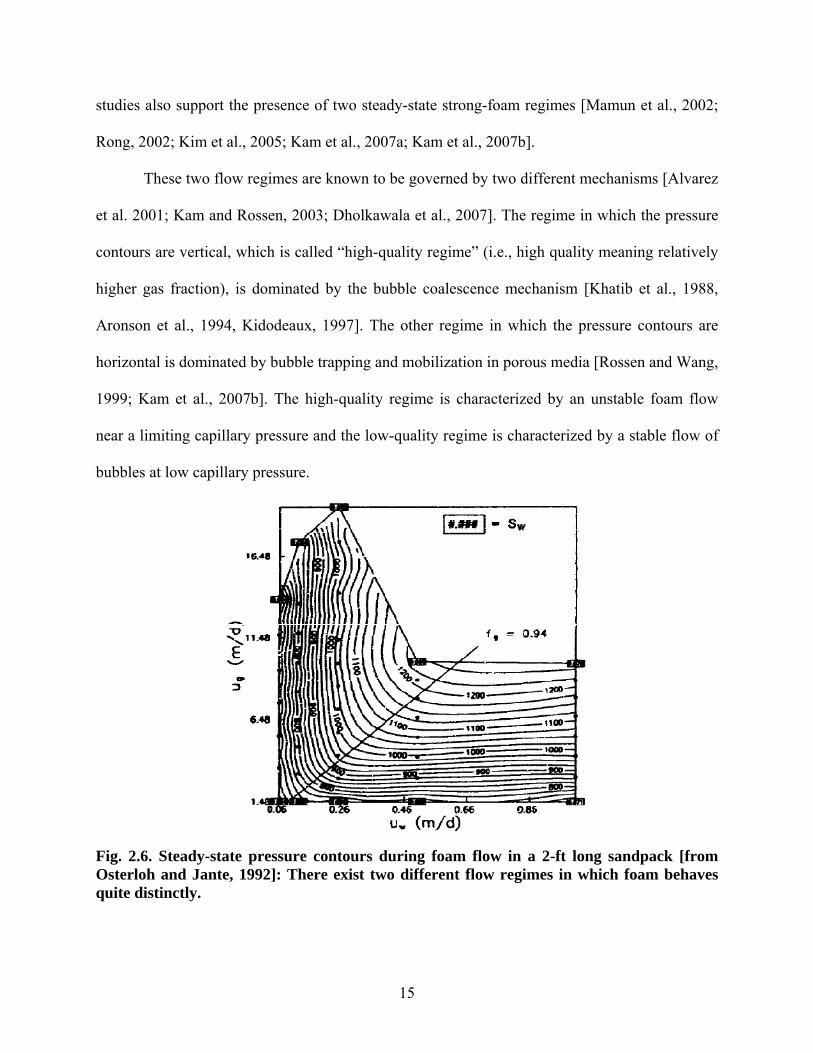
15
studies also support the presence of two steady-state strong-foam regimes [Mamun et al., 2002;
Rong, 2002; Kim et al., 2005; Kam et al., 2007a; Kam et al., 2007b].
These two flow regimes are known to be governed by two different mechanisms [Alvarez
et al. 2001; Kam and Rossen, 2003; Dholkawala et al., 2007]. The regime in which the pressure
contours are vertical, which is called “high-quality regime” (i.e., high quality meaning relatively
higher gas fraction), is dominated by the bubble coalescence mechanism [Khatib et al., 1988,
Aronson et al., 1994, Kidodeaux, 1997]. The other regime in which the pressure contours are
horizontal is dominated by bubble trapping and mobilization in porous media [Rossen and Wang,
1999; Kam et al., 2007b]. The high-quality regime is characterized by an unstable foam flow
near a limiting capillary pressure and the low-quality regime is characterized by a stable flow of
bubbles at low capillary pressure.
Fig. 2.6. Steady-state pressure contours during foam flow in a 2-ft long sandpack [from Osterloh and Jante, 1992]: There exist two different flow regimes in which foam behaves quite distinctly.
16
Fig. 2.7. Steady-state pressure-gradient contours during foam flow in 530-md Berea sandstone [from Alvarez et al., 2001]: the presence of two flow regimes are identified in a wide range of experimental conditions.
17
3. PROCEDURE AND METHODOLOGY
This chapter outlines how foam flow experiments were conducted to measure and
analyze foam rheology in pipes: the first section details the experimental design and materials
used, and the second section presents data interpretation and processing techniques.
3.1. Experimental Materials and Setup
A schematic of the laboratory setup used in this study is shown in Fig. 3.1.
Fig. 3.1. A schematic of experimental setup for foam flow in pipe used in this study
The experiments were conducted by injecting gas and surfactant solutions simultaneously
into a filter with either 50 µm or 90 µm opening size to generate fine-textured foams at the
upstream end of the pipe section. The fine-textured foams flowed through a visual cell, and then
into the pipe which was positioned in a horizontal direction. The pipe had multiple pressure ports
12.3 ft
18
which allowed the sectional pressure drops to be measured along the pipe. The visual cell
installed at the inlet permitted a direct observation of bubble size or foam texture. The pressure
ports were connected to pressure transducers, and the pressure signals transmitted into the
pressure transducers were collected and recorded in a computer on a real-time basis. Figs. 3.2
through 3.5 show photos of actual laboratory equipment used in this study.
(Colgate-Palmolive Company, NY). All of these are anionic surfactants. CEDEPAL FA-406,
Petrostep CG-50, Stepanform 1050, and Aquet TD-600 are surfactants actively used in drilling
and completion processes in the petroleum industry. CEDEPAL FA-406 was selected as the
base-case surfactant because foam stability experiments with test tubes showed that CEDEPAL
FA-406 created fine-textured foams more easily and the foam formed by CEDEPAL FA-406
exhibited better stability compared to other surfactants at the same concentration. Many
experiments were performed at different surfactant concentrations by adding surfactant delivered
from the manufacturers into distilled and de-ionized water. The surfactant concentration was
reported in weight percent, wt %.
A fixed rate of the gas phase was injected by a Brooks Mass Flow Controller 5850E
(Brooks Instruments, PA), and the flow rate was regulated by a Brooks Microprocessor Control
& Readout Unit 0152 (Brooks Instrument, PA). Nitrogen was used as the gas phase in all
experiments and the range of flow rates was varied from 0 to 5000 Sccm (standard cubic
centimeters per minute). The surfactant solution was injected by a high-accuracy positive-
displacement Optos 3HM Pump (Eldex, CA) which has the rate range of 0.04 to 80 cc/min.
Two different sizes of pipes were used: 0.5 inch and 1 inch NPS (Nominal Pipe Size)
stainless steel pipes, with 0.36 inch and 0.957 inch ID, respectively. Pressure ports with an
opening size of 0.125 inch ID were drilled and positioned along the stainless steel pipes, instead
of tee-joints, in order to minimize possible disturbance during the flow. The 1 inch pipe was
about 12 ft long, while the 0.5 inch pipe was about 12.3 ft long. The pipes consisted of seven
segments with eight pressure ports, named from pressure port A through H. They are equally
spaced (approximately 1.7 ft apart for the 0.5 inch NPS pipe and 1.72 ft apart for the 1 inch NPS
20
pipe), port A being installed just before the inlet and port H being installed just after the outlet.
Because the inlet and outlet tubing was 0.5 inch NPS, the pressure measurements in the first and
last ports (ports A and H) in the 1 inch pipe experiments were not included in the analysis
because of the inlet and outlet effect.
Pressure was measured by Omega Voltage Pressure Transducers (Omega Engineering
Inc., CT), with the pressure range of 30, 100, and 500 psia. They provided good precision, with
possible error within 0.02% of the maximum pressure range. These pressure transducers were
calibrated with a Dead Weight Tester (Refinery Supply Company, Inc., Tulsa, OK) from time to
time throughout the experiments to ensure the accuracy of pressure measurements. A DIN-113
5V Input/RS-485 Output pressure demodulator (Omega Engineering Inc., CT) was used for
signal processing. The data were collected and processed by an in-house data acquisition system
built in Excel. Each pressure signal from the pressure transducer was collected at a time interval
of about 5 seconds. Figs. 3.6 through 3.11 show additional items of equipment described in this
section.
Fig. 3.6. Brooks microprocessor flow control unit
Fig. 3.7. Positive displacement Optos pumps
21
Fig. 3.8. Dead weight tester Fig. 3.9. 0.5 and 1 inch stainless steel pipes
Fig. 3.10. 0.5 and 1 inch pipe outlets Fig. 3.11. Foam disposal
3.2. Experimental Procedure and Data Processing
This study carried out nearly 500 sets of experiments grouped into 14 experimental cases
in order to obtain the steady-state pressure responses at different experimental conditions. Table
3.1 shows a summary of 14 different cases of experiments.
At given experimental conditions (Case 1 through Case 14), a series of experiments was
conducted at varying gas and liquid injection velocities in order to measure the steady-state
pressure drops between the pressure ports. Once the system reached a steady state by showing
stable pressure responses, a new combination of gas and liquid injection rates was imposed.
22
Occasionally the same sets of gas and liquid injection rates were repeated so as to check
reproducibility of pressure measurements. In all cases tested, the experimental results were
repeatable. Table 3.2 and 3.3 show different combinations of gas and liquid injection rates used
in 1 inch NPS and 0.5 inch NPS stainless steel pipes, respectively.
Table 3.1. A brief summary of all 14 experimental cases conducted in this study
Table 3.2. Different combinations of gas and liquid injection rates in 1 inch NPS, (0.957 inch ID stainless steel pipe) (cf. Cases 11 and 12 as shown in Table 3.1)
(1000 cc/min is equivalent to 0.036 m/s or 0.178 ft/sec)
23
Table 3.3. Different combinations of gas and liquid injection rates in 0.5 inch NPS, (0.36 inch ID pipe) (cf. Cases 1 through 10 as shown in Table 3.1)
(1000 cc/min is equivalent to 0.254 m/s or 0.83 ft/s)
Variables reported in this study are defined as follows: foam quality (fg) is a function of
the volumetric flow rates of the gas and liquid phases
liqgas
gasg qq
qf
+= , ………………………………..………………………………. (3.1)
where qgas and qliq represent volumetric flow rates of gas and liquid, respectively. The values for
fg in this study ranged from 86 % to 99.6 %.
The reported pressure values are time averaged once the system is believed to be in the
steady state. Therefore, the pressure at location i (Pi) can be calculated by
N
PP
N
nn
i
∑== 1 ,………………..………………..…………………………………...... (3.2)
where, N is the number of the data points used for this calculation. The pressure drop between
any two of pressure ports i and j can then be expressed by
Press APress BPress CPress DPress EPress FPress GPress H
Gas Rate= 1000 Liq. Rate = 20
Gas Rate= 1000 Liq. Rate = 80
Gas Rate= 1000 Liq. Rate = 60
Gas Rate= 1000 Liq. Rate = 40
Gas Flow Rate in [Scc/min]Liquid Flow Rate in [ml/min]
Fig. 4.2. Pressure response as a function of time with a stepwise change in gas and liquid injection rates, continued (Case 1; also base case): (0.5 inch NPS stainless steel pipe, 1 wt% surfactant concentration using Cedepal FA -406, 50 µm filter opening size)
For example, the pressure data are relatively smooth and stable at liquid injection rates of 40, 60,
and 80 cc/min while the pressure data look oscillating at liquid injection rate of 20 cc/min.
Although not shown here, similar experiments that repeat those in Fig. 4.2 exhibit the same
behavior consistently, indicating the presence of the threshold foam quality that separates the two
regimes. Subsequent experiments varying gas injection rate at fixed liquid injection rate also
show the presence of a threshold foam quality. The importance and implication of this behavior
is further discussed in the following sections.
The pressure data obtained from Figs. 4.1 through 4.3 can be plotted in a two-
dimensional space with superficial liquid velocity on the x-axis and superficial gas velocity on
the y-axis, as shown in Fig. 4.4. Note that the gas injection velocities in the plot are adjusted at
32
the average pressure in the system after considering gas compressibility. Each point in the plot
has corresponding gas and liquid injection velocities, and the measured pressure drop between
the pressure ports A and H (PA-PH) is specified in psi. Two pressure contours with the pressure
drops of 7 psi and 22 psi are delineated based on the steady-state pressure-drop measurements.
Press APress BPress CPress DPress EPress FPress GPress H
Gas Rate= 2000 Liq. Rate = 60
Gas Rate= 5000 Liq. Rate = 60
Gas Rate= 4000 Liq. Rate = 60
Gas Rate= 3000 Liq. Rate = 60
Gas Flow Rate in [Scc/min]Liquid Flow Rate in [ml/min]
Fig. 4.3. Pressure response as a function of time with a stepwise change in gas and liquid injection rates, continued (Case 1; also base case): (0.5 inch NPS stainless steel pipe, 1 wt% surfactant concentration using Cedepal FA -406, 50 µm filter opening size)
Fig. 4.4 demonstrates a few important features of foam flow in pipe. First, the whole two-
dimensional domain can be separated into two parts by a straight line that represents the
threshold foam quality (fg*). The upper and left-hand side is called high-quality regime and the
lower and right-hand side is called low-quality regime. The value of fg* in the base case is shown
to be relatively high, about 99%, but this value can vary depending on many experimental
33
conditions as shown in later sections. Second, the slope of the pressure contour in the high-
quality regime is much higher than that in the low-quality regime. The almost horizontal pressure
contours (or, the pressure contours with gentle slope) in the low-quality regime imply that the
steady-state pressure drop is primarily determined by gas injection velocity, being relatively
insensitive to liquid injection velocity. The pressure contours in the high-quality regime imply
that the steady-state pressure drop is strongly affected by both gas and liquid injection velocities.
Third, if an experiment were carried out by increasing gas injection velocity at fixed liquid
injection velocity (i.e., following an imaginary vertical line in Fig. 4.4), the pressure drop would
increase with gas injection velocity until it reaches a maximum, and then the pressure drop
would decrease with gas injection velocity. If an experiment were carried out such that the liquid
injection velocity was increased at fixed gas injection velocity (i.e., following an imaginary
horizontal line in Fig. 4.4), the pressure drop would increase with liquid injection velocity until it
reaches a maximum, and then the pressure drop would stay almost at the same level or decrease
very gradually with further increase in gas injection velocity. Last, the contours indicate that both
“foam rheology to the liquid injection velocity” in the high-quality regime and “foam rheology to
the gas injection velocity” in the low-quality regime are slightly shear thickening with the power-
law exponent of around 1.5 to 1.6. This means that doubling the injection rate roughly results in
2.83 to 3.03 times increase in pressure drop. (This study does not interpret “foam rheology to the
gas injection velocity” in the high-quality regime because of very small pressure drops and
“foam rheology to the liquid injection velocity” in the low-quality regime because of negligible
pressure changes.)
In addition to different pressure contours, there are some other aspects that distinguish the
two regimes. As pointed out in Fig. 4.1, the high-quality regime is characterized by an oscillating
and unstable pressure response, while the low-quality regime is characterized by a stable
34
pressure response. These characteristics are consistent with the observations made at the outlet: a
very fine-textured homogeneous mixture was observed for the low-quality regime foams, but a
sequence of free gas and fine-textured foam slug was observed in the high-quality regime foams.
This implies that there are two different mechanisms governing foam rheology in the high-
quality and low-quality regimes. This is further discussed in later sections.
Fig. 4.4. Steady-state pressure drops, in psi, as a function of superficial gas and liquid injection velocities (Case 1; also base case): (0.5 inch NPS stainless steel pipe, 1 wt% surfactant concentration using Cedepal FA-406, 50 µm filter opening size)
It is also worthwhile to point out that the two values of pressure drops, “17.78” psi and
“27.49” psi highlighted in Fig. 4.4, were the onset of unstable flow behavior during the
experiments where the gas injection velocity was being increased at fixed liquid injection
velocity. This implies that the transition from stable to unstable flow characteristics coincides
35
roughly with the fg* that separates the two flow regimes based on the pressure contours. In
addition, the two values of pressure drops are shown to be the maximum pressure drops along
the vertical line (i.e., varying gas injection velocity at fixed liquid injection velocity), which
implies that the maximum pressure drops are likely to happen near the transition from one
regime to the other, or near fg* equivalently. These concepts are shown to be consistent and true
in all experiments as shown in the following sections.
The similar pressure response shown by the pressure contours (i.e., 7 psi and 22 psi) in
Fig. 4.4 are observed consistently in all experiments. Therefore, it is believed that they represent
the rheology of the steady-state foam flow in pipes within the experimental conditions covered in
this study. The pressure contours, however, are not drawn in the figures below in order to avoid a
biased interpretation.
4.3. Effect of Surfactant Concentration (Cases 1, 2, and 3)
Two other series of experiments are conducted in order to investigate the effect of
surfactant concentrations. Experimental conditions are identical to those in Case 1 (i.e., the base
case) except that the surfactant concentrations are 5 wt% and 0.1 wt% in Case 2 and Case 3,
respectively.
Fig. 4.5 shows the pressure response of Case 2 with 5 wt% Cedepal FA-406 surfactant
solution, which can be compared with Figs. 4.1 through 4.3. Unlike the base case, the pressure
responses are relatively stable within the entire range of gas and liquid injection velocities tested.
The steady-state pressure drops between ports A and H, as shown in Fig. 4.6, illustrate that the
entire set of data points lie in the low-quality regime. This implies that the value of fg* in this
case is greater than 99.6%, the highest foam quality tested in the experiments.
Fig. 4.7 shows the pressure response of Case 3 with 0.1 wt% Cedepal FA-406 surfactant
solution, which can be compared with Figs. 4.1 through 4.3 or Fig. 4.5.
36
Cas
e 2
- Pre
ssur
e P
rofi
le M
easu
rem
ent
0.0
5.0
10.0
15.0
20.0
25.0
30.0
35.0
40.0
45.0
50.0
025
050
075
010
0012
5015
0017
5020
0022
5025
0027
5030
0032
5035
0037
5040
0042
5045
0047
50T
ime
(sec
)
Pre
ssu
re (p
si)
Pre
ss A
Pre
ss B
Pre
ss C
Pre
ss D
Pre
ss E
Pre
ss F
Pre
ss G
Pre
ss H
Gas
= 3
000
Liq.
= 8
0
Gas
= 4
000
Liq.
= 8
0
Gas
= 5
000
Liq.
= 8
0
Gas
= 5
000
Liq.
= 6
0
Gas
= 5
000
Liq.
= 4
0
Gas
= 5
000
Liq.
= 2
0
Gas
= 4
000
Liq.
= 2
0
Gas
= 3
000
Liq.
= 2
0
Gas
= 2
000
Liq.
= 2
0
Gas
= 1
000
Liq.
= 2
0
Gas
Flo
w R
ate
in [S
cc/m
in]
Liq
uid
Flo
w R
ate
in [m
l/min
]
Fig.
4.5
. Pre
ssur
e re
spon
se a
s a fu
nctio
n of
tim
e w
ith a
step
wis
e ch
ange
in g
as a
nd li
quid
inje
ctio
n ra
tes (
Cas
e 2)
: (0
.5 in
ch N
PS st
ainl
ess s
teel
pip
e, 5
wt%
surf
acta
nt c
once
ntra
tion
usin
g C
edep
al F
A -4
06, 5
0 µm
filte
r op
enin
g si
ze
37
22.13
28.10
33.4436.52
30.17
26.01
31.07
20.47
24.1028.28
34.87
40.83
20.59
10.71
17.2815.53 14.79
7.717.858.36
4.42 3.99 3.63 3.25
0.00
0.10
0.20
0.30
0.40
0.50
0.60
0.000 0.005 0.010 0.015 0.020 0.025
Ug (m/sec)
Uw (m/sec)
Case 2 - Pressure Drop Summary
Fig. 4.6. Steady-state pressure drops, in psi, as a function of superficial gas and liquid injection velocities (Case 2): (0.5 inch NPS stainless steel pipe, 5 wt% surfactant concentration using Cedepal FA-406, 50 µm filter opening size)
In contrast to Case 2 (cf. Fig. 4.5), the pressure responses are relatively scattered in many
combinations of gas and liquid injection velocities. The steady-state pressure drops in Fig. 4.8
show that the two-dimensional domain is separated by a much lower value of fg*, around 92 to
93%, or possibly even lower than that.
Comparing Figs. 4.4, 4.6, and 4.8, it can be concluded that a decrease in surfactant
concentration generally decreases the value of fg*, spanning the region occupied by the high-
quality regime. This is consistent with our intuition in that the reduction in surfactant
concentration is likely to cause foams to be less stable, resulting in the stretch of unstable high-
quality regime. This implies that a surfactant with poor foamability may tend to decrease the
value of fg* by the same token which is discussed in the later section.
Press APress BPress CPress DPress EPress FPress GPress H
Gas = 2000 Liq. = 40
Gas = 2000 Liq. = 60
Gas = 2000 Liq. = 80
Gas = 3000 Liq. = 80
Gas = 3000 Liq. = 60
Gas = 3000 Liq. = 40 Gas = 3000
Liq. = 20
Gas Flow Rate in [Scc/min]Liquid Flow Rate in [ml/min]
Fig. 4.7. Pressure response as a function of time with a stepwise change in gas and liquid injection rates (Case 3): (0.5 inch NPS stainless steel pipe, 0.1 wt% surfactant concentration using Cedepal FA -406, 50 µm filter opening size)
The foam flow rheology to the gas injection velocity in the low-quality regime in Case 2
(cf. Fig. 4.6) shows shear-thickening behavior with a power-law exponent of around 1.5 to 1.6,
which is identical to that in the base case. The foam flow rheology to the liquid injection velocity
in the high-quality regime in Case 3 (cf. Fig. 4.8) also shows shear thickening behavior but with
much higher power-law exponent, ranging from 2.3 to 3.3. It should be noted again that this
study does not interpret “foam rheology to the gas injection velocity” in the high-quality regime
because of very small pressure drops and “foam rheology to the liquid injection velocity” in the
low-quality regime because of negligible pressure changes.
39
0.12 0.31
0.880.410.18
2.972.011.400.74
1.821.93 2.09 2.08
0.00
0.10
0.20
0.30
0.40
0.50
0.60
0.70
0.80
0.000 0.005 0.010 0.015 0.020 0.025
Ug (m/sec)
Uw (m/sec)
Case 3 - Pressure Drop Summary
fg* = 92.6 %
Fig. 4.8. Steady-state pressure drops, in psi, as a function of superficial gas and liquid injection velocities (Case 3): (0.5 inch NPS stainless steel pipe, 0.1 wt% surfactant concentration using Cedepal FA-406, 50 µm filter opening size)
4.4. Effect of Filter Opening Size (Cases 4, 5, and 6)
Further experiments were conducted in order to study the effect of filter opening size.
Because a filter installed upstream of the pipe inlet serves as a foam generator, foam rheology in
the pipe might be affected by the opening size. If the measured pressure responses are insensitive
to the filter opening size, it implies that the fine-textured foam artificially created upstream
coarsens and rearranges rapidly such that foam could reach its steady-state texture within the
pipe quickly.
Three series of experiments (Cases 4, 5, and 6) repeat Cases 1, 2, and 3 respectively, but
using 90µm filter opening size instead of 50µm opening size. All other experimental conditions
were kept unchanged. Although foam generation in this experiment occurs at very high injection
40
rates, a 1.8 times increase in opening size would roughly correspond to 5.83 times increase in
bubble volume, if the flow rate were relatively low and the bubbles were created by snap-off
mechanism.
Fig. 4.9 shows the results of Case 4 with 90µm filter opening size at 1 wt% Cedepal FA-
406 surfactant solution, and Fig. 4.10 shows the corresponding plot of pressure drops as a
function of gas and liquid injection velocities. As compared with Figs. 4.1 and 4.4 in the base
case (i.e., 50µm filter opening size at 1 wt% Cedepal FA-406 surfactant), no significant
differences are observed – the pressure data show both high-quality and low-quality regimes and
the pressure values at the corresponding gas and liquid injection velocities are comparable.
Figs. 4.11 and 4.12 show the results of Case 5 with 90µm filter opening size at 5 wt%
Cedepal FA-406 surfactant solution which can be compared and contrasted to Figs. 4.5 and Fig.
4.6 in Case 2 (i.e., 50µm filter opening size at 5 wt% Cedepal FA-406 surfactant). Again, there
are no significant differences between these two cases – all of the pressure data fall within the
low-quality regime and individual pressure values are comparable.
Figs. 4.13 shows the steady-state pressure drops of Case 6 with 90µm filter opening size
at 0.1 wt% Cedepal FA-406 surfactant solution which can be compared with Fig. 4.8 in Case 3
The earlier observation that the high-quality regime stretches with decreasing surfactant
concentration with 50µm filter opening size seems still valid with 90µm filter opening size.
Further the transition between the two flow regimes looks similar. Although the individual
pressure values are slightly higher for the smaller filter size, there is no strong evidence that the
overall pressure responses in Case 6 are not consistent with those in Case 3. The magnitude of
pressure values and the difference in the pressure data between Case 3 and Case 6 are too small
(i.e., less than 3 psi and many of them less than 1 psi) to draw any particular firm conclusions.
41
Cas
e 4
- Pre
ssu
re P
rofi
le M
easu
rem
ent
0.0
5.0
10.0
15.0
20.0
25.0
30.0
35.0
40.0
025
050
075
010
0012
5015
0017
5020
0022
5025
0027
5030
0032
5035
0037
5040
0042
5045
00T
ime
(sec
)
Pre
ssur
e (p
si)
Pre
ss A
Pre
ss B
Pre
ss C
Pre
ss D
Pre
ss E
Pre
ss F
Pre
ss G
Pre
ss H
Gas
= 3
000
Liq.
= 8
0
Gas
= 5
000
Liq.
= 2
0
Gas
= 5
000
Liq.
= 4
0
Gas
= 5
000
Liq.
= 6
0 G
as =
500
0 Li
q. =
80
Gas
= 4
000
Liq.
= 8
0
Gas
= 4
000
Liq.
= 2
0
Gas
= 3
000
Liq.
= 2
0
Gas
= 2
000
Liq.
= 2
0
Gas
= 1
000
Liq.
= 2
0
Gas
Flo
w R
ate
in [S
cc/m
in]
Liq
uid
Flo
w R
ate
in [m
l/min
]
Fig.
4.9
. Pre
ssur
e re
spon
se a
s a fu
nctio
n of
tim
e w
ith a
step
wis
e ch
ange
in g
as a
nd li
quid
inje
ctio
n ra
tes (
Cas
e 4)
: (0
.5 in
ch N
PS st
ainl
ess s
teel
pip
e, 1
wt%
surf
acta
nt c
once
ntra
tion
usin
g C
edep
al F
A -4
06, 9
0 µm
filte
r op
enin
g si
ze)
42
19.7925.5130.7332.25
22.37
2.70
4.13
8.04
16.79
7.54
22.8127.08
14.33
21.3127.38
13.3115.85
6.126.306.95
3.52 2.37 2.24 2.31
0.00
0.20
0.40
0.60
0.80
1.00
1.20
1.40
0.000 0.005 0.010 0.015 0.020 0.025
Ug (m/sec)
Uw (m/sec)
Case 4 - Pressure Drop Summary
fg* = 99%
Fig. 4.10. Steady-state pressure drops, in psi, as a function of superficial gas and liquid injection velocities (Case 4): (0.5 inch NPS stainless steel pipe, 1 wt% surfactant concentration using Cedepal FA-406, 90 µm filter opening size)
The fact that the pressure response in the high-quality regime oscillates adds another
difficulty.
The results from Figs. 4.9 through 4.13 indicate that the measured pressure responses
with 90µm filter opening size do not differ meaningfully from those with 50µm filter opening
size at three different surfactant concentrations. This suggests that the steady-state pressure drops
measured in pipes are not markedly affected by the filter opening size as long as fine-textured
foams are formed prior to reaching the pipe inlet. The influence of foam generator is investigated
in more details within Cases 13 and 14. This is important to understand the role of foam
generator in the experiments, because fined-textured foams can be pre-generated in the upstream
tubing (1/8 inch ID) and connections prior to flowing into the pipe.
43
Cas
e 5
- Pre
ssu
re P
rofi
le M
easu
rem
ent
0.0
5.0
10.0
15.0
20.0
25.0
30.0
35.0
40.0
45.0
50.0
025
050
075
010
0012
5015
0017
5020
0022
5025
0027
5030
0032
5035
0037
5040
0042
5045
00T
ime
(sec
)
Pre
ssur
e (p
si)
Pre
ss A
Pre
ss B
Pre
ss C
Pre
ss D
Pre
ss E
Pre
ss F
Pre
ss G
Pre
ss H
Gas
= 1
000
Liq
. =
20
Gas
= 5
000
Liq
. =
40
Gas
= 5
000
Liq
. =
60G
as =
500
0 Li
q. =
80
Gas
= 4
000
Liq
. =
80
Gas
= 3
000
Liq.
= 8
0
Gas
= 4
000
Liq
. =
20
Gas
= 5
000
Liq
. =
20
Gas
= 3
000
Liq
. =
20
Gas
= 2
000
Liq
. =
20
Gas
Flo
w R
ate
in [S
cc/m
in]
Liq
uid
Flo
w R
ate
in [m
l/min
]
Fig.
4.1
1. P
ress
ure
resp
onse
as a
func
tion
of ti
me
with
a st
epw
ise
chan
ge in
gas
and
liqu
id in
ject
ion
rate
s (C
ase
5):
(0.5
inch
NPS
stai
nles
s ste
el p
ipe,
5 w
t% su
rfac
tant
con
cent
ratio
n us
ing
Ced
epal
FA
-406
, 90
µm fi
lter
open
ing
size
)
44
20.03
25.71
31.0633.42
36.4140.76
34.68
27.93
19.43
9.09
24.43
30.69
15.36
22.19
28.17
14.2217.09
7.117.227.81
2.83 2.86 2.85 3.31
0.00
0.10
0.20
0.30
0.40
0.50
0.60
0.000 0.005 0.010 0.015 0.020 0.025
Ug (m/sec)
Uw (m/sec)
Case 5 - Pressure Drop Summary
Fig. 4.12. Steady-state pressure drops, in psi, as a function of superficial gas and liquid injection velocities (Case 5): (0.5 inch NPS stainless steel pipe, 5 wt% surfactant concentration using Cedepal FA-406, 90 µm filter opening size)
4.5. Effect of Surfactant Formulation (Cases 7, 8, 9, and 10)
Surfactant formulation has been known to be an important parameter because it affects
the stability of thin films and the interactions between gas, liquid, and pipe surface through
surface chemistry. This study employs Cedepal FA-406 as the base-case surfactant, because
Cedepal FA-406 was shown to be superior to other surfactants tested (Petrostep CG-50,
Stepanform 1050, Aquet TD-600, and Ultra Palmolive) in simple test-tube foam stability tests at
the same surfactant concentration. All of these experiments, which are called Cases 7, 8, 9, and
10, are conducted at the experimental conditions identical to the base case (i.e., 1 wt% surfactant
Fig. 4.13. Steady-state pressure drops, in psi, as a function of superficial gas and liquid injection velocities (Case 6): (0.5 inch NPS stainless steel pipe, 0.1 wt% surfactant concentration using Cedepal FA-406, 90 µm filter opening size)
Figs. 4.14 and 4.15 show the results with 1 wt% of Petrostep CG-50 (Case 7). Compared
with Fig. 4.1 (base case), Fig. 4.14 shows more fluctuation in the pressure data. This is consistent
with the understanding that Petrostep CG-50 is a weaker foamer than Cedepal FA-406 in foam
stability tests. Fig. 4.15 shows the steady-state pressure responses. In contrast to Fig. 4.4 (base
case), two different aspects can be easily observed in Fig. 4.15: (1) the magnitude of pressure
drop is reduced in all gas and liquid injection velocities tested and, especially, the maximum
pressure drop in Case 7 is less than a third of that in the base case (i.e., 32.03 psi in Fig. 4.4 vs.
10.07 psi in Fig. 4.15) and (2) the value of fg* that separates the two regimes is reduced to about
96% in Case 7 rather than 99% in the base case. These two features are also consistent with the
fact that Petrostep CG-50 is a weaker foamer than Cedepal FA-406.
46
Cas
e 7
- Pre
ssur
e P
rofi
le M
easu
rem
ent
0.0
2.0
4.0
6.0
8.0
10.0
12.0
025
050
075
010
0012
5015
0017
5020
0022
5025
0027
5030
0032
5035
0037
5040
0042
5045
00T
ime
(sec
)
Pre
ssur
e (p
si)
Pre
ss A
Pre
ss B
Pre
ss C
Pre
ss D
Pre
ss E
Pre
ss F
Pre
ss G
Pre
ss H
Gas
= 1
000
Liq.
= 2
0
Gas
= 5
000
Liq.
= 4
0
Gas
= 5
000
Liq.
= 6
0
Gas
= 5
000
Liq.
= 8
0
Gas
= 4
000
Liq.
= 8
0
Gas
= 3
000
Liq.
= 8
0
Gas
= 4
000
Liq.
= 2
0
Gas
= 5
000
Liq.
= 2
0 G
as =
300
0 Li
q. =
20
Gas
= 2
000
Liq.
= 2
0
Gas
Flo
w R
ate
in [S
cc/m
in]
Liq
uid
Flo
w R
ate
in [m
l/min
]
Fig.
4.1
4. P
ress
ure
resp
onse
as a
func
tion
of ti
me
with
a st
epw
ise
chan
ge in
gas
and
liqu
id in
ject
ion
rate
s (C
ase
7):
(0.5
inch
NPS
stai
nles
s ste
el p
ipe,
1 w
t% su
rfac
tant
con
cent
ratio
n us
ing
Petr
oste
p C
G-5
0, 5
0 µm
filte
r op
enin
g si
ze)
47
10.07
7.79
4.72
2.701.21
0.14
0.19
0.34
0.61
0.96
2.35
1.81
5.94
5.88
3.76
8.95
3.03
5.804.382.27
4.07 2.73 2.31 2.09
0.00
0.20
0.40
0.60
0.80
1.00
1.20
1.40
0.000 0.005 0.010 0.015 0.020 0.025
Ug (m/sec)
Uw (m/sec)
Case 7 - Pressure Drop Summary
fg* = 96.15 %
Fig. 4.15. Steady-state pressure drops, in psi, as a function of superficial gas and liquid injection velocities (Case 7): (0.5 inch NPS stainless steel pipe, 1 wt% surfactant concentration using Petrostep CG-50, 50 µm filter opening size)
Both regimes show shear-thickening behavior to the liquid injection velocity in the high-
quality regime and to the gas injection velocity in the low-quality regime. The power-law
exponent in the high-quality regime ranges from 1.8 to 2.4, which is somewhat greater than the
exponent in the base case (i.e., 1.5 to 1.6), while the power-law exponent in the low-quality
regime ranges from 1.3 to 1.8, which is comparable to the base case.
Figs. 4.16 and 4.17 show the results with 1 wt% of Stepanform 1050 (Case 8). If a
comparison is made with the base case, the individual pressure values tend to be either
comparable or reduced slightly, and the fg* seems to be lowered somewhat. The power-law
exponents are around 1.8 to the liquid injection velocity in the high-quality regime, and 1.4 to 1.6
to the gas injection velocity in the low-quality regime.
48
Cas
e 8
- Pre
ssu
re P
rofi
le M
easu
rem
ent
0.0
5.0
10.0
15.0
20.0
25.0
30.0
35.0
40.0
025
050
075
010
0012
5015
0017
5020
0022
5025
0027
5030
0032
5035
0037
5040
0042
5045
0047
50T
ime
(sec
)
Pre
ssur
e (p
si)
Pre
ss A
Pre
ss B
Pre
ss C
Pre
ss D
Pre
ss E
Pre
ss F
Pre
ss G
Pre
ss H
Gas
= 1
000
Liq
. =
20
Gas
= 5
000
Liq
. =
40
Gas
= 5
000
Liq
. =
60
Gas
= 5
000
Liq
. =
80
Gas
= 4
000
Liq
. =
80
Gas
= 3
000
Liq
. =
80
Gas
= 4
000
Liq
. =
20
Gas
= 5
000
Liq
. =
20
Gas
= 3
000
Liq
. =
20
Gas
= 2
000
Liq
. =
20
Gas
Flo
w R
ate
in [S
cc/m
in]
Liq
uid
Flo
w R
ate
in [m
l/min
]
Fig.
4.1
6. P
ress
ure
resp
onse
as a
func
tion
of ti
me
with
a st
epw
ise
chan
ge in
gas
and
liqu
id in
ject
ion
rate
s (C
ase
8):
(0.5
inch
NPS
stai
nles
sste
elpi
pe,1
wt%
surf
acta
ntco
ncen
trat
ion
usin
gSt
epan
form
1050
,50
µmfil
ter
open
ing
size
)
49
20.3825.8930.8529.19
8.91
1.53
2.39
3.94
8.53
11.47
19.32
16.74
15.35
20.68
25.64
14.3515.19
7.237.939.085.14 3.77 3.19 2.84
0.00
0.20
0.40
0.60
0.80
1.00
1.20
1.40
0.000 0.005 0.010 0.015 0.020 0.025
Ug (m/sec)
Uw (m/sec)
Case 8 - Pressure Drop Summary
fg* = 98.7 %
Fig. 4.17. Steady-state pressure drops, in psi, as a function of superficial gas and liquid injection velocities (Case 8): (0.5 inch NPS stainless steel pipe, 1 wt% surfactant concentration using Stepanform 1050, 50 µm filter opening size)
Figs. 4.18 and 4.19 show the results of Case 9 which uses 1 wt% of Aquet TD-600. The
pressure responses fluctuate significantly for the entire range of gas and liquid injection
velocities and, as a result, the high-quality regime is extended compared with the base case (cf.
Fig. 4.4). As a result, the fg* value is lowered from 99% to around 96%, which is significant
change taking into consideration the very narrow range of foam qualities (86% to 99.6%)
analyzed in this study.
The high-quality regime shows shear-thickening behavior to the liquid injection velocity
with the power-law exponent about 1.3 to 1.5. Although the low-quality regime also seems to
exhibit shear-thickening behavior to the gas injection velocity, there is a lack of data for further
interpretation.
50
Cas
e 9
- Pre
ssu
re P
rofi
le M
easu
rem
ent
0.0
0.5
1.0
1.5
2.0
2.5
3.0
3.5
4.0
4.5
5.0
025
050
075
010
0012
5015
0017
5020
0022
5025
0027
5030
0032
5035
0037
5040
0042
5045
00T
ime
(sec
)
Pre
ssu
re (p
si)
Pre
ss A
Pre
ss B
Pre
ss C
Pre
ss D
Pre
ss E
Pre
ss F
Pre
ss G
Pre
ss H
Gas
= 1
000
Liq
. =
20
Gas
= 5
000
Liq.
= 6
0
Gas
= 5
000
Liq.
= 8
0
Gas
= 4
000
Liq.
= 8
0
Gas
= 3
000
Liq.
= 8
0
Gas
= 5
000
Liq.
= 4
0
Gas
= 5
000
Liq
. =
20G
as =
400
0 Li
q. =
20
Gas
= 3
000
Liq
. =
20
Gas
= 2
000
Liq.
= 2
0
Gas
Flo
w R
ate
in [S
cc/m
in]
Liq
uid
Flo
w R
ate
in [m
l/min
]
Fig.
4.1
8. P
ress
ure
resp
onse
as a
func
tion
of ti
me
with
a st
epw
ise
chan
ge in
gas
and
liqu
id in
ject
ion
rate
s (C
ase
9):
(0.5
inch
NPS
stai
nles
s ste
el p
ipe,
1 w
t% su
rfac
tant
con
cent
ratio
n us
ing
Aqu
et T
D-6
00, 5
0 µm
filte
r op
enin
g si
ze)
51
4.05
2.39
1.541.080.620.12
0.2
0.27
0.56
1.53
1.33
0.82
2.76
2.28
1.49
4.351.91
5.764.343.79
4.42 2.95 2.45 2.23
0.00
0.20
0.40
0.60
0.80
1.00
1.20
1.40
0.000 0.005 0.010 0.015 0.020 0.025
Ug (m/sec)
Uw (m/sec)
Case 9 - Pressure Drop Summary
fg* = 96 %
Fig. 4.19. Steady-state pressure drops, in psi, as a function of superficial gas and liquid injection velocities (Case 9): (0.5 inch NPS stainless steel pipe, 1 wt% surfactant concentration using Aquet TD-600, 50 µm filter opening size)
The experimental results with 1 wt% of Ultra Palmolive are shown in Figs. 4.20 and 4.21
(Case 10). Although the use of Ultra Palmolive is for household purposes instead of use in the
petroleum industry, the presence of two flow regimes observed in the previous experiments can
also be found consistently. The value of fg* is about 97.5%. Foam rheology to the liquid
injection velocity in the high-quality regime is shear-thickening with the power-law exponent of
about 1.7, but the foam in the low-quality regime does not display any consistency, showing both
shear thinning and shear thickening. The results from Fig. 4.14 through Fig. 4.21 show that the
use of stronger foamer makes bubbles more stable during the flow and thus results in the
expansion of low-quality regime and increase in fg*. This agrees well with what was conjectured
in the earlier section to investigate the effect of surfactant concentration.
52
Cas
e 10
- P
ress
ure
Pro
file
Mea
sure
men
t
0.0
2.0
4.0
6.0
8.0
10.0
12.0
14.0
16.0
025
050
075
010
0012
5015
0017
5020
0022
5025
0027
5030
0032
5035
0037
5040
0042
5045
0047
5050
00T
ime
(sec
)
Pre
ssur
e (p
si)
Pre
ss A
Pre
ss B
Pre
ss C
Pre
ss D
Pre
ss E
Pre
ss F
Pre
ss G
Pre
ss H
Gas
= 1
000
Liq.
= 2
0
Gas
= 5
000
Liq.
= 4
0
Gas
= 5
000
Liq.
= 6
0
Gas
= 5
000
Liq.
= 8
0
Gas
= 4
000
Liq.
= 8
0
Gas
= 3
000
Liq.
= 8
0
Gas
= 4
000
Liq.
= 2
0
Gas
= 5
000
Liq.
= 2
0
Gas
= 3
000
Liq.
= 2
0
Gas
= 2
000
Liq.
= 2
0
Gas
Flo
w R
ate
in [S
cc/m
in]
Liq
uid
Flo
w R
ate
in [m
l/min
]
Fig.
4.2
0. P
ress
ure
resp
onse
as
a fu
nctio
n of
tim
e w
ith a
ste
pwis
e ch
ange
in g
as a
nd li
quid
inje
ctio
n ra
tes
(Cas
e 10
):
(0.5
inch
NPS
stai
nles
s ste
el p
ipe,
1 w
t% su
rfac
tant
con
cent
ratio
n us
ing
Ultr
a Pa
lmol
ive,
50
µm fi
lter
open
ing
size
)
53
12.98
10.42
7.72
3.771.72
0.34
0.48
0.60
1.21
2.19
3.40
2.43
9.32
9.79
5.03
11.706.44
6.215.505.36
4.96 5.13 3.18 1.88
0.00
0.20
0.40
0.60
0.80
1.00
1.20
1.40
0.000 0.005 0.010 0.015 0.020 0.025
Ug (m/sec)
Uw (m/sec)
Case 10 - Pressure Drop Summary
fg* = 97.5%
Fig. 4.21. Steady-state pressure drops, in psi, as a function of superficial gas and liquid injection velocities (Case 10): (0.5 inch NPS stainless steel pipe, 1 wt% surfactant concentration using Ultra Palmolive, 50 µm filter opening size)
4.6. Effect of Pipe Diameter (Cases 11 and 12)
Additional experiments were conducted to investigate the effect of flow conduit size by
repeating Case 1 (base case) and Case 2 in 1 inch NPS (Nominal Pipe Size) pipe rather than 0.5
inch pipe. The pressure data from ports B through G are used for the interpretation of steady-
state foam rheology because of the inlet and outlet effects.
Figs. 4.22 through 4.24 show the result of Case 11 in which nitrogen and 1 wt% Cedepal
FA-406 surfactant solution flow into the 1 inch stainless steel pipe.
The presence of two regimes is shown to be obvious, again the high-quality regime
characterized by the unstable and fluctuating pressure response and the low-quality regime
characterized by the stabilized pressure response and by homogeneous fine-texture foam.
Fig. 4.22. Pressure response as a function of time (Case 11): (1 inch NPS stainless steel pipe, 1 wt% surfactant concentration using Cedepal FA -406, 50 µm filter opening size)
Fig. 4.24. Steady-state pressure drops, in psi, as a function of superficial gas and liquid injection velocities (Case 11): (1 inch NPS stainless steel pipe, 1 wt% surfactant concentration using Cedepal FA-406, 50 µm filter opening size)
Fig. 4.25. Pressure response as a function of time (Case 12): (1 inch NPS stainless steel pipe, 5 wt% surfactant concentration using Cedepal FA -406, 50 µm filter opening size)
Fig. 4.27. Steady-state pressure drops, in psi, as a function of superficial gas and liquid injection velocities (Case 12): (1 inch NPS stainless steel pipe, 5 wt% surfactant concentration using Cedepal FA-406, 50 µm filter opening size)
4.7. Flow Experiments at Fixed Foam Quality (Cases 13 and 14)
Additional experiments were designed in Case 13 and 14 to investigate (1) the impact of
the upstream foam generator and (2) the reproducibility or precision of the system. The former is
important to understand the role of foam generator in the experiments, because fined-textured
foams can be pre-generated in the upstream tubing (1/8 inch ID) and connections prior to
flowing into the pipe. These experiments were conducted at fixed foam quality (98.4%) by
changing total injection velocity (ut). For simplicity, foam qualities and gas injection velocities in
Case 13 and 14 are reported at atmospheric pressure, rather than being adjusted by the average
system pressure. Table 4.1 lists gas and liquid flow rates used in Case 13, and the corresponding
change in pressure response is shown in Fig. 4.28. The experiments start at the flow rates shown
58
by test number “0” in which fine-textured foams are generated flowing gas and liquid mixture
through 50 µm opening size filter. Then, by changing the direction of a three-way valve, the flow
is diverted into different directions such that the flow bypasses the filter at the same gas and
liquid flow rates as shown by “1” in Table 4.1 and Fig. 28. In subsequent experiments, the total
flow rate is reduced step by step, shown by “2” through “9”, and increased back up following the
same total flow rates, shown by “8’” through “2’”, still bypassing the filter upstream.
Table 4.1 Flow rates used for Case 13 (cf. Fig. 4.28) at fixed foam quality of 98.4%
Fig. 4.28 shows the overall pressure response, which indicates that (1) bypassing the
upstream filter reduces the steady-state pressure drop somewhat but the magnitude is not very
significant (cf. “0” vs. “1”) and (2) the steady-state pressure drops measured in “2” through “8”
are consistent with those measured in “2’” through “8’”, demonstrating a good reproducibility
and precision. Fig. 4.28 also shows that the pressure responses are stable in all flow rates tested.
This was expected because the foam quality of 98.4% tested lies in the low-quality regime (cf.
fg* = 99% in Fig. 4.4). Table 4.2 and Fig. 4.29 show the flow rates and the corresponding
pressure response (Case 14a), which basically repeats Case 13 except that the entire experiments
are conducted in the absence of the upstream foam generator. The results are comparable with
59
Case 13 indicating that the use of a foam generator does not substantially affect the results of
subsequent experiments.
Table 4.2 Flow rates used for Case 14a (cf. Fig. 4.29) at fixed foam quality of 98.4%
Table 4.3 and Fig. 4.30 show the flow rates and pressure responses (Case 14b), by
repeating the same experiments in Case 14a using 0.5 wt% concentration of Cedepal FA-406
surfactant. In contrast to Case 14a, the experiments increase the flow rate from the lowest to the
highest (i.e., “1” to “10”), followed by a stepwise reduction back to the lowest flow rate (i.e.,
“9’” to “1’”). Again the steady-state pressure drops are consistent irrespective of the direction of
flow rate change.
Table 4.3 Flow rates used for Case 14b (cf. Fig. 4.30) at fixed foam quality of 98.4%
60
Cas
e 13
- P
ress
ure
Pro
file
Mea
sure
men
t
0.0
5.0
10.0
15.0
20.0
25.0
30.0
35.0
40.0
025
050
075
010
0012
5015
0017
5020
0022
5025
0027
5030
0032
5035
0037
5040
0042
5045
0047
5050
0052
5055
0057
5060
0062
5065
0067
5070
0072
5075
00
Tim
e (s
ec)
Pre
ssu
re (p
si)
Pre
ss A
Pre
ss B
Pre
ss C
Pre
ss D
Pre
ss E
Pre
ss F
Pre
ss G
Pre
ss H
0
6
5
4
3
1
7
8'8
3'
4'
5'
6'
2'
7'
9
2
Fig.
4.2
8. P
ress
ure
resp
onse
as
a fu
nctio
n of
tim
e w
ith a
ste
pwis
e ch
ange
in g
as a
nd li
quid
inje
ctio
n ra
tes
(Cas
e 13
):
(0.5
inch
NPS
stai
nles
s ste
el p
ipe,
1 w
t% su
rfac
tant
con
cent
ratio
n us
ing
Ced
epal
FA
-406
, 50
µm fi
lter
open
ing
size
)
61
Pre
ssu
re P
rofi
le M
easu
rem
ent
0.0
5.0
10.0
15.0
20.0
25.0
30.0
35.0
0
250
500
750
1000
1250
1500
1750
2000
2250
2500
2750
3000
3250
3500
3750
4000
4250
4500
4750
Tim
e (s
ec)
Pre
ssu
re (p
si)
Pre
ss A
Pre
ss B
Pre
ss C
Pre
ss D
Pre
ss E
Pre
ss F
Pre
ss G
Pre
ss H
2'
3'
4'
5'
6'
7'
8
7
6
5
4
3
21
Fig.
4.2
9. P
ress
ure
resp
onse
as a
func
tion
of ti
me
with
a st
epw
ise
chan
ge in
gas
and
liqu
id in
ject
ion
rate
s (C
ase
14a)
: (0
.5 in
ch N
PS st
ainl
ess s
teel
pip
e, 1
wt%
surf
acta
nt c
once
ntra
tion
usin
g C
edep
al F
A-4
06, 5
0 µm
filte
r op
enin
g si
ze)
62
Pre
ssu
re P
rofi
le M
easu
rem
ent
0.0
5.0
10.0
15.0
20.0
25.0
30.0
35.0
050
010
0015
0020
0025
0030
0035
0040
0045
0050
0055
0060
0065
0070
0075
0080
0085
00T
ime
(sec
)
Pre
ssu
re (p
si)
Pre
ss A
Pre
ss B
Pre
ss C
Pre
ss D
Pre
ss E
Pre
ss F
Pre
ss G
Pre
ss H
2'
3'
4'
5'
6'
7'
8
7
6
5
4
3
2
1
9
10
8'
9'
1'
Fig.
4.3
0. P
ress
ure
resp
onse
as
a fu
nctio
n of
tim
e w
ith a
ste
pwis
e ch
ange
in g
as a
nd li
quid
inje
ctio
n ra
tes
(Cas
e 14
b):
(0.5
inch
NPS
stai
nles
s ste
el p
ipe,
0.5
wt%
surf
acta
nt c
once
ntra
tion
usin
g C
edep
al F
A-4
06, 5
0 µm
filte
r op
enin
g si
ze)
63
4.8. Discussions
The experiments conducted in this study consistently show the presence of two flow
regimes as shown in Fig. 4.31 schematically: a high-quality regime in which the pressure
response is oscillating and a low-quality regime in which the pressure response is stabilized. This
is because the two regimes are governed by different mechanisms.
Fig. 4.31. Schematic representation of two flow regimes and pressure contours
The flow in the high-quality regime, as observed at the outlet of the pipe, is alternating
slugs of gas and foam, as shown by the photos in Fig. 4.32. This recurring behavior is due to the
fact that creating a continuous flow of fine-textured foam is not easy at high fg (i.e., dry
condition), implying that the unstable flow pattern in this regime is characterized by active
bubble generation and coalescence mechanisms. The term, “steady-state” pressure drop, used in
0
1
0 1
u g
uw
Low-QualityRegime
High-Quality Regime
fg*
ΔP = const.
64
this study may not be appropriate for foam in the high-quality regime because it does not seem to
reach a steady state as shown in most of experiments.
Fig. 4.32. Sequence of photos taken from the 0.5 inch pipe outlet showing repetition of free gas and foam slug within high-quality regime at foam quality above 99%.
The stable flow pattern that characterizes low-quality regime indicates that the flow
rheology is governed by the movement of uniform and homogeneous fine-textured foam already
present in the system, which is supported by the observation at the pipe outlet, shown in Fig.
4.33. The continuous flow of fine-textured foam in the low-quality regime implies that (1) the
mechanisms of bubble creation and coalescence is less important for foams in the low-quality
1 2
12 11 10 9 8
7 6 5 4 3
14 13
65
regime because the steady-state fine foam texture is already obtained and maintained in the
system, and (2) the interactions between bubbles and/or the interactions between bubbles and
pipe surface under shear stress play a crucial role in overall flow behavior of foam in pipes.
Fig. 4.34 shows the photos taken at the upstream visual cell.
Fig. 4.33. Sequence of homogeneous foam flow within low-quality regime at 0.5 inch pipe outlet at foam quality below 99%.
Fig. 4.34. Photos taken in the upstream visual cell: left with stable foam in the lower quality and right with unstable foam in the higher foam qualities.
66
The presence of two flow regimes during foam flow in pipes observed in this study is
reminiscent of two steady-state strong-foam regimes during foam flow in porous media [Osterloh
and Jante, 1992; Alvarez et al., 2001; Kam et al., 2007a]. Although a direct comparison cannot
be made, the flow in pipes and the flow in porous media share a common ground in that the
stability of foam films in dynamic motion is the key to the two flow regimes.
Another important aspect that should be noticed is the pattern of the pressure contours.
As shown by the dotted lines in Fig. 4.31, the pressure contours are relatively steep in the high-
quality regime and relatively gentle in the low-quality regime. This implies that in the high-
quality regime, the additional amount of liquid supplied during the flow is used to create more
stable bubbles contributing to more active interactions between bubbles and thus higher pressure
gradients. In the low-quality regime, however the additional liquid is used to create thicker water
films between bubbles or between bubbles and pipe surface, leading to the lower pressure
gradients. This behavior in the low-quality regime seems similar to the lubricating effect reported
by Briceño and Joseph, [2003]. Foams in the high-quality regime exhibit shear thickening
behavior to the liquid injection velocity in all experiments throughout this study, whereas foams
in the low-quality regime were shear thickening to the gas injection velocity in most of
experiments in 0.5 inch NPS pipe and nearly Newtonian (or very slightly shear thinning) in 1
inch NPS pipe.
The boundary between the two regimes can be represented by a threshold value fg called
fg* as shown in Fig. 4.35. The experiments in this study demonstrate that the fg* shifts depending
on experimental conditions. The value of fg* increases as surfactant concentration increases
and/or as the foamability of the surfactant increases. This observation also indicates that the
high-quality regime is primarily governed by an unstable behavior, so any change that causes
foams less stable is likely to expand the high-quality regime and contract the low-quality regime.
67
0
1
0 1
ug
uw
fg = 100 %
fg = 0 %
Low-Quality Regime
High-Quality Regime fg*
Fig. 4.35. Schematic representation of constant-total-injection-velocity experiment at
varying foam quality (fg)
The effect of the critical micelle concentration (CMC), above which interfacial tension
does not change significantly with surfactant concentration, may play a role here such that the fg*
does not increase beyond a certain surfactant concentration.
Fig. 4.35 can be used to consider the effect of varying foam quality while keeping the
total injection velocity (ut) constant. Note that the constant-ut experiment with increasing foam
quality corresponds to moving along the broken straight line from fg = 0% to fg = 100% in Fig.
4.35. If the pressure contours in Fig. 4.31 are superimposed on Fig. 4.35, the pressure drop is
expected to increase monotonically with increasing fg until the pressure drop reaches its
maximum value, and then the pressure drop decreases monotonically with increasing fg. The
maximum value in the pressure drop occurs at the boundary between the two flow regimes, or
fg*. Similar behavior can be found if one follows a vertical straight line (i.e., varying gas
68
injection velocity at fixed liquid injection velocity) or a horizontal straight line (i.e., varying
liquid injection velocity at fixed gas injection velocity) in Fig. 4.35 in which the maximum
pressure drop occurs near fg*.
4.9. Implication of Two Flow Regimes in Field Applications
The two flow regimes demonstrated by the experiments in this study are believed to be
crucial to the design and optimization of many foam applications because the flow rheology is
very different depending on which regime the conditions fall. Changes in volume fraction of
each phase, surfactant concentration, and/or surfactant performance may force the situation to cut
across the boundary between the two regimes.
Fig. 4.36 can be used to investigate the significance of the two flow regimes, which show
a few important features: (1) an application that undergoes a change in pressure and/or
temperature may experience expansion or shrinkage of gas volume, which moves across the
boundary between the two flow regimes (i.e., vertical dashed line in Fig. 4.36); (2) the loss or
gain of liquid phase in the system may also go across the boundary (i.e., horizontal dashed line in
Fig. 4.36); and (3) even though the injection velocities remain the same, any process that
degrades surfactant molecules (i.e., deteriorating foamability of surfactant caused by, for
example, high temperature or intrusion of foam-destabilizing oils) may shift the fg* value
substantially and cause the boundary to move across the existing operating conditions (i.e.,
diagonal dashed lines in Fig. 4.36). One example that has all these complexities is foam-assisted
underbalanced drilling which can experience significant changes in pressure and temperature,
influx of gas and/or liquid, dilution of surfactant solutions, degradation of foamability, change in
flow conduit geometry, introduction of solid particles and so on. The knowledge gained about
the two different foam flow regimes observed in this study is expected to greatly improve our
understanding of these field applications.
69
0
1
0 1
ug
uw
Low-Quality Regime
High-Quality Regime
fg*
Fig. 4.36. Implication of the change in gas fraction (vertical dotted line), in liquid fraction (horizontal dotted line), or in fg*.
70
5. CONCLUSIONS AND RECOMMENDATIONS
This experimental study investigates the rheological behavior of foams in horizontal
pipes over a broad range of experimental conditions. These include two different pipe sizes (0.5
and 1 inch NPS stainless steel pipes), five different surfactant formulations (Cedepal FA-406,
Petrostep CG-50, Stepanform 1050, Aquet TD-600, and Ultra Palmolive), three different
surfactant concentrations (0.1 wt%, 1 wt%, and 5 wt%), and two different opening sizes of foam
generating filters (50 μm and 90 μm). In all experiments, nitrogen gas and surfactant solutions
were co-injected at pre-specified injection rates. Foam rheology in pipes was analyzed by
looking into the pressure data measured from 8 different pressure ports (ports A through H)
which were installed along the longitudinal pipe length. The following sections summarize more
than 500 hundred experiments conducted in this study with conclusions and recommendations.
5.1. Conclusions
This experimental study can be summarized with the following conclusions:
1. The experimental results consistently showed two different flow regimes during foam flow in
horizontal pipes: a high-quality regime and a low-quality regime. The high-quality foam flow
regime was characterized by alternating flow of free gas and foam slugs causing an oscillating
pressure response, while the low-quality regime was characterized by a flow of uniform and
homogeneous foams showing stable pressure response. These two regimes were separated by
a threshold value of foam quality (fg) called fg*.
2. The pressure contours plotted as a function of superficial gas and liquid injection velocities
(ug and uw) in this study provided a convenient means of interpreting the regimes. The
pressure contours, connecting the data points showing the same steady-state pressure drops,
had a steep slope in the high-quality regime but a gentle (or negligible in some cases) slope in
the low-quality regime. This suggests that these two flow regimes are controlled by different
71
governing mechanisms: the high-quality regime presumably by active competition between
dynamic bubble creation and coalescence mechanisms struggling to obtain uniform and stable
foam; and the low-quality regime by interactions between individual bubbles and/or bubbles
and pipe surface under shear flow with foams already in a homogeneous and fine-textured
state. This concept explains different sensitivity of the pressure drop to liquid injection
velocity quite well: any increment of liquid injection velocity in the high-quality regime tends
to increase the pressure drop by making bubble generation more active and foams more stable.
Any positive increment of liquid injection velocity in the low-quality regime tends to reduce
the pressure drop presumably by thickening water films and thus lowering the friction
between bubbles and/or bubbles and pipe surface.
3. In all experiments, foams in the high-quality regime exhibited shear-thickening behavior to
liquid injection velocity with the power-law exponents ranging from 1.4 to 3.2 (many around
1.4-1.7). Foams in the low-quality regime, however, exhibited shear-thickening behavior to
the gas injection velocity with the power-law exponents around 1.4-1.7 in 0.5 inch NPS pipe
but near-Newtonian (or slightly shear thinning) behavior in 1 inch NPS pipes. The
experimental results also showed that the pressure drop decreased as gas injection velocity
increased at fixed liquid injection velocity in the high-quality regime. The pressure drop in the
low-quality regime, however, decreased slightly or was unchanged as liquid injection velocity
increased at fixed gas injection velocity.
4. The value of fg* that divides two flow regimes seems crucial to the optimum design of foam
field applications. The experimental results showed that the fg* could be affected by many
factors including surfactant formulations and concentrations such that the high-quality regime
stretched as the surfactant concentration decreased and/or as the foamability decreased. The
results in this study further imply that any changes which influence the performance of
72
surfactant as a foamer are likely to change the value of fg*, which, for example, could be
caused by surfactant degradation, dilution of surfactant solutions, and intrusion of oil-
destabilizing phases such as oils.
5. The use of two different filter opening sizes, 50µm and 90µm, did not result in meaningful
changes in foam rheology in pipes. This implies that the fine-textured foam created by these
foam generators was re-adjusted quickly so that the foam could reach its steady-state foam
texture in the pipe. The steady-state foam texture and pressure response in pipes, however,
might be impacted by the layout in the upstream of the pipe such as tubing length, tubing size,
and the number of connections.
5.2. Recommendations
Based on the outcome of this study, the following can be recommended as future
research topics:
1. A research challenge lies in the up-scaling of the experimental results observed in this study.
The results from 0.5 inch and 1 inch pipes may not be appropriate to represent foam rheology
in pipes with larger pipe diameters. The experiments in larger diameters will require much
longer pipes in order for foam flow to reach a steady-state.
2. A small-scale experimental study should be developed in order to further investigate (1) the
dynamic mechanisms of bubble creation and coalescence and (2) the bubble-to-bubble or
bubble-to-pipe-wall interactions. This will help characterize foam rheology in the high-quality
and low-quality regimes, respectively.
3. It is not certain how the experimental observations made in this study can be translated into
the situations where foam flows with upward or downward inclination angles. Together with
different flow geometry, the presence of solids and/or a third phase such as oils should be
accounted for to extend this study to foam applications in drilling, fracturing, cementing, and
73
well completion treatments in petroleum industry.
4. For the applications such as deepwater underbalanced drilling in which the surfactant solution
can be diluted by the influx of foreign fluids and/or the temperature may change significantly,
the effect of degrading surfactant should be investigated separately to optimize the process.
74
REFERENCES
1. Alvarez, J. M., Rivas, H. and Rossen, W.R.: “A Unified Model for Steady-State Foam Behavior at High and Low Foam Qualities”, SPE Journal 6, p.325-333, September, 2001.
2. Aronson, A.S., Bergeron, V., Fagan, M.E. and Radke, C.J.: “The Influence of Disjoining Pressure on Foam Stability and Foam in Porous Media”, Colloids and Surfaces A: Physicochemical and Engineering Aspects, 83, p. 109-120, 1994.
3. Becher, P.: “Emulsions: Theory and Practice”, Reinhold Pub. & Co., N.Y., 1965.
4. Bejuijen, A., Schminee, P.E.L. and Kleinjan, J.A.: “Additive Testing for Earth Pressure Balance Shields”, Proceedings of the 12th European Conference on Soil Mechanics and Geotechnical Engineering, Amsterdam, June 7 – 10, 1999.
5. Beyer, A.H., Millhone, R.S. and Foote, R.W.: “Flow behavior of Foam as a Well Circulating Fluid”, SPE 3986 presented at 47th Annual Fall Meeting held in San Antonio, Texas, October 8-11, 1972.
7. Bird, R.B. and Stewart, W.E. and Lightfoot, E.N.: “Transport Phenomena”, John Wiley and Sons, Inc, NYC, 1960.
8. Blauer, R.E., Mitchell, B.J. and Kohlhaas, C.A.: “Determination of Laminar, Turbulent, and Transitional Foam Flow Losses in Pipes”, SPE 4885 presented at the 44th Annual California Regional Meeting of the Society of Petroleum Engineers of AIME, San Francisco, California, April 4-5, 1974.
9. Blauer, R.E. and Kohlhaas, C.A.: “Formation Fracturing with Foam”, SPE 5003 presented at 44th Annual Fall Meeting of the Society of Petroleum Engineers of AIME held in Houston, Texas, October 6-9, 1974.
10. Bonilla, L.F. and Shah, S.N.: “Experimental Investigation on the Rheology of Foams”, SPE 59752 presented at the SPE/CERI Gas Technology Symposium held in Calgary, Alberta Canada, April 3-5, 2000.
12. Briceño, M.I. and Joseph, D.D.: “Self-Lubricated Transportation of Aqueous Foams in Horizontal Conduits”, International Journal of Multiphase Flow, 29, p. 1817-1831, May 2003.
75
13. Brookbank, M.R. and Fagiano, P.M.J.: “A Review of the Theory and Practice of Two-Phase Flow in Gas-Liquid Transmission Systems”, SPE 5264 presented at the SPE-European Spring Meeting held in London, Great Britain, April 14-15, 1975.
14. Calvert, J.R. and Nezhati, K.: “A Rheological Model for a Liquid–Gas Foam”, International Journal of Heat and Fluid Flow, 7, p. 164-168, 1986.
15. David, A. and Marsden, S.S.: “The Rheology of Foam”, SPE 2544 presented at the 44th
Annual Meeting of the SPE, Denver, CO, September 28, 1969.
16. Dholkawala, Z.F., Sarma, H.K. and Kam, S.I.: “Application of Fractional Flow Theory to Foams in Porous Media”, Journal of Petroleum Science and Engineering, Vol. 57, p. 138-160, May, 2007.
17. Einstein, A.: “Eine Neue Bestimmung Der Molekul-dimensionen”, Annalen Der Physik, Vol. 19, Ser. 4, p.289, 1906.
18. Gardiner, B.S., Dlugogorski, B.Z. and Jameson, G.J.: “Prediction of Pressure Losses in Pipe Flow of Aqueous Foams”, Industrial and Engineering Chemistry Research, 38, p. 1099-1106, May 1999.
19. Gaulitz, P.A., Friedmann, F., Kam, S.I. and Rossen, W.R.: “Foam Generation in Homogenous Porous Media”, SPE 75177 presented at SPE/DOE 13th Symposium on Improved Oil Recovery, Tulsa, Oklahoma, April 13-17, 2002; also published as "Foam Generation in Homogeneous Porous Media," Chemical Engineering and Science, Vol. 57, p. 4037-4052, October, 2002.
20. Guzman, N., Shoham, O. and Mohan R.: “Rheology of Aqueous Two-Phase Foam Flow in Horizontal Pipes”, Journal of Energy Resources Technology, 2005.
21. Guzman, N.: “Foam Flow in Gas-Liquid Cylindrical Cyclone (GLCC) Compact Separator”, PhD Dissertation, The University of Tulsa, Oklahoma, 2005.
22. Harris, P.C. and Reidenbach, V.G.: “High-Temperature Rheological Study of Foam Fracturing Fluids”, SPE 13177 presented at SPE Annual Technical Conference held in Houston, September 16-19, 1984.
23. Harris, P.C.: “Effects of Texture on Rheology of Foam Fracturing Fluids”, SPE 14257 presented at SPE Annual Technical Conference held in Las Vegas, September 22-25, 1985.
24. Harris, P.C., Klebenow, D.E. and Kundert, P.D.: “Constant-internal-phase Design Improves Simulation Results”, SPE Production Engineering, 6 (1), 1991.
76
25. Harris, P.C. and Heath, S.J.: “Rheology of Crosslinked Foams”, SPE 28512 presented at SPE Annual Technical Conference held in New Orleans, September 25-28, 1994.
26. Harris, P.C. and Heath, S.J.: “High-Quality Foam Fracturing Fluids”, SPE 35600 presented at the SPE Gas Technology Symposium held in Calgary, Alberta, Canada, April 28 – May 1, 1996.
27. Hatschek, E.: “Die Viscositat Der Dispersoide II. Die Emulsionen Uns Emulsoide”, Kolloid Z, Vol. 8. p. 34, 1910.
28. Hutchins, R.D. and Miller, M.J.: “A Circulating Foam Loop for Evaluating Foam at Conditions of Use”, SPE 80242 presented at the SPE International Symposium on Oilfield Chemistry held in Houston, Texas, U.S.A., February 5-7, 2003.
29. Irani, C.A. and Solomon Jr. C.: “Slim-Tube Investigation of CO2 Foams”, SPE 14962 presented at the SPE/DOE Fifth Symposium on Enhanced Oil Recovery of the Society of Petroleum Engineers and the Department of Energy held in Tulsa, Oklahoma, April 20-23, 1988.
30. Kam, S. I. and Rossen, W.R.: “The Compressibility of Foamy Sands”, Colloids and Surfaces A: Physicochemical and Engineering Aspects, 202, p. 63-70 , 2002.
31. Kam, S. I., Gauglitz, P.A. and Rossen, W.R.: “The Yield Stress of Foamy Sands”, Colloids and Surfaces A: Physicochemical and Engineering Aspects, 202 (1), p. 53-62, 2002.
32. Kam, S.I. and Rossen, W.R.: “A Model for Foam Generation in Homogeneous Porous Media”, SPE Journal, 8, p. 417-425, December, 2003.
33. Kam, S.I., Frenier, W.W., Davies, S.N. and Rossen, W.R.: “Experimental Study of High-Temperature Foam for Acid Diversion”, Journal of Petroleum Science and Engineering, Vol. 58, p. 138–160, August 2007a.
34. Kam, S.I., Nguyen, Q.P., Li, Q. and Rossen, W.R.: “Dynamic Simulation with an Improved Model for Foam Generation”, SPE Journal, p. 35–48, March, 2007b.
35. Khatib, Z.I., Hirasaki, G.J. and Falls, A.H.: “Effect of Capillary Pressure on Coalescence and Phase Mobilities in Foams Flowing Through Porous Media”, SPE Reservoir Engineering, p. 919-926, August, 1988.
36. Kibodeaux, K.R.: “Experimental and Theoretical Studies of Foam Mechanisms in Enhanced Oil Recovery and Matrix Acidization Applications”, Ph.D. Dissertation, The University of Texas at Austin, 1997.
77
37. Kim, J. S., Dong, Y. and Rossen, W. R.: “Steady-State Flow Behavior of CO2 Foam”, SPE Journal, 10, p. 405-415, December, 2005.
38. Kovscek, A. R. and Radke, C. J.: “Fundamentals of Foam Transport in Porous Media”, in: L. L. Schramm (ed.), Foams: Fundamentals and Applications in the Petroleum Industry, ACS Advances in Chemistry Series No. 242, Am. Chem. Soc., Washington DC, 1994.
39. Kraynik, A.M.: “Foam Flows”, Annual Revision of Fluid Mechanics, 20, p. 325 – 357, 1988.
40. Lourenço, A.M.F., Miska, S.Z., Reed, T.D., Pickell, M.B. and Takach, N.E.: “Study of the Effects of Pressure and Temperature on the Rheology of Drilling Foams and Frictional Pressure Losses”, SPE 84175 presented at the SPE Annual Technical Conference held in Denver, Colorado, October 5-8, 2003.
41. Mamun, C.K., Rong, J.G., Kam, S.I., Liljestrand, H.M. and Rossen, W.R.: “Simulating Use of Foam in Aquifer Remediation”, Proceedings of the 14th International Conference on Computational Methods in Water Resources (CMWR XIV), June 23-28, 2002, Delft, The Netherlands, S.M. Hassanizadeh, R.J. Schotting, W.G. Gray, G.F. Pinder, eds., Volume 1, p. 867-874.
42. Mitchell, B.J.: “Viscosity of Foam”, PhD Thesis, University of Tulsa, Oklahoma, 1969.
43. Mitchell, B.J.: “Test data Fill Theory gap on Using Foam as a Drilling Fluid”, Oil and Gas Journal, p. 96-100, September, 1971.
44. Mooney, M.: “Explicit Formulas for Slip and Fluidity”, Journal of Rheology, 1931.
45. Okpobiri, G.A. and Ikoku, C.U.: “Volumetric Requirements for Foam and Mist Drilling Operations”, SPE 11723 presented at the SPE California Regional Meeting in Ventura, March 23-25, 1983.
46. Osterloh, W.T. and Jante, M.J.: “Effects of Gas and Liquid Velocity on Steady-State Foam Flow at High Temperature”, SPE 24179 presented at SPE/DOE eight Symposium on Enhanced Oil Recovery held in Tulsa, Oklahoma, April 22-24, 1992.
47. Ozbayoglu, E.M. and Akin, S.: “Foam Characterization Using Image Processing Techniques”, SPE 93860 presented at SPE Western Regional Meeting held in Irvine, California, March 30 – April 1, 2005.
48. Princen, H.M.: “Rheology of Foams and Highly Concentrated Emulsions. I. Elastic Properties and Yield Stress of a Cylindrical Model System”, Journal of Colloid and Interface Science, 105. p. 150-171, 1983.
78
49. Prud’homme, R.H. and Bird, R.B.: “The Dilatational Properties of Suspensions of Gas Bubbles in incompressible Newtonian and Non-Newtonian Fluids”, Journal of Non-Newtonian Fluid Mechanics, 3: 261-279, 1978.
50. Prud’homme, R. H.: “Foam Flow”, Presented at Ann. Meeting Soc. Rheol., Louisiana, KY., October 12-15, 1981.
51. Prud'homme, R. H. and Khan, S.(eds.), “Foams: Theory, Measurements and Applications”, Marcel Dekker, New York, p. 413 – 464, 1996.
52. Raza, S.H. and Marsden, S.S.: “The Streaming Potential and the Rheology of Foam”, SPE Journal, Vol. 7, p. 4, 1967.
53. Rong, J.G.: “Experimental Evaluation of Foam in Environmental Remediation”, Department of Civil Engineering, PhD dissertation, The University of Texas at Austin, 2002.
54. Rossen, W. R.: “Foams in Enhanced Oil Recovery”, in: R. K. Prud'homme and Khan, S. (eds.), “Foams: Theory, Measurements and Applications”, Marcel Dekker, New York, 1996.
55. Rossen, W.R. and Wang, M.W.: “Modeling Foams for Acid Diversion”, SPE Journal, 4, p. 92-100, June, 1999.
56. Rossen, W.R.: “Application of Percolation Concepts to Foam Flow Through Porous Media”, Campus Theory presented at the Science at the Edge Seminar, May, 2003.
57. Saintpere, S., Herzhaft, B., Toure, A. and Jollet, S.: “Rheological Properties of Aqueous Foams for Underbalanced Drilling”, SPE 56633 presented at SPE Annual Technical Conference and Exibition held in Houston, Texas, October 3-6, 1999.
58. Schramm, L.: “FOAMS: Fundamentals and Applications in the Petroleum Industry”, Advances in Chemistry series 242, American Chemical Society, Washington, D.C., 1994.
59. Taitel, Y. and Dukler, A.E.: “A Model for Predicting Flow Regime Transition in Horizontal and Near-Horizontal Gas-Liquid Flow”, American Institute of Chemical Engineers 22, p. 47-55, 1976.
60. Tan, H.C.S. and McGowen, J.M.: “Friction Pressure Correlation for CO2 Foam Fluids”, SPE 21856 presented at the Rocky Mountain Regional Meeting and Low-Permeability Reservoir Symposium held in Denver, Colorado, April 15-17, 1991.
79
61. Valko, P., Economides, M.J., Baumgarthner, S.A. and McElfresh, P.M.: “The Rheological Properties of Carbon Dioxide and Nitrogen Foams”, SPE 23778 presented at the SPE International Symposium on Formation Damage Control held in Lafayette, Louisiana, February 25-27, 1992.
62. Wilson, A. J. D.: “Foams: Physics, Chemistry and Structure”, Springer-Verlag, New York, 1989.
80
APPENDIX A
EXPERIMENTAL DATA FOR CASES 1 THROUGH 12
81
82
83
84
85
86
87
88
89
90
91
92
93
APPENDIX B
DERIVATION OF REYNOLDS NUMBER AND POWER-LAW EXPONENT
Foam can be described by a power-law fluid, which is explained in Chapter 2.
, for power-law fluid .......………………………………………........ (B-1)
Eq. (B-1) is valid only for laminar flow [Bourgoyne et al., 2005], and the Reynolds number